the denny way sediment cap 2000 data final monitoring...
TRANSCRIPT
The Denny Way Sediment Cap 2000 Data
Final Monitoring Report
Prepared by the
King County Dept. of Natural Resources and Parks Marine and Sediment Assessment Group
201 South Jackson Street, Suite 600 Seattle, Washington 98104
April 2005
@ King County

In March 1990, contractors for the Seattle District US . Army Corps of Engineers (USACE) placed clean sand offshore of the Denny Way combined sewer overflow (CSO) outfall, successfully capping three acres of chemically-contaminated bottom sediment. The sediments were capped to minimize contaminant exposure to benthic organisms, fish, and, ultimately, humans as well as to collect monitoring data about cap performance. The Denny Way sediment cap was the result of several years of research by many agencies and a cooperative effort between the USACE and the Municipality of Metropolitan Seattle (Metro), which became part of King County in 1994.
The Denny Way sediment cap was the first demonstration project placed along the Seattle waterfront for the purpose of gaining monitoring information about sediment capping. The purpose of this report is to document the methods, results, and conclusions of the monitoring conducted in 2000, which was the last year of the ten-year monitoring program, as well as to provide a brief summary of results over the entire monitoring period. Additional background information may be found in previous monitoring reports; The Denny Way Sediment Cap 1990-1992 Data (Metro, 1995), The Denny Way Sediment Cap 1994 Data (King County, 1996), and The Denny Way Sediment Cap 1996 Monitoring Report (King County, 1999). This report, summarizing the 2000 data, will be the final cap monitoring report.
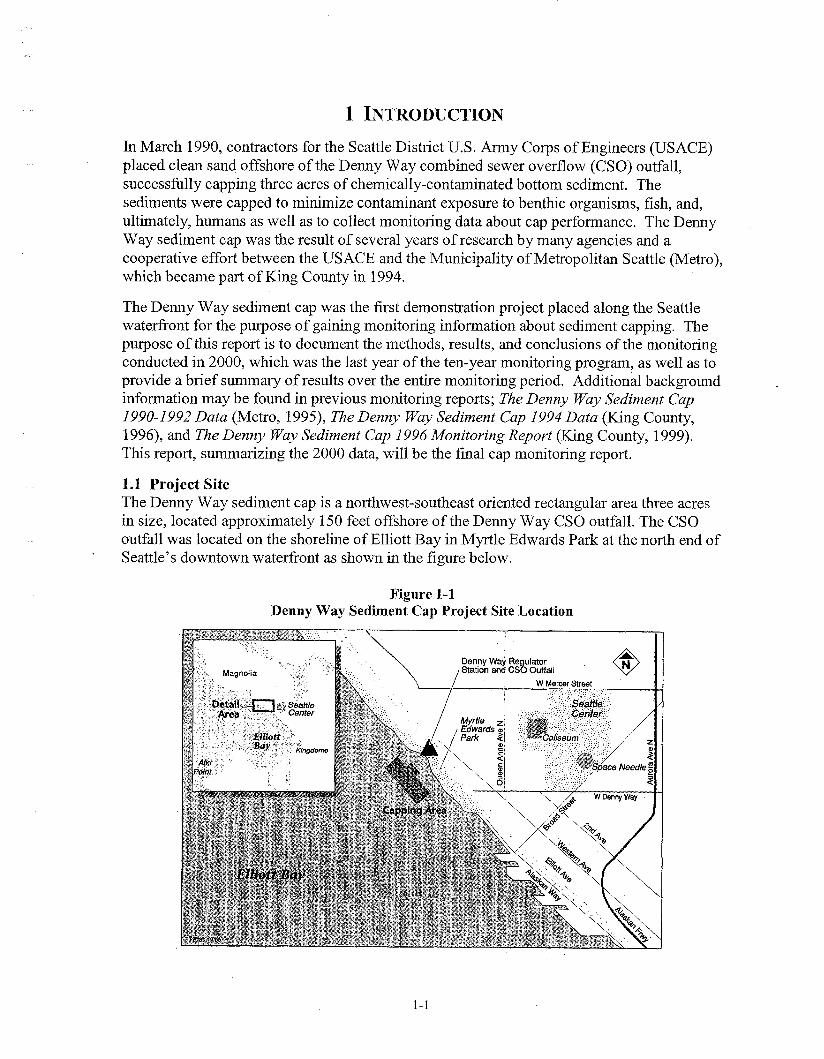
1.1 Project Site The Denny Way sediment cap is a northwest-southeast oriented rectangular area three acres in size, located approximately 150 feet offshore of the Denny Way CSO outfall. The CSO outfall was located on the shoreline of Elliott Bay in Myrtle Edwards Park at the north end of Seattle's downtown waterfront as shown in the figure below.
Figure 1-1 Denny Way Sediment Cap Project Site Location
The capped area lies in water depths between -20 and -60 feet, referenced to mean lower low water (MLLW). It is composed of two adjacent rectangular areas measuring 200 by 600 feet and 150 by 70 feet. The objective was to cover this 3-acre area with a uniform 3-foot thick blanket of clean sand. The USACE dredged clean sand from the upper Duwamish River during routine maintenance dredging activities and transported it to the Denny Way site. Thirteen barge loads, each carrying about 1,600 cubic yards of sand, were spread over the site. The total volume of sand used during the capping project was greater than 20,000 cubic yards.
1.2 Project Background Metro began planning the Denny Way sediment cap project after a 1987 study recommended capping sediments offshore of the Denny Way CSO outfall (Romberg, et al., 1987). The Denny Way site was chosen as an experimental demonstration cleanup project for three reasons.
It is located offshore of historically the largest-volume and most active CSO that discharges into Elliott Bay. During a year of above-average rainfall, it could overflow up to 60 times, producing a total average volume of 500 million gallons. Previous studies, including the Metro toxicant pretreatment planning study (Romberg et al., 1984; Comiskey et al., 1984), found contaminated sediments at the site. Construction activities to reduce the frequency and volume of the Denny Way CSO were not scheduled to be completed until after 2000, therefore an interim sediment improvement measure was considered appropriate.
In 1986, Metro began a trial program to identify and reduce toxicant inputs to the sewer system discharging through the Denny Way CSO. The Denny WayILake Union CSO Control Project was a joint effort of King County's Wastewater Treatment Division and Seattle Public Utilities to control City and County CSO discharges into Lake Union and from the Denny Way CSO into Elliott Bay. The project included construction of two outfalls into Elliott Bay: a 490-foot outfall at a depth of -60 feet MLLW that will discharge treated CSO effluent during moderately heavy storm events; and a 100-foot extension of the existing outfall to a depth of -20 feet MLLW that will discharge untreated CSO effluent to Elliott Bay during the once-per-year event when flows exceed system capacity. Additional project information may be found in the project environmental impact statement/environmental assessment document (King County, City of Seattle, and EPA 1998).
Construction of the new CSO outfalls was completed in March 2002. The shorter, shallow outfall is designed to discharge untreated CSO during large storm events, on average of once per year in a year of normal rainfall. The longer, deeper outfall is designed to discharge treated CSO effluent during periods of moderate rainfall when normal system capacity is exceeded. The outfalls are covered by a concrete "blanket" to prevent damage from excessive wave action or navigational mishaps. Habitat enhancement following construction included the placement of "habitat mix" (sand, gravel, cobble) in the disturbed areas surrounding the construction zone, along with armoring cobbles and boulders and large woody debris.
Destruction of the old, onshore Denny Way CSO outfall in mid-2002 has moved the discharge of untreated CSO effluent offshore to the short, shallower outfall in about 20 feet

of water. Discharge of untreated CSO effluent at the new, short outfall will continue during periods of rainfall that exceed normal system capacity until the Denny Way CSO treatment facility comes online in spring 2005.
1.3 Monitoring History Monitoring for the capping project included short-term activities needed for cap placement and long-term activities documenting how well the cap functioned. The long-term strategy called for intensive sampling and observation during the first few years after capping, followed by less-frequent monitoring as appropriate. A 5-year monitoring review meeting was held in 1996 and adjustments were made to the sampling plans for monitoring years 1996 and 2000. These adjustments were based on a review of monitoring results fiom 1990 through 1994. Both the original monitoring plan for the Denny Way sediment cap and the addendum, listing planned activities for 1996 and 2000 are included as Appendix A
The original monitoring plan listed the following six objectives and provided an outline for periodic monitoring reports.
Ensure that water quality standards for dissolved oxygen were maintained during cap placement. Guide and document the sediment cap placement and thickness. Document how well the cap functioned to prevent contaminated sediment from migrating upwards into the cap. Determine whether chemicals were accumulating on the surface of the cap and, if so, if these chemical accumulations indicated a need for additional toxicant source control upstream in the Denny Way CSO collection area. Determine the amount and type of benthic recolonization that occurred on the cap. Review and evaluate the monitoring data to determine whether the cap is functioning as expected and whether future actions are warranted in the capping area.
Two monitoring activities were performed during cap placement to accomplish the first two short-term monitoring objectives. Water quality monitoring was conducted for the first week during cap placement and demonstrated that there were no exceedences of the Washington State water quality criterion for dissolved oxygen. Thickness of the cap was measured during construction using a grid of stakes installed in the bottom and periodically surveyed by a diver. The activities shown in Table 1-1 and discussed in the following sections have been performed periodically over the 10-year monitoring period to accomplish the four long- term monitoring objectives.
Table 1-1
1.3.1 Cap Thickness Measurements Six stakes installed during cap placement were used to determine cap thickness over time and to evaluate whether cap thickness was stable or had decreased due to erosion or increased due to deposition. Cap thickness measurements collected between 1990 and 1994 showed little change in thickness. Agreement was reached during the 5-year project review meeting to adjust the monitoring plan; omitting this activity for the 1996 monitoring event including it for the 2000 monitoring event to determine the final cap thickness after ten years. Cap thickness measurements are discussed in Section 2.
1.3.2 Subsurface Sediment Core Samples Sediment cores were collected at three stations on the cap and subsurface sediment samples were analyzed to determine whether underlying chemical contaminants were migrating upward into cap. Monitoring results from 1990 through 1994 did not indicate the migration of chemicals into the cap. Agreement was reached during the 5-year project review meeting to adjust the monitoring plan; omitting this activity for the 1996 monitoring event including it for the 2000 monitoring event to determine the final chemical concentrations at the bottom of the cap. Chemistry data from sediment cores are discussed in Section 3.
1.3.3 Surface Sediment Samples Collected On the Cap Surface sediment grab samples have been collected from the 0- to 2-centimeter (cm) depth stratum at four stations on the cap during each monitoring event. These 0- to 2-cm samples were analyzed to assess recent changes in sediment chemical concentrations. Surface sediment samples were also collected from the 0- to 10-cm depth stratum at two of the four stations during the 1996 monitoring event to provide concurrent chemistry data for these two stations, at which toxicity testing was being performed. Samples were collected from the 0- to 10-cm depth stratum at all four stations in 2000 to provide concurrent chemistry data at the two toxicity testing stations as well as at two stations for which benthic community analysis was being performed. Chemistry data from on-cap surface sediment samples are discussed in Section 4.
1.3.4 Surface Sediment Samples Collected Off the Cap Six stations have been sampled off the sediment cap to gather information about chemicals in adjacent sediment that could possibly migrate onto the cap. Five of the six stations were sampled only once, in 1994 (King County, 1996). The sixth station was located in an intertidal area inshore of the cap and has been sampled during each of the six monitoring events events. Chemistry data from off-cap surface sediment samples are discussed in Section 4.
1.3.5 Toxicity Testing Using Sediment Bioassays Toxicity testing was added to the monitoring program in 1996. Chemistry results from the 1994 monitoring event indicated that two of the surface sediment stations on the cap exceeded the Washington State Sediment Management Standards (SMS) chemical criterion for bis(2-ethylhexyl) phthalate. Toxicity testing was comprised of one chronic and two acute sediment bioassays. Toxicity testing was again performed at these two stations during the 2000 monitoring event. Toxicity testing results are discussed in Section 5.
1.3.6 Benthic Community Monitoring Benthic community samples have been collected to document the benthic recolonization rate on the sediment cap and to evaluate the health of the benthic community, once reestablished. A benthic reference station, collected at Richmond Beach, was added to this monitoring activity in 1996. The reference station was moved to Elliott Bay for the 2000 monitoring event. Benthic community monitoring results are discussed in Section 6.
1.3.7 Sediment Vertical Profle Imaging Sediment vertical profile images were collected during the 1991 monitoring event using a REMOTS camera to determine how far capping sand had drifted beyond the cap boundary and to look for signs of biological activity on the cap surface. This monitoring activity was only performed once and results were included in the 1990 through 1992 data report (Metro, 1995).
1.3.8 Video Survey Transects Hand-held video camera surveys were conducted by divers during the 1990 through 1994 monitoring events to document conditions on the surface of the cap. These surveys were not easily quantifiable and were discontinued as an outcome of the 5-year review meeting. King County, however, decided to conduct a final video survey during the final 2000 monitoring event to provide documentation of the sediment cap surface after 10 years. Results of the video surveys will not be discussed in this report. King County will retain the videotapes as visual documentation of the Denny Way sediment cap.
1.3.9 Five- Year Review Meeting A meeting was held in March 1996 to review activities and data from the first five years of the 10-year monitoring program for the Denny Way sediment capping project. The meeting was attended by representatives from the Washington State Department of Ecology (Ecology), the USACE, the Washington State Department of Natural Resources, the Muckleshoot Tribe, the Washington State Department of Fish and Wildlife, the US Environmental Protection Agency, the City of Seattle, and King County. Monitoring results from 1990 through1 994 were reviewed and, subsequently, activities for the 1996 and 2000 monitoring events were set. The monitoring plan addendum is included in Appendix A.
1.3.10 Monitoring Reports Monitoring results for the years 1990 through 1992 were presented in The Denny Way Sediment Cap 1990-1 992 Data (Metro, 1995). Monitoring results for 1994 were presented in The Denny Way Sediment Cap 1994 Data (King County, 1996). Monitoring results for 1996 were presented in The Denny Way Sediment Cap 1996 Monitoring Report (King County, 1999).
1.4 Summary of Previous Monitoring Results Results from the 1990, 1991, 1992, 1994, and 1996 monitoring events are briefly summarized below.
Stake measurements collected from 1990 through 1994 showed little change from year to year, indicating the cap surface was stable and not eroding. Stake measurement was not performed in 1996. Core data collected from 1990 through 1994 indicated the cap was isolating the underlying contaminated sediment. The data also indicated, however, that some fine
sediments with elevated chemical concentrations may have been mixed in with the original sandy capping material. Increased chemical concentrations were detected at two of the four surface sediment stations on the cap in both 1994 and 1996. The SMS sediment quality standard chemical criterion for bis(2-ethylhexy1)phthalate was exceeded at both stations. The station with the highest values was located closest to the CSO discharge as well as contaminated intertidal sediments inshore of the cap that could possibly migrate onto the cap. Elevated chemical concentrations were also detected in surface sediments located adjacent to and offshore of the cap. Bioassay results from the 1996 monitoring event showed no toxicity at one of the surface sediment stations tested. Sediment samples from the other surface station passed two of the three bioassays, however, showed toxicity as a response for the larval echinoderm acute bioassay. Benthic community results from the 1990 through 1996 monitoring events indicated the sediment cap was rapidly recolonized during the first three years after cap placement but that there was periodic variation in the number of individuals. The transition of the benthic community from an initial recolonization phase towards a stable community and the appearance of species know to be pollution-sensitive indicated improved sediment quality.
2 STAKE MEASUREMENT, CAP THICKNESS, AND SETTLEMENT
Cap thickness and seafloor settlement has been measured periodically since construction to monitor any changes that could compromise the integrity of the cap and its ability to isolate contaminated sediments. This section describes measurement methods, documents cap thickness and settlement, and compares the 2000 results to previous measurements.
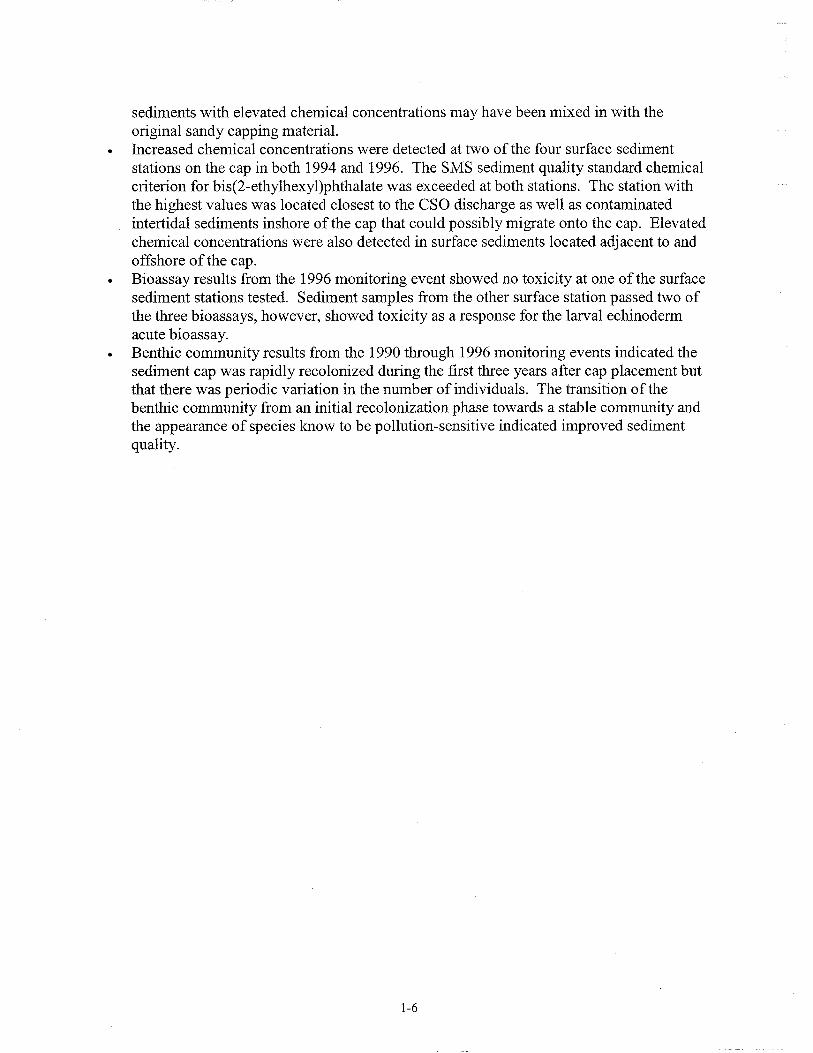
2.1 Methods Measure stakes and settling plate assemblies were set at six locations prior to construction to measure cap thickness and seafloor settlement over time (Figure 2-1). The stakes were 1- inch diameter steel pipes between 13 and 18 feet in length. The stakes were driven 8 to 13 feet into the seafloor with approximately 5 feet of stake left exposed at each location. Settling plate assemblies were then fitted over each stake.
Figure 2-1 Denny Way Cap Measurement Stake Locations
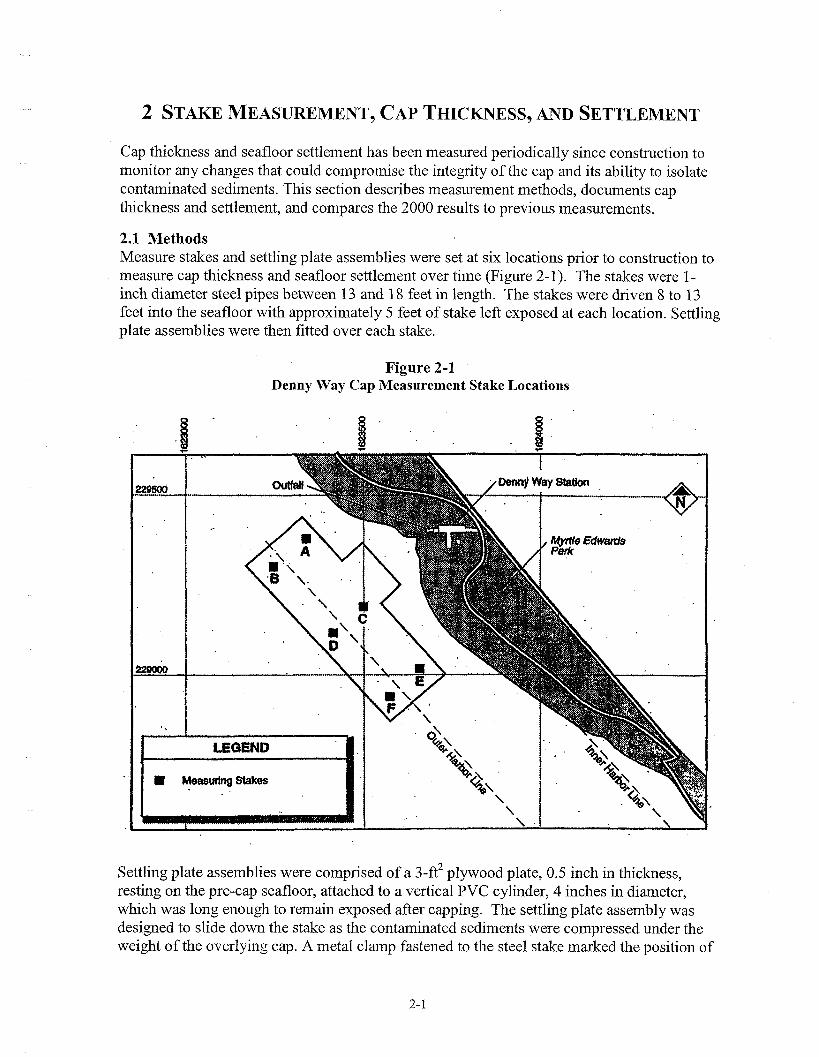
Settling plate assemblies were comprised of a 3-ft2 plywood plate, 0.5 inch in thickness, resting on the pre-cap seafloor, attached to a vertical PVC cylinder, 4 inches in diameter, which was long enough to remain exposed after capping. The settling plate assembly was designed to slide down the stake as the contaminated sediments were compressed under the weight of the overlying cap. A metal clamp fastened to the steel stake marked the position of
the top of the PVC cylinder before capping. Seafloor settlement has been determined by measuring the distance between the bottom edge of the metal clamp and the top of the PVC cylinder. A schematic of the settling plate assembly is shown in Figure 2-2.
Figure 2-2 Settling Plate Assembly
Steel stake \
Plate AtEaohed to Prastb Cyumler
3' Cap Thkknh
8elow Cap Sediment
Cap thickness has been determined by measuring the length of PVC cylinder exposed above the cap surface and then subtracting the total length of the cylinder measured before capping. The net change in water depth can be obtained by subtracting the settlement from the cap thickness.
Using a surveyor's rod, a diver measured both the stake height and settlement at each stake still usable in 2000. Stake A was bent during cap placement in 1990 so the vertical measurements at this stake were taken along a perpendicular line extending from the cap surface to the top of the PVC stake. The vertical distance was used in 1990 to calculate an initial cap thickness and repeated to look for changes over time. In 2000, it was discovered that several other stakes were bent after they were last measured in 1994. For bent stakes, one vertical measurement was taken along the PVC pipe and another vertical measurement along the perpendicular line to the cap surface similar to the measurement at Stake A. While the two vertical measurements for each stake would allow calculation of cap thickness, it is recognized that the calculated thickness still includes error and can only be considered an approximation. When only the vertical measurement along the PVC pipe cap is used to determine the cap thickness, some error could also be introduced because the pipe could have been pushed into the cap surface; however, this method will be used and the error acknowledged.
2.2 Results All stake measurements collected in 2000 as well as in previous years are summarized in Table 2-1 along with the calculated cap thickness and seafloor settlement values. A summary of the cap thickness values for all five monitoring events is included in Table 2-2 along with the measured changes in cap thickness during the last six years (1 994 to 2000) and eight years (1992 to 2000), and corresponding sedimentation rates. It was discovered during the 2000 monitoring event that four of the six stakes had been damaged since the last time they had been measured, during the 1994 monitoring event. Stake C was the only stake undamaged and able to provide accurate data for sediment accumulation and cap settlement measurements. Measurements could still be approximated fairly well from the four remaining stakes, however, and showed there had been very little change in cap thickness both during the last six years and over the entire 10-year monitoring period.
Stake A was bent over at an angle in 1990 due to a mistake at the beginning of capping. This stake appears to have remained unchanged over time, however, and the perpendicular distance to the cap surface has remained the same, approximately 0.5 feet (see Table 2-1). Stake B was present in 1994 but is missing in 2000. Stake C was the only stake that still remained in an upright and undisturbed condition in 2000. Stake C showed an increase of 0.2 feet in cap thickness since the 1994 monitoring event . Seafloor settlement at Stake C increased 0.15 feet from the 1994 measurement.
Stakes D, E, and F were all vertical in 1994 but, in 2000, they were all found to be leaning at an angle. Stake E sustained additional damage with the upper part of the PVC pipe broken off, preventing any stake measurement in 2000. Because stakes D and F were leaning, the cap thickness values can only be used as an approximation and cannot be viewed as exact. The calculated increase in cap thickness for stakes D and F (0.14 feet and 0.16 feet, respectively) have been flagged in Table 2-1 since they are suspect. The leaning stakes could mean that the top of the stake was actually pushed into the cap surface rather then covered with new sediment. The 8-year sedimentation rates shown in Table 2-2 are also flagged but both stakes D and F showed a similar trend to stake C with most change occurring in the last 6 years.
2.3 Discussion Damage to measuring stakes may have occurred as a result of boat anchor lines becoming tangled around the stakes. Mooring of a fireworks barge and log boom installed during annual fireworks shows at Myrtle Edwards Park both could also have resulted in damage to the measuring stakes. Despite the damage, there are data from four stakes (A, C, D, and F) that can be considered usable. These data indicate that erosion is not occurring on the surface of the cap, ten years after placement. These results support modeling that predicted the capping material would not erode in water depths of 20 feet or more and, consequently, would not need to be covered with any arrnoring material. If erosion occurred, measured cap thickness would decrease. Cap thickness appeared to remain the same (Stake A) or increase slightly (Stake C). Because stakes D and F were bent, it is unclear whether the apparent increase in cap thickness are real or merely an artifact caused by the stakes being bent into the cap surface. While the increase in cap thckness cannot be verified at stakes D and E, the observed increases are similar to the increase observed at stake C.

The long-term monitoring of stakes has provided the potential to directly measure sediment deposition rates in the cap area. Sediment deposition rates are important input parameters for mathematical models that predict changes in chemical concentrations in the sediment. Typically, this information is difficult to obtain and must be determined by indirect methods such as age-dating sediment cores. In order to determine sediment deposition rates accurately, only undamaged stakes can be used and sufficient sediment deposition should have occurred, such that the depth of new sediment can be measured accurately.
Stake C, the only undamaged stake, showed a total accumulation of 0.2 feet (6 cm) over the 6-year time period from 1994 to 2000. This was unchanged from the total accumulation for the 8-year time period from 1992 to 2000. The calculated sediment deposition rate at stake C was highest at 1.0 cm per year for the 6-year period from 1994 to 2000 (6 c d 6 years) and a little lower at 0.75 cm per year for the 8-year period from 1992 to 2000 (6 cmI8 years).
The calculated sedimentation rates at Stakes D and F are qualified as uncertain because the stakes were bent. The estimated sedimentation values were slightly lower than at stake C, which is plausible due to these stakes' greater distance from the Denny Way CSO outfall. The 6-year and 8-year sedimentation rate values at Stake D were nearly the same at 0.70 cm per year and 0.68 cm per year, respectively. The 6-year and 8-year sedimentation rate values at Stake F have a slightly larger range of 0.80 cm per year and 0.64 cm per year, respectively.
The greatest amount of seafloor settlement under the cap was observed within the first two years of cap placement. The 1992 measurement at Stake C showed a settlement value of 0.6 feet, which was similar to the final settlement value of 0.65 feet calculated in 2000. The southern area of the cap showed the greatest amount of settlement, with 1.4 feet and 1.15 feet, respectively, at stations E and F. The large amount of settlement at these stakes was considered unusual since the thinnest part of the cap was at stake E (1.6 feet).
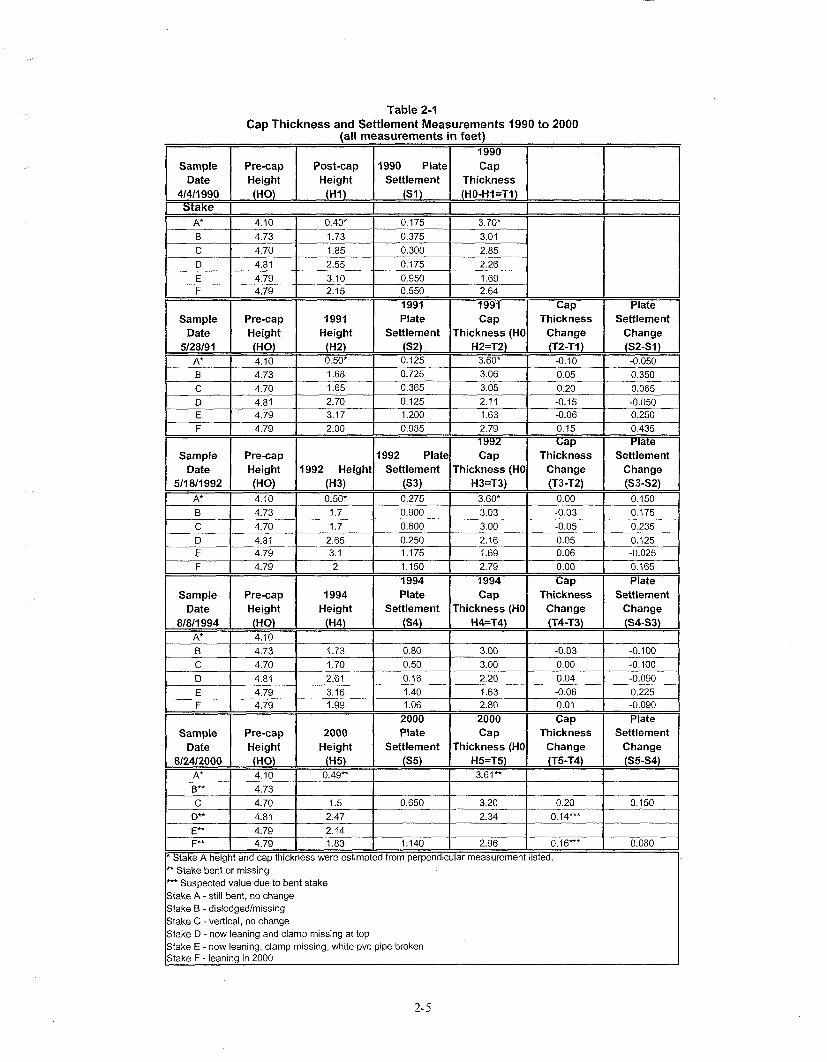
Table 2-1 Cap Thickness and Settlement Measurements 1990 to 2000
(all measurements in feet) I I I I I 1990 I
Sample Date
Sample Date
5/28/91 A*
Pre-cap Post-cap 1990 Plate Cap Height Height Settlement Thickness (HO) (HI) (SI) (HO-HIzTl)
4.10 1 0.40* 0.175 I 3.70*
Pre-cap Plate Thickness Height 1 Height Igg1 1 Settlement
Sample Pre-cap I I 1992 platel Cap I Thickness I Date I Height 1992 Height Settlement Thickness (HO Change 5/18/1992
A*
B C D E
- 1 8/8/1994 1 (HO) 1 (H4) I (S4) I H4=T4) ( (T4-T3)
I A* 1 4.10 1 I I
F
Sample Date
Sample Pre-cap Plate 1 Date I Height I i~::t I Settlement
(HO) 4.10 4.73 4.70 4.81 4.79
- - 8/24/2000 (HO) (H5) (S5) H5=T5) (T5-14)
A* 4.10 0.49** 3.61**
B** 4.73 C 4.70 1.5 0.650 3.20 0.20
- I ... - -. I I I
F** 1 4.79 1 1.83 1.140 2.96 I O.l6*** [* Stake A height and cap thickness were estimated from perpendicular measurement listed.
(H3) 0.50* 1.7 1.7
2.65 3.1
0.00
Cap Thickness
Change
4.79
Pre-cap Height
Settlement Change
0.350 0.065 -0.050 0.250 0.435 4 ate
(S3) 0.275 0.900 0.600 0.250 1.175
2
1994 Height
Settlement Change
0.1651
Settlement Change
I
H3=T3) 3.60* 3.03 3.00 2.16 1.69
1.150
1994 Plate
Settlement
0.225 -0.090
Settlement Change
(T3-T2) 0.00 -0.03 -0.05 0.05 0.06
2.79
1994 Cap
Thickness (HO
** Stake bent or missing *** Suspected value due to bent stake Stake A - still bent, no change Stake B - dislodged/missing Stake C - vertical, no change Stake D - now leaning and clamp missing at top Stake E - now leaning, clamp missing, white pvc pipe broken Stake F - leaning in 2000
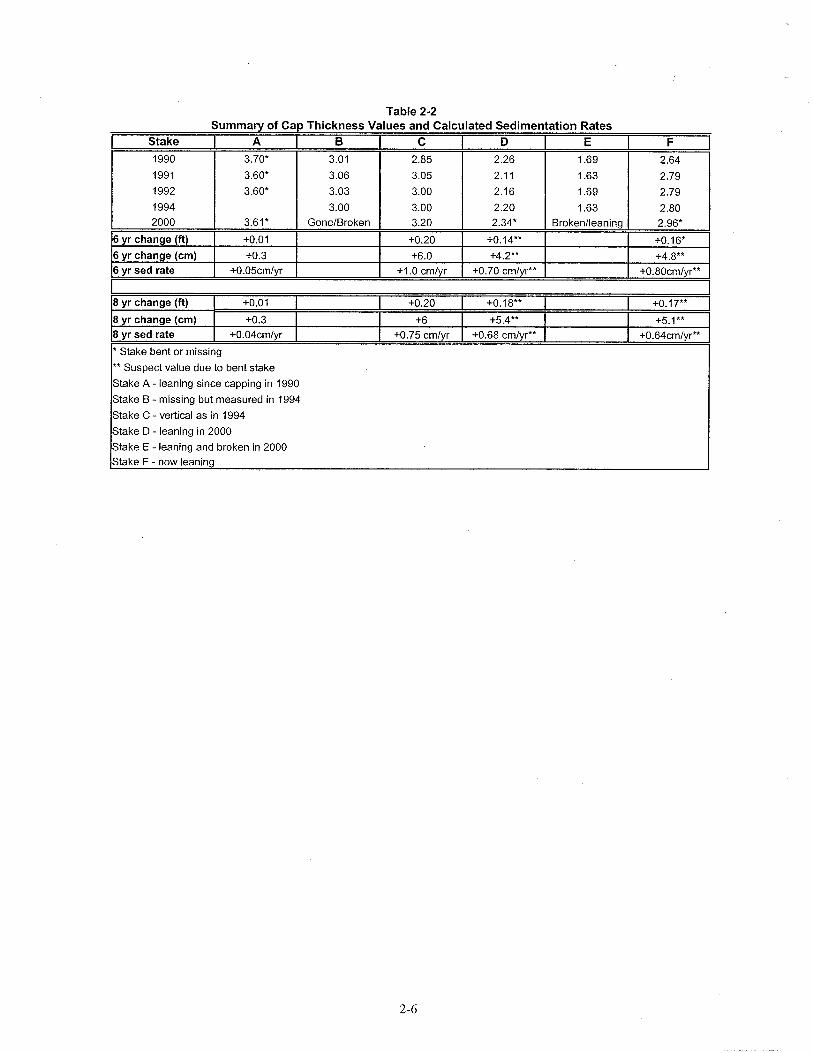
Table 2-2 Summary of Cap Thickness Values and Calculated Sedimentation Rates
I** Suspect value due to bent stake I
Stake 1990
1991
1992
1994 2000
6 yr change (ft) 6 yr change (cm) 6 yr sed rate
8 yr change (ft) P
8 yr change (cm) 8 yr sed rate
Istake A - leaning since capping in 1990 I Stake B - missing but measured in 1994
Stake C - vertical as in 1994
Stake D - leaning in 2000
A 3.70*
3.60*
3.60*
3.61*
+0.01
+0.3 +0.05cmlyr
* Stake bent or missing
+0.01
+0.3 +0.04crn/yr
Istake E - leaning and broken in 2000 I Istake F - now leaning
B 3.01
3.06
3.03
3.00 GoneIBroken
+0.20
+6 +0.75 cmlyr
C 2.85
3.05
3.00
3.00 3.20
+0.20
+6.0 + I .0 crnlyr
+0.18**
+5.4** +0.68 cm/yr**
+O. 17**
+5.1** +0.64cm/yr**
D 2.26
2.1 1
2.16
2.20 2.34*
+0.14**
+4.2** +0.70 crn/yr**
E
1.69
1.63
1.69
1.63 Brokenlleaning
F 2.64
2.79
2.79
2.80 2.96*
+O. 16*
+4.8** +0.80cm/yr**
Core samples were collected and analyzed to determine whether contaminants are migrating upward from the underlying sediments into the cap. The samples were analyzed for metals, trace organics, and conventional parameters. This section describes the core sampling, analytical methods, and analytical results.
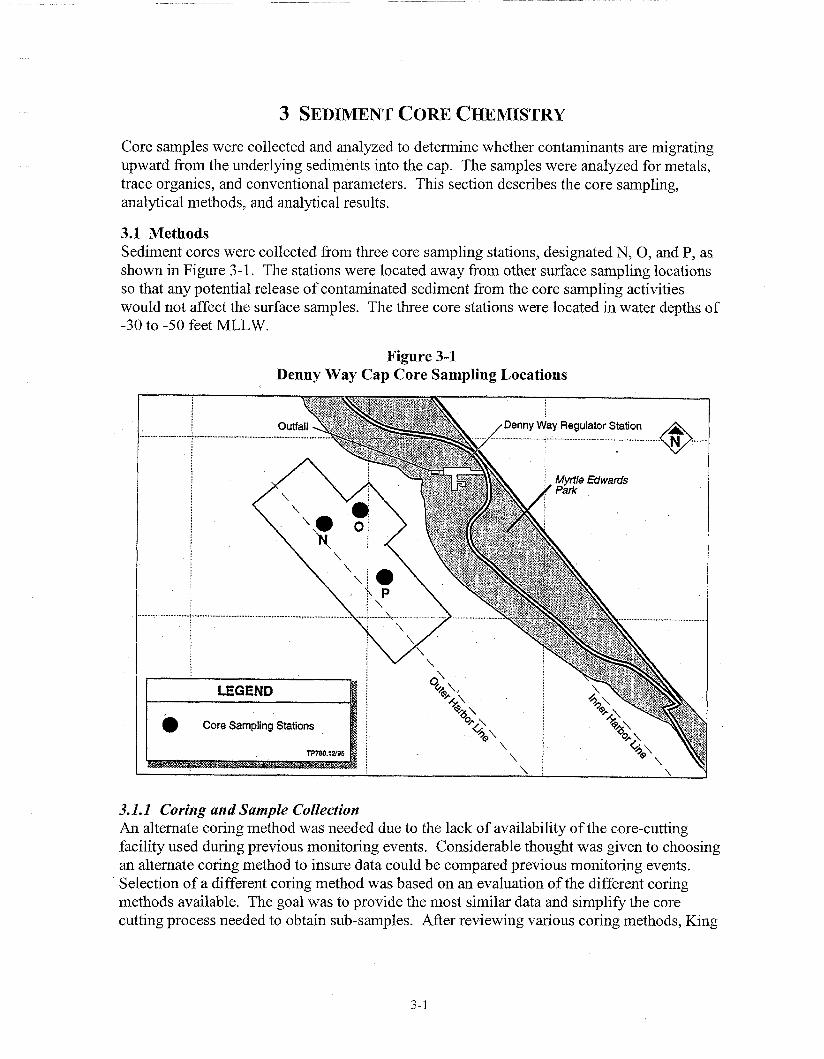
3.1 Methods Sediment cores were collected from three core sampling stations, designated N, 0, and P, as shown in Figure 3-1. The stations were located away from other surface sampling locations so that any potential release of contaminated sediment from the core sampling activities would not affect the surface samples. The three core stations were located in water depths of -30 to -50 feet MLLW.
Figure 3-1 Denny Way Cap Core Sampling Locations
3.1.1 Coring and Sample Collection An alternate coring method was needed due to the lack of availability of the core-cutting facility used during previous monitoring events. Considerable thought was given to choosing an alternate coring method to insure data could be compared previous monitoring events. Selection of a different coring method was based on an evaluation of the different coring methods available. The goal was to provide the most similar data and simplify the core cutting process needed to obtain sub-samples. After reviewing various coring methods, King
County contracted with Pentec Environmental to collect the sediment cores using the MudMolem coring device operated from the research vessel Kittiwake.
An acceptable core driving method was needed to minimize disturbance of sediment in the core tube so that the interface between the bottom of the cap and the underlying contaminated sediment was not disturbed. Vibratory core-driving methods were avoided because the vibration can mix contaminated sediment up into the bottom of the capping material within the core tube. Only coring methods that used a vertical hammering action were considered to be a match with the jackhammering method that was used during previous monitoring events when divers collected the cores. The M u d ~ o l e @ used an air driven piston hammer to drive the core tube into the bottom, which caused minimum disturbance of the interface.
Another reason King County selected the MudMoleB as the preferred coring method was the ability to obtain sub-samples from the core tube without cutting the core tube open. Instead of cutting the core tube open, it was possible to gain access to sediment in the core tube by removing a long stainless steel side plate on the core tube. The bottom six inches of the core tube did not open and contained the core catcher mechanism.
To obtain the best core samples possible, the core tube needed to travel through the first six inches of underlying sediment below the cap so that the contaminated sedimentlsediment cap interface was completely visible when the core tube's side plate removed. One difficulty encountered during coring was that the contaminated sedimentlsediment cap interface was not visible when the core did not effectively penetrate the first six inches of the underlying sediment. Consequently, in some cases, the core was rejected. If a core was not rejected, the interface was located by digging into the bottom mud to locate the interface with the sand. The location of the interface was marked on the outside of the core tube and the sub-sample of sand taken by digging back down into the covered area of the core catcher. This type of sample was at greatest risk of accidentally including some small part of the underlying sediment into the sample.
To collect a core, the core hammering assembly was attached to one end of the core barrel and both were raised with the winch and placed into the water. The entire coring assembly was first supported by the boat crane and then by a floatation bag, which eliminated the need for any support frame to contact the bottom. A diver guided the core tube to the station location and lowered the assembly by letting air out of the floatation bag. An industrial air compressor secured on deck provided air to operate the vertical sliding hammer. As the core was driven into the bottom, the diver periodically took measurements of the core depth, both inside and outside the core tube. Once the core tube was driven to its prescribed depth, it was removed from the bottom by the winch along with floatation assistance. The coring device was raised from the water and the core tube removed and brought aboard. The ends of the core tube were taped shut and the outside of the core tube was cleaned and labeled. Prior to processing the cores they were stored with the top end upright.
Sediment sub-samples were collected from the cores, taking care to obtain a clean sample without any contamination being imparted to the sample from the core tube itself. Sub- samples were removed from the core tubes with a specially shaped stainless steel spatula and placed in stainless steel mixing bowls for thorough homogenization. Sediment sub-samples

were then transferred to pre-labeled sample containers provided by the King County Environmental Laboratory and placed in coolers with ice until delivery to the lab. Samples were collected from 6-inch increments of the each sediment core; four increments above the sediment caplunderlying sediment interface (sediment cap samples), and one increment just below the interface. Figure 3-2 provides a schematic of the sample collection process.
Figure 3-2 Schematic of Sample Collection Process from Sediment Cores
The original analytical scheme for the 2000 monitoring event was to analyze just the four samples collected from the first 6-inch increment at Stations N, 0, and P, as well as a field replicate from Station P (sample designations N1, 01 , PI, and P1 Rep). The remainder of the sediment core samples were archived for potential analysis at a later date. Based on results from the first round of sediment core sample analysis (mainly elevated total PCB concentrations, additional samples were analyzed for Station N. The replicate core sample from the first 6-inch increment (N1 Rep) and from the second 6-inch increments in both the original and field replicate cores (N2 and N2 Rep) were analyzed for certain organic parameters.
3.1.2 Sample Analysis Seven core sub-samples were submitted for chemical analysis of conventional, metal, and trace organic parameters. This section describes the type of analyses performed, analytical methodologies used, and the associated quality assurance/quality control (QAIQC) procedures followed. Analyses were selected to allow comparison of sediment data to the Sediment Management Standards (SMS) sediment chemical criteria found in Tables 1 and 3 of Chapter 173-204 WAC (Ecology, 1995). A complete list of all parameters analyzed along with their respective detection limits are included in Appendix B.
3.1.2.1 Conventionals Conventional analyses included particle size distribution (PSD), percent solids, and total organic carbon (TOC). Percent solids and TOC analyses were performed to provide data necessary to normalize sediment data to dry weight and organic carbon, respectively. Percent solids analysis was performed according to Standard Method (SM)2540-G, gravimetric determination. TOC analysis was performed following EPA Method 9060, high- temperature combustion with infrared spectroscopy. PSD analysis was performed according to ASTM Method D422, a combination of sieve and hydrometer analyses.
3.1.2.2 Metals Metal analytes included aluminum, antimony, arsenic, beryllium, cadmium, chromium, copper, iron, lead, manganese, mercury, nickel, selenium, silver, thallium, and zinc. SMS provides regulatory criteria for arsenic, cadmium, chromium, copper, lead, mercury, silver, and zinc. With the exception of mercury, all metal analyses were performed following EPA Method 3050AI6010B; strong-acid digestion with inductively coupled plasma optical emission spectroscopy. Mercury was analyzed according to EPA Method 245.5, cold vapor atomic absorption spectroscopy.
3.1.2.3 Trace Organics Trace organic analytes included base/neutral/acid extractable semivolatile compounds (BNAs), chlorinated pesticides, and polychlorinated biphenyls (PCBs). BNA analysis was performed following EPA Method 3550Bl8270C (SW-846), gas chromatography with mass spectroscopy (GUMS). Chlorinated pesticides and PCBs were analyzed by EPA Method 8081AI8082 (SW-846), gas chromatography with electron capture detection (GCIECD). This suite of analytes includes all organic compounds for which SMS provides sediment regulatory criteria.
3.1.2.4 Quality Assurance/Quality Control (QAIQC) All analyses were performed following guidance recommended in the Puget Sound Protocols (PSEP 1986, 1997a, and 1997'0) including associated QAIQC practices. Laboratory QAIQC practices produced chemistry data of sufficient quality to pass QAl review. Chemistry data were reviewed following QA1 guidelines (Ecology, 1989) and flagged with data qualifiers where appropriate. A comprehensive report of analytical data, including qualifier flags is included as Appendix B. The QA review narrative is included as Appendix C.
3.2 Results for the 2000 Monitoring Event Table 3-1 summarizes sediment core chemistry results for the Denny Way cap 2000 monitoring event. Data are presented for the following sediment core samples:
Station N - one core sample and one field replicate from the first 6-inch core increment above the sediment caplunderlying sediment interface ("Nl" and "N1 Rep"). Station N - one core sample and one field replicate from the second 6-inch core increment above the sediment caplunderlying sediment interface ("N2" and "N2 Rep"). Station 0 - one core sample and one field replicate from the first 6-inch core increment above the sediment caplunderlying sediment interface ("0 1 "). Station P - one core sample and one field replicate from the first 6-inch core increment above the sediment caplunderlying sediment interface ("P 1 " and "P 1 Rep").
Metals results are presented on a dry weight-normalized basis for comparison to SMS chemical criteria in units of milligrams per kilogram (mg/Kg DW). Results for ionic organic chemicals are also presented on a dry weight-basis for comparison to SMS criteria in units of micrograms per kilogram (yg/Kg DW). Results for non-ionic organic chemicals are generally presented normalized to organic carbon in units of milligrams per kilogram organic carbon. Total organic carbon, however, was not analyzed for three replicate core samples collected at Station N.
Data for non-ionic organic compounds, therefore, have been presented in units of pglKg DW for comparative purposes between samples. Results for these chemicals have been compared to Lowest and Second Lowest Apparent Effects Threshholds (LAET and 2LAET), which are equivalent to the Sediment Quality Standard (SQS) and Cleanup Screening Level (CSL), respectively, under the SMS (EPA, 1988). Total organic carbon concentrations for the original four sediment core samples ranged from 0.2 to 0.7% with three samples at 0.5% TOC or less. Non-ionic organic results for these three samples, as a result, would normally be appropriately compared to dry-weight LAET and 2LAET criteria (Ecology, 1992).
3.2.1 Metals Results Five of the eight metals for which SMS provides chemical criteria were detected in all four of the core samples collected from the first 6-inch core increment (N1 , 0 1, P 1, and P 1 Rep). Arsenic, chromium, copper, lead, and zinc were detected over a narrow range of concentrations, all well-below SMS criteria, and indicative of ambient metal concentrations in the capping material. The following ranges of metal concentrations were detected in these four samples:
Arsenic - 4.5 to 9.2 mg/Kg DW (all less than 17% of the SQS). Chromium - 1 1.5 to 20.9 mg/Kg DW (all less than 9% of the SQS). Copper - 1 1.9 to 13.7 mg/Kg DW (all less than 4% of the SQS). Lead - 5.2 to 7.6 mg/Kg DW (all less than 2% of the SQS). Zinc - 46.8 to 53.7 mg/Kg DW (all less than 14% of the SQS).
Cadmium and silver were not detected in any of the sediment core samples. Mercury was detected only in the sample collected from Station N (Nl), at a concentration of 0.048 mg/Kg DW, which is approximately 12% of the SQS. The three archived samples (N1 Rep, N2, and N2 Rep) were not analyzed for metals.
3.2.2 Ionic Organics Results Benzoic acid was detected in two of the archived sediment core samples, N1 Rep and N2, at concentrations of 120 and 132 yg/Kg DW, respectively. Both of these concentrations are well below the SQS criterion of 650 pg/Kg DW. Benzoic acid was not detected in the third
archived sediment core sample, N2 Rep, at a method detection limit (MDL) of 7.2 pg/Kg DW. The MDL for benzoic acid at the time the original four sediment core samples were analyzed was 140 pg/Kg DW and benzoic acid was not detected in any of these samples. The remainder of the ionic organic compounds were not detected in any of the sediment core samples. Dry weight-normalized MDLs for ionic organic compounds met SQS criteria with the exception of 2,4-dimethylphenol. The MDL range of 33 to 35 pg/Kg DW for the four original sediment core samples (Nl, 01, PI, and P 1 Rep) exceeded the SQS criterion of 29 &Kg DW. The MDL for 2,4-dimethylphenol subsequently improved by the time the three archived core samples were analyzed to between 8.4 and 8.6 pg/Kg DW.
3.2.3 Non-Ionic Organics Results One or more non-ionic organic compounds, encompassing polynuclear aromatic hydrocarbon (PAH) compounds, chlorobenzenes, phthalates, and PCBs, were detected in all sediment core samples with the exception of sample P1 Rep.
3.2.3.1 Low Molecular Weight Polynuclear Aromatic Hydrocarbons (LPAHs) LPAH compounds were not detected in the replicate sample collected at Station P (PI Rep). Anthracene andlor phenanthrene were the only LPAH compounds detected in the other six samples. Anthracene was detected in samples 01, PI, N2, and N2 Rep at concentrations ranging from 8.4 to 30 pg/Kg DW, with the highest concentration being less than 4% of the SQS criterion of 960 pg/Kg DW. Phenanthrene was detected in samples N1, N1 Rep, N2, N2 Rep, 01, and P l at concentrations ranging from 5.5 to 79.3 pgKg DW, with the highest concentration being less than 6% of the SQS criterion of 1,500 pgKg DW. Total LPAH concentrations ranged from 5.5 to 1 10 pg/Kg DW, all less than 3% of the SQS.
3.2.3.2 High Molecular Weight - Polynuclear Aromatic Hydrocarbons (HPAHs) Low concentrations of fluoranthene and pyrene were detected in the sediment core sample collected from Station 0 . The total HPAH concentration of 90 pgKg DW in sample 0 1 is less than 1% of the LAET. The TOC content of 0.2% at Station 0 makes it inappropriate to normalize these data to organic carbon.
LPAH compounds were not detected in the replicate sample (P 1 Rep) collected at Station P, however, eight of nine LPAH compounds were detected in the original sample (PI). The total LPAH concentration detected in sample P1 was 590 pg/Kg DW (1 14 mg/Kg OC). The dry weight-normalized total LPAH concentration in sample P1 is less than 5% of the LAET and the organic carbon-normalized concentration is less than 12% of the SQS.
Benzo(a)pyrene, chrysene, fluoranthene, and pyrene were detected in sample N1, collected from the first 6-inch increment above the interface at Station N. The total HPAH concentration of 235 pg/Kg DW is less than 2% of the LAET. The organic carbon- normalized concentration of 35.8 mg/Kg OC is less than 4% of the SQS. Benzo(a)pyrene, chrysene, and pyrene were also detected in the field replicate sample N1 Rep. The total HPAH concentration of 38 &Kg DW is less than 1% of the LAET.
HPAH compounds were also detected in both the original and field replicate samples (N2 and N2 Rep) collected from the second 6-inch increment above the interface at Station N. The total HPAH concentrations of 95.0 and 77.4 pg/Kg DW detected in these samples are both less than 1% of the LAET.
3.2.3.3 Chlorobenzenes Chlorobenzene compounds were detected only in the original sediment core sample collected from the first 6-inch increment above the interface at Station N. 1,2-Dichlorobenzene and 1,4-dichlorobenzene were detected at concentrations of 1.3 and 6.05 pg/Kg DW, respectively, in sample Nl. Both of these concentrations are less than 6% of the LAET criteria of 35 and 1 10 pg/Kg DW for 1,2-dichlorobenzene and 1,4-dichlorobenzene, respectively. All chlorobenzene MDL values met associated LAET chemical criteria.
3.2.3.4 Phthalates Benzyl butyl phthalate was detected in sample N1 at a concentration of 29 pg/Kg DW (4.4 mg/Kg OC). Di-N-butyl phthalate was also detected in sample N1 at a concentration of 45 pg/Kg DW (6.9 mg/Kg OC). Both of these detected phthalate concentrations are below both the LAET and SQS criteria. Phthalates were not detected in any other sediment core sample.
Bis(2-ethylhexyl) was detected in both laboratory method blanks associated with all sediment core samples and, as a result, all sample results were less than the MDL. When a phthalate compound is detected in a laboratory method blank, an associated sample result that is less than ten times the method blank concentration is considered undetected (EPA, 1999) and the sample-specific MDL is raised to the reported value and flagged as undetected. The adjusted MDL values for bis(2-ethylhexyl) phthalate met both the LAET and SQS criteria.
3.2.3.5 Miscellaneous Compounds Dibenzofuran, hexachlorobutadiene, and N-nitrosodiphenylamine were not detected in any of the sediment core samples. All dry weight-normalized MDL values for Dibenzofuran met the LAET criterion. The dry weight-normalized MDL range of 33 to 35 pg/Kg DW for both hexachlorobutadiene and N-nitrosodiphenylamine in the four original sediment core samples (Nl , 0 1 , P 1, and P 1 Rep) exceeded the LAET criteria of 1 1 pg/Kg DW for hexachlorobutadiene and 28 pg/Kg DW for N-nitrosodiphenylamine. MDL values improved to a range of 0.90 to 0.92 pg/Kg DW for hexachlorobutadiene and to 24 pg/Kg DW for N- nitrosodiphenylamine when the archived core samples (N1 Rep, N2, and N2 Rep) were analyzed.
3.2.3.6 Total PCBs PCBs, as total ~ r o c l o r s ~ , were not detected in sediment core samples N2 Rep, 01, P 1, and P1 Rep. Total PCBs were detected at a concentration of 144 pg/Kg DW in sample N1, which exceeds the LAET chemical criterion of 130 pglKg DW. Normalizing this result to organic carbon (TOC of 0.7%) would provide a concentration of 22.0 mg/Kg OC, which also exceeds the SQS. The total PCB concentration detected in the replicate of this sample, N1 Rep, however, was 7.45 &Kg DW, which is less than 6% of the LAET. Total PCBs were detected in sample N2 at a concentration of 14.1 yg/Kg DW but were not detected in that sample's field replicate (N2 Rep). The concentration of 14.1 pg/Kg DW is less than 11% of the LAET.
3.3 Sediment Core Chemistry over the 10-Year Monitoring Period Tables 3-2 through 3-6 summarize sediment core chemistry results over the 10-year monitoring period for five chemicals or chemical groups; PCBs, LPAHs, HPAHs, mercury, and lead. Concentrations of all of these chemicals were elevated at the Denny Way site prior to placement of the cap. The tables summarize chemistry results for the 6- inch core
increments collected from the contaminated material just below the caplcontaminated sediment interface, the first 6-inch increment above the interface, and the second 6-inch increment above the interface. Evaluation of these results will help assess whether there appears to be chemical migration upward into the cap.
3.3.1 Station 0 Table 3-2 shows total PCB concentrations between 329 and 1,300 yg/Kg DW in the contaminated sediment below the cap at Station 0. PCBs have never been detected in five sediment core samples collected from the first 6-inch increment above the interface. PCB method detection limits were between 10 and 20 y g/Kg DW for these five samples. PCBs were not detected in either of the two samples collected from the second 6-inch increment above the interface.
Table 3-3 shows total LPAH concentrations between 71 1 and 3,520 pg/Kg DW in the contaminated sediment below the cap. LPAH compounds were not detected in the samples collected from the first 6-inch increment above the interface during the first two monitoring events in 1990 and 1991. LPAH compounds were also not detected in either of the two samples collected from the second 6-inch increment above the interface in 1990 and 1992. Analyte-specific LPAH method detection limits were between 9.0 and 50 yg/Kg DW for these two samples. Replicate cores were collected during the third monitoring event at Station 0. LPAHs were not detected in one of the first 6-inch increment samples, however, total LPAHs were detected at a concentration of 759 pg/Kg DW in the replicate sample. The total LPAH concentrations in the concurrent replicate samples collected from the contaminated sediment below the interface were 775 and 71 1 &Kg DW. Given the similarity in total LPAH concentrations as well as similarity between concentrations of individual LPAH compounds (Metro, 1995 - Table 4-3), it appears likely that the replicate sample collected from the first 6-inch increment above the interface inadvertently included contaminated sediment from below the interface. Total LPAH concentrations detected in the first 6-inch increment samples collected during the 1994 and 2000 monitoring events ranged from 25 to 72 pg/Kg DW. These concentrations are similar to LPAH concentrations detected in the capping material from the Duwamish River prior to cap placement (Metro, 1995 - Appendix B).
Table 3-4 shows total HPAH concentrations between 3,270 and 28,400 yg/Kg DW in the contaminated sediment below the cap. HPAH compounds were not detected in the samples collected from the first 6-inch increment above the interface during the first two monitoring events in 1990 and 199 1. Analyte-specific HPAH method detection limits were between 10 and 50 pg/Kg DW for these two samples. Replicate cores were collected during the third monitoring event at Station 0. HPAHs were not detected in one of the first 6-inch increment samples, however, total HPAHs were detected at a concentration of 2,050 pg/Kg DW in the replicate sample. The total HPAH concentrations in the concurrent replicate samples collected from the contaminated sediment below the interface were 4,130 and 3,270 pg/Kg DW. As stated in the previous paragraph, this supports the assumption that contaminated material was inadvertently mixed in with the replicate sample collected from the first 6-inch increment above the interface. Total HPAH concentrations detected in the first 6-inch increment samples collected during the 1994 and 2000 monitoring events ranged from 90 to 163 pgKg DW. These concentrations are similar to HPAH concentrations detected in the
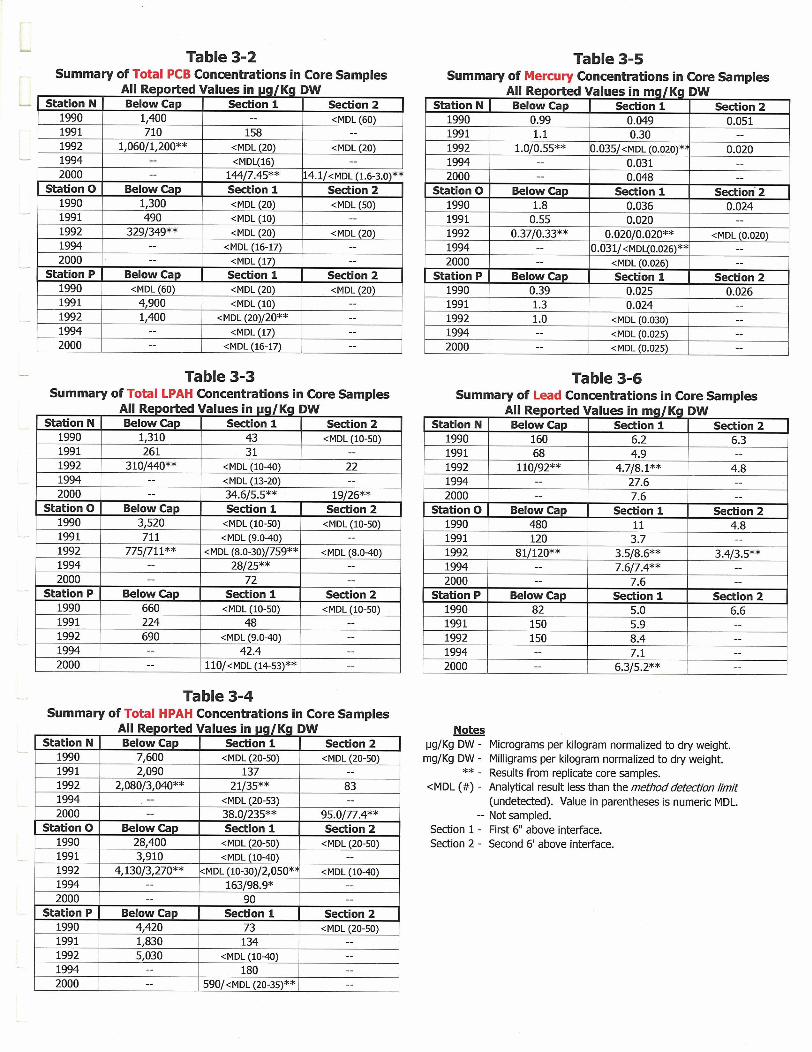
Table 3-2 Summary of Total PCB Concentrations in Core Samples
Table 3-5 Summary of Mercury Concentrations in Core Sam~les
L Table 3-3 Summary of Total LPAH Concentrations in Core Samples
All Reported Values in pg/Kg DW Station N Below Cap Section 1 Section 2
1990 1,310 43 <MDL (10-50) 1991 761 --
---- I r - I
Station P I Below Cap I Section 1 I Section 2
I I - Table 3-4 Summary of Total HPAH Concentrations in Core Samples
---- a"
Station P Below Cap Section 1 Section 2 1990 4,420 73 <MDL (20-50) 1991 1.830 114 --
- All ~eported Values in mg/Kg DW Station N Below Cap Section 1 Section 2
1990 0.99 0.049 0.051 1991 1.1 0.30 --
Summary of Table 3-6
Concentrations in Core Sam~les All Reported Values in mg/Kq DW
Station N Below Cap Section 1 Section 2 1990 160 6.2 6.3 1991 68 4.9 --
Notes 1.1g/Kg DW - Micrograms per kilogram normalized to dry weight. mg/Kg DW - Milligrams per kilogram normalized to dry weight.
** - Results from replicate core samples. <MDL (#) - Analytical result less than the methoddetdion limit
(undetected). Value in parentheses is numeric MDL. -- Not sampled.
Section 1 - First 6" above interface. Section 2 - Second 6' above interface.

capping material from the Duwamish River prior to cap placement (Metro, 1995 - Appendix B). HPAH compounds were not detected in either of the two samples collected from the second 6-inch increment above the interface in 1990 and 1992.
Table 3-5 shows mercury concentrations between 0.33 and 1.8 mg/Kg DW in the contaminated sediment below the cap. Mercury results in all sediment core samples collected from Station 0 have ranged from undetected at a method detection limit range of 0.020 to 0.026 mg/Kg DW to a highest detected concentration of 0.036 mgKg DW. Mercury results have been similar in both the first and second 6-inch increment samples.
Table 3-6 shows lead concentrations between 81 and 480 mgKg DW in the contaminated sediment below the cap. Lead concentrations in all sediment core samples collected from Station 0 have ranged from 3.4 to 11 mg/Kg DW. Lead concentrations have been similar in both the first and second 6-inch increment samples.
Based on these results, upward chemical migration into the cap does not appear to have occurred at Station 0.
3.3.1 Station P Table 3-2 shows total PCB concentrations between 1,400 and 4,900 &Kg DW in the contaminated sediment below the cap at Station P. PCBs were not detected in sample collected from the contaminated sediment during the first monitoring event in 1990. PCBs were detected in one out of six sediment core samples collected from the first 6-increment above the interface at a concentration of 20pg/Kg DW, which was the method detection limit for that sampling event. PCB method detection limits were between 10 and 20 pg/Kg DW for these six samples. PCBs were not detected in the single sample collected from the second 6-inch increment above the interface in 1990.
Table 3-3 shows total LPAH concentrations between 224 and 690 pg/Kg DW in the contaminated sediment below the cap. LPAH compounds were not detected in the samples collected from the first 6-inch increment above the interface during the first and third monitoring events in 1990 and 1992. Analyte-specific LPAH method detection limits were between 9.0 and 50 pgKg DW for these two samples. Total LPAH concentrations detected in the first 6-inch increment samples collected in 1991 and 1994 were 48 and 42.4 &Kg DW, respectively. These total LPAH results were comprised solely of the concentrations reported for phenanthrene. These phenanthrene concentrations are similar to those detected in the capping material from the Duwamish River prior to cap placement (Metro, 1995 - Appendix B). Replicate cores were collected at Station P in 2000 and the total LPAH results from those first 6-inch increment samples were 110 pg/Kg DW and undetected at a method detection limit range of 14 to 53 pg/Kg DW. This dissimilarity in replicate results appears to most likely be attributable to the inclusion of some contaminated sediment from below the .
interface in with the sample collected from the capping material. A similar discrepancy appeared in total HPAH results in these replicate samples. LPAH compounds were not detected in the single second 6-inch increment sample collected from Station P in 1990.
Table 3-4 shows total HPAH concentrations between 1,830 and 5,030 pg/Kg DW in the contaminated sediment below the cap. HPAH compounds were detected in the samples collected from the first 6-inch increment above the interface during the first two monitoring
events in 1990 and 1991. Total HPAH concentrations in these two samples were 73 and 134 pg/Kg, respectively, which are similar to HPAH concentrations detected in the capping material from the Duwamish River prior to cap placement (Metro, 1995 - Appendix B). HPAH compounds were not detected in the first 6-inch increment sample collected at Station P in 1992, with analyte-specific method detection limits between 10 and 40 pg/Kg DW. HPAH compounds were again detected in the first 6-inch increment sample in 1994, at a total HPAH concentration of 180 pg/Kg DW, which is well within the range of concentrations detected in the original capping material prior to placement. Total HPAH results for the replicate 2000 samples were 590 yg/Kg DW and undetected with a method detection limit range of 20 to 35 pg/Kg DW. Again, this dissimilarity in replicate results appears to most likely be attributable to the inclusion of some contaminated sediment from below the interface in with the sample collected from the capping material. HPAH compounds were not detected in the single sample collected from the second 6-inch increment in 1990.
Table 3-5 shows mercury concentrations between 0.39 and 1.3 mgKg DW in the contaminated sediment below the cap. Mercury results in all sediment core samples collected from Station P have ranged from undetected at a method detection limit range of 0.025 to 0.030 m a g DW to a highest detected concentration of 0.026 mgKg DW. Mercury results have been similar in both the first and second 6-inch increment samples.
Table 3-6 shows lead concentrations between 82 and 150 mg/Kg DW in the contaminated sediment below the cap. Lead concentrations in all sediment core samples collected from Station P have ranged from 5.0 to 8.4 m a g DW. Lead concentrations have been similar in both the first and second 6-inch increment samples.
Based on these results, upward chemical migration into the cap does not appear to have occurred at Station P.
3.3.3 Station N Table 3-2 shows total PCB concentrations between 710 and 1,400 yg/Kg in the contaminated sediment beneath the cap at Station N, between 1990 and 1992. PCB analysis was not performed on the first 6-inch increment sample collected in 1990. Unfortunately, the reason for this oversight is not documented in previous reports. PCBs were not detected in the second 6-inch increment sample collected in 1990 at a method detection limit of 60 ygKg DW. PCBs were detected in the first 6-inch increment sample collected in 1991 at a concentration of 158 &Kg DW. The total PCB concentration was comprised of individual concentrations of AroclorsB 1248, 1254, and 1260. Possible reasons for the appearance of PCBs in the 1991 first 6-inch increment sample were not provided in the associated monitoring report (Metro, 1995).
PCBs were not detected (method detection limit range of 16 to 20 pg/Kg DW) in the samples collected from both the first and second 6-increments in 1992 and from the first 6-inch increment in 1994. PCBs were detected in the replicate first 6-inch increment samples collected in 2000 at very different concentrations; 144 and 7.45 &Kg DW. The total PCB concentration of 144 &Kg DW was comprised of Aroclors@ 1248, 1254, and 1260, while the total PCB concentration of 7.45 yg/Kg DW was comprised of ~roclors@ 1254 and 1260 (see Appendix B). PCBs were detected in one of the replicate second 6-inch increment samples at a concentration of 14.1 yg/Kg DW and were not detected in the other sample
(method detection limit range of 1.6 to 3.0 &Kg DW). The total PCB concentration of 14.1 pgIKg DW was comprised of ~roclors' 1016, 1254, and 1260 (see Appendix B). PCBs were not detected in the original Duwamish River capping material, however, their presence in that waterway are well documented. Given the sporadic nature of PCB distribution, it is possible that low levels were present in the original capping material but were not detected in the four pre-capping samples that were collected. Other than actual upward chemical migration, this would be the only plausible scenario for the appearance of PCBs in the second 6-inch increment of sediment cap at Station N. The wide variation in total PCB concentrations over the monitoring period in the first 6-inch increment of the sediment cap would most likely be attributable to contaminated sediment from the cap inadvertently becoming entrained in the cap material collected as a sample. This would be most easily caused by an indistinct interface within the coring tube.
Table 3-3 shows total LPAH concentrations between 26 1 and 1,3 10 pg/Kg DW in the contaminated sediment below the cap, between 1990 and 1992. Phenanthrene was detected in the first 6-inch increment samples collected in 1990 and 199 1 at concentrations of 43 and 3 1 pg/Kg DW, respectively. LPAH compounds were not detected in the first 6-inch increment samples collected in 1992 and 1994. Phenanthrene was again detected in the replicate first 6-inch increment samples collected in 2000 at concentrations of 34.6 and 5.5 pg/Kg DW. All of these detected phenanthrene concentrations are within the range of concentrations detected in the original Duwamish River capping material prior to placement (Metro, 1995 - Appendix B). LPAH compounds were not detected in the second 6-inch increment sample collected in 1990, with an analyte-specific method detection limit range of 10 to 50 pg/Kg DW. Phenanthrene was detected in the second 6-inch increment sample collected in 1992 at a concentration of 22 pgIKg DW. Both phenanthrene and anthracene were detected in the replicate second 6-inch increment samples collected in 2000 with resulting total LPAH concentrations of 19 and 26 pg/Kg DW. Again, all of these detected LPAH concentrations are well within the range of concentrations detected in the original capping material.
Table 3-4 shows total HPAH concentrations between 2,080 and 7,600 pg/Kg DW in the contaminated sediment below the cap. HPAH compounds were not detected in either the first or second 6-inch increment samples collected hom Station N in 1990. Analyte-specific method detection limits for these samples ranged from 20 to 50 pg/Kg DW. Total HPAHs were detected at a concentration of 137 pg/Kg DW in the first 6-inch increment sample collected in 1991. The total HPAH result was comprised of benzo(a)anthracene, chrysene, fluoranthene, and pyrene. Concentrations of these individual HPAH compounds (Metro, 1995 - Table 4-1) were similar to HPAH concentrations detected in the Duwamish River capping material prior to placement (Metro, 1995 - Appendix B). Pyrene was detected in the replicate first 6-inch increment samples collected in 1992 at a concentrations of 21 and 35 pg/Kg DW. Pyrene and fluoranthene were detected in the second 6-inch increment sample collected in 1992 for a total HPAH concentration of 83 pg/Kg DW. Again, the detected sample concentrations of these two HPAH compounds were similar to those detected in the original capping material. HPAH compounds were not detected in the first 6-inch increment sample collected in 1994. Total HPAH concentrations in the replicate first 6-inch samples collected in 2000 were 235 and 38.0 pg/Kg DW. The range of individual HPAH concentrations in the original core sample (see Table 3-1, sample N1) seem elevated, they are
still within the range of concentrations detected in the original capping material. In view of the PCB and LPAH data, the discrepancy in total HPAI-I concentrations between the replicate samples seems most likely to be attributable to a small amount of contaminated sediment from below the cap inadvertently entrained in the cap sample from the original core at Station N. The total HPAH concentrations of 95.0 and 77.4 yg/Kg DW detected in the replicate second 6-inch increment samples are comprised of individual HPAH concentrations that are, again, similar to those detected in the original capping material.
Table 3-5 shows mercury concentrations between 0.55 and 1.1 mgKg DW in the contaminated sediment below the cap. Mercury results in all sediment core samples collected from Station N have ranged from undetected at a method detection limit of 0.020 to a highest detected concentration of 0.30 mg/Kg DW. The mercury concentration of 0.30 mg/Kg DW detected in the first 6-inch increment sample collected in 1991 appears to be an anomaly because all other detected mercury concentrations have been between 0.020 and 0.051 mg/Kg DW. With that one exception, mercury results have been similar in both the first and second 6-inch increment samples.
Table 3-6 shows lead concentrations between 68 and 160 mg/Kg DW in the contaminated sediment below the cap. Lead concentrations in most sediment core samples collected from Station N have ranged from 4.7 to 8.1 mg/Kg DW. Lead was detected at a concentration of 27.6 mg/Kg DW in the first 6-inch increment sample collected in 1994, which appears to be an anomaly. With this one exception, lead concentrations have been similar in both the first and second 6-inch increment samples.
Based on these results, it is a little more difficult to assess whether or not upward chemical migration has occurred at Station N than for the other two stations. There are several plausible scenarios for these detected chemicals at Station N: actual chemical migration upwards into the cap; mixing of cap material and underlying contaminated sediment during cap placement; existing concentrations of organic chemicals in the original capping material; or a poorly delineated interface in the first sediment core collected at Station N, which caused the inclusion of contaminated sediment from below the interface in the capping material sample. Of these, the most-likely scenario is the inadvertent inclusion of contaminated sediment in the core sample collected with a new coring process in 2000.
Surface sediment samples were collected in August 2000 from four stations on the Denny Way sediment cap and one station inshore of the cap. Samples were analyzed for metals, trace organics, and conventional parameters. This section describes the surface sampling methods, reports the results of the chemical analyses, and compares these results SMS chemical criteria.
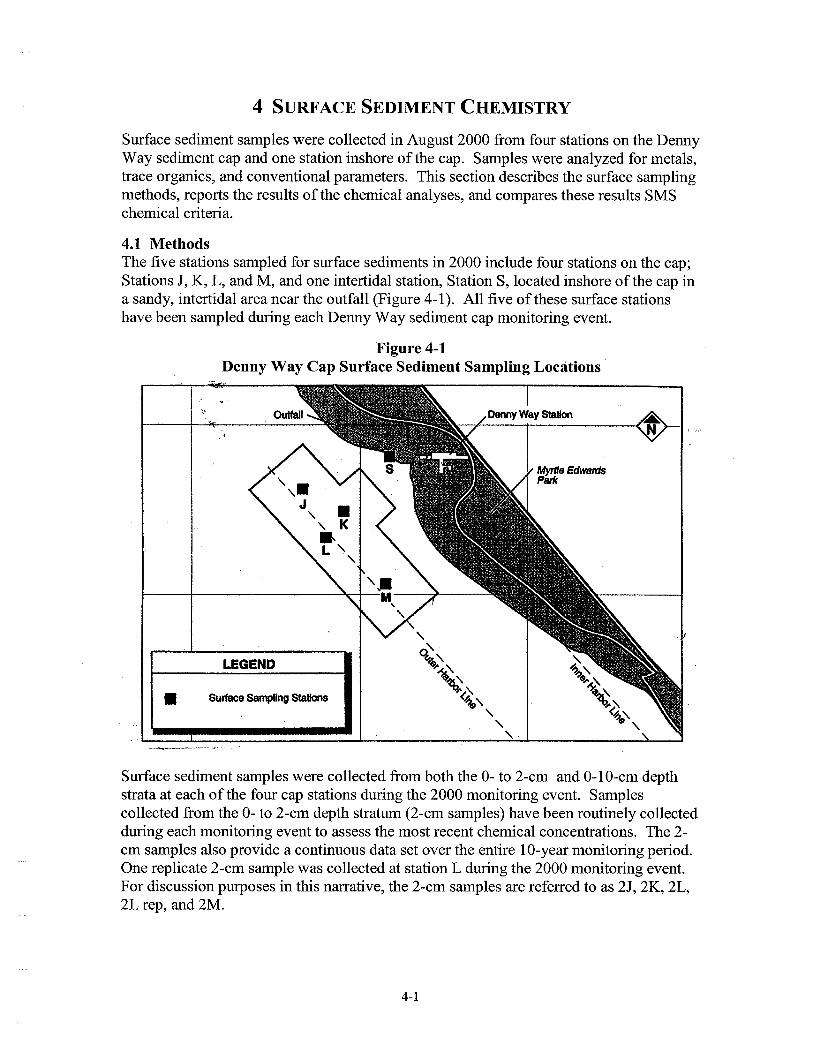
4.1 Methods The five stations sampled for surface sediments in 2000 include four stations on the cap; Stations J, K, L, and M, and one intertidal station, Station S, located inshore of the cap in a sandy, intertidal area near the outfall (Figure 4-1). All five of these surface stations have been sampled during each Denny Way sediment cap monitoring event.
Figure 4-1 Denny Way Cap Surface Sediment Sampling Locations
Surface sediment samples were collected from both the 0- to 2-cm and 0-10-cm depth strata at each of the four cap stations during the 2000 monitoring event. Samples collected from the 0- to 2-cm depth stratum (2-cm samples) have been routinely collected during each monitoring event to assess the most recent chemical concentrations. The 2- cm samples also provide a continuous data set over the entire 10-year monitoring period. One replicate 2-cm sample was collected at station L during the 2000 monitoring event. For discussion purposes in this narrative, the 2-cm samples are referred to as 2J,2K, 2L, 2L rep, and 2M.
Collection of surface sediment samples from the 0- to 10-cm depth stratum (10-cm samples) first occurred during the 1996 monitoring event, when toxicity testing was added at stations K and L. Toxicity testing was added at these two stations based on previous sediment chemistry results that exceeded one or more SMS chemical criteria. Samples were again collected from the 0- to 10-cm depth stratum at Stations K and L during the 2000 monitoring event to provide concurrent chemistry and toxicity data. The 10-cm samples were also collected at Stations J and M during the 2000 monitoring event to provide chemistry data concurrent with benthic community data. The 10-cm samples are considered to represent the biologically active zone. An additional 10-cm sample was collected at both Stations K and L to as backup toxicity testing samples. For discussion purposes in this narrative, the 1 0-cm samples are referred 1 OJ, 1 OK, 1 OK add, 1 OL, 10L add, and 10M.
One 2-cm sample was collected at Station S, as has be done in each of the previous monitoring events.
4.1.1 Station Positioning Subtidal surface sediment grab samples were collected from King County's research vessel Liberty, which is equipped with a differential global positioning system (DGPS). Field coordinates were recorded using DGPS for each sediment grab as the sampler contacted the seafloor. The DGPS is a satellite-based navigation system that operates using a receiver to calculate ground position by triangulating scrambled data transmitted by a constellation of satellites operated by the Department of Defense (DOD). The ship- board "differential" receiver receives both the scrambled DOD signal and "corrected" signals originating from base stations operated by various agencies including the Coast Guard and King County. System software applies the differential correction and calculates a precise, real-time navigational position.
4.1.2 Sample Collection and Handling Sediment was obtained using two stainless steel, modified, 0.1 m2 Van Veen grab samplers deployed in tandem from the Liberty. Samples were comprised of sediment collected from three grab deployments at each station. A single deployment of the tandem Van Veen grab samplers was considered "two deployments" when both of the grabs returned an acceptable sample.
A minimum sediment recovery depth of 4 cm was required in each acceptable grab to allow collection 2-cm samples without sampling sediment that had touched the sides or bottom of the grab sampler. A minimum sediment recovery depth of 11 cm was required for collection of 10-cm samples. Sediment for 2-cm samples was removed from the grab using stainless-steel spatulas and 200 cm3 "cookie cutters" and placed into a stainless- steel bowl for thorough homogenization. Sediment for 10-cm samples was removed using a stainless-steel spoons. Analytical sample aliquots were split out into labeled, pre- cleaned containers supplied by the King County Environmental Laboratory.
A separate set of stainless-steel sampling equipment was dedicated to each station, precluding the need for decontamination of this field gear. The Van Veen grab sampler was decontaminated between stations by scrubbing with a brush and ambient seawater, followed by a thorough in situ rinsing.
The intertidal sample at Station S was collected at low tide with a stainless steel tube inserted into the sediment to a depth of 2 cm. A bent spatula was placed under the tube to contain sediment as the tube was removed. This method of sampling was used instead of using the standard "cookie cutter" since the sampling site was underwater at the time of sampling. About a dozen tube positions were needed to obtain a sufficient amount of sediment for the sample.
Samples were stored in ice-filled coolers from the time of collection until delivery to the King County Environmental Laboratory. Samples were delivered under chain-of-custody and were maintained as such throughout the analytical process. Samples were stored frozen at a temperature of -1 8°C by the laboratory until analysis, with the exception of samples for ammonia nitrogen, particle size distribution, total sulfide, and volatile organic analyses. These samples were stored refrigerated at approximately 4°C. All analyses were conducted by the King County Environmental Laboratory with the exception of particle size distribution and total sulfides, which were analyzed at AmTest, a subcontracted laboratory accredited by Ecology.
4.1.3 Sample Analysis Surface sediment samples were analyzed for BNA compounds, volatile organic compounds (VOCs), chlorinated pesticides, PCBs, metals, particle size distribution, percent solids, and total organic carbon. Chemistry analysis on the samples also submitted for toxicity testing included ammonia nitrogen and total sulfide. Analytical methods were described previously in Section 3.1.2, with the following exceptions:
VOCs were analyzed by EPA Method 8260B (SW-846), purge and trap with GCIMS analysis. Ammonia nitrogen was analyzed by Standard Method SM4500-NH3-G, potassium chloride extraction with autoanalyzer. Total sulfide was analyzed by Standard Method SM4500-S2-D, colorimetric determination.
All analyses were performed following guidance recommended in the Puget Sound Protocols (PSEP 1986, 1997a, and 1997b) including associated QNQC practices. Laboratory QNQC practices produced chemistry data of sufficient quality to pass QAl review. Chemistry data were reviewed following QAl guidelines (Ecology, 1989) and flagged with data qualifiers where appropriate. A comprehensive report of analytical data, including qualifier flags is included as Appendix B. The QA review narrative is included as Appendix C.
4.2 Results for 2000 Monitoring Event Table 4-1 summarizes surface sediment chemistry results for the Denny Way cap 2000 monitoring event. Metals results are presented on a dry weight-normalized basis for comparison to SMS chemical criteria in units of milligrams per kilogram (mg/Kg DW). Results for ionic organic chemicals are also presented on a dry weight for comparison to SMS criteria in units of micrograms per kilogram (&Kg DW). Results for non-ionic organic chemicals are presented normalized to organic carbon in units of milligrams per kilogram (mg/Kg OC). Total organic carbon concentrations for all surface sediment
samples collected during the 2000 monitoring event ranged from 0.5 to 1.9%, which makes normalization to organic carbon appropriate under the SMS (Ecology, 1992). Data are presented for Station J (one 2-cm and one 10-cm sample), Station K (one 2-cm sample and two 10-cm samples), Station L (a 2-cm sample with a field replicate and two 10-cm samples), Station M (one 2-cm sample and one 10-cm sample), and Station S (one 2-cm sample).
4.2.1 Metals Results Metals concentrations were less than the SQS with the exception of mercury at two stations. Mercury was detected at a concentration of 0.433 mg/Kg DW in the 2-cm field replicate sample at Station L. This concentration is just slightly higher than the SQS chemical criterion of 0.41 mgKg DW. The mercury concentration in the other 2-cm sample from Station L was 0.093 mgKg DW. Mercury concentrations in the two 10-cm samples collected from Station L were 0.17 and 0.096 mg/Kg DW. Mercury was detected at a concentration of 0.696 mg/Kg DW at Station S, which exceeds the CSL chemical criterion of 0.59 mgKg DW.
The following ranges of metals concentration were detected in the Denny Way cap surface sediment samples:
Arsenic results ranged from undetected (MDL of 3.5) to 9.1 mg/Kg DW. The highest arsenic concentration is approximately 16% of the SQS. Cadmium results ranged from undetected (MDL of 0.20) to 0.48 mg/Kg DW. The highest cadmium concentration is approximately 9% of the SQS. Chromium results ranged from 11.0 to 22.7 mg/Kg DW. The highest chromium concentration is approximately 9% of the SQS. Copper results ranged from 14.1 to 66.8 mg/Kg DW. The highest copper concentration is approximately 17% of the SQS. Lead results ranged from 11.1 to 77.7 mg/Kg DW. The highest lead concentration is approximately 17% of the SQS. Silver results ranged from undetected (MDL of 0.27) to 4.09 mg/Kg DW. The highest silver concentration is approximately 67% of the SQS. Zinc results ranged from 49.7 to 113 mg/Kg DW. The highest zinc concentration is approximately 28% of the SQS.
Table 4-2 shows average concentrations of metals within the Puget Sound region as well as average crustal concentrations for comparison with metals detected at the Denny Way cap site.

Table 4-2 Comparison Between Average Crustal Metal Concentrations and
Average Metal Concentrations in Puget Sound Regional Soils (all concentrations in mg/Kg ~ r - ~ a r t s per million)
Element I Puget Sound Regional Soils (a) I Average Crustal (a) I 70.000 8 1 .OOO : Aluminum '
15 16 Lead
(a) These data are compiled from Dexter et al., NOAA Technical Memorandum OMPA-13, 1981 (Table VIII-1) and are supplemented and slightly modified based on discussions with Crecelius (Battelle Marine Sciences Laboratory, Sequim WA).
(b) The values in parentheses are from Dexter et al., 1981. The first values in the Puget Sound Regional Soils column are from Crecelius. The notation ** indicates that data were not provided in Dexter et al. for the element listed.
Although metals concentrations detected at Denny Way appear to correlate well with average Puget Sound regional concentrations, as well as localized sediment concentrations within Elliott Bay (King 2004, unpublished data), there is some evidence that concentrations at Station S, the intertidal station, are elevated compared to those stations on the cap. The highest concentrations of all SMS metals except arsenic were detected at Station S. Concentrations of copper, lead, mercury, and silver at Station S were significantly higher than the concentration ranges for those metals found at the cap stations. These elevated concentrations at Station S can most likely be attributed to legacy contamination from the old, intertidal Denny Way CSO outfall. Although elevated, metals concentrations at Station S are less than SMS chemical criteria with the exception of mercury.
4.2.2 Ionic Organics Results Benzoic acid was detected in the 2-cm sample collected from Station J at a concentration of 180 pg/Kg DW, which is just above the MDL and well-below the associated SQS chemical criterion of 650 pg/Kg DW. Benzoic acid was not detected in any other sample. The other six ionic organic chemicals were not detected in any sample. Method detection limits were below SMS chemical criteria with the exception of 2,4- dimethylphenol. The 2,4-dimethylphenol MDL range of 36 to 47 &Kg DW was greater than the SQSICSL chemical criterion of 29 pg/Kg DW.
4.2.3 Non-Ionic Organics Results One or more non-ionic organic chemicals were detected at each Denny Way station during the 2000 monitoring event. With the exception of PCBs, the highest concentrations of all detected chemicals and, in some cases the only detections, were at Station S.
4.2.3.1 Low Molecular Weight Polynuclear Aromatic Hydrocarbons (LPAHs) One or more LPAH compounds were detected in every sample. The most commonly detected compounds were acenaphthene (6 of 12 samples), anthracene (1 1 of 12 samples), fluorene (6 of 12 samples), and phenanthrene (all 12 samples). Acenaphthylene, 2-methylnaphthalene, and naphthalene were not detected and the organic carbon-normalized MDLs for these three compounds were all below their respective SQS chemical criteria.
Total LPAH concentrations in samples collected from the four cap stations ranged from 7.1 to 35 mg/Kg OC, all less than 10% of the SQS criterion of 370 mg/Kg OC. The phenanthrene concentration of 189 mg/Kg OC detected at Station S exceeded the SQS criterion of 100 mg/Kg and was approximately 39% of the CSL. The total LPAH concentration of 25 1 mg/Kg OC at Station S, however, was only 68% of the SQS criterion. Concentrations of all detected LPAH compounds at Station S were significantly higher than those detected at Stations J, K, L, and M.
4.2.3.2 High Molecular Weight Polynuclear Aromatic Hydrocarbons (HPAHs) Eight of the nine HPAH compounds were detected in every sample collected on the cap. Dibenzo(a,h)anthracene was not detected in any of the cap samples and the organic carbon normalized MDL range of 3.9 to 12 mg/Kg OC was below the SQS criterion of 12 mg/Kg OC.
Total HPAH concentrations in cap samples ranged from 100 to 246 mg/Kg OC, all of which are less than 26% of the SQS criterion of 960 mg/Kg OC. All nine HPAH compounds were detected at Station S. Eight of the nine detected HPAH compounds exceeded their respective SQS chemical criteria, however, all were less than the corresponding CSL chemical criteria. The total HPAH concentration of 1,440 mg/Kg OC detected at Station exceeds the SQS chemical criterion of 960 mg/Kg OC, however, is less than 28% of the CSL criterion of 5,300 mg/Kg OC.
4.2.3.3 Chlorobenzenes Chlorobenzene compounds were not detected in any of the cap samples and all chlorobenzene MDLs were below their associated SQS chemical criteria. 1,4-
Dichlorobenzene was detected in the sample collected at Station S at a concentration of 4.35 mg/Kg OC, which exceeds the SQS criterion of 3.1 mg/Kg OC. The Station S chlorobenzene concentration, however, is less than 50% of the CSL. Since 1,4- dichlorobenzene is frequently detected in sewage, the concentration detected at Station S is again, most likely, attributable to legacy contamination from the old Denny Way CSO outfall.
4.2.3.4 Phthalates Four phthalate compounds were detected one or more times at all five sampling stations. Diethyl phthalate and dimethyl phthalate were not detected and all organic carbon- normalized MDLs for these two compounds were below their respective SQS chemical criteria.
Di-N-octyl phthalate was detected once, in the sample collected from Station S, at a concentration of 68.4 mg/Kg OC, which exceeds the SQS criterion of 58 mg/Kg OC but is less than 2% of the CSL criterion of 4,500 mg/Kg OC.
Di-N-butyl phthalate was only detected at Station L; at a concentration of 5.5 mg/Kg OC in the 2-cm field replicate and at a concentration of 24.2 mgKg OC in one of the two 10- cm samples. Both of these concentrations are less than 11% of the SQS criterion of 220 mg/Kg OC.
Benzyl butyl phthalate was detected at all five stations (7 of 12 samples) at concentrations ranging from 2.6 to 16.3 mg/Kg OC. Benzyl butyl phthalate concentrations in the 10-cm Station J sample, the 10-cm Station M sample, and the 2-cm Station S sample (6.24, 11.6, and 16.3 mgKg OC, respectively) all exceeded the SQS criterion of 4.9 mg/Kg OC. All of these concentrations, however, are less than 26% of the CSL criterion of 64 mg/Kg OC.
Bis(2-ethylhexyl) phthalate was detected in all 12 samples at concentrations ranging from 138 to 1,580 yg/Kg DW (Appendix B). This phthalate, however, was also detected at a concentration of 98 yglKg in the laboratory method blank associated with this group of samples, indicating probable laboratory contamination (Appendix C). When a phthalate compound is detected in a laboratory method blank, an associated sample result that is less than ten times the method blank concentration is considered undetected (EPA, 1999) and the sample-specific MDL is raised to the reported value and flagged as undetected.
Results for bis(2-ethylhexyl) phthalate in all but 2 of the 12 samples are less than 10 times the method blank concentration and should be discounted and viewed as undetected. Table 4-1 shows the blank-adjusted, organic carbon-normalized MDLs for bis(2-ethylhexyl) phthalate. These new MDL values range from 22 to 160 mg/Kg OC and two of these adjusted MDLs exceed the CSL criterion.
The bis(2-ethylhexyl) phthalate concentrations in the Station K 10-cm sample and the Station S 2-cm sample are both greater than 10 times the method blank concentration and, as such, have been reported as detected. These reported concentrations of 112 mg/Kg OC at Station K and 264 mg/Kg at Station S both exceed the bis(2-ethylhexyl) phthalate CSL criterion of 78 mg/Kg OC. It is important to consider, however, that, since the contribution of laboratory contamination to the sample bis(2-ethylhexyl) phthalate
concentrations is unknown, all reported detectable concentrations should be considered as estimated.
4.2.3.5 Miscellaneous Compounds Dibenzofuran, hexachlorobutadiene, and N-nitrosodiphenylamine were not detected in any sample collected during the 2000 monitoring event. MDL ranges for dibenzofuran and N-nitrosodiphenylamine were below their respective SQS chemical criteria, as were MDLs for hexachlorobutadiene in 7 of 12 samples. The hexachlorobutadiene MDL values for five samples (5.5 to 7.4 mg/Kg OC) were greater than the SQS criterion of 3.9 mgKg OC.
4.2.3.6 Total PCBs PCBs were detected at Stations J, K, and L at concentrations ranging from 5.2 to 12 mg/Kg OC. All of these detected PCB concentrations were less than or equal to the SQS chemical criterion and were all higher in the deeper, 10-cm samples than in the 2-cm samples.. PCBs were not detected at Station M. The total PCB concentration detected at Station S was 7.55 mgKg OC.
4.3 Surface Sediment Chemistry over the 10-Year Monitoring Period Figures 4-2 and 4-3 plot chemical concentrations for metals, LPAHs, and HPAHs over the 10-year monitoring period at Stations J, K, L, and M. These chemicals have been routinely detected at all four stations and, thus, provide the easiest way to try and evaluate trends over time in chemical concentrations on the cap.
Figure 4-2 plots dry-weight normalized concentrations of arsenic, cadmium, chromium, copper, lead, mercury, silver, and zinc. The plots in Figure 4-2 indicate the following:
Arsenic - The arsenic data do not show either a consistent upward or downward trend over time at any station, rather, the data indicate natural variations in ambient arsenic concentrations in the cap material and sediment that has settled out on the cap. Arsenic concentrations have never been greater than 23% of the SQS criterion of 57 mgKg DW. Cadmium - The cadmium data do not show either a consistent upward or downward trend over time at any station, rather, the data indicate natural variations in ambient cadmium concentrations in the cap material and sediment that has settled out on the cap. Cadmium concentrations have never been greater than 1 1 % of the SQS criterion of 5.1 mg/Kg DW. Chromium - The chromium data do not show either a consistent upward or downward trend over time at any station, rather, the data indicate natural variations in ambient chromium concentrations in the cap material and sediment that has settled out on the cap. There has appeared to be a slight upward trend in chromium concentration at Station K, however, the concentrations have not been significantly different from any other station on the cap and this "trend" disappeared in 2000. Chromium concentrations have never been greater than 9% of the SQS criterion of 260 mg/Kg DW. . Copper - The copper data do not show either a consistent upward or downward trend over time at any station, rather, the data indicate natural variations in ambient copper concentrations in the cap material and sediment that has settled out on the cap. There
was a "spike" in copper concentration at Station J during the 1991 monitoring event. This elevation in copper concentration at Station J was not seen in any other monitoring event subsequent to 199 1. Copper concentrations have never been greater than 16% of the SQS criterion of 390 rng/Kg DW. Discounting the 1991 "spike," copper concentrations have not been greater than 10% of the SQS. Lead - The lead data do not show either a consistent upward or downward trend over time at any station, rather, the data indicate natural variations in ambient lead concentrations in the cap material. Lead concentrations have never been greater than 10% of the SQS criterion of 450 m a g DW. Mercury - Mercury concentrations have been inconsistent over the 10-year monitoring period, showing neither a consistent upward or downward trend over time at any station. Mercury concentrations on the cap have exceeded the CSL of 0.59 mg/Kg DW by as much as 1.4% on two occasions. Silver - The silver data do not show either a consistent upward or downward trend over time at any station. There was a "spike" in silver concentrations in 1994 at Stations K and L, the two stations closest to the old Denny Way CSO outfall, although these higher silver concentrations were not apparent during either the 1996 or 2000 sampling events. Silver concentrations at their highest have been less than 66% of the SQS criterion of 6.1 mg/Kg DW. Zinc - The zinc data do not show either a consistent upward or downward trend over time at any station, rather, the data indicate natural variations in ambient zinc concentrations in the cap material. Zinc concentrations have never been greater than 22% of the SQS criterion of 410 mg/Kg DW.
Figure 4-3 plots both dry weight-normalized and organic carbon-normalized concentrations of LPAH and HPAH compounds. The plots in Figure 4-2 indicate the following:
Total LPAHs - The total LPAH data indicate that there has been an apparent increasing trend in concentration at Station K, the on-cap station closest to the old Denny Way CSO outfall, when looking at the data on a dry weight-normalized basis. This trend of increasing concentration has appeared to level out over the last three monitoring events in 1994, 1996, and 2000. The same initial increasing trend in total LPAH concentration was apparent at Station L during the four monitoring events, however, total LPAH concentration at this station has decreased dramatically over the last two monitoring events, 1996 and 2000. There has not been a consistent upward or downward trend in total LPAH concentration at either Station J or M. These trends are less apparent when looking at organic carbon-normalized data, however, the data do indicate that total LPAH concentrations at Stations J, K, and L have been decreasing since 1994 and, at Station M, since 1996. Total LPAH concentrations, normalized to organic carbon have never been greater than 27% of the SQS criterion of 370 mg/Kg OC. . Total HPAHs - The total HPAH data indicate that the trends over time at all stations are much the same as shown for total LPAH data. Total HPAH concentrations, normalized to organic carbon have never been greater than 64% of the SQS criterion of 960 m a g OC.
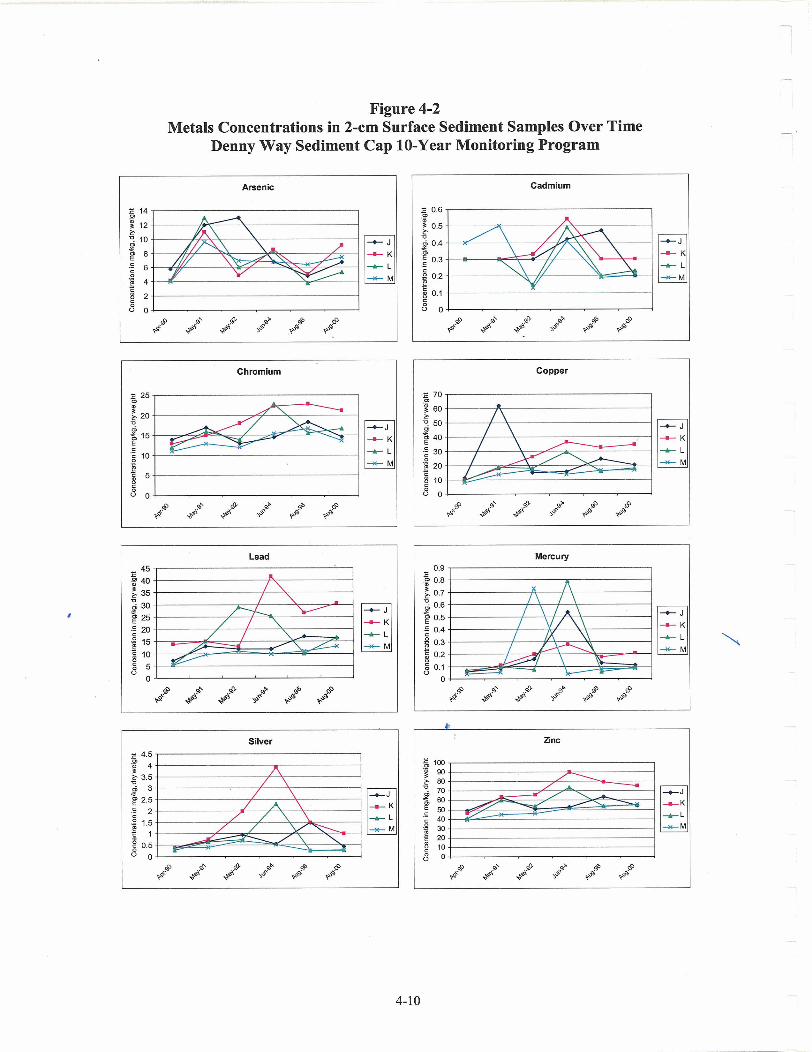
Figure 4-2 Metals Concentrations in 2-cm Surface Sediment Samples Over Time
Denny Way Sediment Cap 10-Year Monitoring Program
Arsenic Cadmium
Copper
Mercury 0.9 1 I i Lead
45 1 I
&
Silver Zinc
g roo
t e 80 a 70 1 ,
9 30 E 20 g 10 8 0
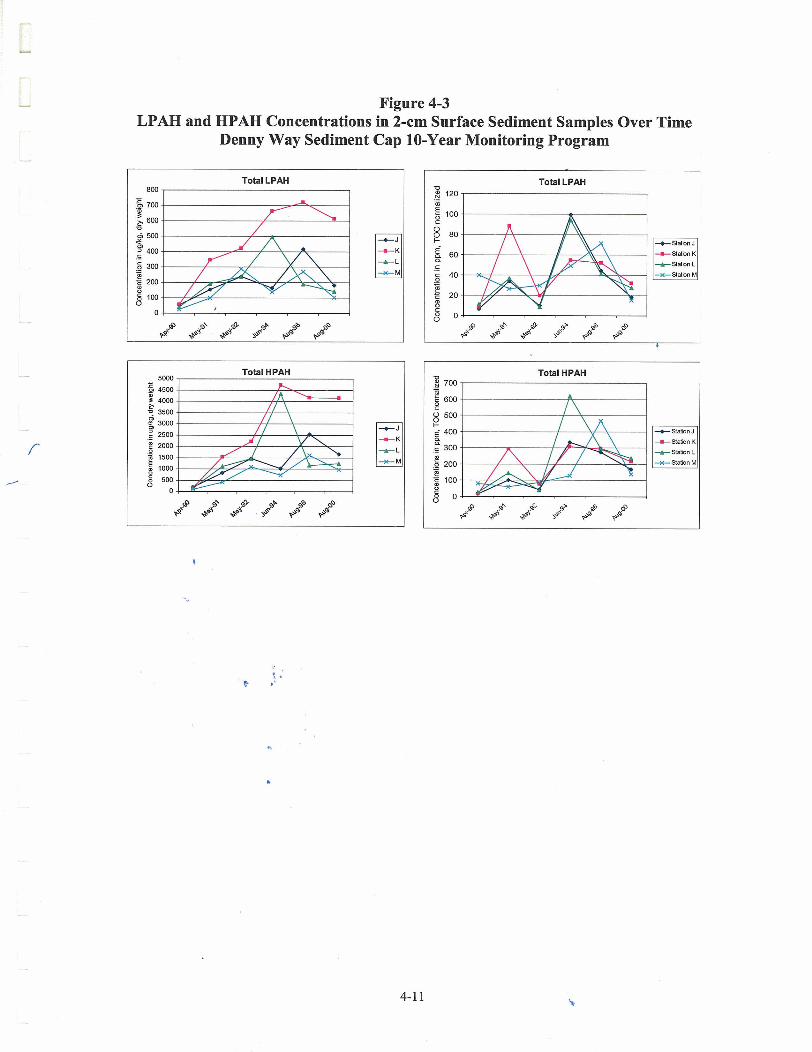
Figure 4-3 LPAH and HPAH Concentrations in 2-cm Surface Sediment Samples Over Time
Denny Way Sediment Cap 10-Year Monitoring Program
Total LPAH 800
5000 Total HPAH -
6 4500 s 4000
? 3500
3000
: 25M) : 2000
1500
j 1000
500
0
T) Total LPAH
,y 120 .- - m
100 C
80
60 -m-satbn K
C .- +Statan L
6 40 .-
20
S 0
Total HPAH
I I

SMS chemical criteria indicate the potential for sediments to cause adverse biological effect when one or more chemicals exceed the criteria values. SMS also uses toxicity testing with sediment bioassays to confirm or refute the chemical designation of sediments. Toxicity testing was first added to the monitoring program in 1996 because SMS chemical criteria were exceeded for benzo(g,h,i)perylene, bis(2-ethylhexyl) phthalate, and mercury (Station L) and benzyl butyl phthalate and bis(2-ethylhexyl) phthalate (Station K) during the 1994 monitoring event. The project review committee requested that toxicity testing be conducted again at these two stations in 2000 because SMS chemical criteria were again exceeded during the 1996 monitoring event and one station failed one of the sediment bioassays.
This section includes a case summary of the 2000 toxicity testing activities including:
summarizing the testing methods; describing control and reference selection and performance; and comparing bioassay results to controllreference results and SMS criteria.
Summaries of the raw data, statistical analyses, statistical transformations, and quality assurance review are included as Appendix D.
5.1 Methods One chronic and two acute bioassays were performed on sediment samples collected August 29,2000 from the 0 to 10-cm depth stratum at Stations K and L (refer to Figure 4-1 in Section 4). Sediment aliquots were collected from the bioassay samples for concurrent chemical analysis. A sediment control sample was collected from West Beach on Whidbey Island and a sediment reference sample was collected from Carr hlet in south Puget Sound. The King County Environmental Laboratory performed the following three sediment bioassays:
amphipod 10-day mortality on Rhepoxynius abronius (acute effects); echinoderm embryo mortality/abnonnality on Dendraster excentricus (acute effects); and juvenile polychaete 20-day growth rate on Neanthes sp. (chronic effects).
These species were selected based on sediment and organism characteristics, including sediment grain size and organism availability. Bioassays were conducted during September and October 2000. All tests were completed within the designated holding time. All methods and protocols PSEP guidance (PSEP, 1995).
5.1.1 Negative arzd Positive Corztrols Negative controls determine whether organisms have an adverse response to clean sediments or water. The negative control sediment for the amphipod mortality and polychaete growth tests was a clean sand sample from West Beach on Whidbey Island. Clean seawater was used as the negative control for the echinoderm embryo mortality test.
Positive controls use a range of concentrations of reference toxicants to determine whether a specific batch of organisms are more or less sensitive than normal to contaminant exposure. The positive control for each of the three bioassay tests used cadmium as the toxicant. The LD50 (Lethal Dose for 50% of organisms) is used as the performance criteria to determine whether organisms are acceptable to perform the bioassay work on test sediments.
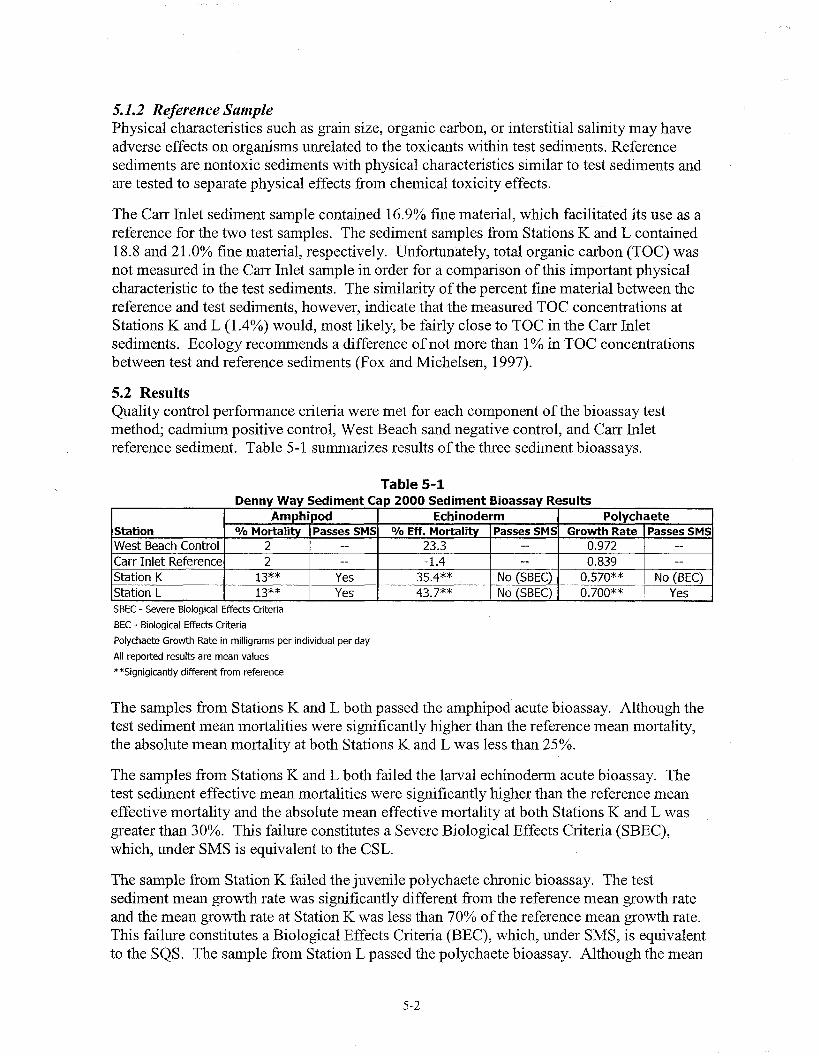
5.1.2 Reference Sample Physical characteristics such as grain size, organic carbon, or interstitial salinity may have adverse effects on organisms unrelated to the toxicants within test sediments. Reference sediments are nontoxic sediments with physical characteristics similar to test sediments and are tested to separate physical effects from chemical toxicity effects.
The Carr Inlet sediment sample contained 16.9% fine material, which facilitated its use as a reference for the two test samples. The sediment samples from Stations K and L contained 18.8 and 21 .O% fine material, respectively. Unfortunately, total organic carbon (TOC) was not measured in the Carr Inlet sample in order for a comparison of this important physical characteristic to the test sediments. The similarity of the percent fine material between the reference and test sediments, however, indicate that the measured TOC concentrations at Stations K and L (1.4%) would, most likely, be fairly close to TOC in the Carr Inlet sediments. Ecology recommends a difference of not more than 1% in TOC concentrations between test and reference sediments (Fox and Michelsen, 1997).
5.2 Results Quality control performance criteria were met for each component of the bioassay test method; cadmium positive control, West Beach sand negative control, and Carr Inlet reference sediment. Table 5-1 summarizes results of the three sediment bioassays.
Table 5-1 Denny Way Sediment Cap 2000 Sediment Bioassay Results
Station
. , Istation L I 13%" yes I 43.7** i NO ~ S B E C ~ i 0.700** i yes I
Amphipod I Echinoderm I Polychaete % Mortality 1 passes SMSI O/O Eff. Mortality 1 passes SMS~ Growth Rate 1 passes SMS
West Beach Control Carr Inlet Reference Station K
SBEC - Severe Biological Effects Criteria
BEC - Biological Effects Criteria
Polychaete Growth Rate in milligrams per individual per day
All reported results are mean values
**Signigicantly different from reference
The samples from Stations K and L both passed the amphipod acute bioassay. Although the test sediment mean mortalities were significantly higher than the reference mean mortality, the absolute mean mortality at both Stations K and L was less than 25%.
2 2
13**
The samples from Stations K and L both failed the larval echinoderm acute bioassay. The test sediment effective mean mortalities were significantly higher than the reference mean effective mortality and the absolute mean effective mortality at both Stations K and L was greater than 30%. This failure constitutes a Severe Biological Effects Criteria (SBEC), which, under SMS is equivalent to the CSL.
The sample from Station K failed the juvenile polychaete chronic bioassay. The test sediment mean growth rate was significantly different from the reference mean growth rate and the mean growth rate at Station K was less than 70% of the reference mean growth rate. This failure constitutes a Biological Effects Criteria (BEC), which, under SMS, is equivalent to the SQS. The sample from Station L passed the polychaete bioassay. Although the mean
-- --
Yes
23.3 -1.4 -------
35.4**
-- --
No (SBEC)
0.972 0.839
0.570**
-- --
No (BECI

growth rate at Station L was significantly different from the reference, the mean growth rate at Station L was greater than 70% of the reference.
5.3 Discussion The significant toxicological responses reported at Stations K and L do not correlate well with the concurrent sediment chemistry data. The only chemical that exceeded a SMS criterion at Station K was bis(2-ethylhexyl) phthalate, detected in the concurrent chemistry sample at a concentration of 112 mg/Kg OC or 1.4 times the CSL. This may look correlative with the SBEC failure of 35.4% amphipod mortality at Station K, however, the amphipod bioassay result does not correlate at all at Station L.
Bis(2-ethylhexyl) phthalate was not detected in the concurrent Station L sample with a blank- adjusted MDL of 45 mg/Kg OC, which is less than the SQS chemical criterion. Reported concentrations of all chemicals in the concurrent Station L sample were, in fact, less than their respective SQS criteria and yet the amphipod bioassay mortality was 43.7% - higher than at Station K. The only SQS chemical criterion exceeded at Station L (out of a total of four samples collected) was in a replicate sample collected from the 0- to 2-cm depth stratum. The concentration of mercury in this sample was 0.433 mg/Kg DW, just slightly higher that the SQS criterion of 0.41 mg/Kg DW. Mercury concentrations in the other three surface samples collected from Station L ranged from 0.093 to 0.17 mg/Kg DW, all well below the SQS criterion.
The single CSL exceedence of bis(2-ethylhexyl) phthalate at Station K is also problematic due to the fact that this chemical was not detected in the two other surface samples collected at this station (MDLs were 25 and 33 mg/Kg OC). This ubiquitous chemical is frequently imparted to samples during sampling activities and laboratory analysis and is often difficult to quantitate effectively in the environment.
Bioassay results fiom the 1996 monitoring event were equally difficult to correlate to chemical concentrations. Station K passed all three bioassays but had concentrations of butyl benzyl phthalate that exceeded the SQS criterion and concentrations of bis(2-ethylhexyl) phthalate that exceeded the CSL criterion. Station L had a SBEC failure of the echinoderm larval bioassay but had no exceedences of SMS chemical criteria.
Two other chemicals that can produce toxic results during sediment bioassays are ammonia and sulfide. Concentrations of these two chemicals were measured at the beginning and end of each bioassay and results showed that levels of both chemicals were low or undetected and well within the QC limits for each bioassay.

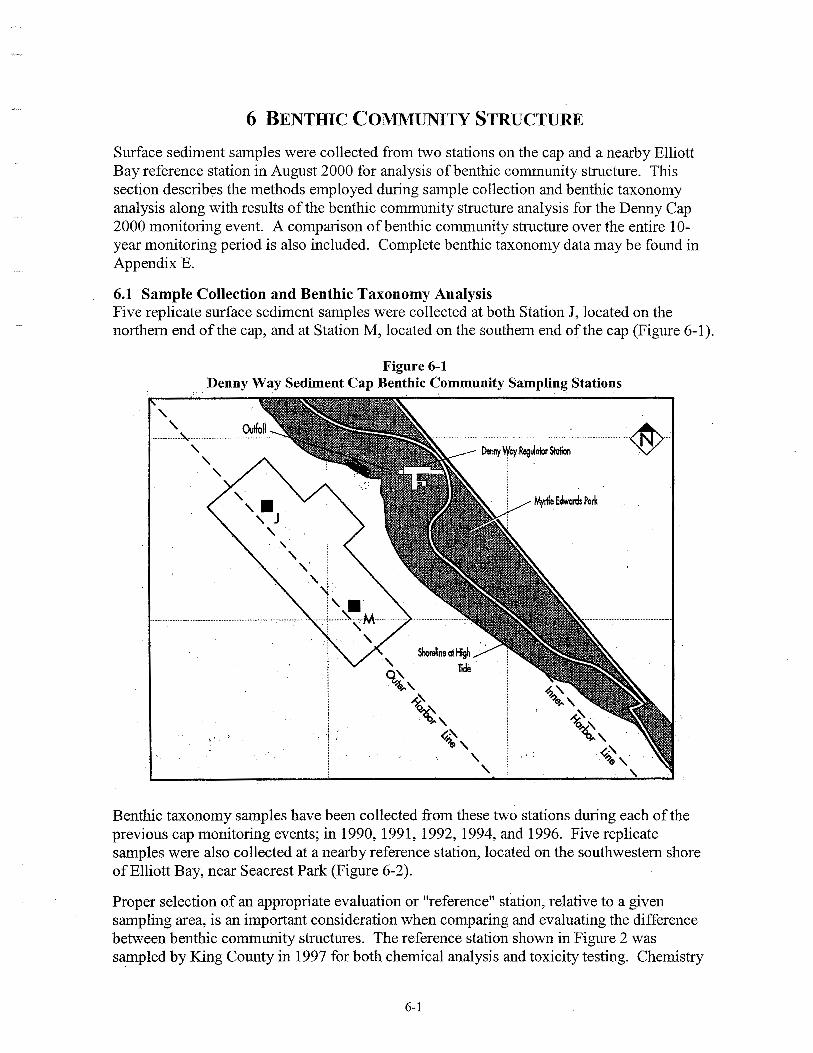
Surface sediment samples were collected from two stations on the cap and a nearby Elliott Bay reference station in August 2000 for analysis of benthic community structure. This section describes the methods employed during sample collection and benthic taxonomy analysis along with results of the benthic community structure analysis for the Denny Cap 2000 monitoring event. A comparison of benthic community structure over the entire 10- year monitoring period is also included. Complete benthic taxonomy data may be found in Appendix E.
6.1 Sample Collection and Benthic Taxonomy Analysis Five replicate surface sediment samples were collected at both Station J, located on the northern end of the cap, and at Station M, located on the southern end of the cap (Figure 6-1).
Figure 6-1 Denny Way Sediment Cap Benthic Community Sampling Stations
Benthic taxonomy samples have been collected fiom these two stations during each of the previous cap monitoring events; in 1990, 1991, 1992, 1994, and 1996. Five replicate samples were also collected at a nearby reference station, located on the southwestern shore of Elliott Bay, near Seacrest Park (Figure 6-2).
Proper selection of an appropriate evaluation or "reference" station, relative to a given sampling area, is an important consideration when comparing and evaluating the difference between benthic community structures. The reference station shown in Figure 2 was sampled by King County in 1997 for both chemical analysis and toxicity testing. Chemistry

results showed only a minor exceedence of the SQS chemical criteria for one chemical, dibenzo(a,h)anthracene. The test sediment passed all three SMS bioassays, indicating that the sediments at this station were not toxic to benthic organisms. This station also has similar physical sediment characteristics to Stations J and M. Results from the sediment chemistry sample (Appendix B) collected concurrently with the benthic community reference sample show that chemical concentrations at the reference station did not exceed SMS criteria for any chemical.
Ef/iott Bay
The benthic taxonomy samples were collected on August 16 and 17,2000 by a benthic taxonomy contractor, assisted by staff of the King County Environmental Laboratory. Surface sediment was collected using two stainless steel, modified, 0.1 m2 Van Veen grab samplers deployed in tandem from the Liberty. Each benthic sample was comprised of the entire contents of one grab. A minimum grab-penetration depth of 9 to 10 centimeters was considered an acceptable benthic sample.
Sediment was immediately sieved through a one-millimeter screen and all material retained on the screen was preserved with a 10% buffered formalin solution and stored in plastic containers labeled both on the outside and inside. Benthic samples were rescreened within 96 hours from the 10% buffered formalin solution to 70% ethanol as recommended by Puget Sound Estuary Program (PSEP) protocols (PSEP, 1987).
Samples were sorted into four major taxonomic groups (Annelida, Crustacea, Mollusca, and miscellaneous taxa) and then identified to the lowest possible taxonomic level. Quality assurance/quality control procedures included resorting 20 percent of each processed sample to check sorting efficiency and five percent of the samples from each major taxonomic group were sent to an independent expert for re-identification, referred to as the validation collection.
6.2 Benthic Community Structure Analysis for the 2000 Cap Monitoring Event The indices shown below were used to analyze benthic community structure and compare results between sampling stations, both on the cap and the nearby Elliott Bay reference station. Results for these indices were also compared to the revised Puget Sound Reference Value Ranges (Ecology, 2003) as an additional indicator of the health of the benthic community on the Denny Way cap.
Total Richness is the average number of identified taxa per 0.1 square meter (the area sampled by a standard Van Veen grab sampler) and is the sum of richness values for the following four major taxonomic classifications; Annelida, Crustacea, Mollusca, and miscellaneous taxa. Total Abundance is the average number of individual organisms per 0.1 square meter and is the sum of abundance values for Annelida, Crustacea, Mollusca, and miscellaneous taxa. Total Biomass is the average combined mass (weight) of all organisms found in a 0.1 square meter sample and is the sum of Annelida, Crustacea, Mollusca, and miscellaneous taxa biomass values. Biomass is expressed in grams per 0.1 square meter (gl0.1 m2) Shannon-Wiener Diversity Index is a measure of the relationship between taxa richness and abundance. An increasing Shannon-Wiener value indicates a benthic community that is becoming more diverse. Pielou's Evenness Index is expressed as the observed diversity in a sample as a proportion of the maximum possible diversity. An increasing Pielou's value, leading to a maximum possible value of 1.0, also indicates increasingly greater diversity of the benthic community. Swartz's Dominance Index is defined as the minimum number of species comprising 75% of the total abundance in a given sample. An increasing Swartz's value indicates greater diversity as well.

All of these indices have been calculated based on averages from the five replicate samples collected at each station. Table 6-1 summarizes the indices for Stations J and M, as well as the reference station, and presents this information along with a summary of each station's physical sediment characteristics and dominant species. Organisms that cannot be enumerated, such as colonial fauna, and organisms that are not normally infaunal but, rather, "contaminants" from the water column above the sediment surface were evaluated and removed from the species list prior to analysis of the benthic community structure.
6.2.1 Richness Average total richness values for Stations J.and M in 2000 were 104 and 102 species, respectively. In comparison, average total richness for the reference station was 11 1 species. Figure 6-3 shows the distribution of species at the three stations.
Figure 6-3 Benthic Richness for the 2000 Denny Cap Monitoring Event
Station J Station M Reference
I BAnnelida 13 Crustacea Mollusca Misc. Taxa I
Taxa of the phylum Annelids, the segmented worms, accounted for slightly more than half of the enumerated species at all three stations. The dominant annelid at both Stations J and M was Exogone lourei, which represented 10.0 and 12.8% of the average total abundance, respectively. E. lourei was present at the reference station, however, this species represented only 1 .O% of the average total abundance there. The dominant annelid at the reference station was Prionospio steenstrupi, representing 6.1 % of the average total abundance. Although annelid species represented greater than half of the average total abundance at all three stations, no single annelid species was the dominant organism at any of the stations.
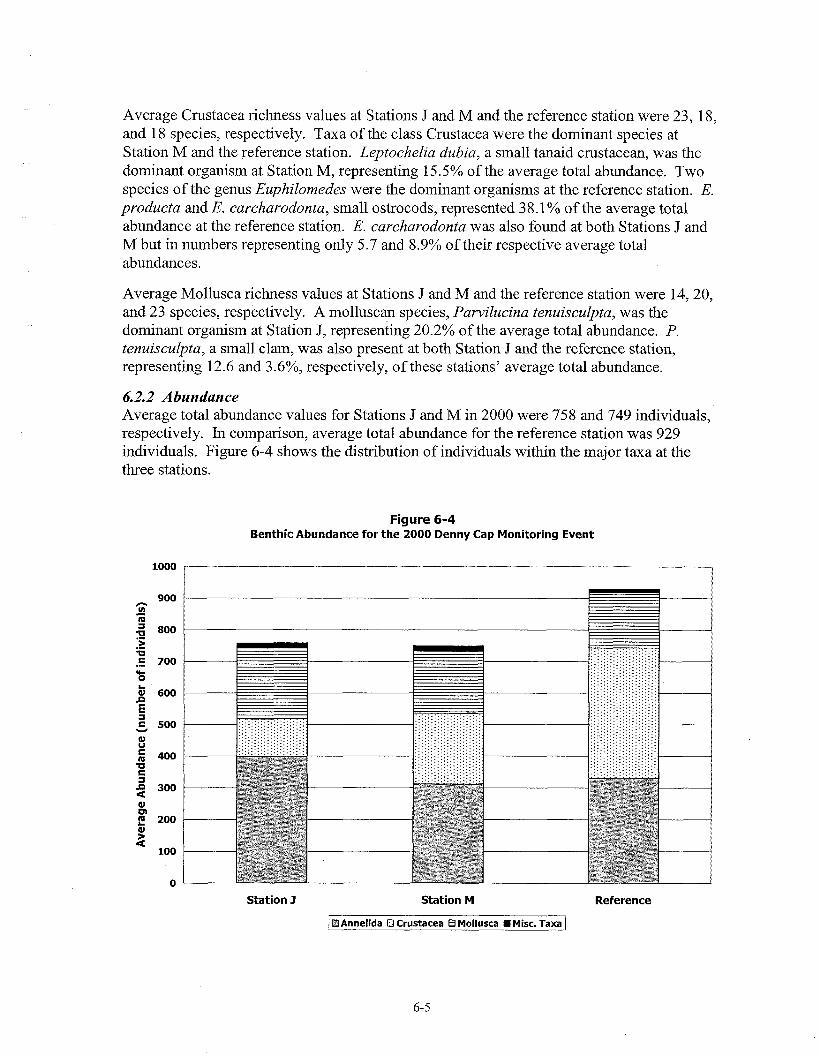
Average Crustacea richness values at Stations J and M and the reference station were 23, 18, and 18 species, respectively. Taxa of the class Crustacea were the dominant species at Station M and the reference station. Leptochelia dubia, a small tanaid crustacean, was the dominant organism at Station M, representing 15.5% of the average total abundance. Two species of the genus Euphilomedes were the dominant organisms at the reference station. E. producta and E. carcharodonta, small ostrocods, represented 38.1% of the average total abundance at the reference station. E. carcharodonta was also found at both Stations J and M but in numbers representing only 5.7 and 8.9% of their respective average total abundances.
Average Mollusca richness values at Stations J and M and the reference station were 14,20, and 23 species, respectively. A molluscan species, Pawilucina tenuisculpta, was the dominant organism at Station J, representing 20.2% of the average total abundance. P. tenuisculpta, a small clam, was also present at both Station J and the reference station, representing 12.6 and 3.6%, respectively, of these stations' average total abundance.
6.2.2 Abundance Average total abundance values for Stations J and M in 2000 were 758 and 749 individuals, respectively. In comparison, average total abundance for the reference station was 929 individuals. Figure 6-4 shows the distribution of individuals within the major taxa at the three stations.
Figure 6-4 Benthic Abundance for the 2000 Denny Cap Monitoring Event
Station J Station M Reference
/ 8Annelida Crustacea Mollusca . Misc. Taxa I
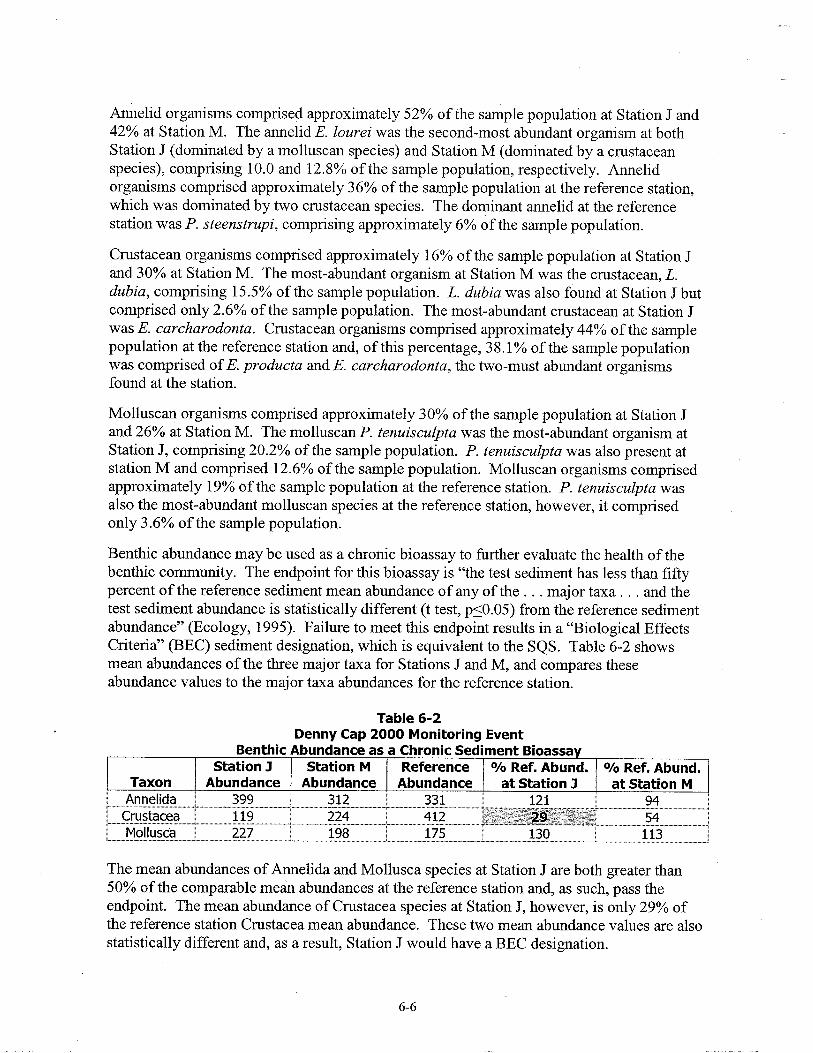
Annelid organisms comprised approximately 52% of the sample population at Station J and 42% at Station M. The annelid E. lourei was the second-most abundant organism at both Station J (dominated by a molluscan species) and Station M (dominated by a crustacean species), comprising 10.0 and 12.8% of the sample population, respectively. Annelid organisms comprised approximately 36% of the sample population at the reference station, which was dominated by two crustacean species. The dominant annelid at the reference station was P. steenstrupi, comprising approximately 6% of the sample population.
Crustacean organisms comprised approximately 16% of the sample population at Station J and 30% at Station M. The most-abundant organism at Station M was the crustacean, L. dubia, comprising 15.5% of the sample population. L. dubia was also found at Station J but comprised only 2.6% of the sample population. The most-abundant crustacean at Station J was E. carcharodonta. Crustacean organisms comprised approximately 44% of the sample population at the reference station and, of this percentage, 38.1% of the sample population was comprised of E. producta and E. carcharodonta, the two-must abundant organisms found at the station.
Molluscan organisms comprised approximately 30% of the sample population at Station J and 26% at Station M. The molluscan P. tenuisculpta was the most-abundant organism at Station J, comprising 20.2% of the sample population. P. tenuisculpta was also present at station M and comprised 12.6% of the sample population. Molluscan organisms comprised approximately 19% of the sample population at the reference station. P. tenuisculpta was also the most-abundant molluscan species at the reference station, however, it comprised only 3.6% of the sample population.
Benthic abundance may be used as a chronic bioassay to further evaluate the health of the benthic community. The endpoint for this bioassay is "the test sediment has less than fifty percent of the reference sediment mean abundance of any of the . . . major taxa . . . and the test sediment abundance is statistically different (t test, ~50.05) from the reference sediment abundance" (Ecology, 1995). Failure to meet this endpoint results in a "Biological Effects Criteria" (BEC) sediment designation, which is equivalent to the SQS. Table 6-2 shows mean abundances of the three major taxa for Stations J and M, and compares these abundance values to the major taxa abundances for the reference station.
Table 6-2 Denny Cap 2000 Monitoring Event
Benthic Abundance as a Chronic Sediment Bioassay I Station J I Station M I Reference I O/O Ref. Abund. I 010 Ref. Abund. I
The mean abundances of Annelida and Mollusca species at Station J are both greater than 50% of the comparable mean abundances at the reference station and, as such, pass the endpoint. The mean abundance of Crustacea species at Station J, however, is only 29% of the reference station Crustacea mean abundance. These two mean abundance values are also statistically different and, as a result, Station J would have a BEC designation.
The mean abundances of the three major taxa at Station M are all greater than 50% of the comparable reference station mean abundances. As a result, Station M would pass the benthic abundance chronic bioassay.
6.2.3 Biomass Average total biomass values for Stations J and M in 2000 were 8.16 and 5.58 gl0.1 m2, respectively. Approximately 90% of the average total biomass at both Stations J and M was comprised of the combined biomass of Annelida and Mollusca species. The average total biomass value for the reference station was 7.56 gl0.1 m2, with the combined Annelida and Mollusca biomass again comprising approximately 90% of the total biomass. Figure 6-5 shows the distribution of major taxa biomass at the three stations.
Figure 6-5 Benthic Biomass for the 2000 Denny Cap Monitoring Event
i j
Station J Station M Reference
I Annelida II Crustacea Mollusca W Misc. Taxa 1
6.2.4 Diversity Indices The Shannon-Wiener index is one of the most widely-used diversity indices due to its ease of calculation and its relative independence of sample size. This index uses the total number of species in a sample as well as the abundance of single species to determine diversity. Shannon-Wiener diversity values for Stations J and M were 4.99 and 4.88, respectively. The Shannon-Wiener diversity value for the reference station was 4.91. All three values are within the revised Puget Sound Reference Value Range (RVR) of 3.32 to 5.3 12.
Pielou's Evenness index is another measure of diversity that is commonly used in conjunction with the Shannon-Wiener index. Evenness is a measure of the observed
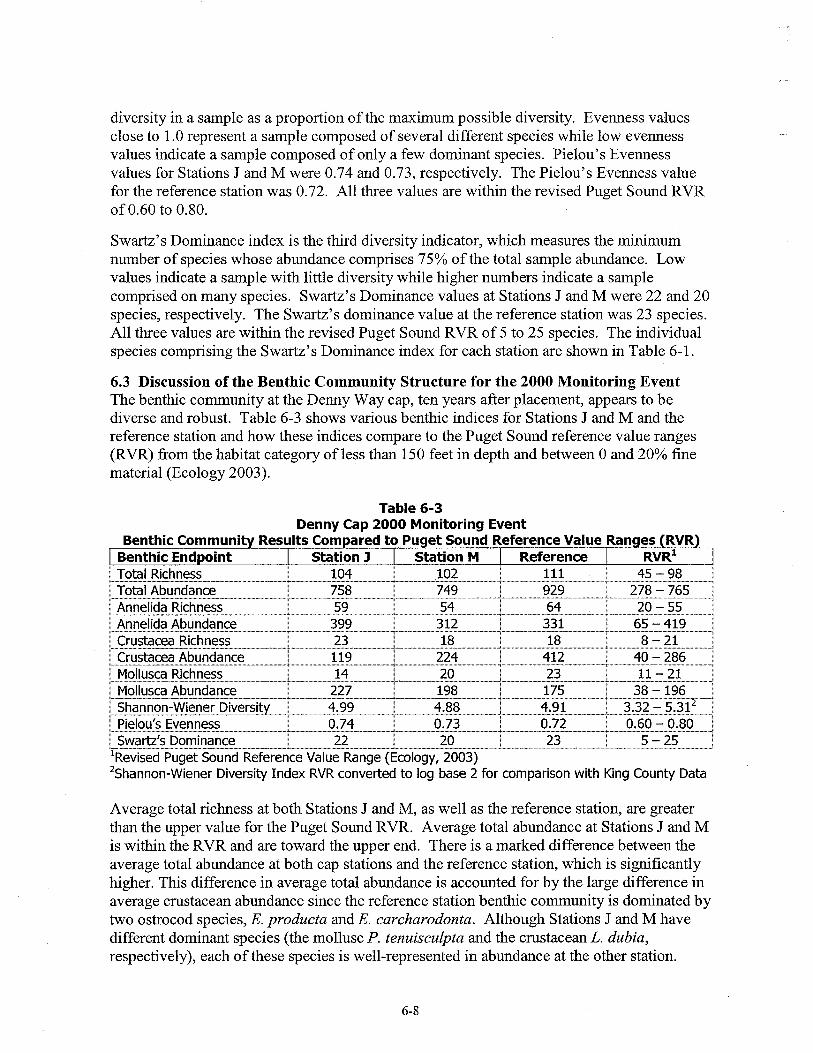
diversity in a sample as a proportion of the maximum possible diversity. Evenness values close to 1.0 represent a sample composed of several different species while low evenness values indicate a sample composed of only a few dominant species. Pielou's Evenness values for Stations J and M were 0.74 and 0.73, respectively. The Pielou's Evenness value for the reference station was 0.72. All three values are within the revised Puget Sound RVR of 0.60 to 0.80.
Swartz's Dominance index is the third diversity indicator, which measures the minimum number of species whose abundance comprises 75% of the total sample abundance. Low values indicate a sample with little diversity while higher numbers indicate a sample comprised on many species. Swartz's Dominance values at Stations J and M were 22 and 20 species, respectively. The Swartz's dominance value at the reference station was 23 species. All three values are within the revised Puget Sound RVR of 5 to 25 species. The individual species comprising the Swartz's Dominance index for each station are shown in Table 6-1.
6.3 Discussion of the Benthic Community Structure for the 2000 Monitoring Event The benthic community at the Denny Way cap, ten years after placement, appears to be diverse and robust. able 6-3 shows various benthic indices for Stations J aid M and the reference station and how these indices compare to the Puget Sound reference value ranges (RVR) fiom the habitat category of less than 150 feet in depth and between 0 and 20% fine material (Ecology 2003).
Table 6-3 Dennv C ~ D 2000 Monitoring Event
nnelida Richness
'~evised Puget Sound Reference Value Range (Ecology, 2003) '~hannon-wiener Diversity Index RVR converted to log base 2 for comparison with King County Data
Average total richness at both Stations J and M, as well as the reference station, are greater than the upper value for the Puget Sound RVR. Average total abundance at Stations J and M is within the RVR and are toward the upper end. There is a marked difference between the average total abundance at both cap stations and the reference station, which is significantly higher. This difference in average total abundance is accounted for by the large difference in average crustacean abundance since the reference station benthic community is dominated by two ostrocod species, E. producta and E. carchavodonta. Although Stations J and M have different dominant species (the mollusc P. tenuisculpta and the crustacean L. dubia, respectively), each of these species is well-represented in abundance at the other station.
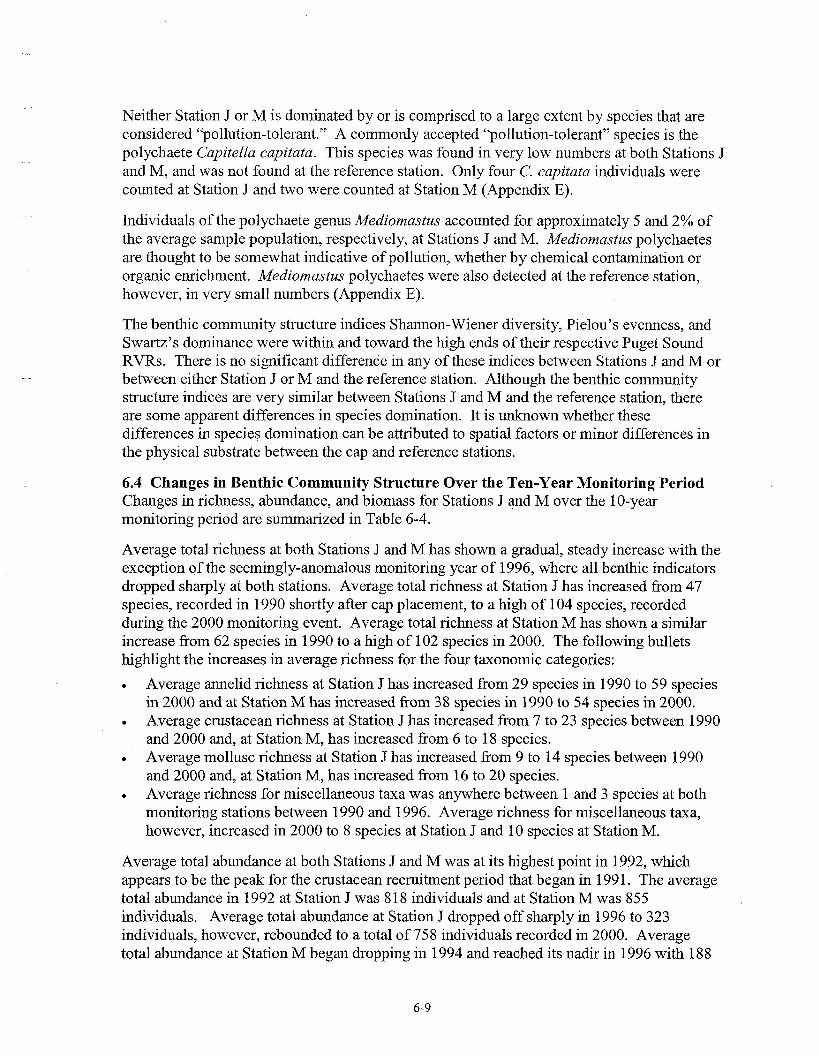
Neither Station J or M is dominated by or is comprised to a large extent by species that are considered "pollution-tolerant." A commonly accepted "pollution-tolerant" species is the polychaete Capitella capitata. This species was found in very low numbers at both Stations J and My and was not found at the reference station. Only four C. capitata individuals were counted at Station J and two were counted at Station M (Appendix E).
Individuals of the polychaete genus Mediomastus accounted for approximately 5 and 2% of the average sample population, respectively, at Stations J and M. Mediomastus polychaetes are thought to be somewhat indicative of pollution, whether by chemical contamination or organic enrichment. Mediomastus polychaetes were also detected at the reference station, however, in very small numbers (Appendix E).
The benthic community structure indices Shannon-Wiener diversity, Pielou's evenness, and Swartz's dominance were within and toward the high ends of their respective Puget Sound RVRs. There is no significant difference in any of these indices between Stations J and M or between either Station J or M and the reference station. Although the benthic community structure indices are very similar between Stations J and M and the reference station, there are some apparent differences in species domination. It is unknown whether these differences in species domination can be attributed to spatial factors or minor differences in the physical substrate between the cap and reference stations.
6.4 Changes in Benthic Community Structure Over the Ten-Year Monitoring Period Changes in richness, abundance, and biomass for Stations J and M over the 10-year monitoring period are summarized in Table 6-4.
Average total richness at both Stations J and M has shown a gradual, steady increase with the exception of the seemingly-anomalous monitoring year of 1996, where all benthic indicators dropped sharply at both stations. Average total richness at Station J has increased from 47 species, recorded in 1990 shortly after cap placement, to a high of 104 species, recorded during the 2000 monitoring event. Average total richness at Station M has shown a similar increase from 62 species in 1990 to a high of 102 species in 2000. The following bullets highlight the increases in average richness for the four taxonomic categories:
Average annelid richness at Station J has increased from 29 species in 1990 to 59 species in 2000 and at Station M has increased from 38 species in 1990 to 54 species in 2000. Average crustacean richness at Station J has increased from 7 to 23 species between 1990 and 2000 and, at Station My has increased from 6 to 18 species. Average mollusc richness at Station J has increased from 9 to 14 species between 1990 and 2000 and, at Station M, has increased from 16 to 20 species. Average richness for miscellaneous taxa was anywhere between 1 and 3 species at both monitoring stations between 1990 and 1996. Average richness for miscellaneous taxa, however, increased in 2000 to 8 species at Station J and 10 species at Station M.
Average total abundance at both Stations J and M was at its highest point in 1992, which appears to be the peak for the crustacean recruitment period that began in 1991. The average total abundance in 1992 at Station J was 818 individuals and at Station M was 855 individuals. Average total abundance at Station J dropped off sharply in 1996 to 323 individuals, however, rebounded to a total of 758 individuals recorded in 2000. Average total abundance at Station M began dropping in 1994 and reached its nadir in 1996 with 188
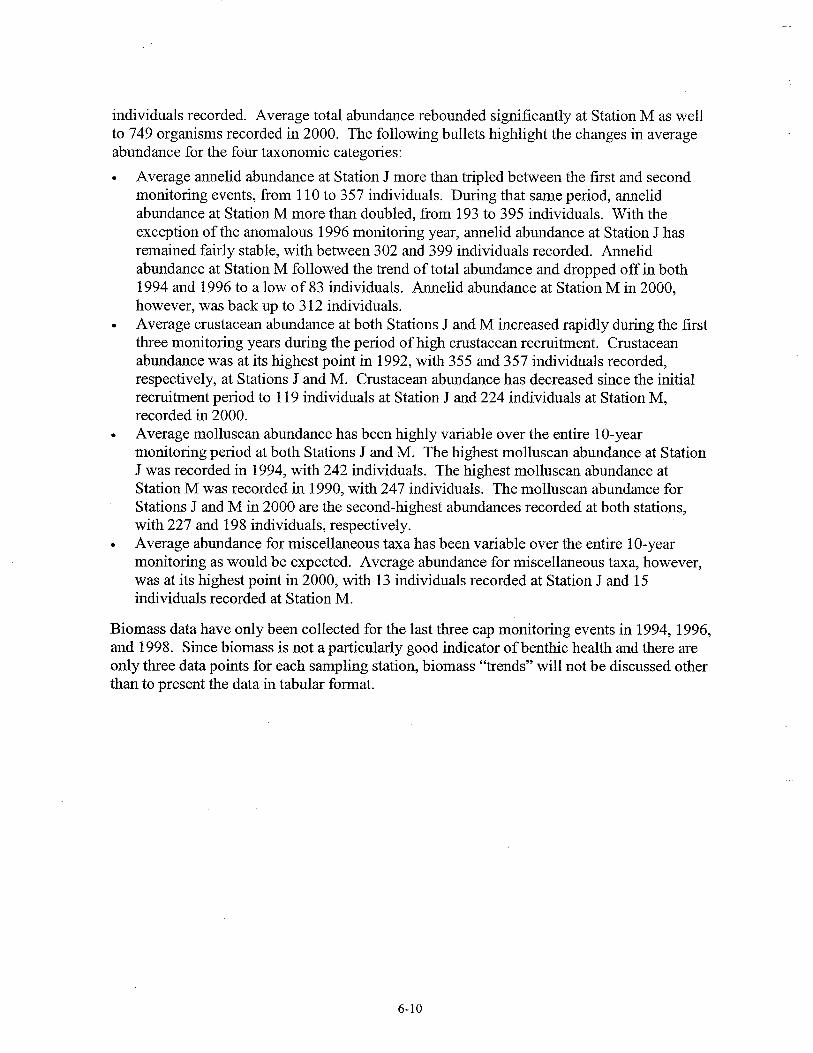
individuals recorded. Average total abundance rebounded significantly at Station M as well to 749 organisms recorded in 2000. The following bullets highlight the changes in average abundance for the four taxonomic categories:
Average annelid abundance at Station J more than tripled between the first and second monitoring events, fiom 110 to 357 individuals. During that same period, annelid abundance at Station M more than doubled, from 193 to 395 individuals. With the exception of the anomalous 1996 monitoring year, annelid abundance at Station J has remained fairly stable, with between 302 and 399 individuals recorded. Annelid abundance at Station M followed the trend of total abundance and dropped off in both 1994 and 1996 to a low of 83 individuals. Annelid abundance at Station M in 2000, however, was back up to 3 12 individuals. Average crustacean abundance at both Stations J and M increased rapidly during the first three monitoring years during the period of high crustacean recruitment. Crustacean abundance was at its highest point in 1992, with 355 and 357 individuals recorded, respectively, at Stations J and M. Crustacean abundance has decreased since the initial recruitment period to 119 individuals at Station J and 224 individuals at Station M, recorded in 2000. Average molluscan abundance has been highly variable over the entire 10-year monitoring period at both Stations J and M. The highest molluscan abundance at Station J was recorded in 1994, with 242 individuals. The highest molluscan abundance at Station M was recorded in 1990, with 247 individuals. The molluscan abundance for Stations J and M in 2000 are the second-highest abundances recorded at both stations, with 227 and 198 individuals, respectively. Average abundance for miscellaneous taxa has been variable over the entire 10-year monitoring as would be expected. Average abundance for miscellaneous taxa, however, was at its highest point in 2000, with 13 individuals recorded at Station J and 15 individuals recorded at Station M.
Biomass data have only been collected for the last three cap monitoring events in 1994, 1996, and 1998. Since biomass is not a particularly good indicator of benthic health and there are only three data points for each sampling station, biomass "trends" will not be discussed other than to present the data in tabular format.
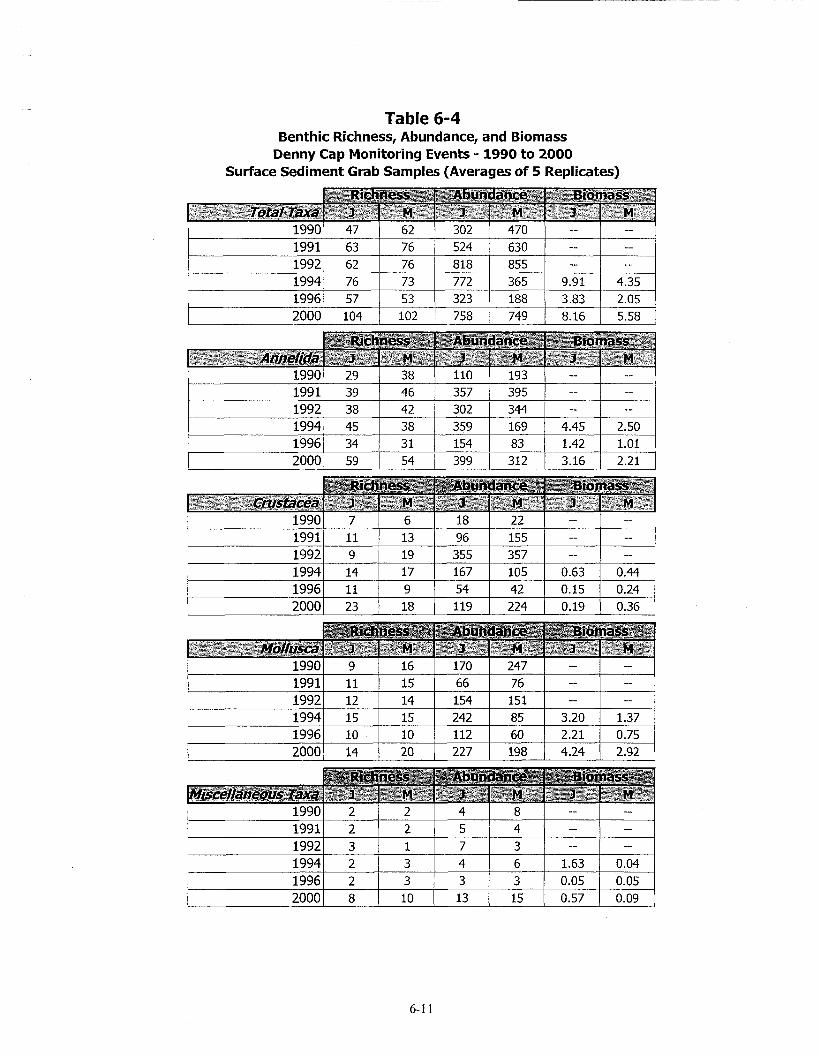
Table 6-4 Benthic Richness, Abundance, and Biomass
Denny Cap Monitoring Events - 1990 to 2000 Surface Sediment Grab Samples (Averages of 5 Replicates)
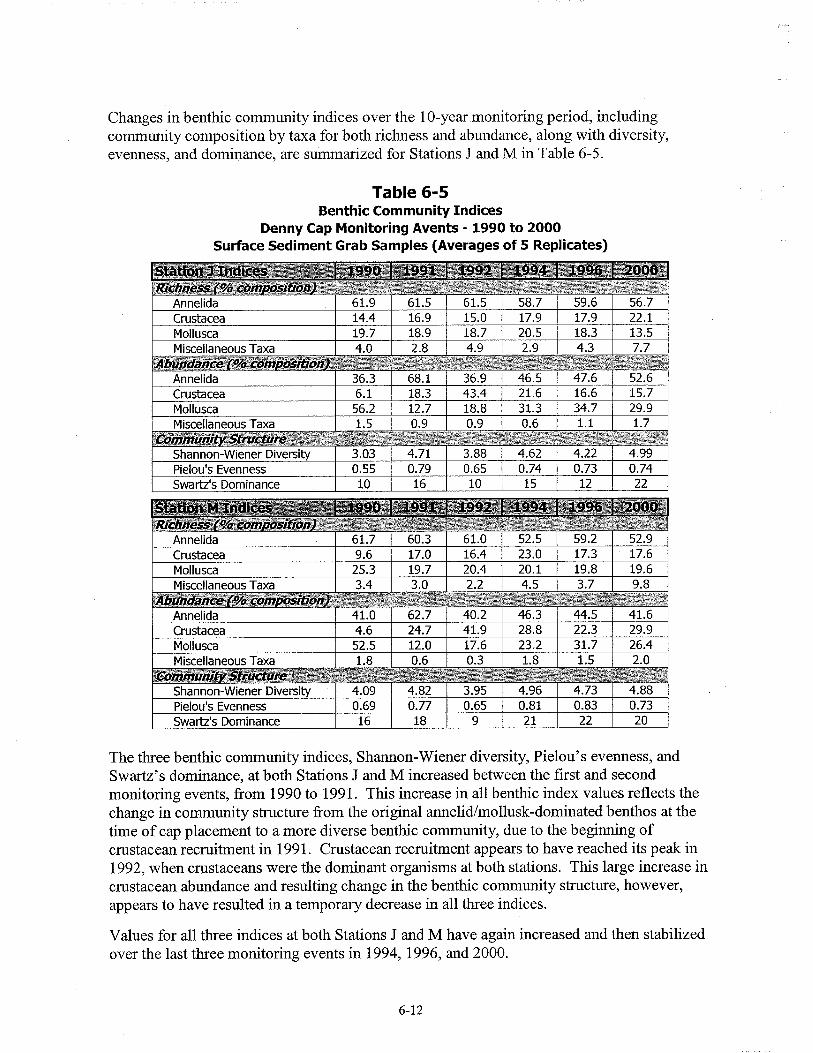
Changes in benthic community indices over the 10-year monitoring period, including community composition by taxa for both richness and abundance, along with diversity, evenness, and dominance, are summarized for Stations J and M in Table 6-5.
Table 6-5 Benthic Community Indices
Denny Cap Monitoring Avents - 1990 to 2000 Surface Sediment Grab Samples (Averages of 5 Replicates)
The three benthic community indices, Shannon-Wiener diversity, Pielou's evenness, and Swartz's dominance, at both Stations J and M increased between the first and second monitoring events, from 1990 to 1991. This increase in all benthic index values reflects the change in community structure from the original annelid/mollusk-dominated benthos at the time of cap placement to a more diverse benthic community, due to the beginning of crustacean recruitment in 1991. Crustacean recruitment appears to have reached its peak in 1992, when crustaceans were the dominant organisms at both stations. This large increase in crustacean abundance and resulting change in the benthic community structure, however, appears to have resulted in a temporary decrease in all three indices.
Shannon-Wiener Diversity
Values for all three indices at both Stations J and M have again increased and then stabilized over the last three monitoring events in 1994, 1996, and 2000.
Pielou's Evenness Swartz's Dominance
0.69 16
0.77 18
0.65 9
0.81 21
0.83 22
0.73 20
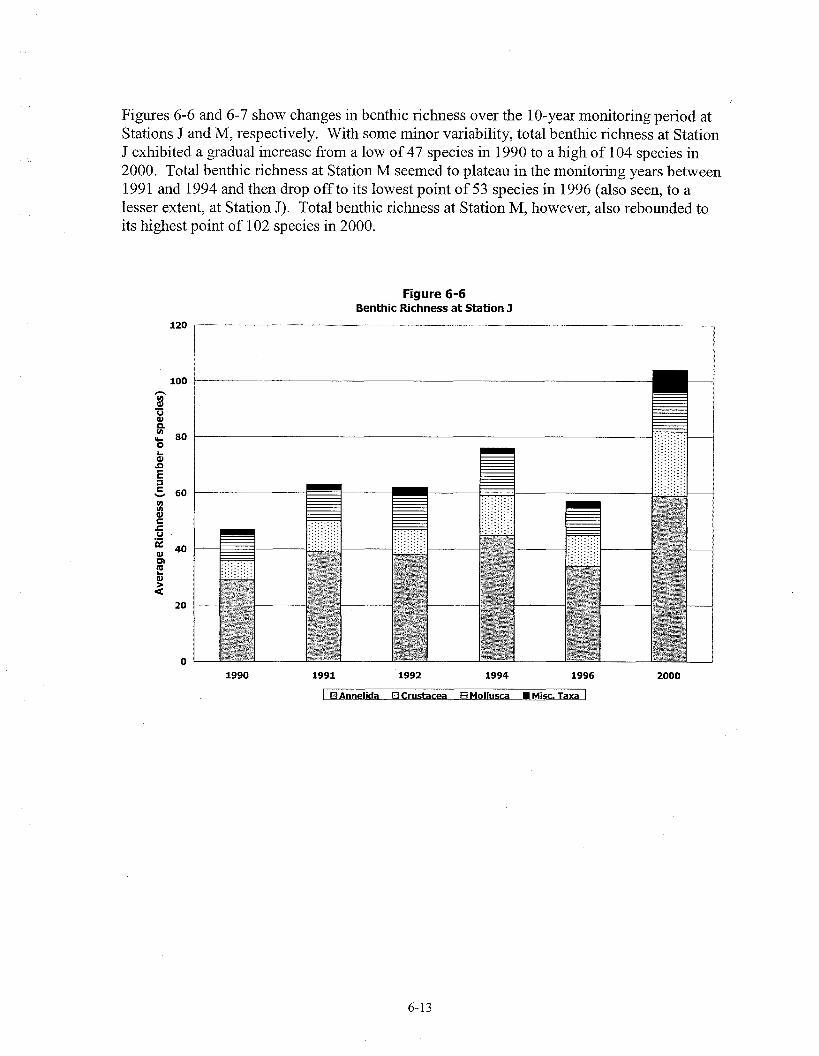
Figures 6-6 and 6-7 show changes in benthic richness over the 10-year monitoring period at Stations J and M, respectively. With some minor variability, total benthic richness at Station J exhibited a gradual increase from a low of 47 species in 1990 to a high of 104 species in 2000. Total benthic richness at Station M seemed to plateau in the monitoring years between 1991 and 1994 and then drop off to its lowest point of 53 species in 1996 (also seen, to a lesser extent, at Station J). Total benthic richness at Station M, however, also rebounded to its highest point of 102 species in 2000.
Figure 6-6 Benthic Richness at Station 3
F ~ G e l i d a Crustacea 9 Mollusca H Mix. Taxa 1
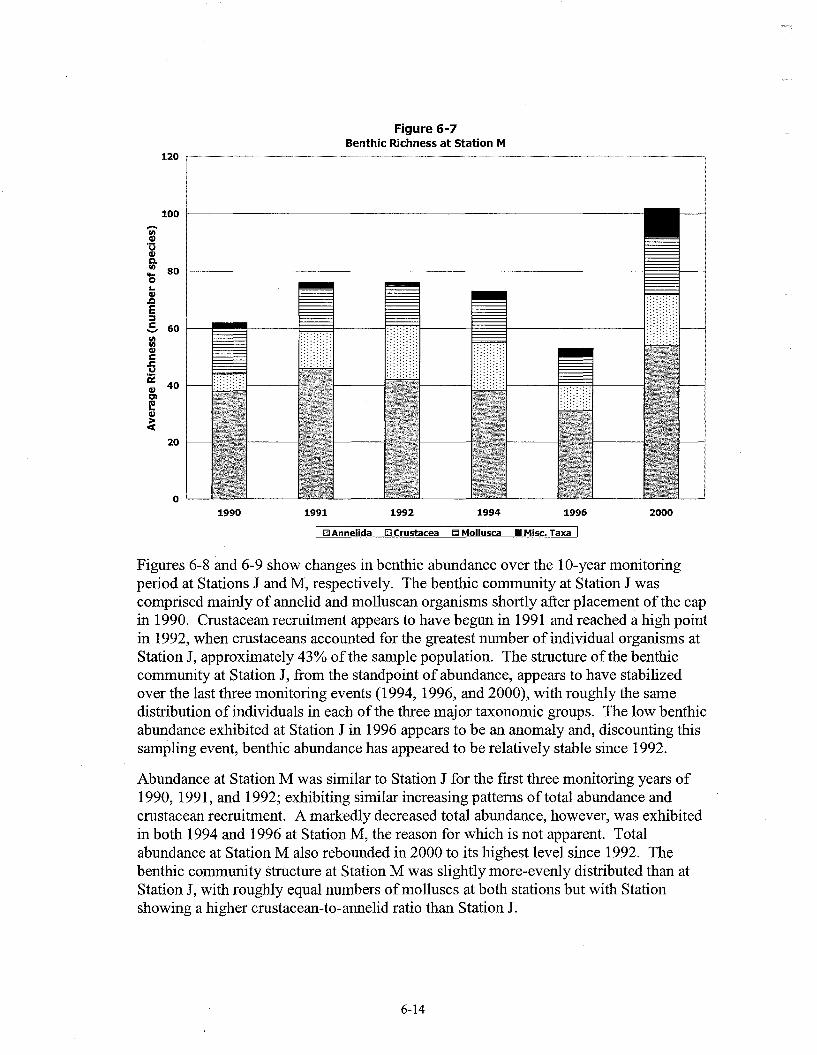
Figure 6-7 Benthic Richness at Station M
120 --. . -. . - ,- - --.-"..a,-. -- --- , ,, ,
I
/ Annelida C3 Crustacea E Mollusca W Misc. Taxa 1
Figures 6-8 and 6-9 show changes in benthic abundance over the 10-year monitoring period at Stations J and M, respectively. The benthic community at Station J was comprised mainly of annelid and molluscan organisms shortly after placement of the cap in 1990. Crustacean recruitment appears to have begun in 1991 and reached a high point in 1992, when crustaceans accounted for the greatest number of individual organisms at Station J, approximately 43% of the sample population. The structure of the benthic community at Station J, fi-om the standpoint of abundance, appears to have stabilized over the last three monitoring events (1994, 1996, and 2000), with roughly the same distribution of individuals in each of the three major taxonomic groups. The low benthic abundance exhibited at Station J in 1996 appears to be an anomaly and, discounting this sampling event, benthic abundance has appeared to be relatively stable since 1992.
Abundance at Station M was similar to Station J for the first three monitoring years of 1990, 199 1, and 1992; exhibiting similar increasing patterns of total abundance and crustacean recruitment. A markedly decreased total abundance, however, was exhibited in both 1994 and 1996 at Station M, the reason for which is not apparent. Total abundance at Station M also rebounded in 2000 to its highest level since 1992. The benthic community structure at Station M was slightly more-evenly distributed than at Station J, with roughly equal numbers of molluscs at both stations but with Station showing a higher crustacean-to-annelid ratio than Station J.
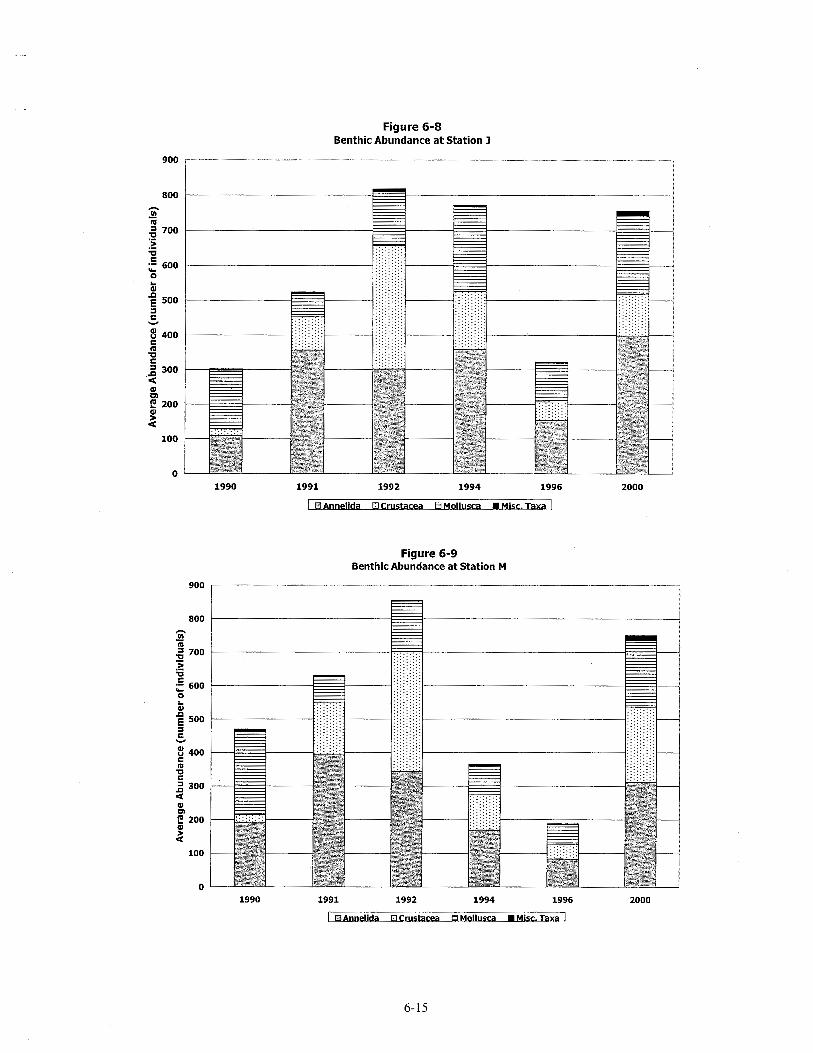
Figure 6-8 Benthic Abundance a t Station J
900
1990 1991 1992 1994 1996
/ i3 Annelida Crustacea Mdlusca Misc. Taxa 1
Figure 6-9 Benthic Abundance at Station M
1990 1991 1992 1994 1996 2000
1 eAnnelida oCxm&xea Mollusca W Misc. Taxa 1
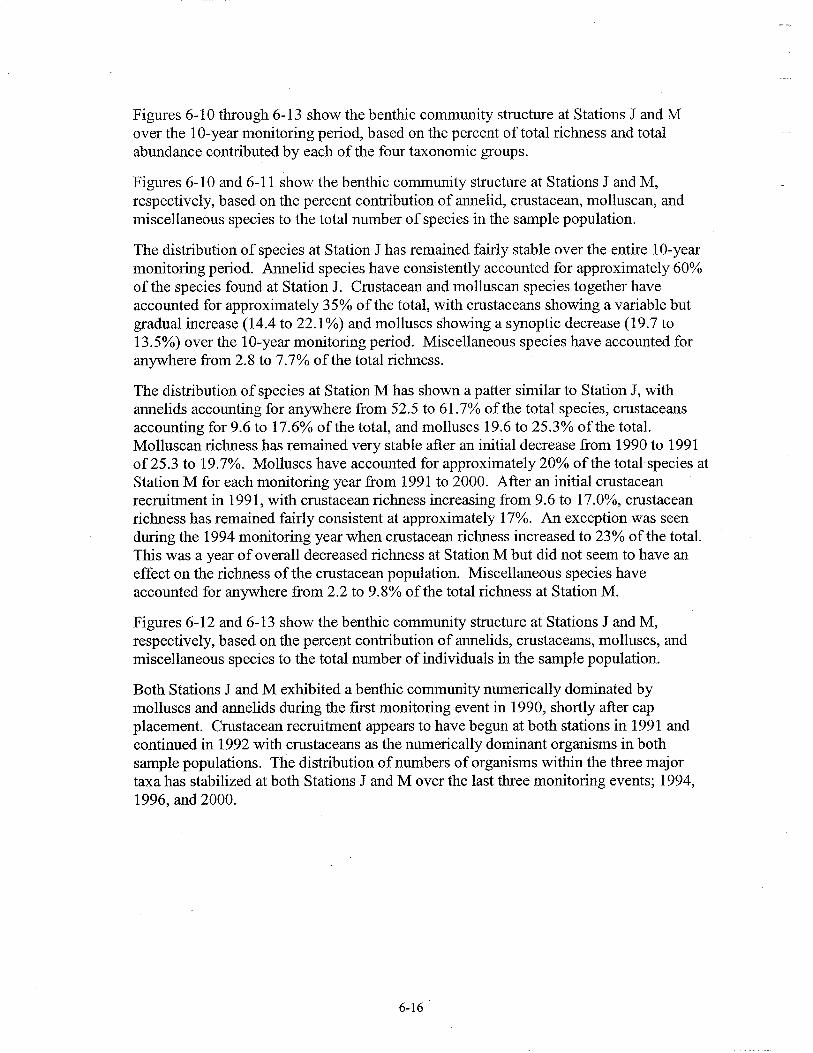
Figures 6-1 0 through 6- 13 show the benthic community structure at Stations J and M over the 10-year monitoring period, based on the percent of total richness and total abundance contributed by each of the four taxonomic groups.
Figures 6-10 and 6-1 1 show the benthic community structure at Stations J and M, respectively, based on the percent contribution of annelid, crustacean, molluscan, and miscellaneous species to the total number of species in the sample population.
The distribution of species at Station J has remained fairly stable over the entire 10-year monitoring period. Annelid species have consistently accounted for approximately 60% of the species found at Station J. Crustacean and molluscan species together have accounted for approximately 35% of the total, with crustaceans showing a variable but gradual increase (14.4 to 22.1%) and molluscs showing a synoptic decrease (19.7 to 13.5%) over the 10-year monitoring period. Miscellaneous species have accounted for anywhere from 2.8 to 7.7% of the total richness.
The distribution of species at Station M has shown a patter similar to Station J, with annelids accounting for anywhere from 52.5 to 61.7% of the total species, crustaceans accounting for 9.6 to 17.6% of the total, and molluscs 19.6 to 25.3% of the total. Molluscan richness has remained very stable after an initial decrease from 1990 to 1991 of 25.3 to 19.7%. Molluscs have accounted for approximately 20% of the total species at Station M for each monitoring year from 1991 to 2000. After an initial crustacean recruitment in 1991, with crustacean richness increasing from 9.6 to 17.0%, crustacean richness has remained fairly consistent at approximately 17%. An exception was seen during the 1994 monitoring year when crustacean richness increased to 23% of the total. This was a year of overall decreased richness at Station M but did not seem to have an effect on the richness of the crustacean population. Miscellaneous species have accounted for anywhere from 2.2 to 9.8% of the total richness at Station M.
Figures 6-12 and 6-13 show the benthic community structure at Stations J and M, respectively, based on the percent contribution of annelids, crustaceans, molluscs, and miscellaneous species to the total number of individuals in the sample population.
Both Stations J and M exhibited a benthic community numerically dominated by molluscs and annelids during the first monitoring event in 1990, shortly after cap placement. Crustacean recruitment appears to have begun at both stations in 1991 and continued in 1992 with crustaceans as the numerically dominant organisms in both sample populations. The distribution of numbers of organisms within the three major taxa has stabilized at both Stations J and M over the last three monitoring events; 1994, 1996, and 2000.
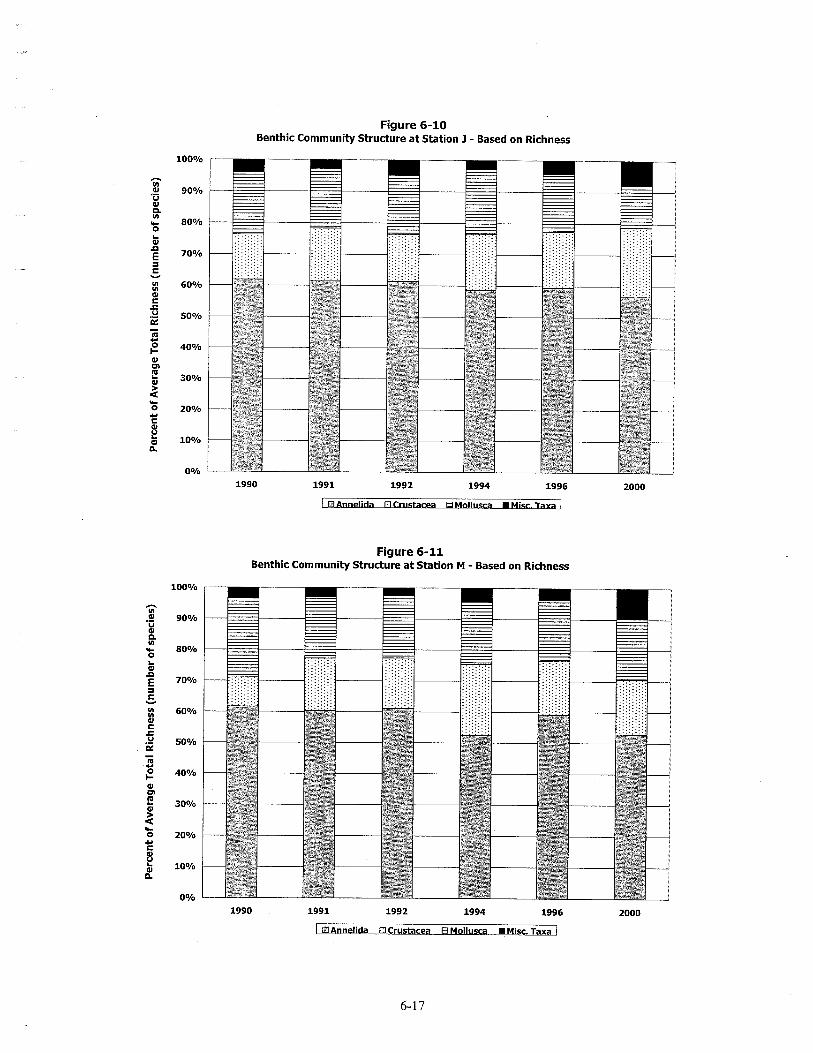
Figure 6-10 Benthic Community Structure at Station 3 - Based on Richness
Figure 6-11 Benthic Community Structure a t Station M - Based on Richness
IB Annelida Crustam E Mollusca . Misc. Taxa
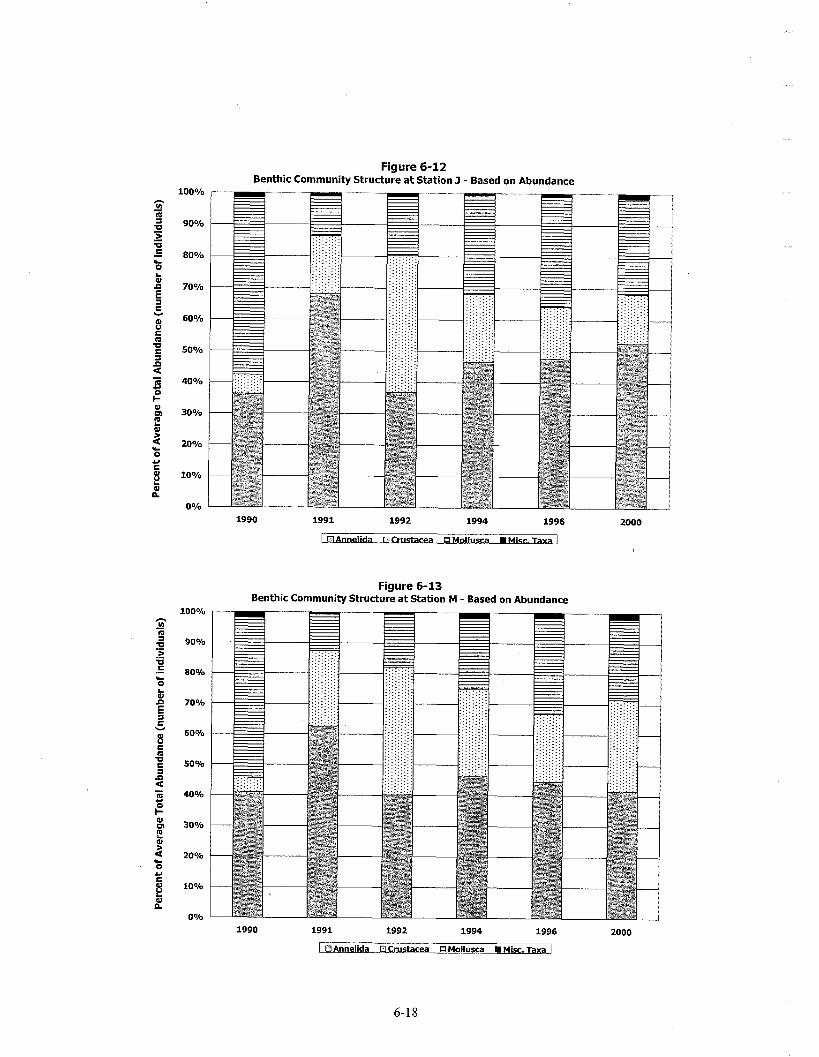
Figure 6-12 Benthic Community Structure at Station J - Based on Abundance
Figure 6-13 Benthic Community Structure at Station M - Based on Abundance
1990 1991 1992 1994 1996 2000
1 0 Annelida Cwstacea Mollusca . Misc. Taxa 1

7 SUMMARY AND CONCLUSIONS The 2000 Denny Way sediment cap monitoring event was the final round of sampling for the 10-year monitoring program. The 2000 monitoring event included measurement of cap thickness, collection of sediment cores for chemical analysis, and the collection of surface sediment samples for chemical analysis, toxicity testing, and analysis of the benthic community structure. Each of these monitoring tasks had been performed one or more times during previous monitoring events in 1990, 199 1, 1992, 1994, and 1996. The following conclusions are based on data from the 2000 monitoring event as well as the five previous monitoring events.
Cap thickness measurements indicate that the cap has remained stable over the 10-year monitoring period, without any erosion. The majority of seafloor settlement occurred within the first two years after cap placement. Five of the six measuring stakes were damages after at some point during the 10-year monitoring period. A sedimentation rate of between 0.75 and 1.0 cmlyear was calculated from the single, undamaged stake. Sediment core chemistry results indicate that there has not been significant upward chemical migration into the cap. 1. Metals results at all three sediment coring stations monitored in 2000 show
concentrations that are similar to or lower than those found in surficial cap sediments. Metals concentrations in the 2000 sediment core samples are not elevated above natural background levels of metals in the Puget Sound region.
2. Very low levels of only four PAH compounds were detected in the 2000 sediment core sample collected from Station 0 . Higher concentrations and more PAH compounds were detected in the core sample collected from Station P, however, PAH compounds were not detected at all in the replicate core sample collected from Station P. It is most likely that the original sediment core sample collected from Station P include a small amount of contaminated sediment from below the interface.
3. PCBs were not detected in any of the core samples collected from Stations 0 and P. 4. Trace organic core data at Station N in 2000 are a little more difficult to interpret.
Very different concentrations of total PCBs were detected in the four sediment core samples collected from Station N. A total PCB concentration of 144 pg/Kg DW (22.0 mg/Kg OC) was detected in the original sample collected from the first 6-inch increment (sample Nl). This concentration exceeds both the LAET and SQS criteria. The total PCB concentration detected in the field replicate sample (sample N1 Rep), however, was 7.45 pg/Kg DW (1.14 mg/Kg OC), which is less than 10% of the SQS. Several compounds were detected in sample N1 that were not detected in sample N1 Rep; 1,2-dichlorobenzene, 1,4-dichlorobenzene, benzyl butyl phthalate, and fluoranthene. PAH compounds were detected at higher concentrations in sample N1 than in sample N1 Rep. PAH compounds and PCBs were also detected in the sample collected from the second 6-inch increment above the interface. There are several plausible scenarios for these detected chemicals at Station N: actual chemical migration upwards into the cap; mixing of cap material and underlying contaminated sediment during cap placement; existing concentrations of organic chemicals in the original capping material; or a poorly delineated interface in the first sediment core collected at Station N, which caused the inclusion of contaminated sediment from below the interface in the capping material sample. Of these, the most-likely scenario
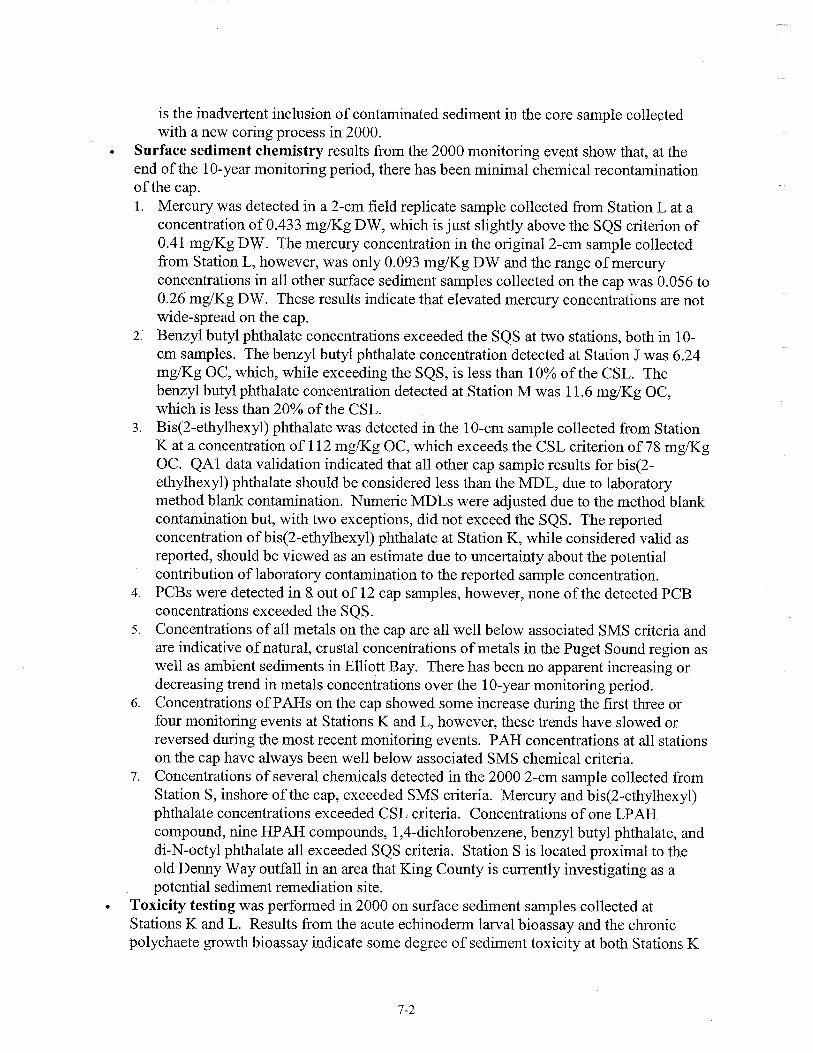
is the inadvertent inclusion of contaminated sediment in the core sample collected with a new coring process in 2000.
Surface sediment chemistry results from the 2000 monitoring event show that, at the end of the 10-year monitoring period, there has been minimal chemical recontamination of the cap. 1. Mercury was detected in a 2-cm field replicate sample collected from Station L at a
concentration of 0.433 mg/Kg DW, which is just slightly above the SQS criterion of 0.41 mg/Kg DW. The mercury concentration in the original 2-cm sample collected from Station L, however, was only 0.093 mg/Kg DW and the range of mercury concentrations in all other surface sediment samples collected on the cap was 0.056 to 0.26 mglKg DW. These results indicate that elevated mercury concentrations are not wide-spread on the cap.
2. Benzyl butyl phthalate concentrations exceeded the SQS at two stations, both in 10- cm samples. The benzyl butyl phthalate concentration detected at Station J was 6.24 mg/Kg OC, which, while exceeding the SQS, is less than 10% of the CSL. The benzyl butyl phthalate concentration detected at Station M was 11.6 mg/Kg OC, which is less than 20% of the CSL.
3. Bis(2-ethylhexyl) phthalate was detected in the 10-cm sample collected from Station K at a concentration of 112 mg/Kg OC, which exceeds the CSL criterion of 78 mg/Kg OC. QA1 data validation indicated that all other cap sample results for bis(2- ethylhexyl) phthalate should be considered less than the MDL, due to laboratory method blank contamination. Numeric MDLs were adjusted due to the method blank contamination but, with two exceptions, did not exceed the SQS. The reported concentration of bis(2-ethylhexyl) phthalate at Station K, while considered valid as reported, should be viewed as an estimate due to uncertainty about the potential contribution of laboratory contamination to the reported sample concentration.
4. PCBs were detected in 8 out of 12 cap samples, however, none of the detected PCB concentrations exceeded the SQS.
5. Concentrations of all metals on the cap are all well below associated SMS criteria and are indicative of natural, crustal concentrations of metals in the Puget Sound region as well as ambient sediments in Elliott Bay. There has been no apparent increasing or decreasing trend in metals concentrations over the 10-year monitoring period.
6. Concentrations of PAHs on the cap showed some increase during the first three or four monitoring events at Stations K and L, however, these trends have slowed or reversed during the most recent monitoring events. PAH concentrations at all stations on the cap have always been well below associated SMS chemical criteria.
7. Concentrations of several chemicals detected in the 2000 2-cm sample collected from Station S, inshore of the cap, exceeded SMS criteria. Mercury and bis(2-ethylhexyl) phthalate concentrations exceeded CSL criteria. Concentrations of one LPAH compound, nine HPAH compounds, 1,4-dichlorobenzene, benzyl butyl phthalate, and di-N-octyl phthalate all exceeded SQS criteria. Station S is located proximal to the old Denny Way outfall in an area that King County is currently investigating as a potential sediment remediation site.
Toxicity testing was perfonned in 2000 on surface sediment samples collected at Stations K and L. Results from the acute echinoderm larval bioassay and the chronic polychaete growth bioassay indicate some degree of sediment toxicity at both Stations K

and L. These sediment toxicity results, however, do not correlate well with sediment chemistry results. Bioassay results at Station K indicated a Severe Biological Effects Criteria failure of the echinoderm bioassay and a Biological Effects Criteria failure of the polychaete bioassay. These bioassay results might appear to correlate with the CSL exceedence of bis(2-ethylhexyl) phthalate at Station K. The echinoderm bioassay also failed the Severe Biological Effects Criteria at Station L, however, the concurrent Station L sediment chemistry sample did not show any SMS exceedences A similar poor correlation between sediment toxicity and chemistry results was found during the 1996 monitoring event, the first year sediment toxicity testing was performed. Benthic community data collected at Stations J and M indicate that the Denny Way sediment cap supports a diverse, abundant, and healthy benthic community. Benthic data were collected both on the cap and from a nearby reference station in 2000. Although not collected specifically for this purpose, benthic abundance differences between the cap stations and the reference station were compared to SMS biological criteria. This comparison indicated a Biological Effects Criteria failure at Station J for crustacean abundance. Calculated benthic indices for both Stations J and M, however, fall within, and are frequently are higher than, the Puget Sound Reference Value Ranges. Calculated diversity indices show little difference between Stations J and M and the nearby reference station. No one species or group of organisms dominates any of the sampling stations, indicating a diverse benthic community. Differences in crustacean abundance between Station J and the reference station in 2000 could be attributable to subtle differences in the physical characteristics of the sediment. Benthic data collected over the 10-year monitoring period show that the cap was quickly recolonized and the benthic community stabilized, both in richness and abundance, four years after placement of the cap.
The Denny Way sediment capping project was initialized prior to other engineering projects that will control discharges from the Denny Way CSO. Certain chemical concentrations in sediments adjacent to the cap have been shown to exceed SMS criteria and, as a result, five areas have been designated for potential sediment remediation. Both of these circumstances have had the potential to contribute to increased chemical concentrations on the Denny Way cap. In spite of these potential contaminant sources, the Denny Way sediment cap monitoring program has shown that the project has been successfid in its initial purposes - to sequester contaminated sediments below the cap and to provide a clean, sandy substrate. Sediment chemical monitoring has shown that significant upward migration of chemical contaminants into the cap has not occurred. Benthic monitoring has demonstrated that the cap continues to support a healthy and diverse benthic community.