the critical influence of customer food perceptions on ... · pdf filethe critical influence...
TRANSCRIPT

Journal of Management and Marketing Research
The critical influence, Page 1
The critical influence of customer food perceptions on overall theme
park evaluations
Gary L. Geissler
University of Arkansas at Little Rock
Conway T. Rucks University of Arkansas at Little Rock
ABSTRACT
The theme park industry has experienced impressive growth for many years. Food products and services are an integral part of the overall theme park operation and experience. Monitoring customer perceptions of park food is critical to success. Here, ten years of data from a customer tracking study conducted for a major U. S. theme park are analyzed. The findings indicate that food quality, value, and variety are highly important factors not only in park food evaluations, but also in overall park evaluations. Customer expectations, in turn, strongly predict food price/value perceptions. Finally, food quality is the primary predictor of whether visitors would recommend eating at the theme park. Keywords: customer satisfaction, expectations, theme park, food

Journal of Management and Marketing Research
The critical influence, Page 2
INTRODUCTION
Since the 1980s, the theme park industry has developed into a truly global phenomenon. There are more than 600 amusement and theme parks in the U. S. and around 300 in Europe. Asia, especially China, represent substantial current and future growth regions in the industry. Key growth factors throughout Asia include growing economies, an expanding middle class, and less saturated markets than in the U. S. and Europe (TEA/ERA, 2009).The industry encompasses large, worldwide theme parks (e.g., Disney World, Disneyland Paris, and Tokyo Disneyland), medium-sized theme parks (e.g., Six Flags parks) and countless smaller ventures throughout the U. S. and in countries around the world (Clave, 2007). Top worldwide theme park chains include Walt Disney Attractions, Merlin Entertainment Group, Universal Studios Recreation Group, Parques Reunidos, and Busch Entertainment Group, which was recently sold to the Blackstone Group (Kahaner, 2010).
Prior to the current recession, the U. S. amusement and theme park industry experienced steady growth for many years. Attendance at America’s amusement and theme parks increased from 253 million visitors in 1990 to 341 million visitors in 2007. Associated revenues more than doubled during the same time period from $5.7 billion in 1990 to $12.0 billion in 2007 (IAAPA, 2009). Americans’ favorite theme parks include Walt Disney World, Universal Studios/Islands of Adventure, and Busch Gardens, Williamsburg, Virginia (NAPHA, 2008).
The current recession is predicted to negatively impact attendance somewhat at America’s amusement and theme parks. The first evidence of this was noted in the fourth quarter of 2008. The decline is predicted to last through 2009, with a possible recovery by early 2010. Destination parks are typically impacted more by a recession than regional parks, because they are more costly to visit due to their location relative to their markets. In Europe, resorts and tourist area parks also suffer more than urban parks during recessions (TEA/ERA, 2009). While amusement parks and theme parks are terms that are often used collectively and even interchangeably, there are some key differences between them. Amusement parks are more elaborate than city parks or playgrounds and provide attractions targeted to children, teens, and adults. Amusement parks have traditionally offered a relatively limited assortment of snacks, treats, and beverages. According to an IAAPA survey, the vast majority of park visitors (94%) have a favorite amusement park food, including funnel cake (28%), ice cream (17%), pizza (14%), hot dogs (13%), and cotton candy (12%) (IAAPA, 2010). Theme parks are primarily differentiated from amusement parks by their areas (i.e., ‘lands’) that focus on telling a story. Their environments include architecture, landscaping, stores, rides, and food to support specific themes. Food products are becoming an increasingly important part of the overall theme park experience. Food offerings range from quick snacks and beverages such as those offered at amusement parks to award-winning, full-service themed dining. Although amusement and theme parks have been criticized for their “junk” food, healthier options are increasingly available at theme parks. For example, Disney has eliminated trans fats from their food at their theme parks and significantly reduced the saturated fat and sugar content of main dishes, side dishes, and snacks (Weston, 2006). In Japan, food theme parks are a popular new theme park concept. These parks specialize in various versions of one type of food or dish. The food is prepared by reputable restaurants. As such, the meals are high quality and priced accordingly. In contrast with traditional theme parks,

Journal of Management and Marketing Research
The critical influence, Page 3
food theme parks are located indoors. Also, they are often decorated according to a specific epoch or fantasy theme (Tokyo Travel, 2010). From the consumer point-of-view, food is indeed an integral part of the overall experience at any theme park. Various food and service attributes, such as food quality and value, can either enhance or diminish the overall park experience. Ideally, theme park restaurants become additional attractions that offer visitors important benefits and are sought out (Niles, 2009). From a management perspective, food and beverages significantly impact the bottom line. In many parks, food and beverages are the second most profitable resource (Holtzman, 2010).
Historically, parks and attractions tend to fare better than most industries during a recession, functioning as an escape of sorts from the pressures of daily life. In addition, theme parks have historically rebounded quickly from recessions. Economic downturns are thought to be an excellent time in the theme park industry to reinvest and find ways to improve the product and the customer experience. In fact, reinvestment may have a stronger impact on attendance than does the economy. If a new ride, attraction, or area is too costly, a park can still consider reinvesting in training, customer service, maintenance, and marketing (TEA/ERA, 2009). Certainly, improving food products and services should be a primary consideration in seeking to increase attendance. And, improving food service throughout the day may be a key way to increase guest spending (Niles, 2009).
Continuously monitoring customer satisfaction and perceptions is critically important in the theme park industry and is certainly very important during an economic downturn. According to David Camp, Director of Economics Research Associates Europe/Middle East/Africa: “Parks should monitor customers’ perception of value for money by conducting research, including regular customer surveys, and being reactive to them.” (TEA/ERA, 2009). The authors of the present study contend that analyzing historical, theme park data on customer spending and perceptions is also extremely helpful in dealing with the current recession and in planning for the post-recession future.
The investigation focuses on customer food spending and on important factors that influence overall customer perceptions of a major U. S. theme park and its food offerings, particularly food price/value perceptions. The park has numerous restaurants providing several different cuisines, including Italian, Greek, and American. A wide variety of food is available, such as seafood, steak, barbeque, chicken, sandwiches, salads, and desserts. Also, smaller snack stands, offering snacks and treats such as hot dogs, loaded fries, and funnel cakes, and an assortment of beverages (e.g., soft drinks, bottled water), are found throughout the park.
Also, the role of expectations in customer perceptions of theme park food products is examined. There is extensive marketing literature concerning the influence of expectations on customer satisfaction (e.g., Szymanski and Henard, 2001; Voss, Parasuraman, and Grewal, 1998; Spreng, MacKenzie, and Olshavsky, 1996), and there is general agreement that customer expectations have a direct impact on customer satisfaction and dissatisfaction.
In the tourism area, several studies have also directly and indirectly examined the relationship between customer expectations and satisfaction (e.g., Meng, Tepanon, and Uysal, 2008; Weiermair, 2000; Kandampully, 2000). Again, customer expectations can have a positive or negative impact on customer satisfaction. For example, Disney theme parks have been observed to generously overestimate waiting times posted by attractions in an effort to influence customer expectations, and it seems to be working. Even though Disney’s theme park lines get longer each year, customer satisfaction has increased (Katz, Larson, and Larson, 2003).

Journal of Management and Marketing Research
The critical influence, Page 4
RESEARCH OBJECTIVES
The primary research objectives of the current study are to: 1. examine theme park visitor spending behavior on food and beverages. 2. identify the primary factors customers use to evaluate the theme park and its food
offerings. 3. determine key attributes influencing price/value perceptions of the theme park’s food
offerings. 4. evaluate the impact of customer expectations on food price/value perceptions. 5. identify important variables determining whether customers would recommend eating
at the theme park.
METHODOLOGY
Study Overview
This study involves a mail survey distributed to exiting theme park visitors during a 10-year period (1993 – 2003). Given the proprietary nature of the data, the theme park owner would only release information that was at least five years old. Respondents were asked to complete the questionnaire at a later time and mail it back in an attached, postage-paid envelope. A total of 44,995 surveys were completed and analyzed.
Survey Method/Data Collection
Theme park customer satisfaction surveys are ideally exit interviews, administered only after the respondent has experienced the park. However, there are several inherent difficulties with exit interviews administered by personal interviews, including personnel absenteeism and turnover, virtually continuous interviewer training, deliberate and non-deliberate respondent selection errors, incomplete interviews, and interviewer bias and self-completion. These problems are compounded by the length of the interview, which takes 25 to 30 minutes to collect the data needed by all members of management via personal interviews. Also, the interviewing characteristically takes place in a less than ideal outdoor environment. Thus, the decision was made to use a mail survey. Selected exiting guests were provided a survey packet, which included a cover letter with a high-ranking executive’s signature, a highly structured questionnaire, a business-reply envelope for mailing, and a gift (merchandise from the park’s shops) as an incentive to complete the questionnaire. Response rates averaged roughly 20 percent over the entire period. The mail-back method was continuously monitored for non-response error by personal interviews conducted quarterly. The brief personal interviews were called the “validation survey.” The validation survey consisted of replicating three questions on the mail-back survey with personal interview questions, using visual prompts when necessary. Two objective questions (e.g., party size, age, household income) and one evaluation question (e.g., a rating of a park characteristic) were asked, and the findings were compared to the corresponding mail-back findings. Only one significant difference was ever found—the rating of employee courtesy was significantly higher when personal interview respondents were faced with an employee than in the mail-back method.
Journal of Management and Marketing Research
The critical influence, Page 5
Survey Instrument
The questionnaire was developed based on extensive exploratory research. Interviews were conducted with numerous attraction managers representing various theme park areas, including operations, marketing, finance, food service, landscaping, and admissions. The resulting questionnaire was revised numerous times and pretested several times before the final draft was developed. The final draft became the core of the questionnaire over the entire period under current examination. The wording of questions in the original version remained unchanged in the questions that comprised the vast majority of the questionnaire.
Sampling
The sampling method was also consistent over the duration of the period under study. The overall objective of the sampling design was to simulate as closely as possible the actual guest exit distribution, based on turnstile counts from the comparable month in the previous year, while still maintaining objective respondent selection. A survey schedule of ten distribution days per month was selected by random sampling, subject to quota specifications that each day of the week was to be selected at least once each month. Exit times to begin distribution were selected via a computer program that minimized the difference between times actually selected for sampling for the 10-day monthly schedule and the corresponding pattern of turnstile exits from the same month in the previous year. Questionnaire distribution began at the exiting time for each sampled day and continued until all questionnaires had been distributed to the head of the party. An “In-Park Survey Day Distribution Report” was completed by the distribution entity (Admissions) after each survey day. The report assured that questionnaires were distributed according to plan. If inclement weather at distribution time occurred, distribution was cancelled and fulfilled the next available day of the month, usually the next day unless the survey was scheduled for back-to-back days. Data Analysis
The data was analyzed using various methods. Stepwise linear multiple regression was used to evaluate the relationship between price/value perceptions of the park’s food (dependent variable) and several independent variables, including: food to expectations, quality of the food, restaurant variety, and satisfaction with total cost. Logistic regression analysis was used to examine whether visitors would recommend eating at the park to friends, since this was a dichotomous dependent variable. Recommendations were predicted by customer perceptions of the following independent variables: quality of the food; price/value of the food; taste of the meals; restaurant variety; restaurant cleanliness; variety of food in the park; food spending; price/value of the food relative to expectations.
Principal component analysis (PCA) was utilized to examine key factors used by consumers to evaluate their visit to the theme park. Within this context, the relative importance of food attributes was examined. PCA was also used to further examine important factors used to specifically evaluate the parks’ food offerings. In both factor analyses, the latent root criterion was used to determine the number of factors to extract (i.e., only factors having latent roots or eigenvalues greater than 1 were considered significant). The VARIMAX method was used to

Journal of Management and Marketing Research
The critical influence, Page 6
obtain an orthogonal rotation of factors. PCA is appropriate when the main concern is about prediction or the minimum number of factors needed to account for the maximum portion of variance represented in the original set of variables (Hair et al., 1998).
Finally, cross-tabulations were used to examine price/value perceptions of the park’s food relative to expectations versus whether the customer was a first-time visitor or had visited the park before. Also, whether a customer would recommend the park to friends and family was tabulated with whether the customer had visited the park before.
FINDINGS
Food Spending Behavior
Respondents were asked whether they purchased meals, snacks, and/or meals at restaurants during their park visit, which averaged around 6 ½ hours in duration. More than three-fourths of the respondents (78%) purchased a meal. Also, 72 percent of the respondents claimed that they purchased a snack.
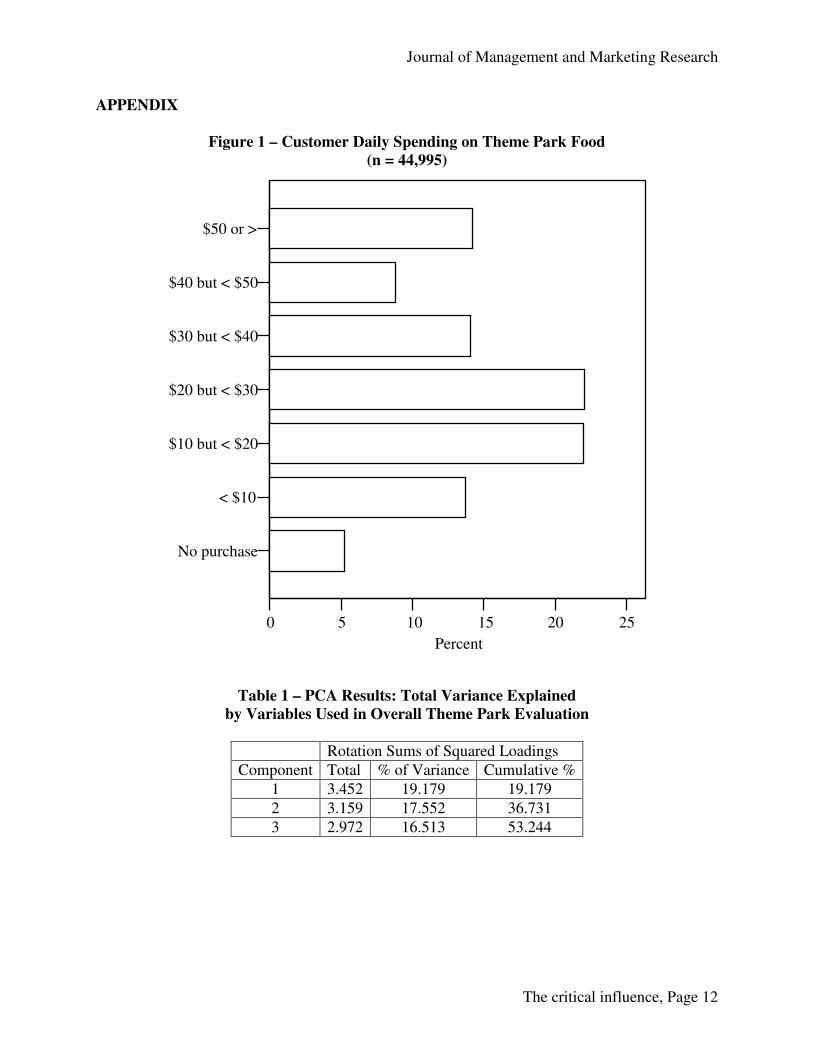
Respondents were also asked: “About how much did you and your party spend on food, drinks, and snacks while visiting (this theme park)?” They were provided with spending categories. Only 5 percent of the respondents reported that they did not spend any money on food in the park, mainly because they were not hungry (43%) or they thought the food was expensive (35%). Most customers (58%) spent from $10 to just under $40 on park food. In addition, 14 percent of respondents spent $50 or more on food, as indicated in Figure 1 (Appendix).
Key Factors Used to Evaluate the Theme Park and its Food Offerings
Respondents were asked to rate numerous park attributes. A principal component analysis (PCA) revealed three principal components or factors that visitors used to evaluate the theme park. These components accounted for over half (53%) of the variance. The variance was fairly evenly split among the components. That is, Component 1 explained 19.2 percent of the variance, followed closely by Component 2 (17.6%) and Component 3 (16.5%), as indicated in Table 1 (Appendix). As shown in Table 2 (Appendix), several park attributes loaded significantly on the first component. This factor seems to reflect visitor perceptions of the “overall park experience/value.” A fun experience, the variety of attractions available, satisfaction with the total cost, admission price value, park atmosphere, and an education experience were the most important variables contributing to this factor. Food quality, taste of meals, food price/value, and restaurant variety were key contributors to defining Component 2. This factor is best described as the “park food quality/value/variety.” Park cleanliness, restroom cleanliness, landscaping, employee courtesy, restaurant cleanliness, and atmosphere of park loaded highest on Component 3. Thus, the third factor can be described as “park cleanliness/atmosphere.” In addition, PCA was utilized to examine key factors customers used to evaluate the park’s food offerings. As shown in Table 3 (Appendix), two components or factors accounted for two-thirds of the variance. The first factor is best described as “park food quality/variety/value.” This factor accounted for the largest portion (38%) of the variance. Quality of food, taste of meals, variety of food in park, price/value of food, and restaurant variety represented the highest
Journal of Management and Marketing Research
The critical influence, Page 7
factor loadings. In contrast to evaluations of the food itself, attributes that should support (or could detract from) the dining experience loaded highest on the second factor. That is, length and speed of waiting lines, restaurant cleanliness, and courtesy of food employees were important variables contributing to the second factor, which can be described as “food service,” as indicated in Table 4 (Appendix).
Price/Value Perceptions of the Theme Park’s Food
If respondents purchased a meal during their most recent visit, they were asked to rate several food-related attributes, including:
- taste of meals - restaurant variety - variety of food in park - price/value of food - price of food to what you expected - courtesy of food employees - cleanliness of the restaurant/facility - speed of waiting lines - length of waiting lines
The rating scale included the following points: excellent; good; fair; poor. The stepwise regression analysis revealed that customer perceptions of the price/value of
the theme park food was strongly predicted by one variable—food to expectations (R2 = .493, F = 3897, p < .0001). That is, about half of the variance in food price/value perceptions was accounted for by customers’ expectations. Including more variables (quality of food, satisfaction with total cost, and restaurant variety) added even greater predictive power (R2 = .585, F = 1410, p < .0001) to the model, as indicated in Table 5 (Appendix).
Since prior experience was likely to influence both food price/value perceptions and associated expectations, we cross-tabulated price/value of food and price/value of food to expectations with first-time visitors and with those customers who had visited the park before. In terms of food price/value perceptions, repeat visitors rated this attribute somewhat higher than did first-time visitors. Given the very large sample size (n = 20,735), even relatively small percentage differences were significant. In this case, 60.4 percent of repeat visitors rated the price/value of the park’s food as either “excellent” or “good” versus 59.2 percent of first-time visitors. When expectations were factored into the equation, even more pronounced differences were evident. That is, first-time visitors rated the price/value of food to expectations significantly higher (68.7% rated it “excellent” or “good”) than did repeat visitors (64.6%).
Positive Word-of-Mouth Communications
Respondents who purchased a meal at the theme park on their most recent visit were asked: “Would you recommend eating a meal at (this theme park) to your friends or family?” Four out of five visitors (79.5%) claimed that they would recommend eating at the park to others. Interestingly, a significantly higher percentage of repeat visitors (84.2%) versus first-time visitors (72.5%) would recommend the park’s food. The logistic regression analysis revealed that several variables positively predicted whether visitors would recommend eating at the theme park, as indicated in Table 6 (Appendix).

Journal of Management and Marketing Research
The critical influence, Page 8
Quality of food was the most influential attribute. This variable alone predicted well over a third of the variance (Nagelkerke R2 = .393) in the dependent variable. The Nagelkerke R2 is comparable to the R2 measure in multiple regression, and it is a modification of the Cox and Snell R2 to include a range of 0 to 1. Adding more variables to the model (i.e., price-value of food, variety of food in park, taste of meals, restaurant variety, and price-value of food to expectations) further increased the predictive power (Nagelkerke R2 = .538). A chi-square test for the change in the -2 Log Likelihood value from the base model, which is comparable to the overall F test in multiple regression, was also performed on both models. The reduction in both models was statistically significant at the .000 level. In addition, the Wald statistic indicated that individual variables in both models were significant at the .000 level. Demographic Profile of Respondents
Most respondents were female (76%). Respondents were primarily Caucasian (92%). There was a wide range of ages, with the largest proportion of respondents (41%) between 25 and 44 years old. The sample was fairly well-educated—three-fourths had at least some college education. Most of the respondents (59%) had total family incomes of $40,000 or more.
More than half of the visitors (55%) were tourists; the remainder (45%) were local residents. The party types were mainly adults (57%) and families (41%). It is noteworthy that this particular theme park caters to both groups with its attractions and restaurants, many of which include adult beverages. The average party size was 3.42 people. The respondents had visited the park an average of 5.6 times.
DISCUSSION
The results support the notion that food and beverages are an integral part of the overall experience when visiting a theme park. Clearly, food quality, value, and variety are a key part of customers’ evaluation of the entire park. Other important factors influencing customer perceptions of the theme park are the overall park experience and value, and the park cleanliness and atmosphere.
In terms of spending behavior, the vast majority of visitors purchase a meal or snack. Most respondents spend at least $10 on food, while many spend much more. This is not surprising, considering that visitors typically spend most of the day at the park (6 ½ hours, on average). When specifically evaluating the theme park’s food offerings, customers tend to use two primary factors. The first factor involves several attributes of the food itself, especially the food quality, variety, and value. The second factor includes important food service attributes, such as waiting times, restaurant cleanliness, and food employee courtesy. Providing customer value is important in any economic environment, and it is especially critical during a recession. The research findings further explain the relative importance of specific variables related to customer price/value perceptions of the theme park’s food offerings. In particular, customer expectations of the food are the strongest predictor of price/value perceptions. This key finding lends further support to an extensive body of research concerning the important role that expectations play in customer satisfaction and perceptions. Additional variables that help predict customer price/value assessments of the theme park food include the

Journal of Management and Marketing Research
The critical influence, Page 9
quality of the food, satisfaction with the total cost of the park visit, and the variety of the park’s restaurants. Most visitors have a favorable opinion of the price/value of the theme park’s food both in an absolute sense and relative to their expectations. However, when expectations are considered (i.e., price/value of food relative to expectations), first-time visitors rate the price/value significantly higher than do repeat visitors. A possible explanation for this finding is that repeat visitors may form more realistic expectations of the park’s food over time via direct experience, whereas first-time visitors are more easily impressed (and perhaps surprised) with the price/value of the food offerings. Any theme park (and virtually any business or organization for that matter) should be very concerned about generating repeat business and positive word-of-mouth communications. In this case, customers are very satisfied with the theme park’s food offerings. A true testament to this high level of satisfaction is that four out of five visitors would recommend eating at the park. A significantly higher percentage of repeat visitors than first-time visitors would make this recommendation. A possible explanation for this difference is that repeat visitors are likely exposed to more of the park’s food offerings (especially the food and restaurant variety, quality, and value) over time and find food offerings and restaurants that are appealing to them. Some first-time visitors may have more of a hit-or-miss food experience. The research findings also reveal that the most important attribute that helps predict whether visitors would recommend eating at the theme park is the quality of the food. Other important considerations are the price/value of the food, the variety of food in the park, the taste of the meals, the restaurant variety, and the price/value of the food relative to customer expectations.
MANAGERIAL IMPLICATIONS
From a managerial perspective, food and beverages constitute a substantial portion of a theme park’s revenues and profits. As such, ensuring that customers are highly satisfied with the park’s food offerings and generate positive word-of-mouth communications is critical to a successful operation. Park managers should adopt a philosophy of continuous improvement, focusing efforts on food quality, variety, and value, and on waiting times, restaurant cleanliness, and food employee courtesy. Customer expectations are a very important consideration. Clearly, expectations play a significant role in customer satisfaction and evaluations of a theme park’s food. As more theme parks increase their food and service quality, food and restaurant variety, and associated value, customer expectations will likely increase, as well. It seems that it is somewhat easier to exceed first-time visitors’ expectations. However, it is just as important to meet and exceed repeat visitors’ expectations to ensure a satisfying experience, return visits, and positive word-of-mouth communications. Continuous improvement implies that better food quality and service, more restaurant and food variety, and greater value will be provided over time. These efforts should continually provide updated, interesting, and appealing dining options for park visitors. Thus, meeting and exceeding expectations of both repeat and first-time visitors should be more likely with this approach.
Ultimately, managing customer expectations is key. Under-promising and over-delivering is an effective strategy to manage expectations. For example, posting somewhat longer wait times at restaurants and attractions than the actual wait times is a good way to ensure that

Journal of Management and Marketing Research
The critical influence, Page 10
customers are not disappointed about being promised a shorter wait than they experience. As mentioned above, Disney parks have proven that this technique has actually increased customer satisfaction, even though waiting lines continue to lengthen. Providing interesting distractions while visitors are waiting in lines is another useful technique. In full-service park restaurants, providing an unusual and captivating atmosphere and updating patrons about the status of their order may also be helpful.
The current recession is certainly an overriding consideration in ongoing customer satisfaction efforts in the theme park industry. However, monitoring and finding ways to increase customer satisfaction with the food value, especially relative to expectations, should be standard practice in any economic climate. Management should consider offering a wide variety of food and beverages, including lower-priced options, to appeal to price-sensitive customers. Specifically, providing coupons, in-park discounts, daily specials, manager’s specials, price bundling, and other attractive pricing strategies and promotional incentives should be considered.
REFERENCES
Clave, S. A. (2007). The global theme park industry. Tarragona, Spain: Virgili. Hair, J. E., Anderson, R. E., Tatham, R. L. & Black W. C. (1998). Multivariate data
analysis. Upper Saddle River, NJ: Prentice Hall. Holtzman, M. (2010). A quick recipe for your F&B team. URL (consulted January, 2010): http://www.parkworld-online.com. International Association of Amusement Parks and Attractions (IAAPA). (2009). U. S.
amusement park attendance & revenue history. URL (consulted January, 2010): http://www.iaapa.org. Jones, C. B. & Robinett, J. (1999). The future of theme parks in international
tourism. URL (consulted January, 2010): http://hotel-online.com/Trends/ERA. Kahaner, T. (2010). Major international amusement park chains: A guide to who
owns what. URL (consulted January, 2010): http://www.blooloop.com. Kandampully, J. (2000). The impact of demand fluctuation on the quality of service: A tourism industry example. Managing Service Quality, 10 (1), 10-19. Katz, K. L., Larson, B. M. & Larson, R. C. (1991). Prescription for the waiting-in-line blues: Entertain, enlighten, and engage. Sloan Management Review, (Winter), 44-53. Meng, F., Tepanon, Y. & Uysal, M. (2008). Measuring tourist satisfaction by attribute and motivation: The case of a nature-based resort. Journal of Vacation Marketing, 14 (1), 41-56. National Amusement Park Historical Association (NAPHA) (2008). NAPHA’s 2008
survey results. Mt. Prospect, IL: NAPHA. Niles, R. (2009).How theme parks can increase guest spending: Improving food service
throughout the day. URL (consulted December, 2009): http://themeparkinsider.com.
Spreng, R. A., MacKenzie, S. B. & Olshavsky, R. W. (1996). A reexamination of the determinants of customer satisfaction. Journal of Marketing, 60 (3), 15-32. Szymanski, D. M. & Henard, D. H. (2001). Customer satisfaction: A meta-analysis of the empirical evidence. Journal of the Academy of Marketing Science, 29 (1), 16-35.

Journal of Management and Marketing Research
The critical influence, Page 11
Themed Entertainment Association/Economics Research Associates (TEA/ERA) (2009). 2008 Attraction attendance report. Burbank, CA: TEA. Tokyo Travel (2010). Food theme parks. URL (consulted January, 2010): http://www.japan-guide.com. Voss, G. B., Parasuraman, A. & Grewal, D. (1998). The roles of price, performance, and expectations in determining satisfaction in service exchanges. Journal of
Marketing, 62 (4), 46-61. Weiermair, K. (2000). Tourists’ perceptions towards and satisfaction with service quality in the cross-cultural service encounter: Implications for hospitality and tourism management. Managing Service Quality, 10 (6), 397-409.
Journal of Management and Marketing Research
The critical influence, Page 12
APPENDIX
Figure 1 – Customer Daily Spending on Theme Park Food
(n = 44,995)
Table 1 – PCA Results: Total Variance Explained
by Variables Used in Overall Theme Park Evaluation
Rotation Sums of Squared Loadings
Component Total % of Variance Cumulative %
1 3.452 19.179 19.179
2 3.159 17.552 36.731
3 2.972 16.513 53.244
No purchase
< $10
$10 but < $20
$20 but < $30
$30 but < $40
$40 but < $50
$50 or >
0 5 10 15 20 25
Percent

Journal of Management and Marketing Research
The critical influence, Page 13
Table 2 – PCA Results: Rotated Component Matrix
Component
1 2 3
Landscaping .295 .009 .689
Park Cleanliness
.164 .059 .769
Restroom Cleanliness
.003 .289 .701
Signs/Directions
.203 .209 .498
Employee Courtesy
.187 .239 .562
Variety of Attractions Available .693 .138 .266
Restaurant Variety
.354 .579 .243
Educational Experience
.567 .196 .322
Fun Experience .739 .124 .296
Atmosphere of Park
.656 .109 .456
Quality of Food
.238 .778 .237
Food Price/Value .302 .722 .076
Gift Quality
.377 .527 .154
Ride/Show Wait Lines .413 .329 .059
Admission Price Value
.656 .275 .002
Satisfaction with Total Cost .673 .275 .002
Restaurant Cleanliness
.065 .539 .461
Taste of Meals .100 .729 .134

Journal of Management and Marketing Research
The critical influence, Page 14
Table 3 – PCA Results: Total Variance Explained
by Variables Used in Theme Park Food Evaluation
Rotation Sums of Squared Loadings
Component Total % of Variance Cumulative %
1 3.424 38.048 38.048
2 2.572 28.574 66.622
Table 4 – PCA Results: Rotated Component Matrix
Component
1 2
Restaurant Variety .688 .202
Variety of Food in Park
.769 .214
Quality of Food
.836 .225
Price/Value of Food
.715 .300
Courtesy of Food Employees
.469 .522
Restaurant Cleanliness .446 .591
Length of Waiting Lines
.163 .921
Speed of Waiting Lines
.185 .918
Taste of Meals .818 .174

Journal of Management and Marketing Research
The critical influence, Page 15
Table 5 – Stepwise Regression Analysis Summary of Resultsa
Model R R2 Adjusted R2 Standard Error of the Estimate
F Significance
1b .702 .493 .493 .640 3896.913 .000
2c .759 .576 .576 .585 2726.929 .000
3d .762 .581 .581 .582 1854.510 .000
4e .765 .585 .584 .580 1409.962 .000
a. Dependent Variable: Food Price/Value b. Predictors: (Constant), Food to Expectations c. Predictors: (Constant), Food to Expectations, Quality of Food d. Predictors: (Constant), Food to Expectations, Quality of Food, Satisfaction with Total
Cost e. Predictors: (Constant), Food to Expectations, Quality of Food, Satisfaction with Total
Cost, Restaurant Variety
Table 6 – Logistic Regression Analysis Summary of Resultsa
Model Step Cox & Snell R2 Nagelkerke R2 -2 Log Likelihood
1b .216 .393 3671.185
2c .270 .491 3199.254
3d .283 .515 3076.901
4e .290 .529 3007.547
5f .294 .536 2970.852
6g .295 .538 2960.069
a. Dependent Variable: Recommend Eating at (this Theme Park) to Friends and Family b. Predictors: (Constant), Quality of Food c. Predictors: (Constant), Quality of Food, Price/Value of Food d. Predictors: (Constant), Quality of Food, Price/Value of Food, Variety of Food in Park e. Predictors: (Constant), Quality of Food, Price/Value of Food, Variety of Food in Park,
Taste of Meals f. Predictors: (Constant), Quality of Food, Price/Value of Food, Variety of Food in Park,
Taste of Meals, Restaurant Variety g. Predictors: (Constant), Quality of Food, Price/Value of Food, Variety of Food in Park,
Taste of Meals, Restaurant Variety, Price/Value of Food to Expectations