the benefits of ivus dynamics for retrieving stable models...
TRANSCRIPT

0
The Benefits of IVUS Dynamics for RetrievingStable Models of Arteries
Aura Hernàndez-Sabaté and Debora GilComputer Science Dept. and Computer Vision Center, Universitat Autònoma de Barcelona
Bellaterra, Spain
1. Introduction
Artery diseases are mainly caused by the accumulation of plaque (made up of a combinationof blood, cholesterol, fat and cells) inside arterial walls (Fuster, 1994). Such plaqueaccumulation narrows the artery blood flow (stenosis) and makes arteries inflaming and beingless flexible (atherosclerosis). Artery blood flow reduction is measured by the percentage ofobstruction in vessel sections and is a usual measurement previous to decide which is the besttreatment (either surgical or pharmacological) for an atherosclerotic lesion. Depending on thehistological composition of the plaque, its (bio-mechanical) physical behavior will be different,making it more or less unstable (vulnerable plaques) and, thus, resulting in a different risk forthe patient (Kakadiaris et al., 2006). Early detection of plaque composition is a main stepfor planning the most suitable treatment (angioplasty, stent apposition, ...) and might preventfurther thrombosis potentially leading to a fatal heart attack. Tissue bio-mechanical propertiesplay an important role in the diagnosis and treatment of cardiovascular diseases. The mainmechanical properties currently under study are radial strain, which is related to plaque typeand vulnerability (Céspedes et al., 2000), and shear stress, which influences the probability ofplaque accumulation (Wentzel et al., 2001). Both measures can be computed by means of thestudy of vessel tissue deformation along the cardiac cycle.IntraVascular UltraSound (IVUS) is the best choice to study, both, vessel morphology and itsbio-mechanical properties. On one hand, inspection of a single IVUS image gives informationabout the percentage of stenosis. Manual stenosis measurements require a manual tracingof vessel borders (the internal layer, intima, and the most external one, adventitia). This isa very time-consuming task and might suffer from inter-observer variations. On the otherhand, inspection of longitudinal views provides information about artery bio-mechanicalproperties. The assessment of bio-mechanical properties requires exploring the evolution ofvessel walls and structures along the sequence. Dynamics due to heart pumping (amongothers) introduces a misalignment of sequence frames, preventing any feasible volumetricmeasurement or 3D reconstruction. In particular heart dynamics produce two types ofmotion: longitudinal motion along the catheter pullback and in-plane motion of each singlecross section. Longitudinal dynamics produces a sequence block with spatially shuffledframes, which hinders any analysis along the sequence. Heart pumping also introduces aperiodic rotation and translation in IVUS cross-sections, which hinders proper evaluationof tissue bio-mechanical properties. Both 3D reconstructions and bio-mechanical properties
12
www.intechopen.com

2 Will-be-set-by-IN-TECH
assessment require a compensation of artery dynamics, either by sampling the sequencesynchronized with a cardiac phase or by in-plane sequence stabilization.Since the early years of IVUS imaging, many algorithms for a reliable intima detection (Boumaet al., 1997; Brathwaite et al., 1996; Brathwaite & McPherson, 1998; Brusseau et al., 2004;Dijkstra et al., 2001; Gil et al., 2000; Hansen et al., 2002; Luo et al., 2003; Mendizabal-Ruizet al., 2008; Sonka et al., 1996; von Birgelen et al., 1996; 1997) and plaque characterization(de Korte et al., 2000; Escalera et al., 2008; Granada et al., 2007; Nair et al., 2002; Okubo et al.,2008) have been proposed. Most of them are based on the appearance of structures in images.Adventitia modeling has been a delicate issue hardly addressed e.g. (Dijkstra et al., 1999; Gilet al., 2006; Haas et al., 2000; Klingensmith et al., 2000; Olszewski et al., 2004; Plissiti et al.,2004; Pujol & Radeva, 2005; Sonka et al., 1995; Takagi et al., 2000), though it is crucial forstenosis measurement. This is due to its weak appearance in IVUS images, which makesappearance-based techniques fail to produce optimal results and forces ad-hoc elaboratedstrategies. Also, image-based cardiac phase retrieval strategies are based on image appearanceand extract cardiac phase by exploring its temporal changes across the sequence (Barajas et al.,2007; Matsumoto et al., 2008; Nadkarni et al., 2005; Sean M. O’Malley, 2006; Zhu et al., 2003).Speckle, texture and morphology introduce non-cardiac irregular variations in appearancepatterns that must be carefully filtered.So far, dynamics has only been considered as an artifact which is, at most, corrected(Hernàndez-Sabaté et al., 2009; Rosales et al., 2004). We claim that rigid motion estimationis a useful tool for exploring, both, vessel structures and cardiac dynamics. The main concernof this chapter is to show the benefits of cardiac dynamics for adventitia segmentation andimage-based cardiac phase retrieval.The general scheme for adventitia segmentation can be split in three main steps sketched infigure 1.
Fig. 1. Pipeline for Adventitia Segmentation
The poor image quality as well as large variety of IVUS artifacts (calcium, side-branches,shadows, catheter guide and blood back scatter) force an elaborated pre-processing stepfor enhancing adventitia appearance. In order to ensure a good compromise betweenpreservation of the adventitia weak appearance and speckle smoothing, a filtering carefullydriven for each image is compulsory (Gil et al., 2006; Unal et al., 2006). This makes thepre-processing stage to be one of the most computationally expensive tasks of the wholescheme. We claim that IVUS (in-plane) rigid motion can significantly improve the smoothingstep, since vessel structures follow a periodic motion (induced by heart beat) clearly differentfrom the chaotic random behavior of textured and blood areas. We propose using the meanof stabilized sequence blocks in order to enhance vessel structures while blurring texture andspeckle.Concerning image-based ECG-gating, existing strategies (Barajas et al., 2007; Matsumoto et al.,2008; Nadkarni et al., 2005; Sean M. O’Malley, 2006; Zhu et al., 2003) follow the schemesketched in figure 2.First, a signal reflecting cardiac motion is computed from IVUS sequences. Second, the signalis filtered (in the frequency domain) in order to remove non-cardiac phenomena and artifacts.Finally, a suitable sampling of the filtered signal retrieve cardiac phase. All authors agree in
186 Intravascular Ultrasound
www.intechopen.com

The Benefits of IVUS Dynamics for Retrieving Stable Models of Arteries 3
Fig. 2. Pipeline for Image-based Cardiac Phase Retrieval
using a band-pass filter in the second step and the extrema of filtered signals for sampling atend-systole and diastole. The main differences among existing algorithms and thus, the cluefor an accurate cardiac phase retrieval, lie in the signal computed from the sequence. Giventhat in-plane and out-of-plane cardiac motion are coupled, we propose using the periodiccomponent of in-plane motion as the signal reflecting cardiac motion.In this chapter we propose an integrative framework for retrieving vessel morphology andcardiac phase from IVUS rigid dynamics. Vessel structures extracted from IVUS sequencesand stabilized by correcting cardiac dynamics produce stable models of arteries containingdeformation along all cardiac cycle and, thus, useful for exploring biomechanics. Thecollection of vessel structures at frames synchronized at the same fraction of the cardiaccycle provide static models for computing 3D measurements. The pipeline of our integrativeframework is sketched in figure 3 where the three clinical tools presented in the chapter arehighlighted in orange.
Fig. 3. Pipeline for the Integrative Framework
The remainder of the chapter is structured as follows. In section 2 we sketch the method usedto compute rigid in-plane motion (Hernàndez-Sabaté et al., 2009). Section 3 is devoted todetail the three steps which constitute the integrative framework we propose. In section 4 weexplain the validation protocol while results are given in section 5. Finally, discussions aboutthe advantages and limitations of using rigid in-plane dynamics compared to appearancemethods will be given in the last section of the chapter.
2. Rigid in-plane motion estimation
Different factors such as heart pumping, blood pressure or artery geometric properties mainlycontribute to the dynamics of coronary arteries (Holzapfel et al., 2002; Mazumdar, 1992;Nadkarni et al., 2003). The first order approximation to vessel in-plane dynamics is given by alinear transformation combining translation, rotation and scaling (Waks et al., 1996). Dilationis inherent to the elasticity of the vessel itself and it does not preserve the metric. The rigidpart of this approximation can be modeled as a rigid body motion and is given by a rotation
187The Benefits of IVUS Dynamics for Retrieving Stable Models of Arteries
www.intechopen.com

4 Will-be-set-by-IN-TECH
followed by a translation. Figure 4 shows the physics-based model of the rigid motion of anartery. The computation of the translation and rotation angle is as follows (Hernàndez-Sabatéet al., 2009).
Fig. 4. Physics-based model: rigid solid motion
2.1 Translation
In body dynamics, the point describing the object response to external forces and torques isdetermined by means of its center of gravity or mass (Goldstein et al., 2002). The differencebetween its position and the origin of coordinates is identified to the object translation. Wenote it as VCM which is computed from IVUS frames as follows.Since grey level reflects tissue mass density due to IVUS images reconstruction, the centerof mass given by the image intensity, namely ICM, corresponds to the physical center ofgravity of the vessel. However, some acquisition devices allow interactive tuning of the imagebrightness in order to enhance tissue and vessel structures appearance (Mintz & Nissen, 2001).Given that such intensity gain is radial (Caballero et al., 2006), tissue close to the catheter mightlook brighter and, for vessels not centered at the catheter, intensity gainings might deviate theposition of ICM from the true center of mass. Vessel geometric center, namely GCM, coincideswith the vessel center of gravity only in the case of uniform tissue density. However, it servesto compensate the deviation of ICM for non centered vessels. We define the center of mass ofthe vessel, VCM, by a combination of ICM and GCM achieving a good compromise betweenvessels whose intensity gain has been tuned and vessels with uniform tissue density.The center of mass of the image intensities is given by:
ICM =
(∑
ni=1 i ∑
mj=1 I(i, j)
∑ni=1 ∑
mj=1 I(i, j)
,∑
mj=1 j ∑
ni=1 I(i, j)
∑ni=1 ∑
mj=1 I(i, j)
)
The geometric center of mass of a set of N points roughly lying on the adventitia (the moststable structure along the sequence) (xk, yk) is computed as follows:
GCM =1
N
(N
∑k=1
xk,N
∑k=1
yk
)
188 Intravascular Ultrasound
www.intechopen.com

The Benefits of IVUS Dynamics for Retrieving Stable Models of Arteries 5
Finally, the following formula weights both centers of mass, taking into account the deviationof the vessel from the center of the image (Hernàndez-Sabaté et al., 2009):
VCM = DR · ICM + (1 − DR) · GCM (1)
where DR is the vessel-catheter deviation rate (i.e. the deviation of the vessel from the centerof the image). If we consider the maximum, Rmax, and minimum, Rmin, distances of the set(xk, yk)k to the image center, DR is defined as:
DR =mink(
√x2
k + y2k)
maxk(√
x2k + y2
k)=
Rmin
Rmax
Fig. 5. Computation of the Vessel Center of Mass
We note that in case the artery is centered at the catheter, DR measures its eccentricity. Figure5 shows the computation of the Vessel Center of Mass from computation of the Image andGeometric Centers of Mass given by formula (1).
2.2 Rotation
Once vessel translation has been compensated, two global motions still remain: rotation andradial scaling. In the polar domain with origin VCM, they convert into a horizontal translation(corresponding to rotation) and a vertical scaling (corresponding to radial scaling). In the caseof human coronary arteries, scaling is very close to 1 (Ramírez, 2005), so λ = 1 + ε becomesa perturbation of identity given by ε (Hernàndez-Sabaté, 2009). The horizontal translation isestimated by means of the computation of the phase of the ratio of Fourier transforms of everytwo consecutive frames (Hernàndez-Sabaté et al., 2009).That is, if I1, I2 are two functions (images) that differ in a pure translation:
I2(i, j) = I1(i − t1, j − t2)
189The Benefits of IVUS Dynamics for Retrieving Stable Models of Arteries
www.intechopen.com
6 Will-be-set-by-IN-TECH
the first order approximation to I2 can be computed by applying the Fourier transform
(Oppenheim & Willsky, 1997) and using phase correlation (Kuglin & Hines, 1975). Let I1,
I2 be the Fourier transforms of I1 and I2, respectively, then they are related via:
I2(ω) = I1(ω)e−i〈ω,t〉
for �ω = (ω1, ω2) the Fourier frequency,�t = (t1, t2) and 〈�ω,�t〉 = ω1t1 + ω2t2 the Euclideanscalar product.If we consider the phase, ρ(ω), of the ratio between the two Fourier transforms (Alliney, 1993),then we have that:
ρ(ω) = ρ
(I2(ω)
I1(ω)
)= ρ
(e−i〈ω,t〉
)= 〈ω, t〉 = ω1t1 + ω2t2
so that the points (ω1, ω2, ρ(ω)) lie on a plane, Π, with the slopes given by the translationcomponents:
Π : ρ(ω) = t1ω1 + t2ω2
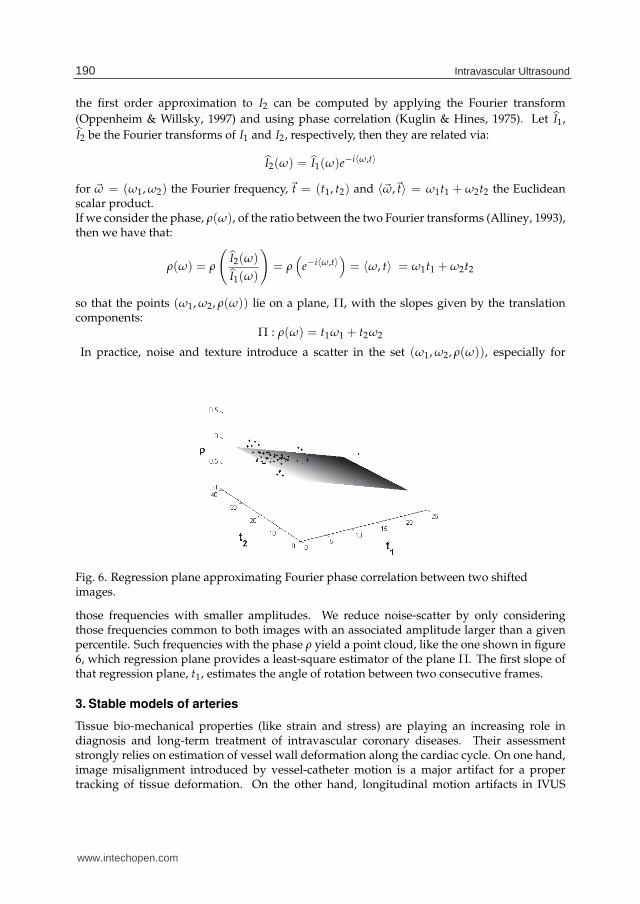
In practice, noise and texture introduce a scatter in the set (ω1, ω2, ρ(ω)), especially for
Fig. 6. Regression plane approximating Fourier phase correlation between two shiftedimages.
those frequencies with smaller amplitudes. We reduce noise-scatter by only consideringthose frequencies common to both images with an associated amplitude larger than a givenpercentile. Such frequencies with the phase ρ yield a point cloud, like the one shown in figure6, which regression plane provides a least-square estimator of the plane Π. The first slope ofthat regression plane, t1, estimates the angle of rotation between two consecutive frames.
3. Stable models of arteries
Tissue bio-mechanical properties (like strain and stress) are playing an increasing role indiagnosis and long-term treatment of intravascular coronary diseases. Their assessmentstrongly relies on estimation of vessel wall deformation along the cardiac cycle. On one hand,image misalignment introduced by vessel-catheter motion is a major artifact for a propertracking of tissue deformation. On the other hand, longitudinal motion artifacts in IVUS
190 Intravascular Ultrasound
www.intechopen.com

The Benefits of IVUS Dynamics for Retrieving Stable Models of Arteries 7
sequences hinders a properly 3D reconstruction and vessel measurements. Furthermore,vessel plaque assessment by analysis of IntraVascular UltraSound sequences is a useful toolfor cardiac disease diagnosis and intervention. Manual detection of luminal (inner) andmedial-adventitial (external) vessel borders is the main activity of physicians in the process oflumen narrowing (plaque) quantification. Difficult definition of vessel border descriptors, aswell as, shades, artifacts, and blurred signal response due to ultrasound physical propertiestrouble automated adventitia segmentation.
Fig. 7. Images extracted from an IVUS pullback. The left image is a block of 16 IVUSconsecutive frames from a constant pullback. The right top image is a single cross-section ofthe vessel. The right bottom image is a longitudinal view obtained by intersecting 401 frameswith the grey plane at the same angle.
Figure 7 shows a block of IVUS images obtained from a pullback (on the left) and the twokind of images derived from them (on the right). Each sequence frame (on the top right)shows a cross-section of the vessel under study with a complete detail of its morphology. Theframes on the left can be intersected by a longitudinal plane including the catheter trajectory(grey plane on fig.7, left graphic), defined by a fixed angle on cross sections. The imageobtained in this way is called longitudinal cut of the artery (bottom-right image). The imagemisalignment can be appreciated in the echo-shadowing calcified plaque of the upper profileof the longitudinal cut.A framework integrating the solution for the three limitations of IVUS (image misalignment,longitudinal motion and adventitia segmentation) should be of utmost importance for clinicalpractice. In the above section, we have presented a method for assessing IVUS rigid in-planemotion. This estimation allows us to compute the following three steps for achieving anintegrative framework of stable models of arteries useful for clinical practice. On one hand,translation and rotation estimation serves to stabilize the sequence by removing cardiacdynamics. On the other side, we present the potential of rigid motion estimation forapproaching cardiac phase retrieval from coronary IVUS sequences without ECG signal for
191The Benefits of IVUS Dynamics for Retrieving Stable Models of Arteries
www.intechopen.com

8 Will-be-set-by-IN-TECH
correction of longitudinal motion artifacts. Finally, we show the benefits of using stabilizedsequences for improving the computational time of automatic adventitia segmentationalgorithms.
3.1 Sequence stabilization
The rigid motion that cardiac vessels undergo is a complex dynamical process which resultsfrom the combination of several contributions. In general, it presents a geometric componentrelated to the artery 3D shape and a dynamic one induced by breathing and cardiacmovements (Rosales et al., 2004). Depending on the particular problem to approach, eachof the terms should have a specific treatment. Exploring artery geometry might be derivedby analyzing the geometric component (Rotger et al., 2006), whereas extraction of cardiacdynamics concerns the cardiac dynamical contribution (Zhu et al., 2003). In the case of vesselbiomechanics analysis, the goal is to produce a static model allowing a better tissue trackingalong the segment. Firstly, the reader should note that, without further analysis, the geometriccomponent does not reach a reliable 3D representation of the vessel geometry, which mightlead to wrong static models. Secondly, even if one could infer the true 3D geometry fromit, by compensating vessel tortuosity there is no guarantee of a better alignment of vesselplaque. This suggests only correcting the dynamical terms of the translation and rotation forstabilizing the sequence.For that, the signal obtained is decoupled in the Fourier domain into geometric, breathing andcardiac component and the last component serves to stabilize the images along the sequence(Hernàndez-Sabaté, 2009). The translation and rotation parameters are functions of the times. If the geometric term of a motion parameter is denoted by the subindex g, the cardiacterm, induced by heart beating, is denoted by the subindex c and breathing contributions aredenoted by the subindex b, the angle and translation decompose into:
t(s) = tg(s) + tb(s) + tc(s) (2)
θ(s) = θg(s) + θb(s) + θc(s)
Focusing on the Fourier series of these components, breathing and cardiac terms areperiodic and, thus, have a discrete Fourier spectrum, whereas geometry has a broad-band(non-discrete) spectrum (Oppenheim & Willsky, 1997). As usual, Fourier transforms areindicated by a hat ( ˆ ) over functions. Principal harmonics have been learned by supervisedclassification of the spectrum of a training set of 30 patients without apparent lesions usedin a study for assessment of myocardial perfusion in contrast angiography (Gil et al., 2008).Confidence intervals of the 95% yield the expected ranges for the principal frequency of eachof the periodic components. For breathing it is (10, 45) repetitions per minute (rpm), whilefor cardiac motion it is (45, 200) rpm. Thus, cardiac motion principal harmonic, ωc, is definedas the first local maximum in Iωc = (45, 200) rpm and the term is approximated by the first10 harmonics, (kωc)k=1:10. For the sake of an efficient algorithm, ωc is approximated by theglobal maximum of Fourier transform amplitude for frequencies in the range Iωc. It followsthat the cardiac motion term of a sequence lasting NSec seconds is given by:
tc(s) =1
T
k=10
∑k=1
t(kωc)eikωcs θc(s) =
1
T
k=10
∑k=1
θ(kωc)eikωcs
where the period T = NSec/60 is the sequence length (in minutes) and defines the domain ofintegration.
192 Intravascular Ultrasound
www.intechopen.com

The Benefits of IVUS Dynamics for Retrieving Stable Models of Arteries 9
Since, even in healthy cases, the heart rate varies along the pullback, the peaks in the Fourierseries are spread around the theoretic harmonic frequencies. The more irregularities inperiodicity are, the more spread around the theoretic harmonic the Fourier development is.The harmonics less corrupted by noise are obtained by optical filtering (Klug & D.J.DeRosier,1966). Optical filtering is a technique widely used in electron crystallography in orderto discard harmonics corrupted with noise. Optical filtering selects only those harmonicspresenting a prominent peak. The peakedness of an harmonic is given by the normalizeddifference between the amplitude achieved at the harmonic and an average of amplitudes ina neighborhood Ikωc
centered at the harmonic:
OF(kωc) =|F(kωc)|
S− 1
N × S ∑x∈Ikωc \kωc
|F(x)| (3)
where F stands for either t or θ, S = ∑x∈Ikωc|F(x)| and N is the number of harmonics in Ikωc
.Harmonics selected by optical filtering are the only contributions to the sums in (3).
Fig. 8. Motion Decomposition. Rotation angle and its Fourier decomposition on the left;geometric, breathing and cardiac terms on the right.
Figure 8 shows the Fourier terms decoupling for the rotation angle in the top left plot. Verticallines in the Fourier spectrum of the signal (bottom left plot) indicate the ranges defined for the3 phenomena. Dots mark the 10 cardiac harmonics and squares the ones selected after opticalfiltering. The 3 components of the angle are shown in right plots.Finally, the linear application mapping the artery at a given time to the artery at time zero isgiven by: (
xy
)=
(cos(θc) − sin(θc)sin(θc) cos(θc)
)(x − VCMx
c
y − VCMyc
)(4)
193The Benefits of IVUS Dynamics for Retrieving Stable Models of Arteries
www.intechopen.com

10 Will-be-set-by-IN-TECH
for VCMc = (VCMxc , VCM
yc ) the cardiac component of the position of the vessel center of
mass and θc the cardiac component of the angle of rotation in degrees.
3.2 Cardiac phase retrieval
The first step for modeling longitudinal motion in IVUS sequences is retrieving informationabout the cardiac phase. Following the general scheme shown in figure 9, our image-basedalgorithm to approach ECG sampling (Hernàndez-Sabaté et al., 2011) splits in the followingthree steps.
Fig. 9. Pipeline for Image-based Cardiac Phase Retrieval
1. Extraction of Signal Reflecting Cardiac Motion:
By the physical coupling (Nadkarni et al., 2003), luminal area evolution is synchronizedto other vessel cardiac phenomena, such as tissue motion or rigid motion. It follows that,since rigid in-plane motion comes from artery motion due to heart pumping, the angle ofrotation is also synchronized to cardiac phase. In particular the periodic component, θc,given in Section 2 is a signal reflecting (pure) cardiac motion.
2. Signal Filtering for Cardiac Profile Extraction: Even in healthy subjects, cardiac frequencydoes not remain constant along the sequence. This artifact introduces (among otherphenomena) irregularities in the Fourier transform of the cardiac motion profile. Theirregularities distort the cardiac signal and corrupt the location of local extrema in thesignal reflecting cardiac motion. Following the literature, we filter the cardiac profile withtwo families of band-pass filters centered at the cardiac frequency ωc: Butterworth (B)(Zhu et al., 2003) and Gaussian-based (g) (Matsumoto et al., 2008).
The Butterworth filter is defined as:
B(ω) =1√
1 +( |ω|−ωc
0.6∆ωc
)2n
where n is related to the filter decay and ∆ω = δωc to its support. Meanwhile, the Gaussianfilter is defined as:
g(ω, σ) =1
σ√
2πe−(|ω|−ωc)2/(2σ2)
In this case, the decay cannot be handled (it is always exponential) and only its supportmight be tuned by its deviation σ.
Figure 10 shows a signal reflecting cardiac motion filtered by a Butterworth filter withparameters n = 2, δ = 0.1. In the top left image, we present the original filter. The Fouriertransform is computed and shown in the bottom left image. The result of the productbetween its Fourier transform and the filter is shown in the bottom right image. The finalresult is shown in the top right image.
The real part of the inverse Fourier transform of the filtered cardiac profile is a smoothsignal suitable for cardiac phase retrieval. Regardless of the filter used we will denote it byFilt.
194 Intravascular Ultrasound
www.intechopen.com

The Benefits of IVUS Dynamics for Retrieving Stable Models of Arteries 11
Fig. 10. Signal filtering with a Butterworth filter with parameters n = 2; δ = 0.1
Figure 11 plots the rotation motion profile on a longitudinal cut (on the left) and the profilefiltered on the same cut (on the right). Note that the most prominent minimums andmaximums of the cardiac profile, on the left, correspond to the minimums and maximumsof the filtered signal on the right, though it is necessary to filter the signal in order to extractthe cardiac phase.
Fig. 11. Original rotation motion profile and the corresponding filtered one.
3. Cardiac Phase Retrieval: Maximums and minimums of the filtered signal give a samplingat end-systole and end-diastole and, thus, retrieve cardiac phase for each selected pixel.Extrema positions are computed in the Fourier domain using the equation:
f ′ = 2πiω f
for speeding up the process, since f has already been computed.
195The Benefits of IVUS Dynamics for Retrieving Stable Models of Arteries
www.intechopen.com
12 Will-be-set-by-IN-TECH
3.3 Vessel structures detection
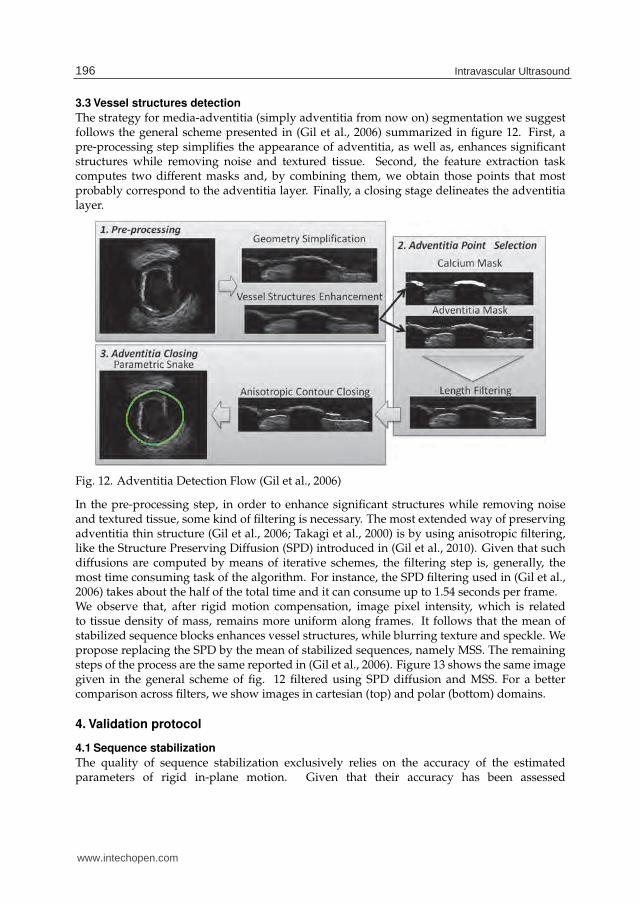
The strategy for media-adventitia (simply adventitia from now on) segmentation we suggestfollows the general scheme presented in (Gil et al., 2006) summarized in figure 12. First, apre-processing step simplifies the appearance of adventitia, as well as, enhances significantstructures while removing noise and textured tissue. Second, the feature extraction taskcomputes two different masks and, by combining them, we obtain those points that mostprobably correspond to the adventitia layer. Finally, a closing stage delineates the adventitialayer.
Fig. 12. Adventitia Detection Flow (Gil et al., 2006)
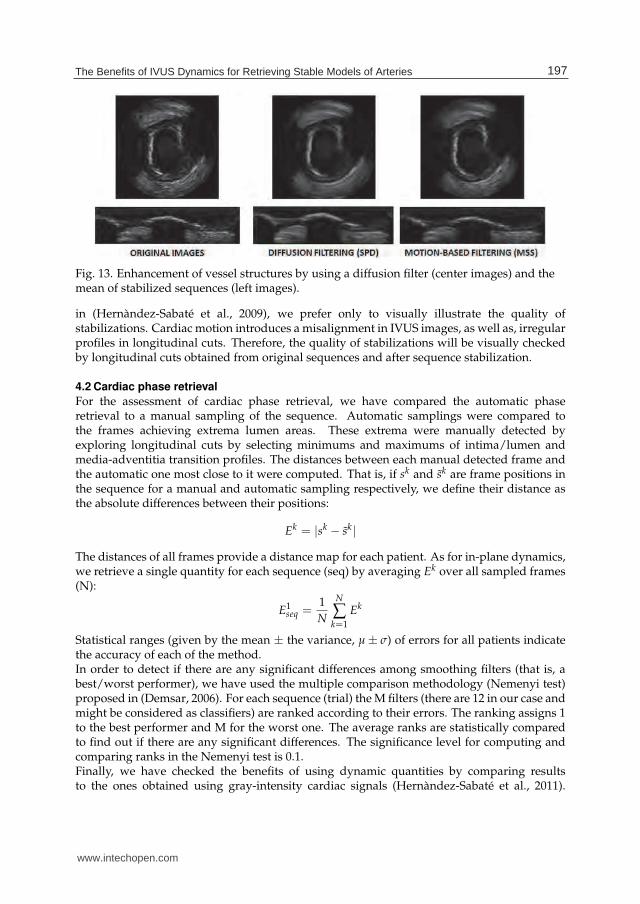
In the pre-processing step, in order to enhance significant structures while removing noiseand textured tissue, some kind of filtering is necessary. The most extended way of preservingadventitia thin structure (Gil et al., 2006; Takagi et al., 2000) is by using anisotropic filtering,like the Structure Preserving Diffusion (SPD) introduced in (Gil et al., 2010). Given that suchdiffusions are computed by means of iterative schemes, the filtering step is, generally, themost time consuming task of the algorithm. For instance, the SPD filtering used in (Gil et al.,2006) takes about the half of the total time and it can consume up to 1.54 seconds per frame.We observe that, after rigid motion compensation, image pixel intensity, which is relatedto tissue density of mass, remains more uniform along frames. It follows that the mean ofstabilized sequence blocks enhances vessel structures, while blurring texture and speckle. Wepropose replacing the SPD by the mean of stabilized sequences, namely MSS. The remainingsteps of the process are the same reported in (Gil et al., 2006). Figure 13 shows the same imagegiven in the general scheme of fig. 12 filtered using SPD diffusion and MSS. For a bettercomparison across filters, we show images in cartesian (top) and polar (bottom) domains.
4. Validation protocol
4.1 Sequence stabilization
The quality of sequence stabilization exclusively relies on the accuracy of the estimatedparameters of rigid in-plane motion. Given that their accuracy has been assessed
196 Intravascular Ultrasound
www.intechopen.com
The Benefits of IVUS Dynamics for Retrieving Stable Models of Arteries 13
Fig. 13. Enhancement of vessel structures by using a diffusion filter (center images) and themean of stabilized sequences (left images).
in (Hernàndez-Sabaté et al., 2009), we prefer only to visually illustrate the quality ofstabilizations. Cardiac motion introduces a misalignment in IVUS images, as well as, irregularprofiles in longitudinal cuts. Therefore, the quality of stabilizations will be visually checkedby longitudinal cuts obtained from original sequences and after sequence stabilization.
4.2 Cardiac phase retrieval
For the assessment of cardiac phase retrieval, we have compared the automatic phaseretrieval to a manual sampling of the sequence. Automatic samplings were compared tothe frames achieving extrema lumen areas. These extrema were manually detected byexploring longitudinal cuts by selecting minimums and maximums of intima/lumen andmedia-adventitia transition profiles. The distances between each manual detected frame andthe automatic one most close to it were computed. That is, if sk and sk are frame positions inthe sequence for a manual and automatic sampling respectively, we define their distance asthe absolute differences between their positions:
Ek = |sk − sk|
The distances of all frames provide a distance map for each patient. As for in-plane dynamics,we retrieve a single quantity for each sequence (seq) by averaging Ek over all sampled frames(N):
E1seq =
1
N
N
∑k=1
Ek
Statistical ranges (given by the mean ± the variance, μ ± σ) of errors for all patients indicatethe accuracy of each of the method.In order to detect if there are any significant differences among smoothing filters (that is, abest/worst performer), we have used the multiple comparison methodology (Nemenyi test)proposed in (Demsar, 2006). For each sequence (trial) the M filters (there are 12 in our case andmight be considered as classifiers) are ranked according to their errors. The ranking assigns 1to the best performer and M for the worst one. The average ranks are statistically comparedto find out if there are any significant differences. The significance level for computing andcomparing ranks in the Nemenyi test is 0.1.Finally, we have checked the benefits of using dynamic quantities by comparing resultsto the ones obtained using gray-intensity cardiac signals (Hernàndez-Sabaté et al., 2011).
197The Benefits of IVUS Dynamics for Retrieving Stable Models of Arteries
www.intechopen.com

14 Will-be-set-by-IN-TECH
Therefore for the sake of a faithful comparison, the experimental set is the same usedin (Hernàndez-Sabaté et al., 2011): 22 vessel segments 420-690 frames long (7-11.5 mmapproximately) recorded with a Galaxy-BostonSci device at 40 MHz, with a rotating singletransducer and constant pullback speed of 0.5 mm./s. The digitalization rate was 30 fps.
4.3 Vessel structures detection
The goal of this experiment is checking wether the rotation angle can produce accurate enoughadventitia segmentations, while significantly reducing computational time. Therefore, wehave compared segmentations obtained using MSS filtering to SPD diffusion (Gil et al., 2006)in terms of quality of the segmentations and computational cost.In this case, ground truth is given by manual identification of the adventitia in IVUS images.Since discrepancies among experts provide a non-unique ground truth, we follow the sameprotocol described in (Gil et al., 2006), based on comparisons of inter-observer variability tomanual segmentations. The accuracy has been assessed by means of absolute (in millimeters)and relative (in percent) distances. If p = (xp, yp) denotes the points corresponding to anautomatic contour, its absolute distance to the manual contour is defined as:
D(p) = minq∈γ
√(xp − xq)2 + (yp − yq)2 (5)
and relative distances correspond to the ratio:
RelD(p) = 100 · D(p)
d(q, O)
for the origin O the center of mass of the manual contour and q the point achieving theminimum in (5). Absolute distances are given in mm and relative ones in percentages.For each distance error, we compute its maximum and mean values on the automated contourto measure accuracy in positions.
• Maximum distance errors:
MaxD = maxp(D(p) · PixSze))
RelMaxD = maxp(RelD(p))
• Mean distance errors:
MeanD = meanp(D(p) · PixSze))
RelMeanD = meanp(RelD(p))
for PixSze denoting the image spatial resolution and p is any point on the automatically tracedadventitia. The interval given by the mean ± standard deviation computed over the 4 expertscontours indicate the statistical range of values for each of the automated errors (MaxD,RelMaxD, MeanD, RelMeanD). Inter-observer variability is obtained by computing the errormeasures for the models made every two independent observers and it, thus, quantifiesdiscrepancy among experts.Concerning computational time, we have considered maximums and ranges for the followingtasks: Rigid In-plane Motion Estimation (RME), adventitia segmentation by means of Meanof Stabilized Sequences (MSS), adventitia segmentation by means of Structures PreservingDiffusion (SPD). For a better quantification of time improvement, we have also considered
198 Intravascular Ultrasound
www.intechopen.com
The Benefits of IVUS Dynamics for Retrieving Stable Models of Arteries 15
the ratio between both segmentation techniques (SPD/MSS) and the ratio taking into accountthe time computation for Rigid In-plane Motion Estimation (SPD/(MSS+RME)).Since we want to compare MSS filtering to the anisotropic filtering used in (Gil et al., 2006),the experimental setting is the same reported in (Gil et al., 2006). A total number of 5400images extracted from 22 vessel segments of a length ranging from 4 to 6 mm (200-300 frames).Sequences were recorded with a Boston Scientific Clear View Ultra scanner at 40 MHz withconstant pull-back at 0.5 mm/s and a digitalization rate of 25 frames/s.
5. Results
5.1 Sequence stabilization
Figure 14 shows two longitudinal cuts taken at the white lines on the IVUS left imageand the same cut after sequence alignment. Each IVUS image cuts present the two mainartifacts induced by vessel dynamics in in vivo pullbacks. The upper longitudinal cutsshow the saw-tooth-shape pattern of the vessel intima wall (dark line) introduced by relativevessel-catheter translation. The profile of bottom cuts presents a structure misalignment dueto the relative vessel-catheter rotation for an echo-shadowing calcified plaque. After sequencestabilization, the vessel wall profiles of upper cuts are straight and continuous, whereascalcium shows a uniform appearance.
5.2 Cardiac phase retrieval
As in (Hernàndez-Sabaté et al., 2011), the set of filters scanned, Gi for gaussian filters and Bi
for Butterworth ones is the following.
G1 : {σ = 0.001}; G2 : {σ = 1.5}; G3 : {σ = 10}
B1 : {n = 1, δ = 0.5}; B2 : {n = 1, δ = 0.05}; B3 : {n = 1, δ = 0.005};B4 : {n = 2, δ = 0.5}; B5 : {n = 2, δ = 0.05}; B6 : {n = 2, δ = 0.005};B7 : {n = 4, δ = 0.5}; B8 : {n = 4, δ = 0.05}; B9 : {n = 4, δ = 0.005}
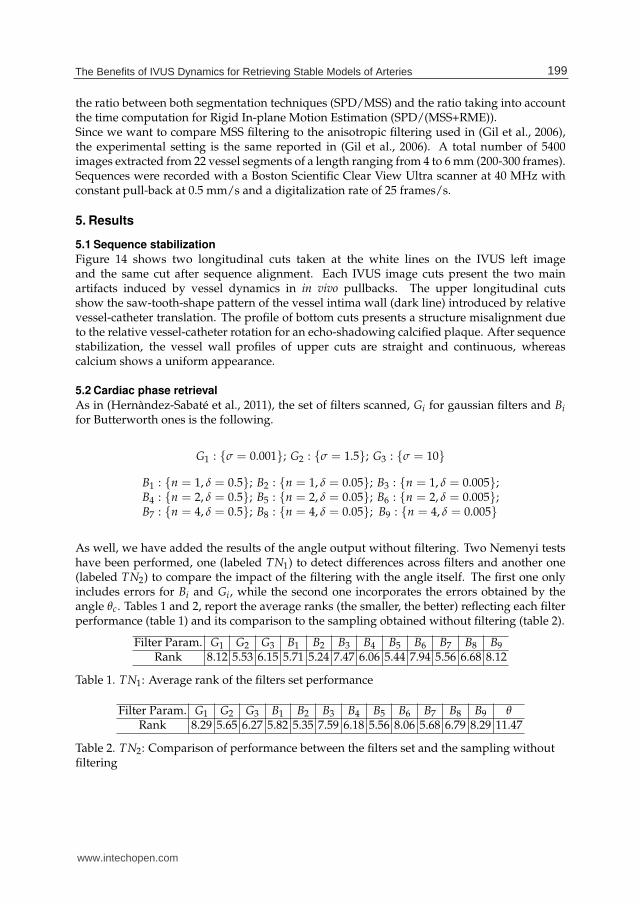
As well, we have added the results of the angle output without filtering. Two Nemenyi testshave been performed, one (labeled TN1) to detect differences across filters and another one(labeled TN2) to compare the impact of the filtering with the angle itself. The first one onlyincludes errors for Bi and Gi, while the second one incorporates the errors obtained by theangle θc. Tables 1 and 2, report the average ranks (the smaller, the better) reflecting each filterperformance (table 1) and its comparison to the sampling obtained without filtering (table 2).
Filter Param. G1 G2 G3 B1 B2 B3 B4 B5 B6 B7 B8 B9
Rank 8.12 5.53 6.15 5.71 5.24 7.47 6.06 5.44 7.94 5.56 6.68 8.12
Table 1. TN1: Average rank of the filters set performance
Filter Param. G1 G2 G3 B1 B2 B3 B4 B5 B6 B7 B8 B9 θRank 8.29 5.65 6.27 5.82 5.35 7.59 6.18 5.56 8.06 5.68 6.79 8.29 11.47
Table 2. TN2: Comparison of performance between the filters set and the sampling withoutfiltering
199The Benefits of IVUS Dynamics for Retrieving Stable Models of Arteries
www.intechopen.com

16 Will-be-set-by-IN-TECH
Fig. 14. Longitudinal cuts for sequences of two patients. The first column corresponds to arepresentative original frame, for each patient, with the angle of the longitudinal cuts. In thesecond column, the original longitudinal cut and the corrected one in the third column.
The Nemenyi critical difference (CD) for TN1 is 3.75, while for TN2 is 4.11. The test detectsthat the sampling without filtering is significatively worst than the filtered ones. However,the Nemenyi test also reports that there is not enough evidence of a significantly differentperformance among the filtered methods.Figures 15 and 16 show the rank of samplings from left to right (the best is on the left) togetherwith the critical difference in order to visually compare them. In figure 15 we can note thatthere is no significative difference among the filters. However, in figure 16, we can appreciatethat the sampling without filtering is clearly separated from the rest.
Fig. 15. Visually comparison of different filters using NT1.
Table 3 reports the ranges, by the mean ± the variance (μ ± σ) of the 8 filters of the set withbetter ranks. Values in the first column are in frames, the ones of the second column are inseconds and the last column correspond to the values in millimeters. As figure 15 shows,
200 Intravascular Ultrasound
www.intechopen.com
The Benefits of IVUS Dynamics for Retrieving Stable Models of Arteries 17
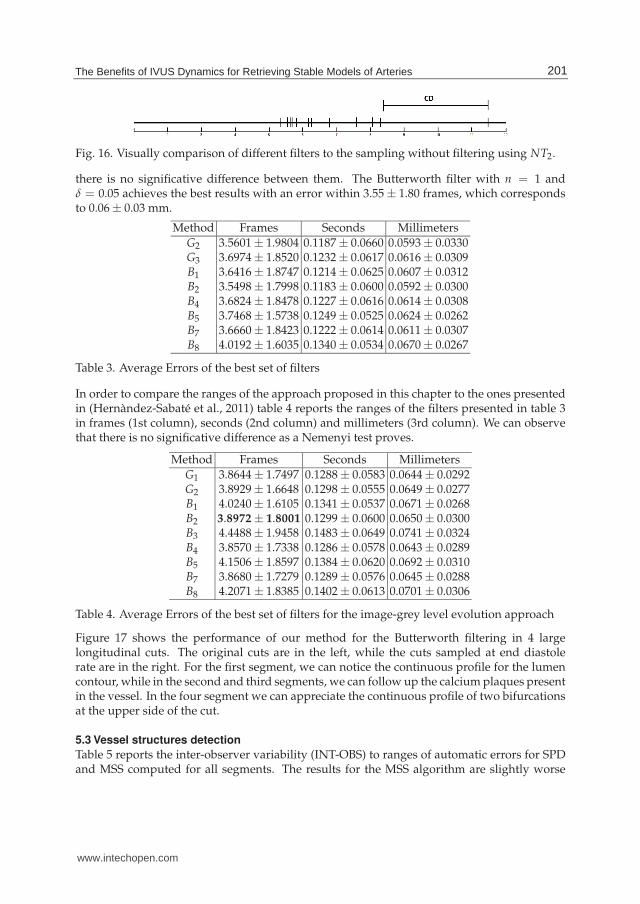
Fig. 16. Visually comparison of different filters to the sampling without filtering using NT2.
there is no significative difference between them. The Butterworth filter with n = 1 andδ = 0.05 achieves the best results with an error within 3.55 ± 1.80 frames, which correspondsto 0.06 ± 0.03 mm.
Method Frames Seconds Millimeters
G2 3.5601 ± 1.9804 0.1187 ± 0.0660 0.0593 ± 0.0330G3 3.6974 ± 1.8520 0.1232 ± 0.0617 0.0616 ± 0.0309B1 3.6416 ± 1.8747 0.1214 ± 0.0625 0.0607 ± 0.0312B2 3.5498 ± 1.7998 0.1183 ± 0.0600 0.0592 ± 0.0300B4 3.6824 ± 1.8478 0.1227 ± 0.0616 0.0614 ± 0.0308B5 3.7468 ± 1.5738 0.1249 ± 0.0525 0.0624 ± 0.0262B7 3.6660 ± 1.8423 0.1222 ± 0.0614 0.0611 ± 0.0307B8 4.0192 ± 1.6035 0.1340 ± 0.0534 0.0670 ± 0.0267
Table 3. Average Errors of the best set of filters
In order to compare the ranges of the approach proposed in this chapter to the ones presentedin (Hernàndez-Sabaté et al., 2011) table 4 reports the ranges of the filters presented in table 3in frames (1st column), seconds (2nd column) and millimeters (3rd column). We can observethat there is no significative difference as a Nemenyi test proves.
Method Frames Seconds Millimeters
G1 3.8644 ± 1.7497 0.1288 ± 0.0583 0.0644 ± 0.0292G2 3.8929 ± 1.6648 0.1298 ± 0.0555 0.0649 ± 0.0277B1 4.0240 ± 1.6105 0.1341 ± 0.0537 0.0671 ± 0.0268B2 3.8972 ± 1.8001 0.1299 ± 0.0600 0.0650 ± 0.0300B3 4.4488 ± 1.9458 0.1483 ± 0.0649 0.0741 ± 0.0324B4 3.8570 ± 1.7338 0.1286 ± 0.0578 0.0643 ± 0.0289B5 4.1506 ± 1.8597 0.1384 ± 0.0620 0.0692 ± 0.0310B7 3.8680 ± 1.7279 0.1289 ± 0.0576 0.0645 ± 0.0288B8 4.2071 ± 1.8385 0.1402 ± 0.0613 0.0701 ± 0.0306
Table 4. Average Errors of the best set of filters for the image-grey level evolution approach
Figure 17 shows the performance of our method for the Butterworth filtering in 4 largelongitudinal cuts. The original cuts are in the left, while the cuts sampled at end diastolerate are in the right. For the first segment, we can notice the continuous profile for the lumencontour, while in the second and third segments, we can follow up the calcium plaques presentin the vessel. In the four segment we can appreciate the continuous profile of two bifurcationsat the upper side of the cut.
5.3 Vessel structures detection
Table 5 reports the inter-observer variability (INT-OBS) to ranges of automatic errors for SPDand MSS computed for all segments. The results for the MSS algorithm are slightly worse
201The Benefits of IVUS Dynamics for Retrieving Stable Models of Arteries
www.intechopen.com
18 Will-be-set-by-IN-TECH
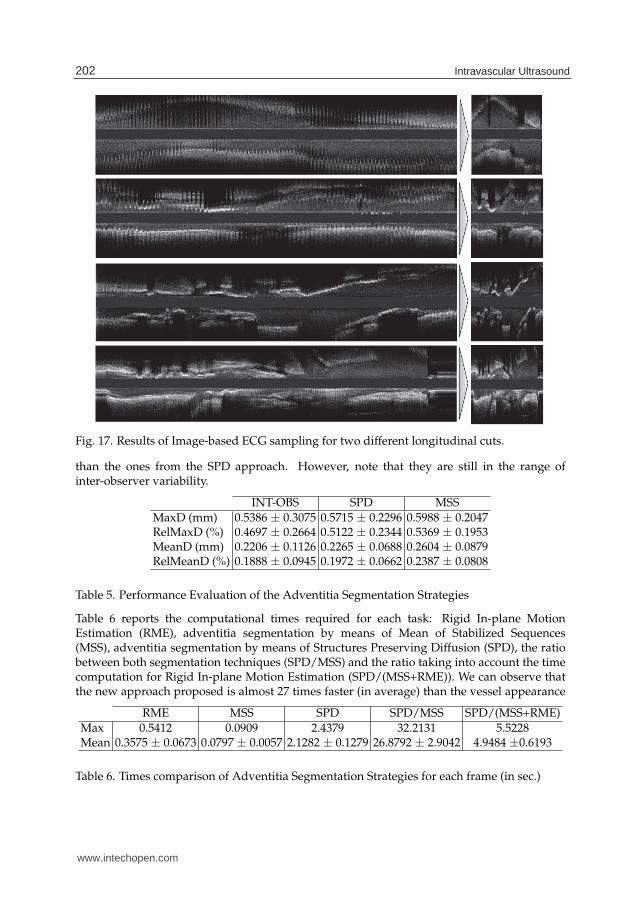
Fig. 17. Results of Image-based ECG sampling for two different longitudinal cuts.
than the ones from the SPD approach. However, note that they are still in the range ofinter-observer variability.
INT-OBS SPD MSS
MaxD (mm) 0.5386 ± 0.3075 0.5715 ± 0.2296 0.5988 ± 0.2047RelMaxD (%) 0.4697 ± 0.2664 0.5122 ± 0.2344 0.5369 ± 0.1953MeanD (mm) 0.2206 ± 0.1126 0.2265 ± 0.0688 0.2604 ± 0.0879RelMeanD (%) 0.1888 ± 0.0945 0.1972 ± 0.0662 0.2387 ± 0.0808
Table 5. Performance Evaluation of the Adventitia Segmentation Strategies
Table 6 reports the computational times required for each task: Rigid In-plane MotionEstimation (RME), adventitia segmentation by means of Mean of Stabilized Sequences(MSS), adventitia segmentation by means of Structures Preserving Diffusion (SPD), the ratiobetween both segmentation techniques (SPD/MSS) and the ratio taking into account the timecomputation for Rigid In-plane Motion Estimation (SPD/(MSS+RME)). We can observe thatthe new approach proposed is almost 27 times faster (in average) than the vessel appearance
RME MSS SPD SPD/MSS SPD/(MSS+RME)
Max 0.5412 0.0909 2.4379 32.2131 5.5228Mean 0.3575 ± 0.0673 0.0797 ± 0.0057 2.1282 ± 0.1279 26.8792 ± 2.9042 4.9484 ±0.6193
Table 6. Times comparison of Adventitia Segmentation Strategies for each frame (in sec.)
202 Intravascular Ultrasound
www.intechopen.com

The Benefits of IVUS Dynamics for Retrieving Stable Models of Arteries 19
diffusion approach. Although rigid in-plane motion estimation is useful for the wholeintegrative framework, we could take into account the time needed for computing it. Still,the new approach is 5 times faster (in average).
6. Discussions and conclusions
In this chapter we proposed an integrative framework for exploring vessel dynamics andstructures, so that to obtain stable models of arteries. We showed the potential of vesselin-plane rigid dynamics to analyze and correct vessel in-plane rigid dynamics, retrieve cardiacphase and aid the automatic segmentation of adventitia layer.In (Hernàndez-Sabaté et al., 2009) we already proved that rigid in-plane dynamics estimationcontributes in a proper image misalignment correction. In this chapter we also showedthe usefulness of this estimation for retrieving cardiac phase and we compared the methodproposed to other vessel appearance-based models. There are two main advantages in usinga dynamic quantity instead of the usual signals computed from image grey-level evolution(Barajas et al., 2007; Hernàndez-Sabaté et al., 2011; Matsumoto et al., 2008; Nadkarni et al.,2005). Firstly, since θc does not include non-cardiac phenomena (such as breathing) it requiresless specific tuning of the band-pass filtering. Secondly, it is computationally faster. Althougherrors ranges seem to be worse for the new approach, a Nemenyi test reports that there is nosignificative differences. Concerning the usefulness of rigid dynamics for the contribution tothe adventitia segmentation, the main improvement is the computational time. Nevertheless,the accuracy errors still keep within the range of inter-observer variability.For that reasons, we can conclude that rigid in-plane dynamics estimation has a high potentialfor developing useful techniques for clinical practice, and reducing drastically the timecomputation, since they can be parallelizable.
7. References
Alliney, S. (1993). Spatial registration of multiespectral and multitemporal digital imageryusing fast-fourier transform techniques, IEEE PAMI 15(5): 499–504.
Barajas, J., Caballero, K., Rodriguez, O. & Radeva, P. (2007). Cardiac phase extraction inIVUS sequences using 1-D gabor filters, 29th Annual International Conference of theIEEE EMBS.
Bouma, C. J., Niessen, W. J., Zuiderveld, K. J., Gussenhoven, E. J. & Viergever, M. A. (1997).Automated lumen definition from 30 MHz intravascular ultrasound images, Med.Image Anal 1: 363–377.
Brathwaite, P., Chandran, K., McPherson, D. & Dove, E. (1996). Lumen detection in humanIVUS images using region-growing, Computers in Cardiology, pp. 37–40.
Brathwaite, P. & McPherson, K. C. D. (1998). 3D IVUS border detection in highly diseasedarteries with dissecting flaps, Comp. in Card., pp. 157–160.
Brusseau, E., de Korte, C., Mastik, F., Schaar, J. & van der Steen, A. F. W. (2004). Fullyautomatic luminal contour segmentation in intracoronary ultrasound imaging: Astatistical approach, IEEE Trans. Med. Imag 23(5).
Caballero, K., Barajas, J., Pujol, O., Salvatella, N. & Radeva, P. (2006). In-vivo IVUS tissueclassification: A comparison between RF signal analysis and reconstructed images,Progress in Pattern Recognition, Image Analysis and Applications, Vol. 4225, pp. 137–146.
Céspedes, E., Korte, C. & van der Steen, A. (2000). Intraluminal ultrasonic palpation:assessment of local cross-sectional tissue stiffness, Ultrasound Med. Biol. 26: 385–396.
203The Benefits of IVUS Dynamics for Retrieving Stable Models of Arteries
www.intechopen.com

20 Will-be-set-by-IN-TECH
de Korte, C. L., Pasterkamp, G., van der Steen, A. F. W., Woutman, H. A. & Bom, N. (2000).Characterization of plaque components with intravascular ultrasound elastographyin human femoral and coronary arteries in vitro, Circulation 102: 617–623.
Demsar, J. (2006). Statistical comparisons of classifiers over multiple data sets, Journal ofMachine Learning Research 7: 1–30.
Dijkstra, J., Koning, G. & Reiber, J. (1999). Quantitative measurements in IVUS images, Inter.Journal of Cardiovas. Imag. 15(6): 513–522.
Dijkstra, J., Koning, G., Tuinenburg, J., Oemrawsingh, P. & Reiber, J. (2001). Automatic borderdetection in intravascular ultrasound images for quantitative measurements of thevessel, lumen and stent parameters, Computer Assisted Radiology and Surgery - CARS2001, pp. 916–922.
Escalera, S., Pujol, O., Mauri, J. & Radeva, P. (2008). IVUS tissue characterization withsub-class error-correcting output codes, Computer Vision and Pattern RecognitionWorkshops, 2008, pp. 1–8.
Fuster, V. (1994). Mechanisms leading to myocardial infarction: Insights from studies ofvascular biology, Circulation 90(4): 2126–2146.
Gil, D., Hernàndez, A., Rodriguez, O., Mauri, J. & Radeva, P. (2006). Statistical strategyfor anisotropic adventitia modelling in IVUS, IEEE Transactions on Medical Imaging25(6): 768–778.
Gil, D., Radeva, P. & Saludes, J. (2000). Segmentation of artery wall in coronary IVUS images:a probabilistic approach, Intern. Conf. Pat. Recog., pp. 352–355.
Gil, D., Rodriguez-Leor, O., Radeva, P. & Mauri, J. (2008). Myocardial perfusioncharacterization from contrast angiography spectral distribution, IEEE Trans. on Med.Imag. 27(5): 641–649.
Gil, D., Hernàndez-Sabaté, A., Brunat, M., Jansen, S. & Martínez-Vilalta, J. (2010).Structure-preserving Smoothing of Biomedical Images, Pattern Recognition44(9): 1842-1851.
Goldstein, H., Poole, C. & Safko, J. (2002). Classical Mechanics, 3rd edn, Addison Wesley.Granada, J. F., Wallace-Bradley, D., Win, H. K., Alviar, C. L., Builes, A., Lev, E. I., Barrios, R.,
Schulz, D. G., Raizner, A. E. & Kaluza, G. L. (2007). In vivo plaque characterizationusing intravascular ultrasound virtual histology in a porcine model of complexcoronary lesions, Arteriosclerosis, Thrombosis, and Vascular Biology 27: 387–393.
Haas, C., Ermert, H., Holt, S., Grewe, P., Machraoui, A. & Barmeyer, J. (2000). Segmentation of3D intravascular ultrasonic images based on a random field model, Ultrasound Med.Biol. 26(2): 297–306.
Hansen, M., Møller, J. & Tøgersen, F. (2002). Bayesian contour detection in a time seriesof ultrasound images through dynamic deformable template models, Biostatistics3(2): 213–228.
Hernàndez-Sabaté, A. (2009). Exploring Arterial Dynamics and Structures in IntraVascularUltraSound Sequences, PhD thesis, Universitat Autònoma de Barcelona.
Hernàndez-Sabaté, A., Gil, D., Fernandez-Nofrerias, E., Radeva, P. & Martí, E.(2009). Approaching rigid artery dynamics in IVUS, IEEE Trans. Med. Imag.28(11): 1670–1680.
Hernàndez-Sabaté, A., Gil, D., Garcia-Barnés, J. & Martí, E. (2011). Image-based cardiacphase retrieval in intravascular ultrasound sequences, IEEE Transaction on Ultrasonics,Ferroelectrics, and Frequency Control 58(1): 60–72.
204 Intravascular Ultrasound
www.intechopen.com
The Benefits of IVUS Dynamics for Retrieving Stable Models of Arteries 21
Holzapfel, G., Gasser, T. & Stadler, M. (2002). A structural model for the viscoelastic behaviorof arterial walls: continuum formulation and finite element analysis, Eur. J. Mech.A-Solids 23: 1–162.
Kakadiaris, I., O’Malley, S., Vavuranakis, M., Carlier, S., Metcalfe, R., Hartley, C., Falk, E. &Naghavi, M. (2006). Signal-processing approaches to risk assessment in coronaryartery disease, IEEE Signal Processing Magazine 23(6): 59–62.
Klingensmith, J., Shekhar, R. & Vince, D. (2000). Evaluation of three-dimensionalsegmentation algorithms for the identification of luminal and medial-adventitialborders in intravascular ultrasound, IEEE Med. Imag. 19(10): 996–1011.
Klug, A. & D.J.DeRosier (1966). Optical filtering of electron micrographs: reconstruction ofone-sided images, Nature 212: 29–32.
Kuglin, C. & Hines, D. (1975). The phase correlation image alignment method, Int. Conf. onCybernetics and Society, pp. 163–165.
Luo, Z., Wang, Y. & Wang, W. (2003). Estimating coronary artery lumen areawith optimization-based contour detection, IEEE Transactions on Medical Imaging22(4): 564–566.
Matsumoto, M. M. S., Lemos, P. A., Yoneyama, T. & Furuie, S. S. (2008). Cardiac phasedetection in intravascular ultrasound images, Medical Imaging 2008: UltrasonicImaging and Signal Processing.
Mazumdar, J. (1992). Biofluids Mechanics, World Scientific Publishing.Mendizabal-Ruiz, G., Rivera, M. & Kakadiaris, I. (2008). A probabilistic segmentation method
for the identification of luminal borders in intravascular ultrasound images, IEEEConference on Computer Vision and Pattern Recognition. CVPR 2008., pp. 1–8.
Mintz, G. & Nissen, S. (2001). Clinical expert consensus document on standards foracquisition, measurement and reporting of intravascular ultrasound studies (IVUS),JACC 37(5): 1478–92.
Nadkarni, S. ., Boughner, D. . & Fenster, A. . (2005). Image-based cardiac gating forthree-dimensional intravascular ultrasound imaging, Ultrasound in Medicine andBiology 31(1): 53–63.
Nadkarni, S., Austin, H. & et al (2003). A pulsating coronary vessel phantom fortwo and three-dimensional intravascular ultrasound studies., Ultrasound Med. Biol.29(4): 621–628.
Nair, A., Kuban, B. D., Tuzcu, E. M., Schoenhagen, P., Nissen, S. E. & Vince, D. G. (2002).Coronary plaque classification with intravascular ultrasound radiofrequency dataanalysis, Circulation 106: 2200–2206.
Okubo, M., Kawasaki, M., Ishihara, Y., Takeyama, U. et al. (2008). Tissue characterizationof coronary plaques: comparison of integrated backscatter intravascular ultrasoundwith virtual histology intravascular ultrasound, Circulation 72(10): 1631–9.
Olszewski, M. E., Wahle, A., Mitchell, S. C. & Sonka, M. (2004). Segmentation of intravascularultrasound images: a machine learning approach mimicking human vision, CARS,pp. 1045–1049.
Oppenheim, A. & Willsky, A. (1997). Signals and Systems, 2n edn, Prentice-Hall.Plissiti, M., Fotiadis, D., Michalis, L. & Bozios, G. (2004). An automated method for lumen
and media-adventitia border detection in a sequence of IVUS frames, IEEE Infor. Tech.Biomed. 8(2): 131–141.
205The Benefits of IVUS Dynamics for Retrieving Stable Models of Arteries
www.intechopen.com

22 Will-be-set-by-IN-TECH
Pujol, O. & Radeva, P. (2005). Handbook of Medical Image Analysis: Advanced Segmentationand Registration Models, Kluwer Academic/ Plenum Publishers, chapter SupervisedTexture Classification for Intravascular Tissue Characterization, pp. 57–110.
Ramírez, M. D. R. (2005). A Physics-Based Image Modelling of IVUS as a Geometric and KinematicsSystem, PhD thesis, Universitat Autònoma de Barcelona.
Rosales, M., Radeva, P., Mauri, J. & Pujol, O. (2004). Simulation model of intravascularultrasound images, MICCAI, Vol. 3217, pp. 200–7.
Rotger, D., Radeva, P. & Rodriguez, O. (2006). Vessel tortuosity extraction from IVUS images,Comp. in Card., pp. 689–692.
Sean M. O’Malley, Morteza Naghavi, I. A. K. (2006). Image-based frame gating forcontrast-enhanced IVUS sequences, International Workshop on Computer Vision forIntravascular and Intracardiac Imaging, International Workshop on CVIII, MICCAI.
Sonka, M., Zhang, X., DeJong, S. C., Collins, S. M. & McKay, C. R. (1996). Automated detectionof coronary wall and plaque borders in ECG-gated intravascular ultrasound pullbacksequences (abstract), Circulation 94 (Suppl.).
Sonka, M., Zhang, X. & Siebes, M. (1995). Segmentation of intravascular ultrasound images:A knowledge based approach, IEEE Med. Imag. 14: 719–732.
Takagi, A., Hibi, K., Zhang, X., Teo, T. J., Bonneau, H. N., Yock, P. G. & Fitzgerald, P. J. (2000).Automated contour detection for high-frequency IVUS imaging: a technique withblood noise reduction for edge enhancement, Ultrasound Med. Biol. 26(6): 1033–1041.
Unal, G., Bucher, S., Carlier, S., Slabaugh, G., Fang, T. & Tanaka, K. (2006). Shape-drivensegmentation of intravascular ultrasound images, Proc. of the International Workshopon Computer Vision for Intravascular Imaging (CVII), MICCAI, pp. 50–57.
von Birgelen, C., Mario, C., Li, W., Schuurbiers, J., Slager, C., de Feyter, P., Roelandt, J.& Serruys, P. (1996). Morphometric analysis in three-dimensional intracoronaryultrasound: An in vitro and in vivo study performed with a novel system for thecontour detection of lumen and plaque, Am. Heart Journal 132: 516–527.
von Birgelen, C., Mintz, G. S., Nicosia, A., Foley, D. P., van der Giessen, W. J., Bruining,N., Airiian, S. G., Roelandt, J. R. T. C., de Feyter, P. J. & Serruys, P. W. (1997).Electrocardiogram-gated intravascular ultrasound image acquisition after coronarystent deployment facilitates on-line three-dimensional reconstruction and automatedlumen quantification, J. Amer. Coll. Cardiol. 30: 436–443.
Waks, E., Prince, J. & Andrew, S. (1996). Cardiac motion simulator for tagged MRI, Proceedingof MMBIA. IEEE.
Wentzel, J., Krams, R., Schuurbiers, J. H., Oomen, J., Kloet, J., van der Giessen, W., Serruys, P.& Slager, C. (2001). Relationship between neointimal thickness and shear stress afterwallstent implantation in human coronary arteries, Circulation 103(13): 1740–5.
Zhu, H., Oakeson, K. D. & Friedman, M. H. (2003). Retrieval of cardiac phase from IVUSsequences, Medical Imaging 2003: Ultrasonic Imaging and Signal Processing, Vol. 5035,pp. 135–146.
206 Intravascular Ultrasound
www.intechopen.com
Intravascular UltrasoundEdited by Dr. Yasuhiro Honda
ISBN 978-953-307-900-4Hard cover, 207 pagesPublisher InTechPublished online 01, February, 2012Published in print edition February, 2012
InTech EuropeUniversity Campus STeP Ri Slavka Krautzeka 83/A 51000 Rijeka, Croatia Phone: +385 (51) 770 447 Fax: +385 (51) 686 166www.intechopen.com
InTech ChinaUnit 405, Office Block, Hotel Equatorial Shanghai No.65, Yan An Road (West), Shanghai, 200040, China
Phone: +86-21-62489820 Fax: +86-21-62489821
Intravascular ultrasound (IVUS) is a cardiovascular imaging technology using a specially designed catheterwith a miniaturized ultrasound probe for the assessment of vascular anatomy with detailed visualization ofarterial layers. Over the past two decades, this technology has developed into an indispensable tool forresearch and clinical practice in cardiovascular medicine, offering the opportunity to gather diagnosticinformation about the process of atherosclerosis in vivo, and to directly observe the effects of variousinterventions on the plaque and arterial wall. This book aims to give a comprehensive overview of this rapidlyevolving technique from basic principles and instrumentation to research and clinical applications with futureperspectives.
How to referenceIn order to correctly reference this scholarly work, feel free to copy and paste the following:
Aura Hernàndez-Sabaté and Debora Gil (2012). The Benefits of IVUS Dynamics for Retrieving Stable Modelsof Arteries, Intravascular Ultrasound, Dr. Yasuhiro Honda (Ed.), ISBN: 978-953-307-900-4, InTech, Availablefrom: http://www.intechopen.com/books/intravascular-ultrasound/the-benefits-of-ivus-dynamics-for-retrieving-stable-models-of-arteries