the benefits of planning your charging infrastructure ... slide… · charging infrastructure –...
TRANSCRIPT
Fleet Electrification
The benefits of planning your charging
infrastructure early
16 May 2018

2© Ricardo-AEA Ltd Ricardo Energy & Environment in Confidence
Today’s agenda
An overview of the drivers for fleet electrification
• Health impacts
• Policy changes now and forthcoming
• Economic and technical drivers
Charging Infrastructure
• AC versus DC?
• Technology on sale?
• How much charge do I really need?
Grid connection considerations
• Network overview
• Charging implications
• Future developments
Case study of city-wide charging infrastructure
• Outline of the process we use
• Specific examples and decisions taken
Questions

3© Ricardo-AEA Ltd Ricardo Energy & Environment in Confidence
Today’s presenters
Dan ClarkeRicardo Energy & Environment
Fleet Electrification Lead
Expert on fleet electrification and
clean air zones
Simon TerryRicardo Energy & Environment
Principal Consultant – Energy
Infrastructure
Expert on UK electricity networks and
smart grids
Denis NaberezhnykhRicardo Energy & Environment
Technical Director – Sustainable Transport
Expert on vehicle technologies and
charging infrastructure
Contact us for any questions after the webinar

4© Ricardo-AEA Ltd Ricardo Energy & Environment in Confidence
How to ask questions?
Everyone’s microphone is muted
Questions can be submitted at any time and will be answered at the end.
Attendee
control panel
Successful CRC Compliance webinar
Welcome to the CRC Compliance Webinar
If your panel is
minimised,
click the orange
button to expand it.
Type your
question here

5© Ricardo-AEA Ltd Ricardo Energy & Environment in Confidence
Do you think you have a good
understanding of your charging options?
Warm-up poll questions

6© Ricardo-AEA Ltd Ricardo Energy & Environment in Confidence
What would you consider to be the
main barriers to you implementing
charging infrastructure?
Warm-up poll questions

7© Ricardo-AEA Ltd Ricardo Energy & Environment in Confidence
Warm-up poll questions
When do you feel that you will plan to
implement charging infrastructure at
your locations?

8© Ricardo-AEA Ltd Ricardo Energy & Environment in Confidence
Drivers for low emission vehicles
• Clean Air Zones (CAZ)
• Ultra Low Emission Zones (ULEZ)
• Vehicle taxes and incentives
• Improving air quality for employees
• Improving air quality for communities
• Higher capex
• But savings in fuel expenditure
• Further savings in maintenance expenditure
Policy
Health
Total
Cost of
Ownership

9© Ricardo-AEA Ltd Ricardo Energy & Environment in Confidence
More and more emission controlled zones in the UK
• Leeds
• Nottingham
• Derby
• Birmingham
• Southampton
Clean Air Zones (CAZ)
Heathrow Airport Ultra-Low
Emission Zone (ULEZ) in 2025
Emission Controlled Sites
• Brighton and Hove
• Bristol
• London – T-Charge, ULEZ in 2019
• Oxford – World’s first ZEZ
• Norwich
• Manchester
• Glasgow
• Edinburgh
• 24 Local Authorities in
Defra’s new Air Quality
Plan exceeding NO2
emission levels
• Over 700 Air Quality
Management Areas
(AQMAs) across the UK
• No restriction on
implementing a CAZ
Other Controlled Emission
Zones (Includes planned)
Future Controlled Emission
Zones

10© Ricardo-AEA Ltd Ricardo Energy & Environment in Confidence
Navigating through the range of support and
incentives available can be a real challenge
Gov. grant funding up to £8,000 for new vans
Gov. grant funding for charge
points
Reduced VED for Low Emission Vehicles
Gov. funding for Local Authority on-street
chargers
Company Car Tax benefits
Gov. grant funding up to £4,500 for new cars
Enhanced capital
allowances
Minimal fuel duty
Access to restricted zones
(CAZ etc)
Free parking

11© Ricardo-AEA Ltd Ricardo Energy & Environment in Confidence
EV sales
0.2% 0.7% 1.3% 1.7% 1.9%
15%
30%
0%
5%
10%
15%
20%
25%
30%
0
10,000
20,000
30,000
40,000
50,000
60,000
2010 2011 2012 2013 2014 2015 2016 2017 2020 2025 2030
UK electric car and van sales
% UK Total % EU Target UK Car/Van EV Sales
Electric vehicle and charging technology is improving: battery costs
are coming down, electric range is increasing and TCO reducing
Total
TotalTotal
-5,000
-3,000
-1,000
1,000
3,000
5,000
7,000
9,000
2015 2020 2025
TC
O, N
PV
£
BEV End-user TCO versus Diesel ICEV, 5 yrs
CAPEX Fuel O&M
Av. van end user total cost of ownership, 5 yrs
Ric
ard
o a
naly
sis
Notes: Assumes 10% discount rate for Net Present Value of future costs/savings
Charging infrastructure
Ric
ard
o a
naly
sis
11 km/hour
24-32 km/hour
80 km/hour
160 km/hour 320-800 km/hour0
6
12
18
24
Slow Medium Fast Rapid Ultrafast
Up to 3.5 kW 7 kW 22 kW Up to 50 kW 90-350 kW
Charg
e T
ime
[ho
urs
]
Charging Rate
Technology improvements
DfT
Vehic
le S
tatistics
Hyundai Ioniq
Nissan Leaf
Renault Zoe
Tesla Model S
Jaguar I-PaceTesla Model S
(100 kWh)Mercedes
EQA
VW I.D. Concept
BMW
BMW i3 (33 kWh)
Nissan e-NV200
Nissan Leaf (40 kWh)
Renault Kangoo
Renault Master
0
100
200
300
400
500
2010 2012 2014 2016 2018 2020 2022
Electric range of selected models (miles)
7 m / hour
15-20
m / hour
30 m / hour
100 m / hour 200-500 m / hour

12© Ricardo-AEA Ltd Ricardo Energy & Environment in Confidence
Ricardo analysis: Over half of the
car models and a third of van
models responsible for the majority
of sales will have electric variants
by 2025
18
% 25
% 31
%
32
%
54
%
36
%
0%
10%
20%
30%
40%
50%
60%
Cars Vans Cars Vans Cars Vans
2018 2020 2025
% o
f M
ajo
r M
an
uf.
M
od
els
Generic models accounting for >90% sales
Manufacturers say they are committed to electrified and electric
vehicles; the number of models available is increasing rapidly
2017 2018 2019 2020 2021 2022 2023 2024 2025 2026 2027 2028 2029 2030
FCEV = hydrogen fuel cell electric vehicle
Electrified will include hybrids
Model 3
enters volume
production
Plan joint EV
platforms
First full EV
Targets 1M
sales of
electrified
vehicles
Plans 15-25%
of sales to be
electric
20 new all-
electric and
FCEV models
To launch
first
electrified
products
on Efficient
Modular
Platform
(EMP)
All models
to be
electrified25% vehicles
will be electric
All vehicles
will be hybrid
All models will
be electrified
To produce
0.5M
electrified
vehicles
40% of global
models will be
electrified
13 new
electrified
models
To have 7
PHEV and 4
BEV models
on EMP
Expects 50%
of models to
be electrified
Expects 15-25%
of models to be
electrified
Plans 30 new
EVs accounting
for up to 25% of
sales
Expects
2/3rds of
models to be
electrified
Plans to sell
1M electric
vehicles per
annum

13© Ricardo-AEA Ltd Ricardo Energy & Environment in Confidence
What is the main driver for providing
charging infrastructure on your
premises?
Poll 1

14© Ricardo-AEA Ltd Ricardo Energy & Environment in Confidence
OpportunitiesOptions to suit most operational
and fleet requirements
Charging Infrastructure –
State of the market, opportunities and risks
Source: www.ABB.com Source: www.pod-point.comSource:
www.rolecserve.com Source: ubitricity.com
Choices in EV charging :
• AC, DC and connector standards
• Power Level (speed of charging vs connection / infrastructure costs)
• Installation type
• Smart / networked or not
• Payment and activation options
• New technologies and business models
Potential RisksNot fit-for-purpose, stranded
assets, poor value for money

15© Ricardo-AEA Ltd Ricardo Energy & Environment in Confidence
DC EV charging:
• CCS or CHAdeMO standards (+ other proprietary, e.g. Tesla)
• Mostly used for rapid charging (~50 kW and above)
• Increased interest in ultra rapid chargers (up to 350kW)
ADVANTAGES
• High charging rate
• Does not rely on vehicle
on-board equipment
DISADVANTAGES
• More expensive hardware
and installation
• Competing standards
• Overuse can reduce
battery life Source: www.ABB.com Source: www.ionity.eu
Charging infrastructure – AC or DC?
AC EV charging:
• Single European charging standard (Mode 2 or Mode 3)
• Mostly a single plug type (Type 2)
• Single phase or three phase (3 kW to 43 kW)
ADVANTAGES
• Cheapest
• Simplest to install and
connect
• Many installation options
DISADVANTAGES
• Charging power limited by
vehicle charger
• Slower charging rate
Source:
www.rolecserve.com Source: ubitricity.comSource: www.pod-point.com

16© Ricardo-AEA Ltd Ricardo Energy & Environment in Confidence
What power level is right for you?
Charging infrastructure –
How to select how much charging power you need?
1. Appropriate for the vehicles using it and the journeys / duty cycle of those vehicles
2. EV charging IS NOT necessarily the same as petrol/diesel refuelling
3. It is about power level that enables charging time to recover necessary range.
Slow charging Ultra-fast charging
3-7kW 8-20miles/hour
(Domestic / work-place)
11-22kW30-60miles/hour
(Destination)
50kW (DC) 140miles/hour
up to 80% SoC max
(On-route)
120kW (DC) 340miles/hour
up to 80% SoC max
(Superfast/on-route)

17© Ricardo-AEA Ltd Ricardo Energy & Environment in Confidence
Other practical
considerations:
• Location of chargers
– fit for purpose
– minimises costs (e.g. grid connection)
• Vehicle charging port locations
– accessibility
– tethered or untethered units
• Enforcement
– bay markings
– discourage use by non-EVs
• Communication signal
– strength
– reliability
Charging infrastructure –
Practicalities of charging bays
Source: Rolec
Source: City EVSource: Siemens

18© Ricardo-AEA Ltd Ricardo Energy & Environment in Confidence
Smart charging?
• No standard but many OEM solutions and approaches
• OCCP (V1.6) is latest available open protocol for EV chargers, it has provisions for smart charging
and smart functionality
Charging infrastructure –
How smart is smart enough?
Smart charging = communications capability to send and receive data, and control capability to
respond to commands to turn off/on or to throttle charging power
NETWORKED CHARGERS• Remote control, diagnostics and
management
• Data collection, monitoring and
evaluation
SMART CHARGERS• Smart control functionality and
load balancing
• Can reduce grid connection
costs
• Can provide grid services
• Can link with on-site renewable
generation or storage
VEHICLE TO GRID (V2G)• Feed power back to the grid /
building / local storage
• Higher potential revenue stream
rom grid services

19© Ricardo-AEA Ltd Ricardo Energy & Environment in Confidence
Automated and Electric Vehicle Bill
• Smart charging and data provision
• Standardise pricing information availability
• Subscription-free access
• Charging points in large fuel retailers
Wireless Charging
• Already available as retrofit options
• Expected to be introduced by OEMs from 2018
• Costs will need to be reduced
V2G
• Ongoing technology and business case trials
• Vehicle and charger developments
Charging infrastructure –
Future developments and technologies
Source: Nissan

20© Ricardo-AEA Ltd Ricardo Energy & Environment in Confidence
Poll 2
Do you know who your DNO is?

21© Ricardo-AEA Ltd Ricardo Energy & Environment in Confidence
•System overview
•When is reinforcement required?
•Demand management
•Connection costs
•Network data and information
•Current industry initiatives
•Technology innovation
Grid connection considerations
22© Ricardo-AEA Ltd Ricardo Energy & Environment in Confidence
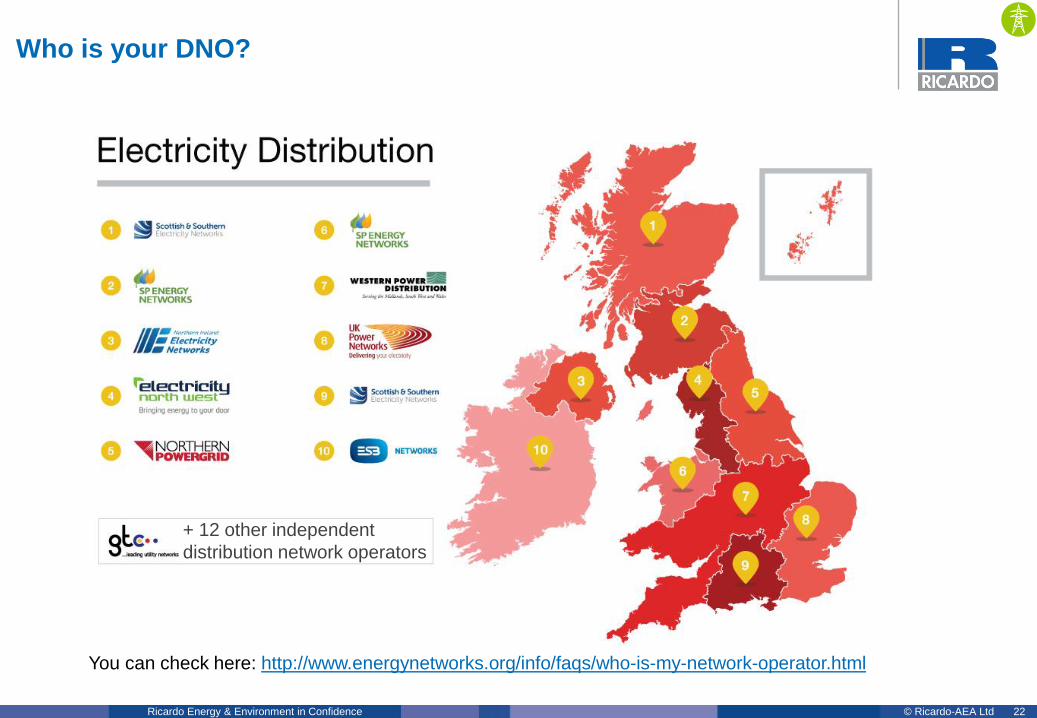
Who is your DNO?
+ 12 other independent
distribution network operators
You can check here: http://www.energynetworks.org/info/faqs/who-is-my-network-operator.html

23© Ricardo-AEA Ltd Ricardo Energy & Environment in Confidence
Simplified overview of the distribution of electricity
400 kV / 275 kVTransmission
Network
EHV (132 kV)Extra High Voltage
Network
HV (33 kV)
MV (11 kV )
LV (400 V three phase
- 230 V single phase)
High Voltage (HV)
Network
Grid Supply Point
Bulk Supply Point
Primary Substation
Secondary
Substation
Low Voltage (LV)
Distribution Network
Medium Voltage (MV)
Network
500 – 2000 MVA
100 – 500 MVA
20 – 100 MVA
0.2 – 1 MVA ~ 600 homes
> 65,000 homes
> 13,000 homes

24© Ricardo-AEA Ltd Ricardo Energy & Environment in Confidence
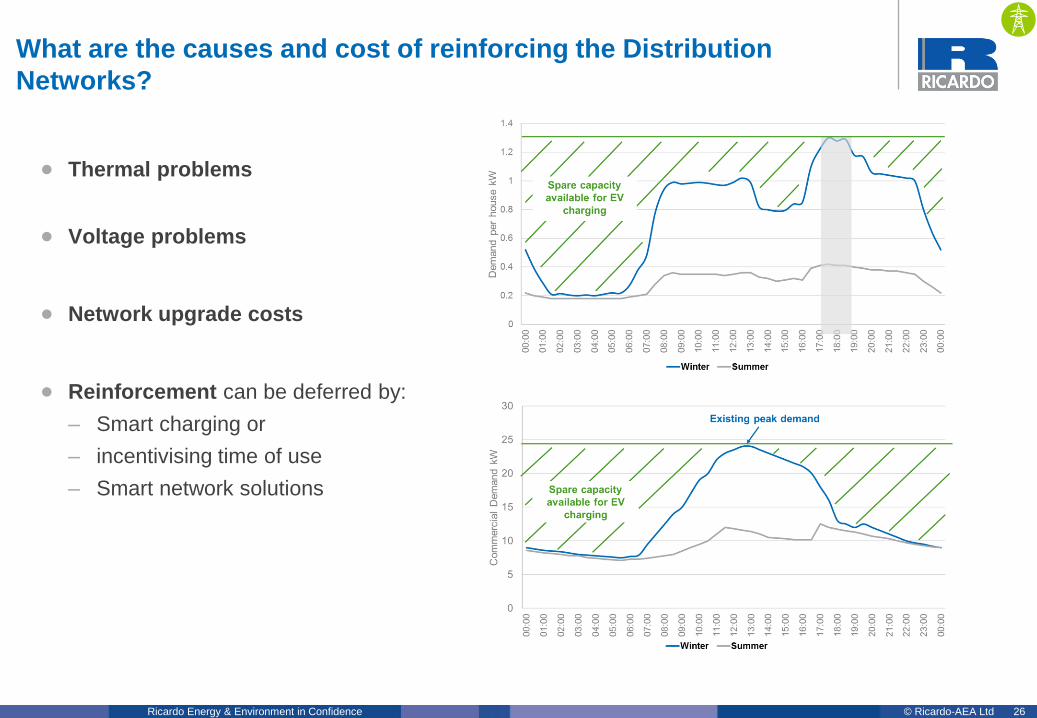
Peak demand will be the challenge
Typical household daily electricity demand
0
0.2
0.4
0.6
0.8
1
1.2
1.4
00:0
0
01
:00
02
:00
03
:00
04
:00
05
:00
06
:00
07
:00
08
:00
09
:00
10
:00
11
:00
12:0
0
13
:00
14
:00
15
:00
16
:00
17
:00
18
:00
19
:00
20
:00
21
:00
22
:00
23
:00
00:0
0
Dem
and p
er
house k
W
Winter Summer
Spare capacity
available for EV
charging
Existing peak demand

25© Ricardo-AEA Ltd Ricardo Energy & Environment in Confidence
Typical commercial daily electricity demand
0
5
10
15
20
25
30
00
:00
01:0
0
02
:00
03:0
0
04
:00
05:0
0
06
:00
07
:00
08
:00
09
:00
10
:00
11
:00
12
:00
13
:00
14
:00
15
:00
16
:00
17
:00
18
:00
19
:00
20
:00
21
:00
22
:00
23
:00
00
:00
Com
merc
ial D
em
and k
W
Winter Summer
Spare capacity
available for EV
charging
Existing peak demand
A substation with a different demand profile
26© Ricardo-AEA Ltd Ricardo Energy & Environment in Confidence
• Thermal problems
• Voltage problems
• Network upgrade costs
• Reinforcement can be deferred by:
– Smart charging or
– incentivising time of use
– Smart network solutions
What are the causes and cost of reinforcing the Distribution
Networks?

27© Ricardo-AEA Ltd Ricardo Energy & Environment in Confidence
• Managed or smart EV charging
could mitigate impact on peak
electricity demand
• Specific network reinforcements
will be needed where spare
capacity is low
• Many cars will not need to charge
every day
• Increasing EV range means vans
may not need to charge everyday
either
Managed or smart charging could mitigate impact on peak demand
but grid reinforcement costs are still estimated to be in the £bns
38% 6%50%6%
<1
miles
Average length of car journey
Source:Department for Transport, Road Use Statistics,
Great Britain, 2016, Julich report, Nicolas and Eraut
Estimated average length of van journeys
0 20 40 60 80 100 120 140
Not stated
Delivery/ collection of goods
Providing transport to others
Carriage of equipment
Private
miles / day
1-5
miles
5-25
miles
>25
miles

28© Ricardo-AEA Ltd Ricardo Energy & Environment in Confidence
How much might it cost to connect EV
chargers?
Poll 3

29© Ricardo-AEA Ltd Ricardo Energy & Environment in Confidence
Connection point example costs
• slow charging
locations,
• on-street locations
• car parks
15m service cable, and civil works £700
Single service breech joint £400
Total £1,100
CIC Charges £100
Existing LV cable
New
service
cable
Existing HV cable
New HV cable
New substation
New LV cables
• cluster of charging
points
• new cables
• substation –
including
transformer,
switchgear,
protection,
metering
Provision and installation of 150m HV cable £30,000
800 kVA substation £17,000
Provision and installing LV cabling £4,400
Metering Panel £800
HV joint to network £1,900
Total £54,000
CIC Charges £1,500Source: UKPN connection charging methodology
“worked example section”
New low voltage (LV) cabling New high voltage (HV) connection

30© Ricardo-AEA Ltd Ricardo Energy & Environment in Confidence
Available data
Network companies have
detailed information :
• DNO capacity (heat) maps
• Long term development statements
(10 years)
• Technical specifications
• Asset databases (Age, Condition,
Maintenance history etc.)
• Infrastructure route maps
• Some utilisation data
Source: WPD online tools
• Automated and Electric Vehicles Bill
– charge points must have ‘smart’
capability

31© Ricardo-AEA Ltd Ricardo Energy & Environment in Confidence
Ongoing areas of innovation
• Combined Solar Panels, storage,
charging hubs opportunities
– where grid capacity is limited
• Vehicle-to-Grid (V2G)
– Ability to earn revenue through grid
services
• Wireless charging
– Trials ongoing, uncertain impact on grid
Technology innovation

32© Ricardo-AEA Ltd Ricardo Energy & Environment in Confidence
Have you already starting planning
your infrastructure deployment?
Poll 4

33© Ricardo-AEA Ltd Ricardo Energy & Environment in Confidence
Informed purchasing decision
A myriad of factors must be considered in order to make a
successful purchasing decision
• Current and planned
local infrastructure
• Peak demand
• Proximity to
substations
• Proximity to and
grade of cables
• DNO policy
• Innovations and
future proofing
Technology
• AC versus DC
• Charger speed, one
or three phase
• Plug connections
• Location of chargers
and communications
• Enforcement policy
• Business model
• Innovations and
future proofing
Grid Infrastructure

34© Ricardo-AEA Ltd Ricardo Energy & Environment in Confidence
Ricardo applies a four step process in providing support to clients
on fleet electrification and charging infrastructure
1 Monitoring and
data collection 2 Modelling 3 Strategy
development 4Implementation,
planning and
delivery

35© Ricardo-AEA Ltd Ricardo Energy & Environment in Confidence
Case study of city-wide charging infrastructure feasibility study in
Brighton and Hove commissioned by Pebble Power
Reduce barriers for uptake of EVs
Supply overcapacity of charge points to guarantee
availability and increase opportunity charging
Support anticipated latent demand in areas
with on-street parking
Increase
EV sales
Reduce air
quality issues
Pebble Power had three key objectives
that gave a specific direction to the study

36© Ricardo-AEA Ltd Ricardo Energy & Environment in Confidence
Our research focused on the city…
•Commuter journeys around the city
•Areas with on-street parking
•Areas with a higher propensity to buy an EV
•Number of charge points in the area
•Grid infrastructure
Extracting good data is the key to making the correct investment
decisions and fulfilling the strategy
Source:
Southern Cross
Fishersgate
Brighton Local
Moulsecoomb

37© Ricardo-AEA Ltd Ricardo Energy & Environment in Confidence
…and also the technology on the market
•Vehicles likely to make up the EV population in Brighton
•Technology and its various costs and characteristics
Extracting good data is the key to making the correct investment
decisions and fulfilling the strategy
Make &
Model
Type Seats Approximate
Cost (£)
NEDC range
(miles)
Rapid
charge
capability
Socket Type/
charger
availability
Nissan Leaf BEV 5 £21,680- 28,000 124-235 YesDC fast charger -
CHAdeMO
Nissan E-
NV200 CombiBEV
5-7
(wheel chair
accessible)
£24,407 106 YesDC fast charger -
CHAdeMO
Tesla Model S BEV 5 £61,500 298-393 YesDC Tesla
Supercharger
Hyundai Ioniq BEV 5 £24,995 174 YesDC fast charger -
CCS
BYD E6 BEV 5 £47,000 249 Yes AC fast charger
LEVC TX REEV
6
(wheel chair
accessible)
£55,559 80-377 YesDC fast charger -
CCS
Kai Soul BEV 5 £25,495 132 YesDC fast charger –
CHAdeMO
We reviewed products from
a dozen suppliers• AC or DC
• speeds and phases
• payment options including
contactless
• CAPEX costs
• OPEX costs
– maintenance and back office
systems
• charger locations
– dedicated posts
– retrofit onto lampposts

38© Ricardo-AEA Ltd Ricardo Energy & Environment in Confidence
We then modelled these factors to support the client’s strategic
decision making
The modelling brought all the factors together to establish:
•Which areas of the city would benefit most from the additional infrastructure
•What would be the cost of upgrading the infrastructure

39© Ricardo-AEA Ltd Ricardo Energy & Environment in Confidence
The modelling brought all the factors together to establish:
•Could the technology be accessed by Brighton’s 11 million tourists
•Would the city benefit from rapid chargers
Destination Miles kWh Cost
Bournemouth 97 27.7 £5.54
Crawley 21 6 £1.20
Epsom 42 12 £2.40
Folkestone Eurostar 95 27 £5.43
Gatwick 27 7.7 £1.54
Heathrow 63 18 £3.60
Sandown Park 49 14 £2.80
Sevenoaks 49 14 £2.80
Wimbledon 49 14 £2.80
Winchester 74 21.4 £4.29
We then modelled these factors to support the client’s strategic
decision making

40© Ricardo-AEA Ltd Ricardo Energy & Environment in Confidence
The modelling brought all the factors together to establish:
•The most appropriate business model for a city wide charging infrastructure network
– Technology, Locations, Energy Networks, EV demand
We then modelled these factors to support the client’s strategic
decision making

41© Ricardo-AEA Ltd Ricardo Energy & Environment in Confidence
Recommendations
o Focus on-street charging
o Areas where additional charge points
forecast lead to higher penetration EVs
o Minimise cost through lamppost retrofits
o Identified location for slow, medium and
rapid charge points
o Take advantage of spare capacity
o Prioritising budget on charging units
o Use contactless payment systems
o Easy access for residents and visitors
o Reduce some back office expenditure
Using the evaluations provided by the model we could advise the
client in setting their strategy
Reduce barriers for uptake of EVs
Supply overcapacity of charge points to guarantee
availability and increase opportunity charging
Support anticipated latent demand in areas
with on-street parking
42© Ricardo-AEA Ltd Ricardo Energy & Environment in Confidence
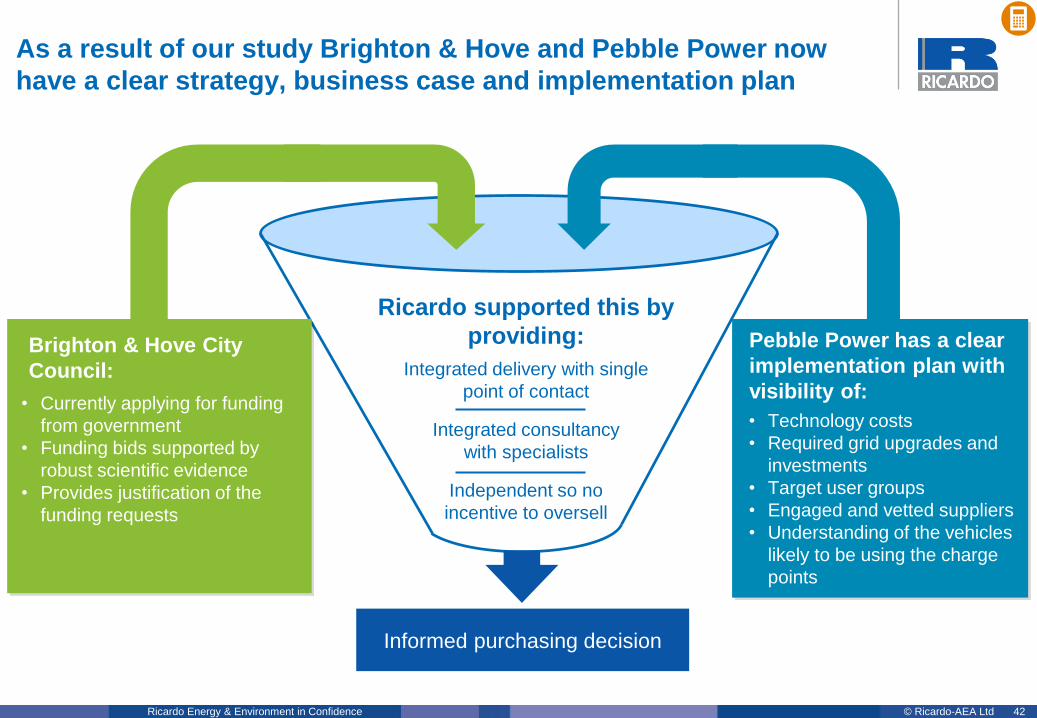
Informed purchasing decision
As a result of our study Brighton & Hove and Pebble Power now
have a clear strategy, business case and implementation plan
• Currently applying for funding
from government
• Funding bids supported by
robust scientific evidence
• Provides justification of the
funding requests
Brighton & Hove City
Council:
Ricardo supported this by
providing:
Integrated delivery with single
point of contact
Integrated consultancy
with specialists
Independent so no
incentive to oversell
• Technology costs
• Required grid upgrades and
investments
• Target user groups
• Engaged and vetted suppliers
• Understanding of the vehicles
likely to be using the charge
points
Pebble Power has a clear
implementation plan with
visibility of:

43© Ricardo-AEA Ltd Ricardo Energy & Environment in Confidence
We’re here to help
The benefits of planning your charging infrastructure early
Evaluate Charging
Options• Research and selecting chargers that
appropriate for your needs
• Remember to plan for practical
constraints
• Plan for future vehicle requirements
and technology developments
Use a Holistic and
Evidence Based Approach• A holistic approach can avoid pitfalls
and create opportunities
• Opportunity to take a leadership role in
the eyes of your customers – Order
winners
Strong Drivers for
Electrification• Health benefits and CSR
• Policy incentives and regulation
• Improvements in business case
• They will not be reversed
Assess Grid Infrastructure• Networks have capacity
• Plan you investment now to maximise
this spare capacity
• Managing demand behaviours can
reduce costs
• Innovations mean that there are
opportunities to generate revenue

44© Ricardo-AEA Ltd Ricardo Energy & Environment in Confidence
Any Questions?
You can still submit questions by typing them into the panel
If we can’t get to your question during this section we will follow up with you afterwards
Attendee
control panel
Successful CRC Compliance webinar
Welcome to the CRC Compliance Webinar
If your panel is
minimised,
click the orange
button to expand it.
Type your
question here

45© Ricardo-AEA Ltd Ricardo Energy & Environment in Confidence
Contact us for any questions after the webinar
Dan ClarkeRicardo Energy & Environment
Fleet Electrification Lead
Expert on fleet electrification and
clean air zones
T: +44 (0)1235 753712
M: +44 (0)7922 574133
Simon TerryRicardo Energy & Environment
Principal Consultant – Energy
Infrastructure
Expert on UK electricity networks and
smart grids
T: +44 (0)1483 544 943
M: +44 (0)7837 062 009
Denis NaberezhnykhRicardo Energy & Environment
Technical Director – Sustainable Transport
Expert on vehicle technologies and
charging infrastructure
T: +44 (0) 1235 75 3288
M: +44 (0) 7423 434 496