cost of ev charging infrastructure
TRANSCRIPT
ESCOConsulting SoftwareEngineering
EUE 67 – Cost of EV charging infrastructure
July 2017
2
List of abbreviations
AFI: Alternative Fuels Infrastructure•
BEV: Battery electric vehicle•
CAGR: Compound annual growth rate•
DE: Germany•
EAFO: European Alternative Fuels Observatory•
EC: European Commission•
EEA: European Environment Agency•
EPBD: Energy Performance of Buildings Directive•
ES: Spain•
EV: Electric vehicle•
FI: Full installation•
FR: France•
Source: CREARA
• IT: Italy
• NL: Netherlands
• UK: United Kingdom
3
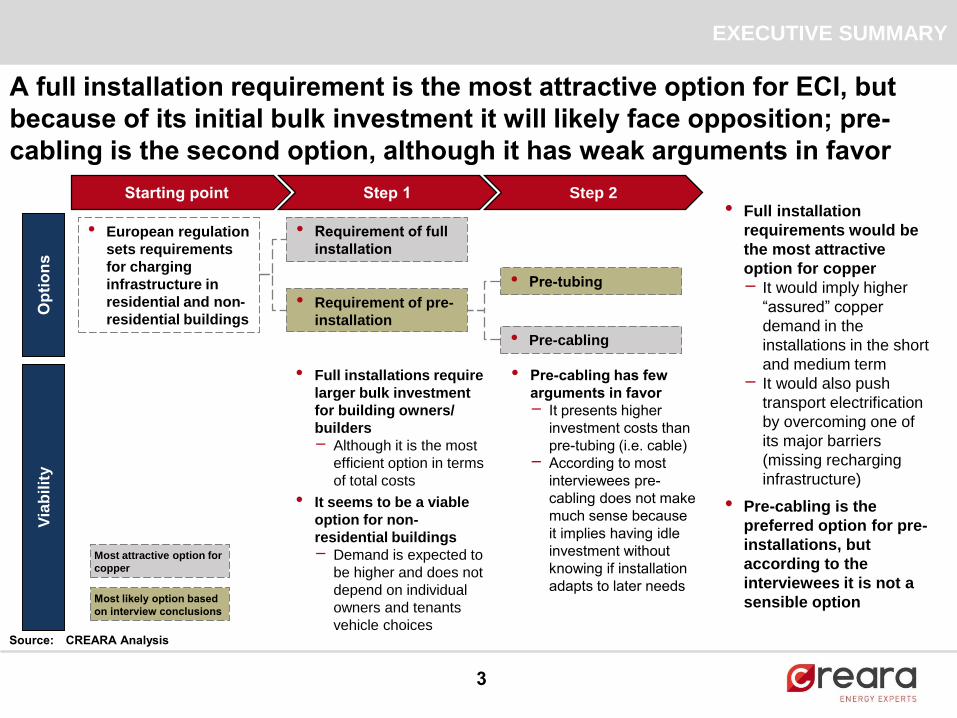
A full installation requirement is the most attractive option for ECI, but
because of its initial bulk investment it will likely face opposition; pre-
cabling is the second option, although it has weak arguments in favor
EXECUTIVE SUMMARY
Starting point Step 2
Op
tio
ns
Via
bilit
y
• European regulation
sets requirements
for charging
infrastructure in
residential and non-
residential buildings
Step 1
Requirement of full •installation
• Requirement of pre-
installation
Pre• -tubing
• Pre-cabling
Most likely option based
on interview conclusions
• Full installations require
larger bulk investment
for building owners/
builders
- Although it is the most
efficient option in terms
of total costs
• It seems to be a viable
option for non-
residential buildings
- Demand is expected to
be higher and does not
depend on individual
owners and tenants
vehicle choices
• Full installation
requirements would be
the most attractive
option for copper
- It would imply higher
“assured” copper
demand in the
installations in the short
and medium term
- It would also push
transport electrification
by overcoming one of
its major barriers
(missing recharging
infrastructure)
• Pre-cabling is the
preferred option for pre-
installations, but
according to the
interviewees it is not a
sensible option
Pre• -cabling has few
arguments in favor
It presents higher -investment costs than
pre-tubing (i.e. cable)
According to most -interviewees pre-
cabling does not make
much sense because
it implies having idle
investment without
knowing if installation
adapts to later needs
Source: CREARA Analysis
Most attractive option for
copper

4
The ECI should use favoring arguments to push for FI in non-residential
sectors; pre-cabling and pre-tubing in both sectors are the 2nd and 3rd
option, which are less attractive but still a step in the right direction
EXECUTIVE SUMMARY
Note: 1 Cost is likely to be passed through to building owner
Source: CREARA Analysis
Arguments
Relative total
costs
Cost bearer
Probability of
success of
option
Option 1 - Full installation (FI) Option 2 - Pre-cabling Option 3 - Pre-tubing
• Most cost-efficient option from
total cost perspective
• Significant reduction of barrier for
EV market development
- Especially applicable in non-
residential buildings where usage
is not depending on buildings
owners/ tenants
• At least one country (France) is
known to have a FI requirements
for new non-residential buildings
with a certain number of parking
lots
• Most (total) cost-efficient option
• Highest initial investment
Building owner (operating build.)•Constructor (new building)• 1
Medium to low (efforts should be •focused on non-residential
buildings, as in Commission
proposal (see slide 18))
• Total cost is similar to pre-tubing,
but pre-cabling requirement moves
part of the investment to an earlier
moment (i.e. laying of cable),
which could reduce barriers
• Specifying the required capacity of
the cable could lead to
standardization of certain aspects
of the charging infrastructure
• Spain forces the feeding
installation for new non-residential
buildings with a certain number of
parking lots
Most expensive (total cost) option•Reduced initial investment•
• Build. owner/ Const. (pre-cabling)
• User (install. from pre-cabling)
Medium to high•
• Option of minimum requirement
to tackle the EV charging
infrastructure barrier
- Pre-tubing does not represent
significant costs and can be
directly integrated in construction
phase
• Spain requires new residential
buildings to include pre-tubing in
their installations
• Most expensive (total cost) option
• Lowest initial investment
Build owner/ Const. (pre• -tubing)
User (install. from pre• -tubing)
High•
5
EXECUTIVE SUMMARY
Strategy to
be adopted
by ECI
Non-residential Residential
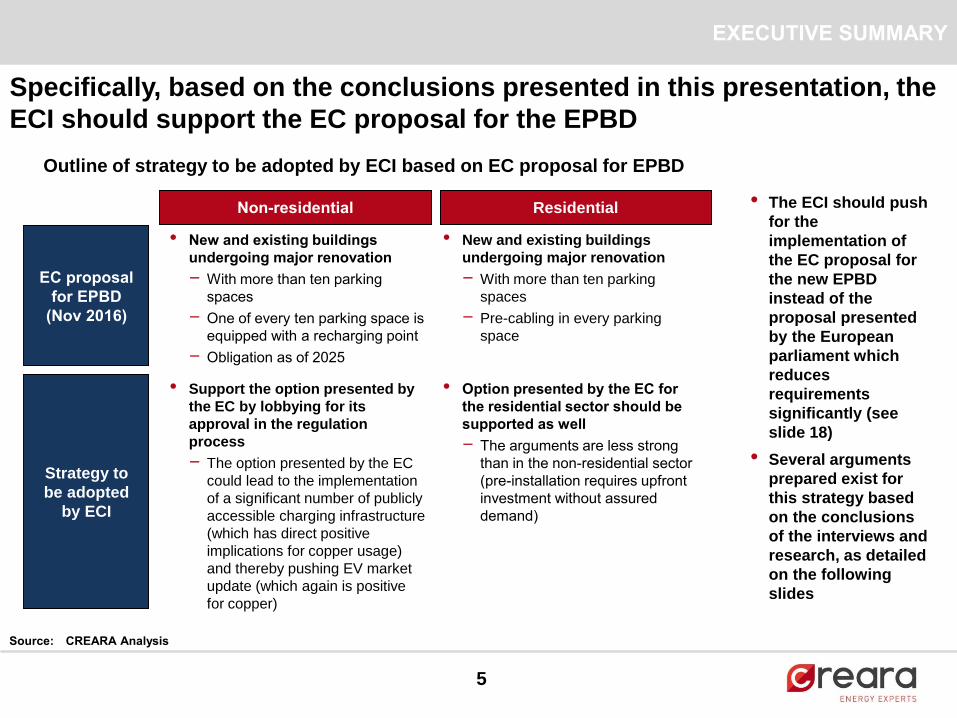
Specifically, based on the conclusions presented in this presentation, the
ECI should support the EC proposal for the EPBD
New and existing buildings •undergoing major renovation
With more than ten parking -spaces
One of every ten parking space is -equipped with a recharging point
Obligation as of - 2025
EC proposal
for EPBD
(Nov 2016)
• New and existing buildings
undergoing major renovation
- With more than ten parking
spaces
- Pre-cabling in every parking
space
Source: CREARA Analysis
• Support the option presented by
the EC by lobbying for its
approval in the regulation
process
- The option presented by the EC
could lead to the implementation
of a significant number of publicly
accessible charging infrastructure
(which has direct positive
implications for copper usage)
and thereby pushing EV market
update (which again is positive
for copper)
Option presented by the EC for •the residential sector should be
supported as well
The arguments are less strong -than in the non-residential sector
(pre-installation requires upfront
investment without assured
demand)
• The ECI should push
for the
implementation of
the EC proposal for
the new EPBD
instead of the
proposal presented
by the European
parliament which
reduces
requirements
significantly (see
slide 18)
• Several arguments
prepared exist for
this strategy based
on the conclusions
of the interviews and
research, as detailed
on the following
slides
Outline of strategy to be adopted by ECI based on EC proposal for EPBD
6
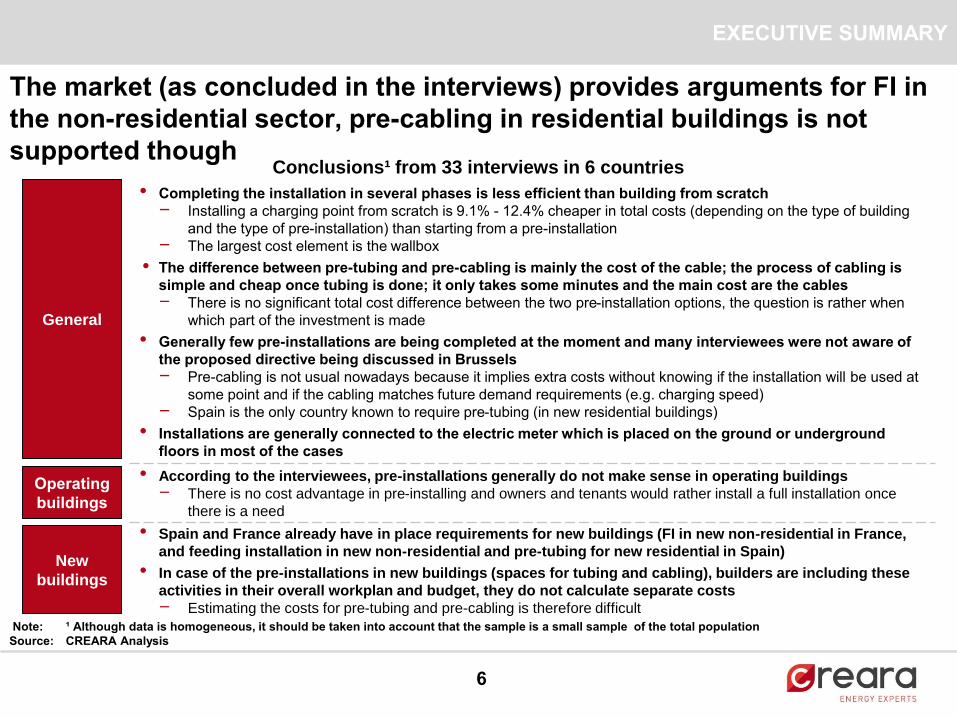
The market (as concluded in the interviews) provides arguments for FI in
the non-residential sector, pre-cabling in residential buildings is not
supported though
• According to the interviewees, pre-installations generally do not make sense in operating buildings
- There is no cost advantage in pre-installing and owners and tenants would rather install a full installation once
there is a need
Note: ¹ Although data is homogeneous, it should be taken into account that the sample is a small sample of the total population
Source: CREARA Analysis
General
Operating
buildings
New
buildings
• Spain and France already have in place requirements for new buildings (FI in new non-residential in France,
and feeding installation in new non-residential and pre-tubing for new residential in Spain)
• In case of the pre-installations in new buildings (spaces for tubing and cabling), builders are including these
activities in their overall workplan and budget, they do not calculate separate costs
- Estimating the costs for pre-tubing and pre-cabling is therefore difficult
Completing the installation in several phases is less efficient than building from scratch•Installing a charging point from scratch is - 9.1% - 12.4% cheaper in total costs (depending on the type of building
and the type of pre-installation) than starting from a pre-installation
The largest cost element is the - wallbox
The difference between pre• -tubing and pre-cabling is mainly the cost of the cable; the process of cabling is
simple and cheap once tubing is done; it only takes some minutes and the main cost are the cables
There is no significant total cost difference between the two pre- -installation options, the question is rather when
which part of the investment is made
Generally few pre• -installations are being completed at the moment and many interviewees were not aware of
the proposed directive being discussed in Brussels
Pre- -cabling is not usual nowadays because it implies extra costs without knowing if the installation will be used at
some point and if the cabling matches future demand requirements (e.g. charging speed)
Spain is the only country known to require pre- -tubing (in new residential buildings)
Installations are generally connected to the electric meter which is placed on the ground or underground •floors in most of the cases
EXECUTIVE SUMMARY
Conclusions¹ from 33 interviews in 6 countries
0
500
1,000
1,500
2,000
2,500
New building Operatingbuilding
New building Operatingbuilding
Pre-tubing Pre-cabling Full installation
7
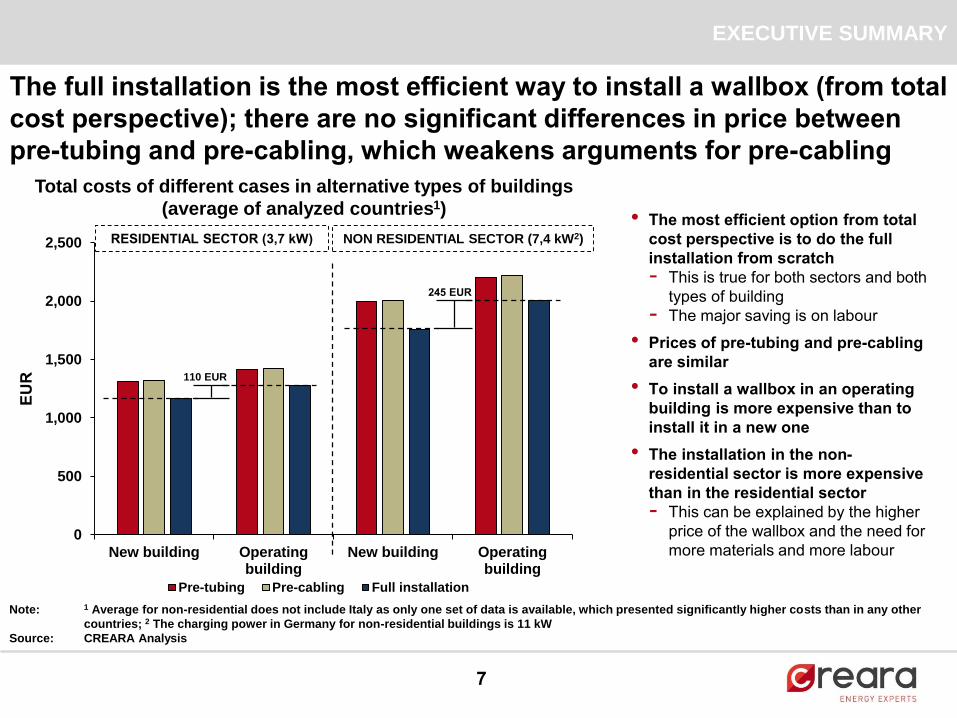
Note: 1 Average for non-residential does not include Italy as only one set of data is available, which presented significantly higher costs than in any other
countries; 2 The charging power in Germany for non-residential buildings is 11 kW
Source: CREARA Analysis
RESIDENTIAL SECTOR (3,7 kW) NON RESIDENTIAL SECTOR (7,4 kW2)
Total costs of different cases in alternative types of buildings
(average of analyzed countries1)The most efficient option from total •cost perspective is to do the full
installation from scratch
This is true for both sectors and both -types of building
The major saving is on labour-Prices of pre• -tubing and pre-cabling
are similar
To install a wallbox in an operating •building is more expensive than to
install it in a new one
The• installation in the non-
residential sector is more expensive
than in the residential sector
This can be explained by the higher -price of the wallbox and the need for
more materials and more labour
The full installation is the most efficient way to install a wallbox (from total
cost perspective); there are no significant differences in price between
pre-tubing and pre-cabling, which weakens arguments for pre-cabling
EXECUTIVE SUMMARYE
UR 110 EUR
245 EUR

8
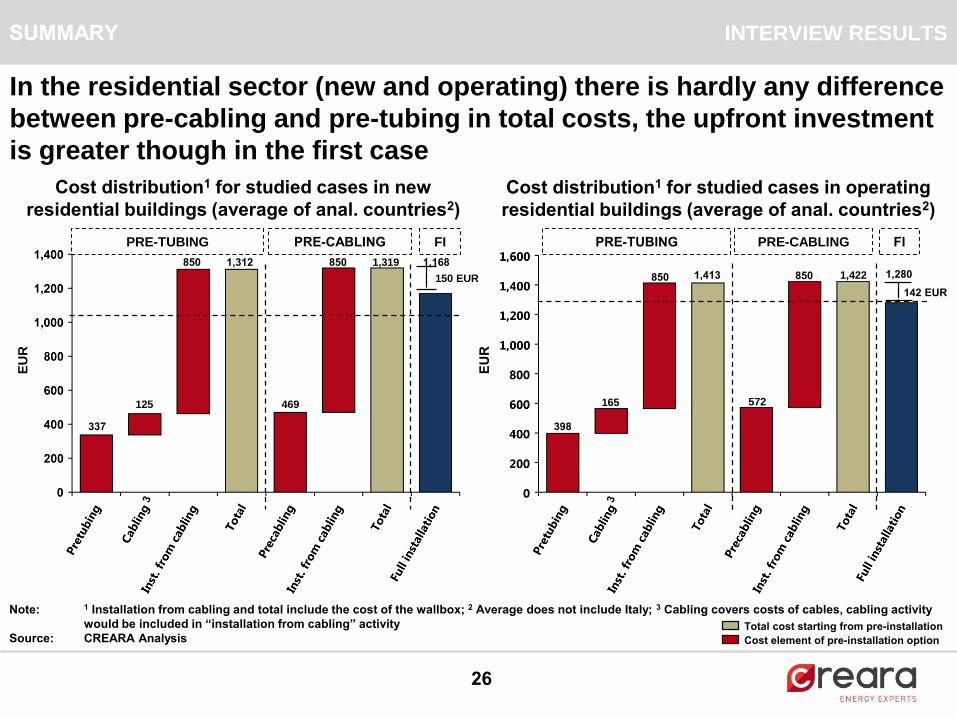
In the residential sector (new and operating) there is hardly any difference
between pre-cabling and pre-tubing in total costs, the upfront investment
is greater though in the first case
Note: 1 Installation from cabling and total include the cost of the wallbox; 2 Average does not include Italy; 3 Cabling covers costs of cables, cabling activity
would be included in “installation from cabling” activity
Source: CREARA Analysis
EU
R
EU
R
EXECUTIVE SUMMARY
Cost distribution1 for studied cases in new
residential buildings (average of anal. countries2)
Cost distribution1 for studied cases in operating
residential buildings (average of anal. countries2)
PRE-TUBING PRE-CABLING FI PRE-TUBING PRE-CABLING FI
Total cost starting from pre-installation
Cost element of pre-installation option
150 EUR
142 EUR
125
337
850 1,312
469
850 1,319 1,168
165
398
850 1,413
572
850 1,422 1,280

9
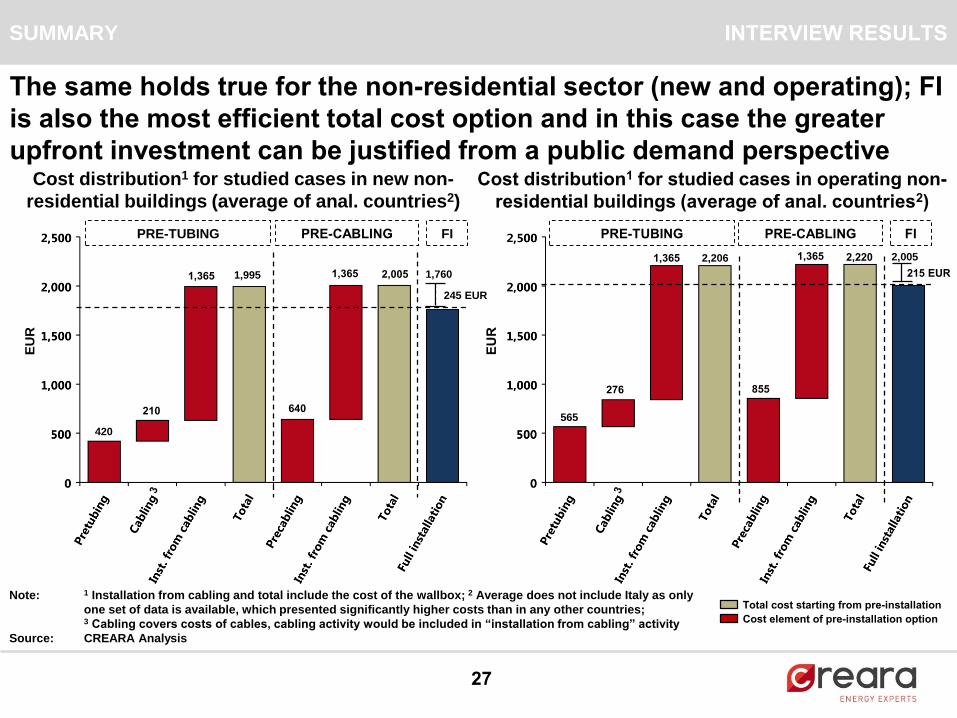
The same holds true for the non-residential sector (new and operating); FI
is also the most efficient total cost option and in this case the greater
upfront investment can be justified from a public demand perspective
EU
R
EU
R
EXECUTIVE SUMMARY
PRE-TUBING PRE-CABLING FI PRE-TUBING PRE-CABLING FI
Cost distribution1 for studied cases in new non-
residential buildings (average of anal. countries2)
Cost distribution1 for studied cases in operating non-
residential buildings (average of anal. countries2)
245 EUR
215 EUR
Note: 1 Installation from cabling and total include the cost of the wallbox; 2 Average does not include Italy as only
one set of data is available, which presented significantly higher costs than in any other countries; 3 Cabling covers costs of cables, cabling activity would be included in “installation from cabling” activity
Source: CREARA Analysis
Total cost starting from pre-installation
Cost element of pre-installation option
210
420
1,365 1,995
640
1,365 2,005 1,760
276
565
1,365 2,206
855
1,365 2,220 2,005
10
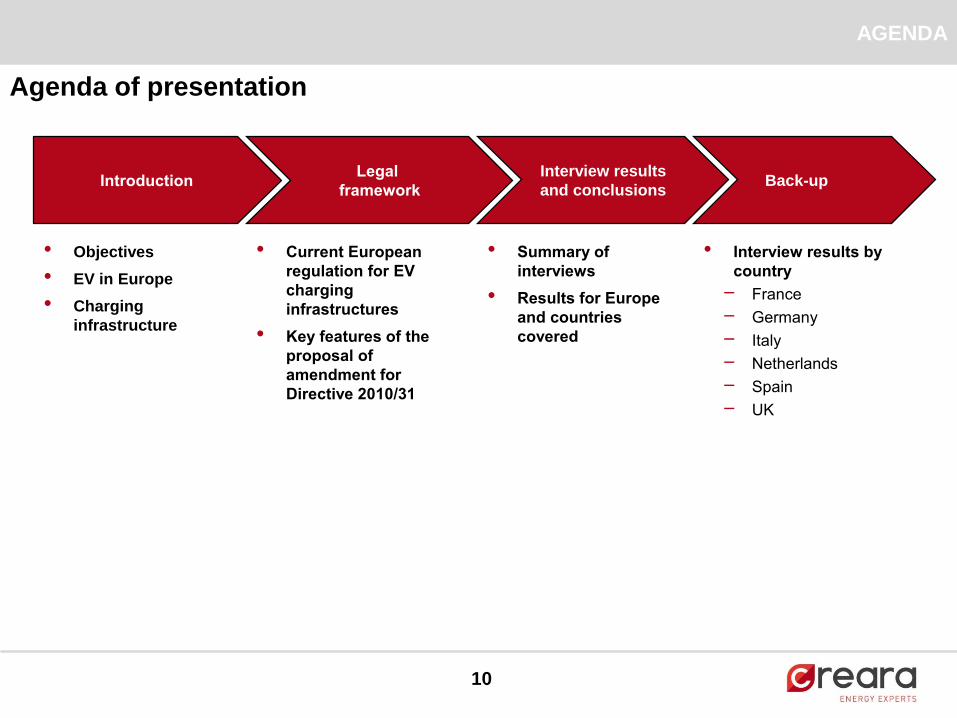
AGENDA
IntroductionLegal
framework
Interview results
and conclusions
Summary of •interviews
Results for Europe •and countries
covered
• Objectives
• EV in Europe
• Charging
infrastructure
Current European •regulation for EV
charging
infrastructures
Key features of the •proposal of
amendment for
Directive 2010/31
Agenda of presentation
Back-up
Interview results by •country
France-Germany-Italy-Netherlands -Spain -UK-
11
Agenda
Introduction•
Legal framework•
Interview results and conclusions•
Back• -up
12
The study analyses cost implications for the pre-installation and
installation of EV charging points in buildings, according to the proposal
of the new EPBD
Source: Proposal; CREARA Analysis
OBJECTIVES OF
STUDY
Cost implications of pre• -tubing, pre-cabling and full installation are studied
regarding article 8 of the proposal for the new Energy Performance Buildings
Directive (EPBD)
The results of the study show which are the costs of a charging installation, -depending on which pre-installation exists
The costs are recollected for several European countries-
The results include an analysis of the cost dispersion and average of each •component and total costs for each country
INTRODUCTIONOBJECTIVES
13
INTRODUCTION
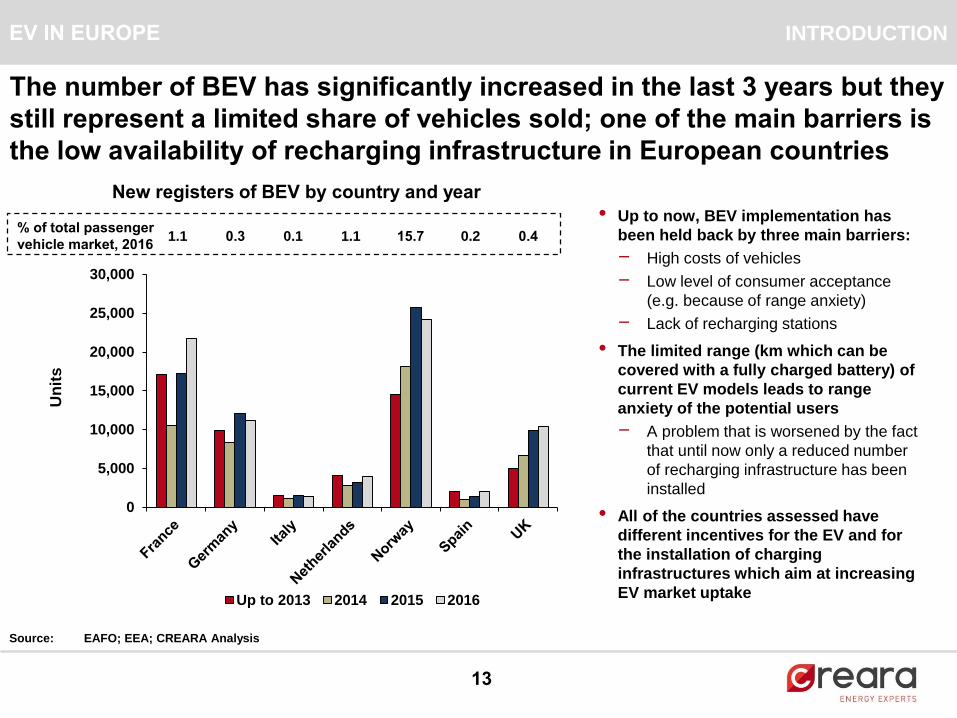
The number of BEV has significantly increased in the last 3 years but they
still represent a limited share of vehicles sold; one of the main barriers is
the low availability of recharging infrastructure in European countries
0
5,000
10,000
15,000
20,000
25,000
30,000
Up to 2013 2014 2015 2016
Source: EAFO; EEA; CREARA Analysis
• Up to now, BEV implementation has
been held back by three main barriers:
- High costs of vehicles
- Low level of consumer acceptance
(e.g. because of range anxiety)
- Lack of recharging stations
• The limited range (km which can be
covered with a fully charged battery) of
current EV models leads to range
anxiety of the potential users
- A problem that is worsened by the fact
that until now only a reduced number
of recharging infrastructure has been
installed
• All of the countries assessed have
different incentives for the EV and for
the installation of charging
infrastructures which aim at increasing
EV market uptake
EV IN EUROPE
% of total passenger
vehicle market, 20161.1 15.71.1 0.3 0.1 0.2 0.4
New registers of BEV by country and year
Un
its
14
INTRODUCTION
0 5,000 10,000 15,000 20,000 25,000 30,000
EU¹
France
Germany
Italy
Netherlands
Norway
Spain
UK
Normal power charging ( ≤ 22 kW) High power charging ( > 22kW)
Note : ¹ EU as average of the selected countries; ²Italy and Spain; 3No standardization exists though
Source: EAFO, CREARA Analysis
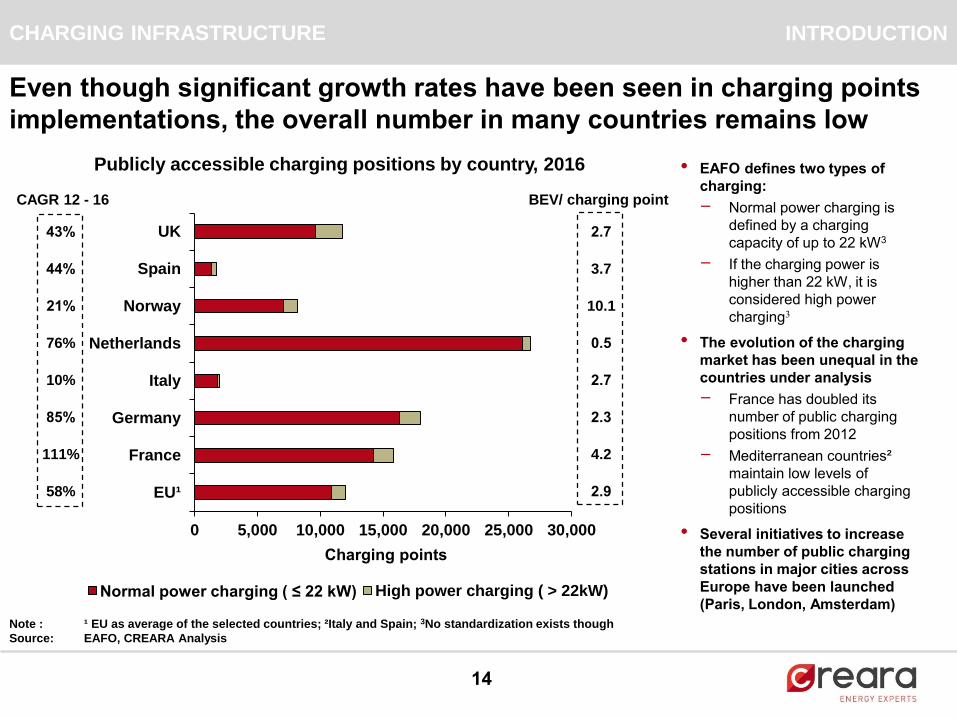
76%
44%
21%
10%
85%
CAGR 12 - 16
43%
111%
58%
Even though significant growth rates have been seen in charging points
implementations, the overall number in many countries remains low
EAFO defines two types of •charging:
Normal power charging is -defined by a charging
capacity of up to 22 kW3
If the charging power is -higher than 22 kW, it is
considered high power
charging3
The evolution of the charging •market has been unequal in the
countries under analysis
France has doubled its -number of public charging
positions from 2012
Mediterranean countries- ²
maintain low levels of
publicly accessible charging
positions
Several initiatives to increase •the number of public charging
stations in major cities across
Europe have been launched
(Paris, London, Amsterdam)
CHARGING INFRASTRUCTURE
Charging points
Publicly accessible charging positions by country, 2016
0.5
3.7
10.1
2.7
2.3
BEV/ charging point
2.7
4.2
2.9
15
Agenda
Introduction•
Legal framework•
Interview results and conclusions•
Back• -up
16
LEGAL FRAMEWORK
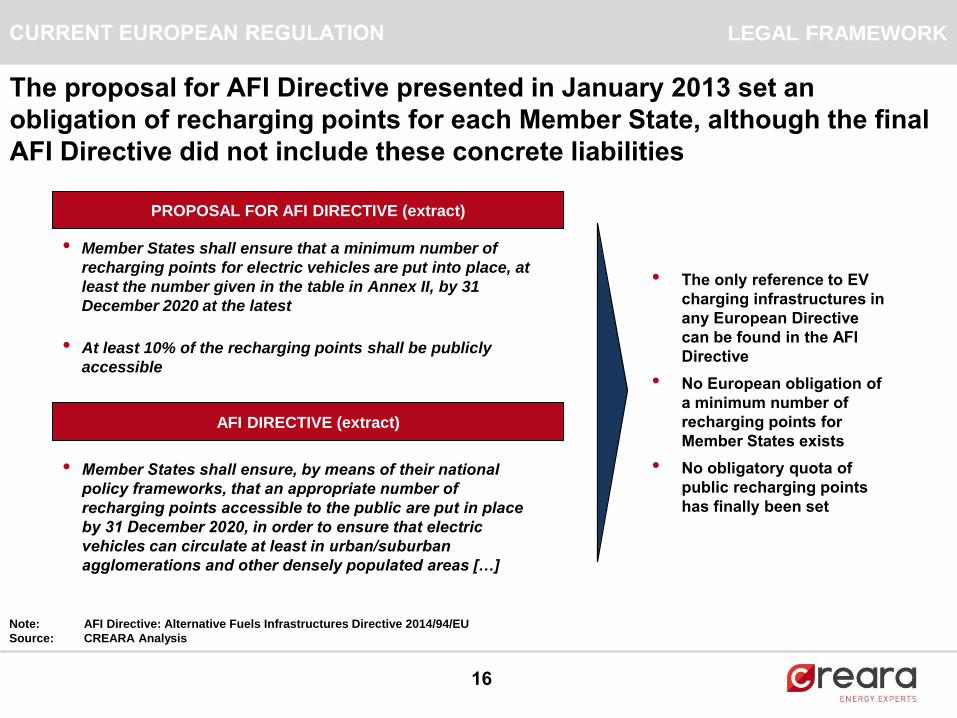
The proposal for AFI Directive presented in January 2013 set an
obligation of recharging points for each Member State, although the final
AFI Directive did not include these concrete liabilities
AFI DIRECTIVE (extract)
Member States shall ensure, by means of their national •policy frameworks, that an appropriate number of
recharging points accessible to the public are put in place
by 31 December 2020, in order to ensure that electric
vehicles can circulate at least in urban/suburban
agglomerations and other densely populated areas […]
PROPOSAL FOR AFI DIRECTIVE (extract)
• Member States shall ensure that a minimum number of
recharging points for electric vehicles are put into place, at
least the number given in the table in Annex II, by 31
December 2020 at the latest
• At least 10% of the recharging points shall be publicly
accessible
CURRENT EUROPEAN REGULATION
The only reference to EV •charging infrastructures in
any European Directive
can be found in the AFI
Directive
No European obligation of •a minimum number of
recharging points for
Member States exists
No obligatory quota of •public recharging points
has finally been set
Note: AFI Directive: Alternative Fuels Infrastructures Directive 2014/94/EU
Source: CREARA Analysis
17
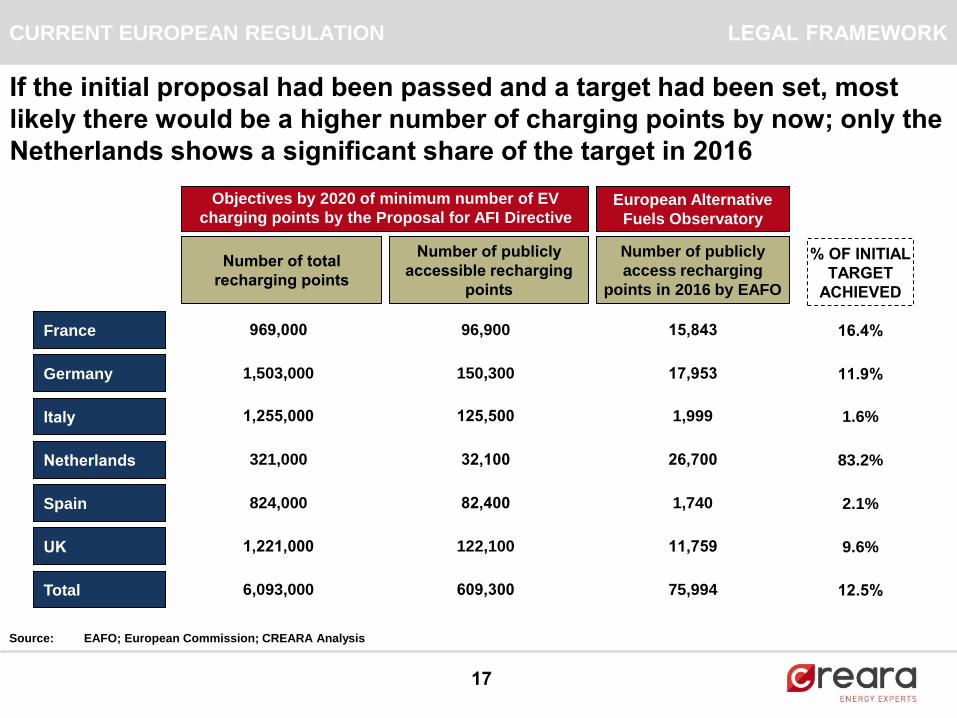
Objectives by 2020 of minimum number of EV
charging points by the Proposal for AFI Directive
Number of publicly
accessible recharging
points
France
Germany
Italy
Netherlands
Spain
UK
Total
Number of total
recharging points
824,000
Source: EAFO; European Commission; CREARA Analysis
1,221,000
If the initial proposal had been passed and a target had been set, most
likely there would be a higher number of charging points by now; only the
Netherlands shows a significant share of the target in 2016
122,100
969,000 96,900
82,400
1,503,000 150,300
1,255,000 125,500
321,000 32,100
6,093,000 609,300
Number of publicly
access recharging
points in 2016 by EAFO
European Alternative
Fuels Observatory
11,759
15,843
1,740
17,953
1,999
26,700
75,994
CURRENT EUROPEAN REGULATION LEGAL FRAMEWORK
% OF INITIAL
TARGET
ACHIEVED
9.6%
16.4%
2.1%
11.9%
1.6%
83.2%
12.5%
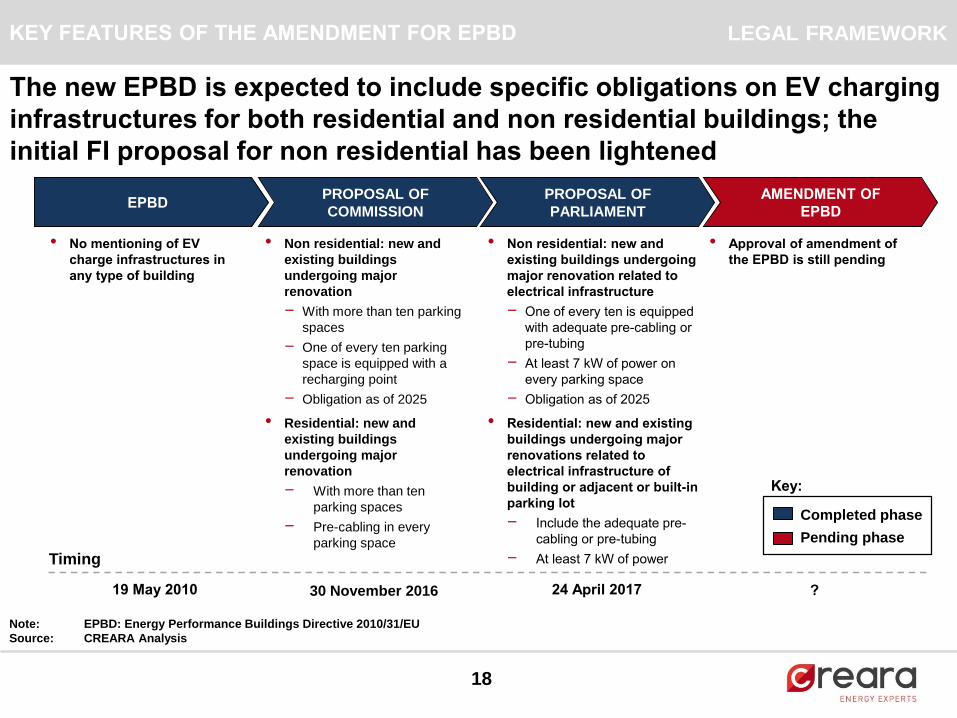
The new EPBD is expected to include specific obligations on EV charging
infrastructures for both residential and non residential buildings; the
initial FI proposal for non residential has been lightened
18
No mentioning of EV •charge infrastructures in
any type of building
• Non residential: new and
existing buildings
undergoing major
renovation
- With more than ten parking
spaces
- One of every ten parking
space is equipped with a
recharging point
- Obligation as of 2025
• Residential: new and
existing buildings
undergoing major
renovation
- With more than ten
parking spaces
- Pre-cabling in every
parking space
EPBDPROPOSAL OF
COMMISSION
PROPOSAL OF
PARLIAMENT
AMENDMENT OF
EPBD
• Approval of amendment of
the EPBD is still pending
Timing
?30 November 2016 24 April 2017
Completed phase
Pending phase
Key:
19 May 2010
LEGAL FRAMEWORKKEY FEATURES OF THE AMENDMENT FOR EPBD
Note: EPBD: Energy Performance Buildings Directive 2010/31/EU
Source: CREARA Analysis
Non residential: new and •existing buildings undergoing
major renovation related to
electrical infrastructure
One of every ten is equipped -with adequate pre-cabling or
pre-tubing
At least - 7 kW of power on
every parking space
Obligation as of - 2025
Residential: new and existing •buildings undergoing major
renovations related to
electrical infrastructure of
building or adjacent or built-in
parking lot
Include the adequate pre- -
cabling or pre-tubing
At least - 7 kW of power
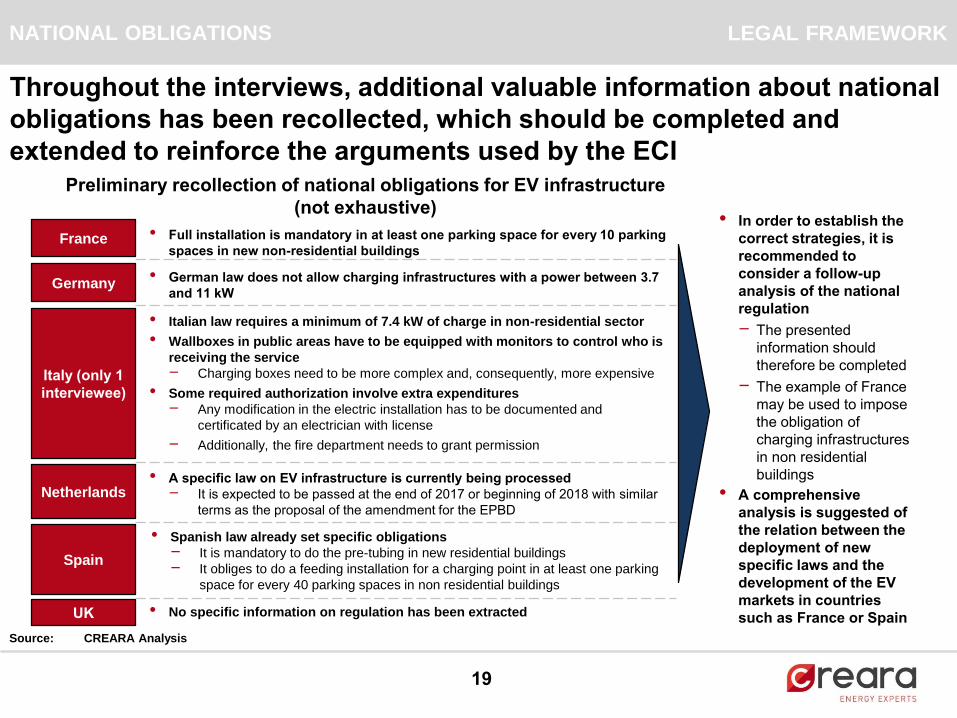
• Spanish law already set specific obligations
- It is mandatory to do the pre-tubing in new residential buildings
- It obliges to do a feeding installation for a charging point in at least one parking
space for every 40 parking spaces in non residential buildings
Source: CREARA Analysis
Throughout the interviews, additional valuable information about national
obligations has been recollected, which should be completed and
extended to reinforce the arguments used by the ECI
19
France Full installation is mandatory• in at least one parking space for every 10 parking
spaces in new non-residential buildings
Germany
Italy (only 1
interviewee)
Netherlands
Spain
UK
German law does not allow charging infrastructures with a power between • 3.7
and 11 kW
• Italian law requires a minimum of 7.4 kW of charge in non-residential sector
• Wallboxes in public areas have to be equipped with monitors to control who is
receiving the service
- Charging boxes need to be more complex and, consequently, more expensive
• Some required authorization involve extra expenditures
- Any modification in the electric installation has to be documented and
certificated by an electrician with license
- Additionally, the fire department needs to grant permission
A specific law on EV infrastructure is currently being processed•It is expected to be passed at the end of - 2017 or beginning of 2018 with similar
terms as the proposal of the amendment for the EPBD
• No specific information on regulation has been extracted
In order to establish the •correct strategies, it is
recommended to
consider a follow-up
analysis of the national
regulation
The presented -information should
therefore be completed
The example of France -may be used to impose
the obligation of
charging infrastructures
in non residential
buildings
A • comprehensive
analysis is suggested of
the relation between the
deployment of new
specific laws and the
development of the EV
markets in countries
such as France or Spain
LEGAL FRAMEWORKNATIONAL OBLIGATIONS
Preliminary recollection of national obligations for EV infrastructure
(not exhaustive)
20
Agenda
Introduction•
Legal framework•
Interview results and conclusions•
Back• -up
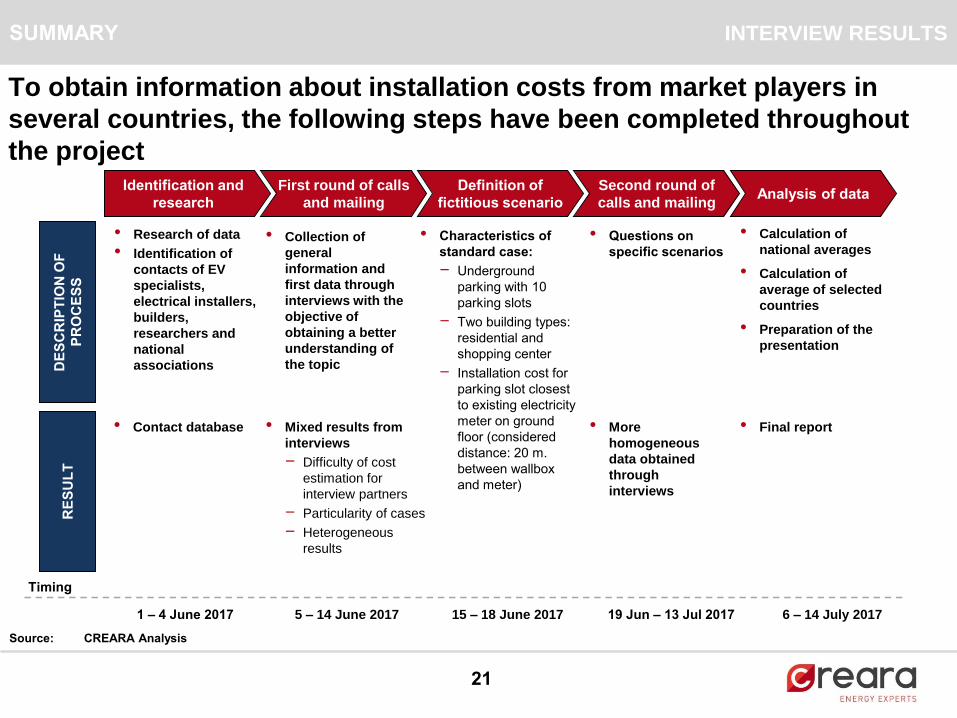
To obtain information about installation costs from market players in
several countries, the following steps have been completed throughout
the project
21
• Research of data
• Identification of
contacts of EV
specialists,
electrical installers,
builders,
researchers and
national
associations
• Collection of
general
information and
first data through
interviews with the
objective of
obtaining a better
understanding of
the topic
Characteristics of •standard case:
Underground -parking with 10
parking slots
- Two building types:
residential and
shopping center
Installation- cost for
parking slot closest
to existing electricity
meter on ground
floor (considered
distance: 20 m.
between wallbox
and meter)
Identification and
research
First round of calls
and mailing
Definition of
fictitious scenario
Second round of
calls and mailing
Timing
5 – 14 June 2017 15 – 18 June 20171 – 4 June 2017
Source: CREARA Analysis
• Calculation of
national averages
• Calculation of
average of selected
countries
• Preparation of the
presentation
Analysis of data
• More
homogeneous
data obtained
through
interviews
19 Jun – 13 Jul 2017 6 – 14 July 2017
INTERVIEW RESULTSD
ES
CR
IPT
ION
OF
PR
OC
ES
SR
ES
UL
T
• Mixed results from
interviews
- Difficulty of cost
estimation for
interview partners
- Particularity of cases
- Heterogeneous
results
Questions on •specific scenarios
• Final report
SUMMARY
• Contact database

The following building and charging installation characteristics have been
considered for the interviews
22
Source: CREARA Analysis
INTERVIEW RESULTSSUMMARY
Pre-tubing
Pre-cabling
Full installation
Full installation from cabling
Building features
Residential
Non Residential
New building
Operating building
Type of building
Cases
• Multi-family building with underground parking
Shopping center with underground parking•
Installation in new construction building•
• Installation in already existing building
Installation of conduits with no cabling •
• Installation of conduits plus cabling
Installation of wallbox in an existing conduit with cabling•
• Installation of conduits plus wiring plus wallbox
Materials
Labour
Wallbox
Elements
considered
Material costs used in installation (including cables) •
• Labour costs of work to be carried out
Hardware of charging station (excluding cabling)•
Characteristics of installations
23
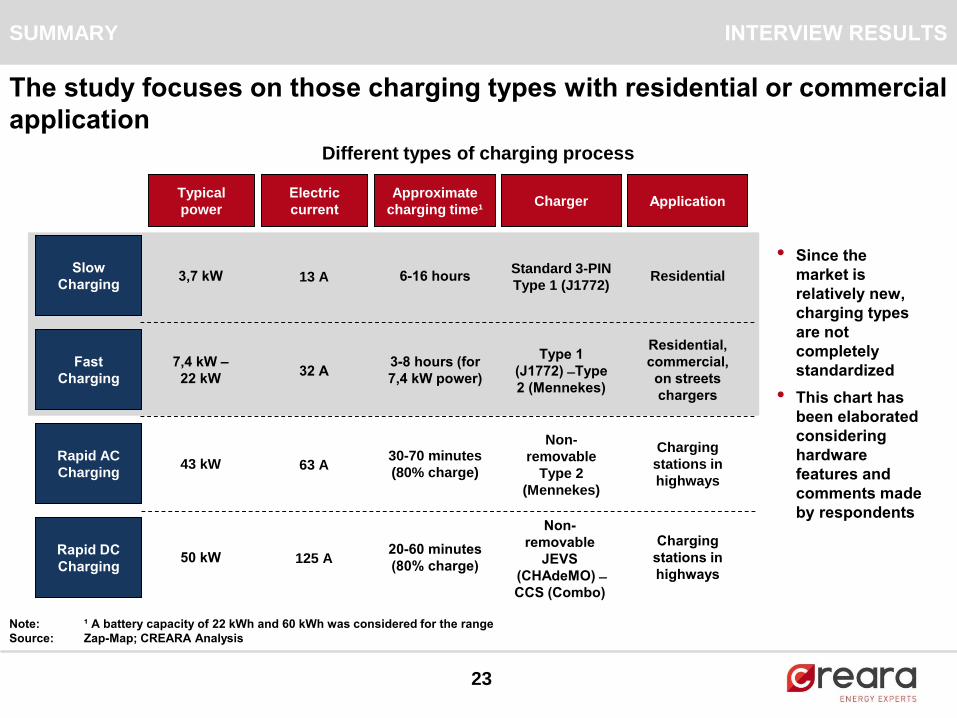
Slow
Charging
Fast
Charging
Rapid AC
Charging
Rapid DC
Charging
Typical
power
Electric
current
Approximate
charging time¹Charger
3,7 kW
7,4 kW –
22 kW
43 kW
50 kW
13 A
32 A
63 A
125 A
6-16 hours
3-8 hours (for
7,4 kW power)
30-70 minutes
(80% charge)
20-60 minutes
(80% charge)
Standard 3-PIN
Type 1 (J1772)
Type 1
(J1772) ̶ Type
2 (Mennekes)
Non-
removable
Type 2
(Mennekes)
Non-
removable
JEVS
(CHAdeMO) ̶
CCS (Combo)
The study focuses on those charging types with residential or commercial
application
Note: ¹ A battery capacity of 22 kWh and 60 kWh was considered for the range
Source: Zap-Map; CREARA Analysis
SUMMARY
Application
Residential
Residential,
commercial,
on streets
chargers
Charging
stations in
highways
Charging
stations in
highways
INTERVIEW RESULTS
Since the •market is
relatively new,
charging types
are not
completely
standardized
This chart has •been elaborated
considering
hardware
features and
comments made
by respondents
Different types of charging process
24
ES
FR
UKDE
NL
NO
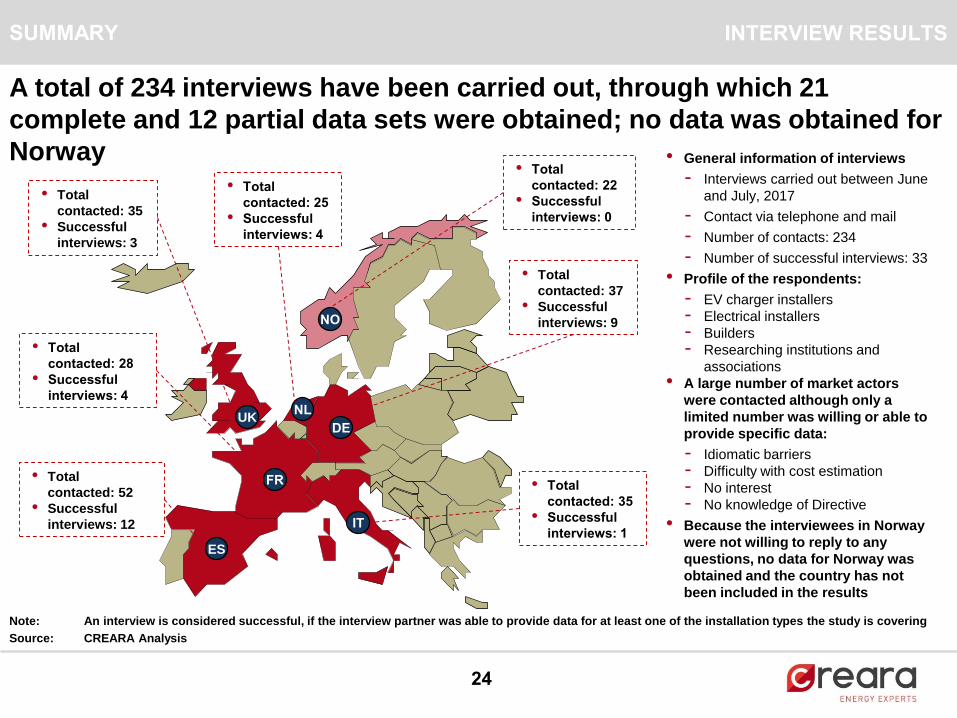
• Total
contacted: 52
• Successful
interviews: 12
Total •contacted: 28
Successful •interviews: 4
• Total
contacted: 35
• Successful
interviews: 3
Total •contacted: 25
Successful •interviews: 4
• Total
contacted: 37
• Successful
interviews: 9
Total •contacted: 35
Successful •interviews: 1
IT
Total •contacted: 22
Successful •interviews: 0
• General information of interviews
- Interviews carried out between June
and July, 2017
- Contact via telephone and mail
- Number of contacts: 234
- Number of successful interviews: 33
• Profile of the respondents:
- EV charger installers
- Electrical installers
- Builders
- Researching institutions and
associations
• A large number of market actors
were contacted although only a
limited number was willing or able to
provide specific data:
- Idiomatic barriers
- Difficulty with cost estimation
- No interest
- No knowledge of Directive
• Because the interviewees in Norway
were not willing to reply to any
questions, no data for Norway was
obtained and the country has not
been included in the results
INTERVIEW RESULTS
Note: An interview is considered successful, if the interview partner was able to provide data for at least one of the installation types the study is covering
Source: CREARA Analysis
SUMMARY
A total of 234 interviews have been carried out, through which 21
complete and 12 partial data sets were obtained; no data was obtained for
Norway

0
500
1,000
1,500
2,000
2,500
New building Operatingbuilding
New building Operatingbuilding
Pre-tubing Pre-cabling Full installation
25
Note: 1 Average for non-residential does not include Italy as only one set of data is available, which presented significantly higher costs than in any other
countries; 2 The charging power in Germany for non-residential buildings is 11 kW
Source: CREARA Analysis
RESIDENTIAL SECTOR (3,7 kW) NON RESIDENTIAL SECTOR (7,4 kW2)
Total costs of different cases in alternative types of buildings
(average of analyzed countries1) • The most efficient option from total
cost perspective is to do the full
installation from scratch
- This is true for both sectors and both
types of building
- The major saving is on labour
• Prices of pre-tubing and pre-cabling
are similar
• To install a wallbox in an operating
building is more expensive than to
install it in a new one
• The installation in the non-
residential sector is more expensive
than in the residential sector
- This can be explained by the higher
price of the wallbox and the need for
more materials and more labour
The full installation is the most efficient way to install a wallbox (from total
cost perspective); there are no significant differences in price between
pre-tubing and pre-cabling, which weakens arguments for pre-cabling
EU
R 110 EUR
245 EUR
INTERVIEW RESULTSSUMMARY
26
In the residential sector (new and operating) there is hardly any difference
between pre-cabling and pre-tubing in total costs, the upfront investment
is greater though in the first case
Note: 1 Installation from cabling and total include the cost of the wallbox; 2 Average does not include Italy; 3 Cabling covers costs of cables, cabling activity
would be included in “installation from cabling” activity
Source: CREARA Analysis
EU
R
EU
R
Cost distribution1 for studied cases in new
residential buildings (average of anal. countries2)
Cost distribution1 for studied cases in operating
residential buildings (average of anal. countries2)
PRE-TUBING PRE-CABLING FI PRE-TUBING PRE-CABLING FI
Total cost starting from pre-installation
Cost element of pre-installation option
150 EUR
142 EUR
125
337
850 1,312
469
850 1,319 1,168
165
398
850 1,413
572
850 1,422 1,280
INTERVIEW RESULTSSUMMARY
27
The same holds true for the non-residential sector (new and operating); FI
is also the most efficient total cost option and in this case the greater
upfront investment can be justified from a public demand perspective
EU
R
EU
R
PRE-TUBING PRE-CABLING FI PRE-TUBING PRE-CABLING FI
Cost distribution1 for studied cases in new non-
residential buildings (average of anal. countries2)
Cost distribution1 for studied cases in operating non-
residential buildings (average of anal. countries2)
245 EUR
215 EUR
Note: 1 Installation from cabling and total include the cost of the wallbox; 2 Average does not include Italy as only
one set of data is available, which presented significantly higher costs than in any other countries; 3 Cabling covers costs of cables, cabling activity would be included in “installation from cabling” activity
Source: CREARA Analysis
Total cost starting from pre-installation
Cost element of pre-installation option
210
420
1,365 1,995
640
1,365 2,005 1,760
276
565
1,365 2,206
855
1,365 2,220 2,005
INTERVIEW RESULTSSUMMARY
Cost dispersion and average for new building
(3,7 kW)
Pre-
cabling
Inst. from
pre-cabling¹
28
EUROPE INTERVIEW RESULTS
340470
1,170
Cost dispersion and average for operating building in
Europe (3,7 kW)
400
850
1,280
570EU
RE
UR
Pre-tubing Full inst.
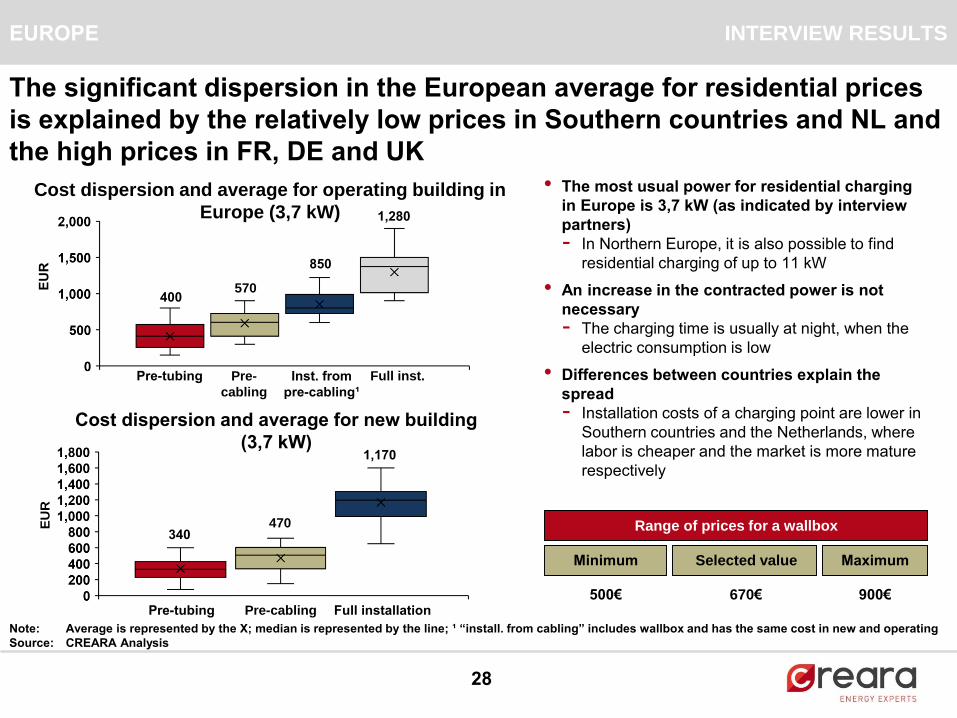
The significant dispersion in the European average for residential prices
is explained by the relatively low prices in Southern countries and NL and
the high prices in FR, DE and UK
The most usual power for residential charging •in Europe is 3,7 kW (as indicated by interview
partners)
In Northern Europe, it is also possible to find -residential charging of up to 11 kW
An increase in the contracted power is not •necessary
The charging time is usually at night, when the -electric consumption is low
Differences between countries explain the •spread
Installation costs of a charging point are lower in -Southern countries and the Netherlands, where
labor is cheaper and the market is more mature
respectively
500€ 670€ 900€
Range of prices for a wallbox
Minimum Selected value Maximum
Note: Average is represented by the X; median is represented by the line; ¹ “install. from cabling” includes wallbox and has the same cost in new and operating
Source: CREARA Analysis
Pre-tubing Pre-cabling Full installation
Pre-cabling
Pre-
cabling
Inst. from
pre-cabling¹
29
EUROPE INTERVIEW RESULTS
445
670
1,760
Cost dispersion and average for operating building in
Europe (7,4 kW)
630
1,315
2,025
960
EU
RE
UR
Cost dispersion and average for new building in
Europe (7,4 kW)
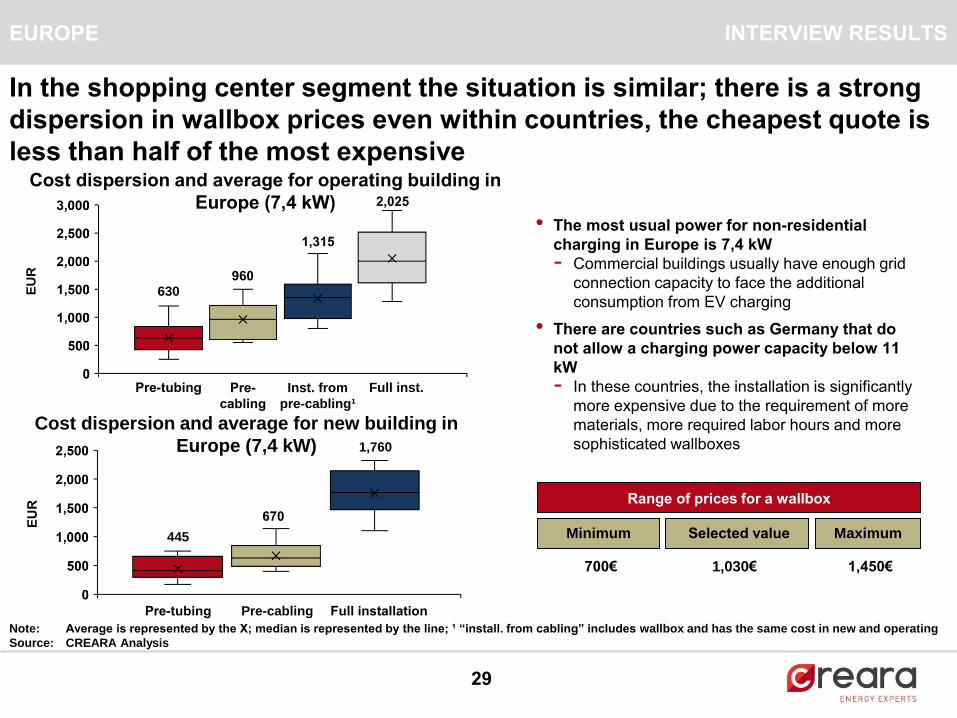
700€ 1,030€ 1,450€
The most usual power for non• -residential
charging in Europe is 7,4 kW
Commercial buildings usually have enough grid -connection capacity to face the additional
consumption from EV charging
There are countries such as Germany that do •not allow a charging power capacity below 11
kW
In these countries, the installation is significantly -more expensive due to the requirement of more
materials, more required labor hours and more
sophisticated wallboxes
Range of prices for a wallbox
Minimum Selected value Maximum
Pre-tubing Full inst.
Pre-tubing Full installation
In the shopping center segment the situation is similar; there is a strong
dispersion in wallbox prices even within countries, the cheapest quote is
less than half of the most expensive
Note: Average is represented by the X; median is represented by the line; ¹ “install. from cabling” includes wallbox and has the same cost in new and operating
Source: CREARA Analysis
0
1,000
2,000
3,000
4,000
5,000
6,000
7,000
Pre-tubing Pre-cabling Installation from pre-cabling
Full installation
Costs for Non Residential Operating Buildings
France Germany Italy Netherlands Spain UK
30
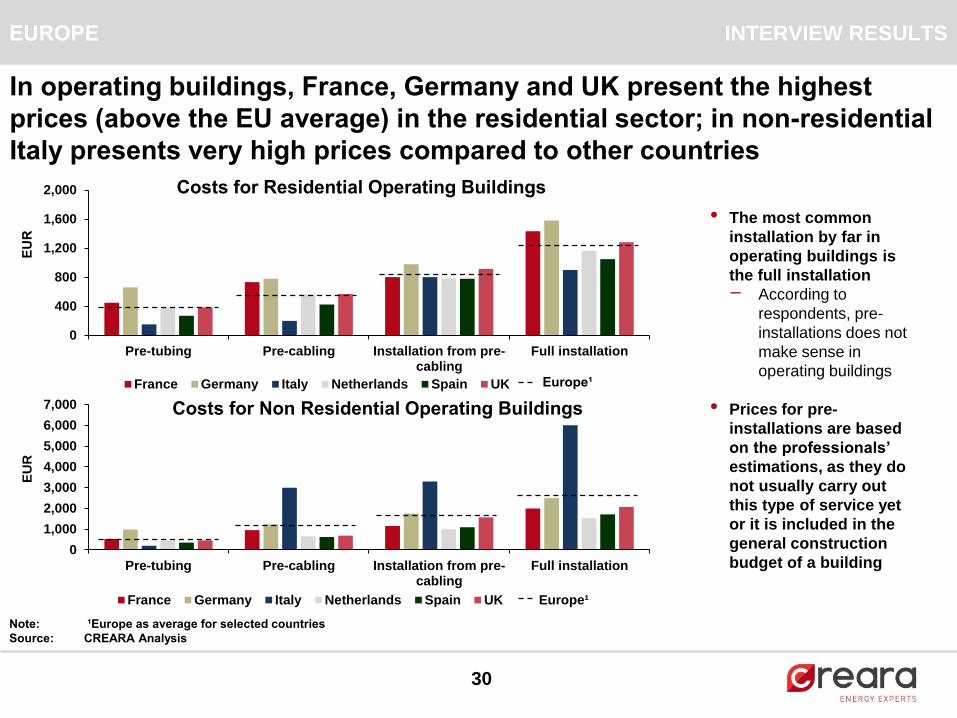
In operating buildings, France, Germany and UK present the highest
prices (above the EU average) in the residential sector; in non-residential
Italy presents very high prices compared to other countries
INTERVIEW RESULTS
0
400
800
1,200
1,600
2,000
Pre-tubing Pre-cabling Installation from pre-cabling
Full installation
Costs for Residential Operating Buildings
France Germany Italy Netherlands Spain UK Europe¹
EU
RE
UR
Note: ¹Europe as average for selected countries
Source: CREARA Analysis
• The most common
installation by far in
operating buildings is
the full installation
- According to
respondents, pre-
installations does not
make sense in
operating buildings
• Prices for pre-
installations are based
on the professionals’
estimations, as they do
not usually carry out
this type of service yet
or it is included in the
general construction
budget of a building
EUROPE
Europe¹
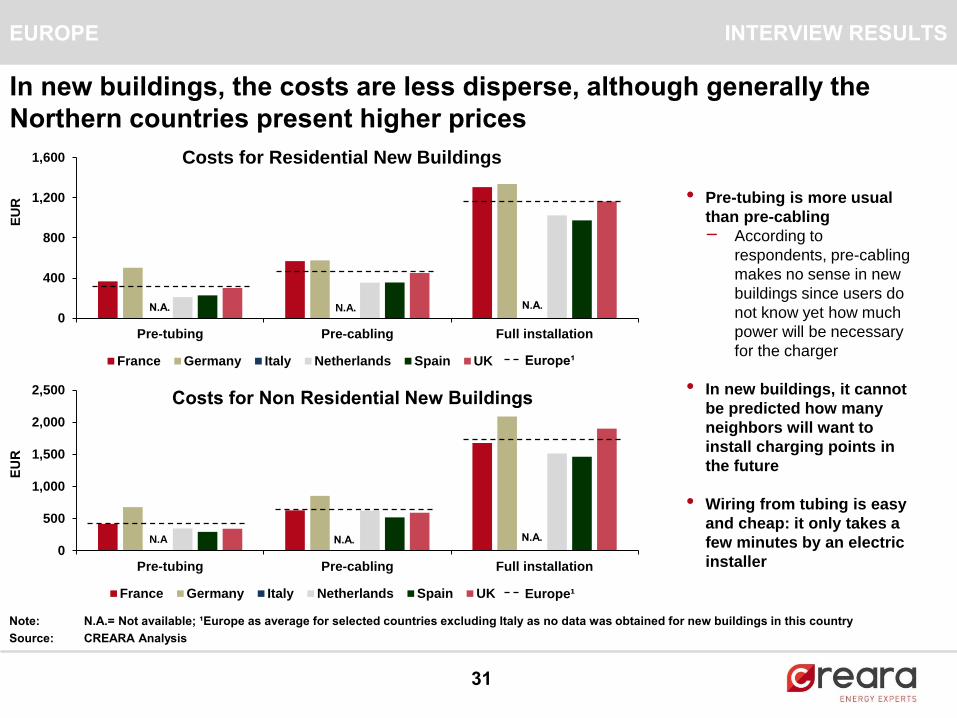
In new buildings, the costs are less disperse, although generally the
Northern countries present higher prices
31
INTERVIEW RESULTS
0
400
800
1,200
1,600
Pre-tubing Pre-cabling Full installation
Costs for Residential New Buildings
France Germany Italy Netherlands Spain UK
0
500
1,000
1,500
2,000
2,500
Pre-tubing Pre-cabling Full installation
Costs for Non Residential New Buildings
France Germany Italy Netherlands Spain UK
EU
RE
UR
• Pre-tubing is more usual
than pre-cabling
- According to
respondents, pre-cabling
makes no sense in new
buildings since users do
not know yet how much
power will be necessary
for the charger
• In new buildings, it cannot
be predicted how many
neighbors will want to
install charging points in
the future
• Wiring from tubing is easy
and cheap: it only takes a
few minutes by an electric
installer
Note: N.A.= Not available; ¹Europe as average for selected countries excluding Italy as no data was obtained for new buildings in this country
Source: CREARA Analysis
EUROPE
Europe¹
Europe¹
N.A. N.A. N.A.
N.A N.A. N.A.
0%
10%
20%
30%
40%
50%
60%
70%
80%
Materials Labour Wallbox
Full installation
France Germany Italy Netherlands Spain UK
0%
10%
20%
30%
40%
50%
60%
70%
80%
Materials Labour
Pre-cabling
France Germany Italy Netherlands Spain UK Europe¹
32
INTERVIEW RESULTS
0%
20%
40%
60%
80%
100%
Materials Labour
Pre-tubing
France Germany Italy Netherlands Spain UK
0%
20%
40%
60%
80%
100%
Materials Labour Wallbox
Full installation from pre-cabling
France Germany Italy Netherlands Spain UK
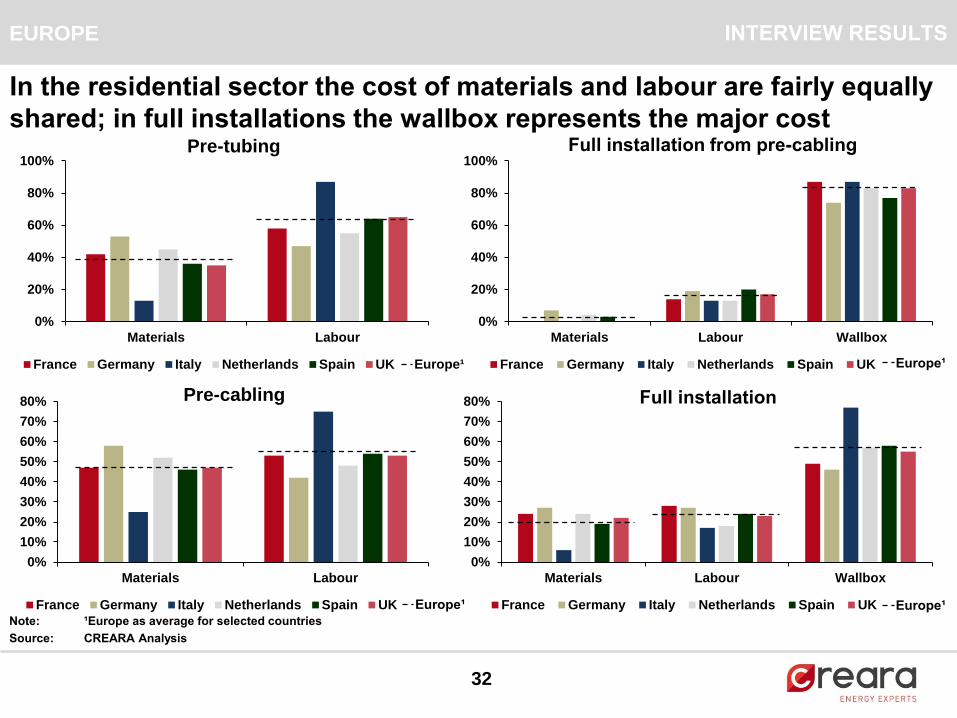
In the residential sector the cost of materials and labour are fairly equally
shared; in full installations the wallbox represents the major cost
Note: ¹Europe as average for selected countries
Source: CREARA Analysis
EUROPE
Europe¹
Europe¹ Europe¹

33
INTERVIEW RESULTS
0%
10%
20%
30%
40%
50%
60%
70%
80%
Materials Labour
Pre-tubing
France Germany Italy Netherlands Spain UK
0%
20%
40%
60%
80%
100%
Materials Labour Wallbox
Full installation from pre-cabling
France Germany Italy Netherlands Spain UK
0%
20%
40%
60%
80%
100%
Materials Labour
Pre-cabling
France Germany Italy Netherlands Spain UK
0%
10%
20%
30%
40%
50%
60%
70%
Materials Labour Wallbox
Full installation
France Germany Italy Netherlands Spain UK
Note: ¹Europe as average for selected countries
Source: CREARA Analysis
EUROPE
In non residential buildings, the distribution of costs is very similar to the
one in the residential sector
Europe¹ Europe¹
Europe¹ Europe¹
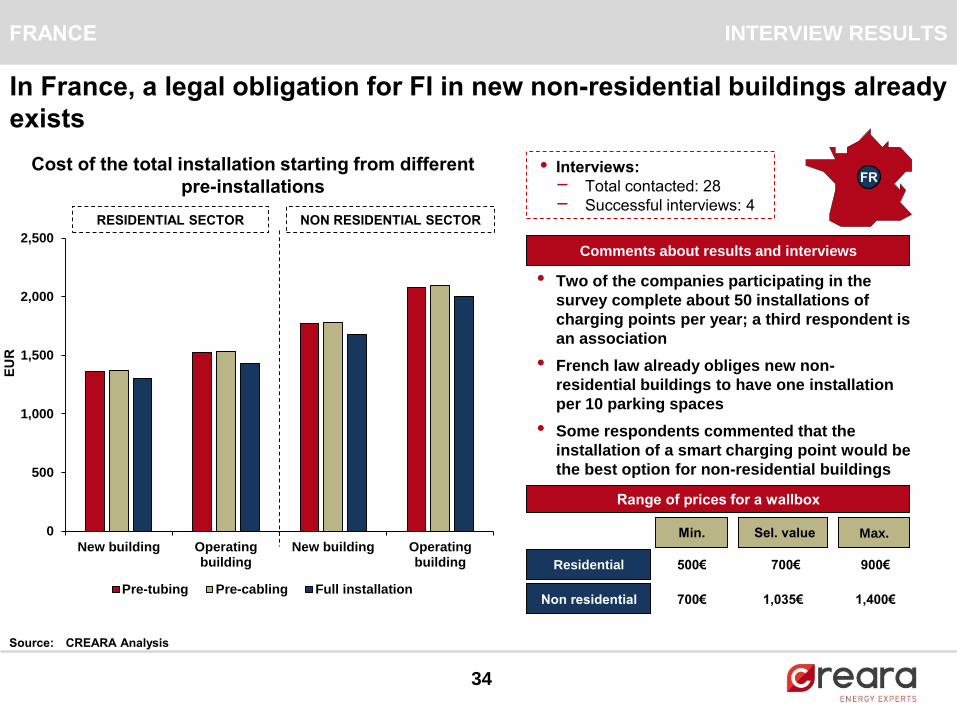
Interviews:•Total contacted: - 28
Successful interviews: - 4
0
500
1,000
1,500
2,000
2,500
New building Operatingbuilding
New building Operatingbuilding
Pre-tubing Pre-cabling Full installation
34
FRANCE INTERVIEW RESULTS
RESIDENTIAL SECTOR NON RESIDENTIAL SECTOR
EU
R
• Two of the companies participating in the
survey complete about 50 installations of
charging points per year; a third respondent is
an association
• French law already obliges new non-
residential buildings to have one installation
per 10 parking spaces
• Some respondents commented that the
installation of a smart charging point would be
the best option for non-residential buildings
FR
500€ 700€ 900€
Range of prices for a wallbox
Min. Sel. value Max.
Cost of the total installation starting from different
pre-installations
Residential
Non residential 700€ 1,035€ 1,400€
In France, a legal obligation for FI in new non-residential buildings already
exists
Comments about results and interviews
Source: CREARA Analysis
35
GERMANY INTERVIEW RESULTS
Source: CREARA Analysis
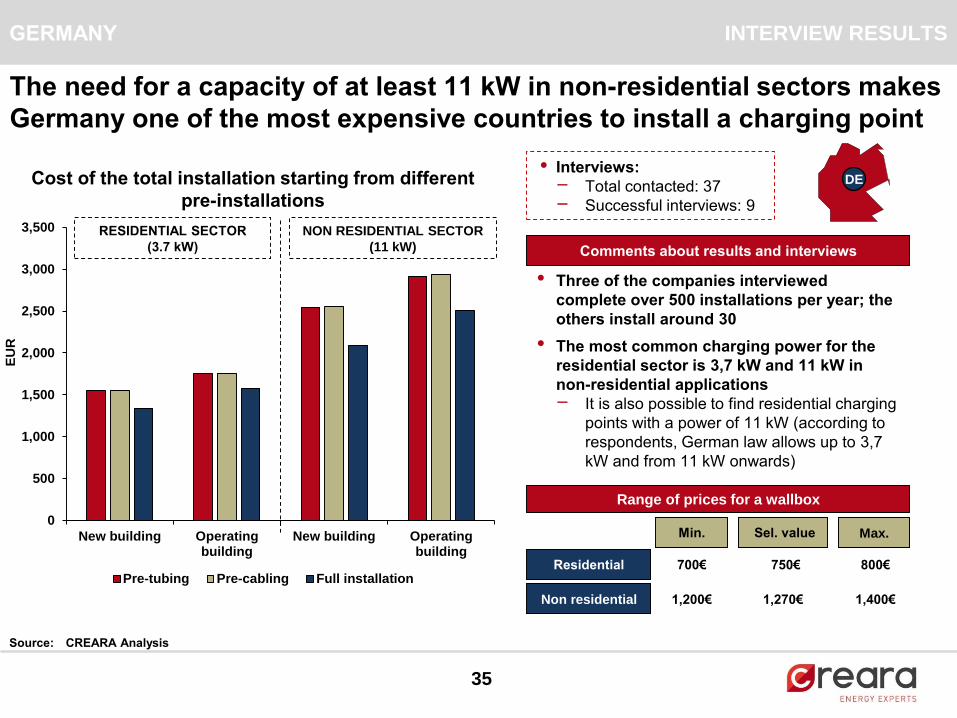
Three of the companies interviewed •complete over 500 installations per year; the
others install around 30
• The most common charging power for the
residential sector is 3,7 kW and 11 kW in
non-residential applications
It is also possible to find residential charging -points with a power of 11 kW (according to
respondents, German law allows up to 3,7
kW and from 11 kW onwards)
Interviews:•Total contacted: - 37
Successful interviews: - 9
DE
Comments about results and interviews
0
500
1,000
1,500
2,000
2,500
3,000
3,500
New building Operatingbuilding
New building Operatingbuilding
Pre-tubing Pre-cabling Full installation
EU
R
700€ 750€ 800€
Min. Sel. value Max.
Residential
Non residential 1,200€ 1,270€ 1,400€
The need for a capacity of at least 11 kW in non-residential sectors makes
Germany one of the most expensive countries to install a charging point
RESIDENTIAL SECTOR
(3.7 kW)
NON RESIDENTIAL SECTOR
(11 kW)
Cost of the total installation starting from different
pre-installations
Range of prices for a wallbox

36
ITALY INTERVIEW RESULTS
IT
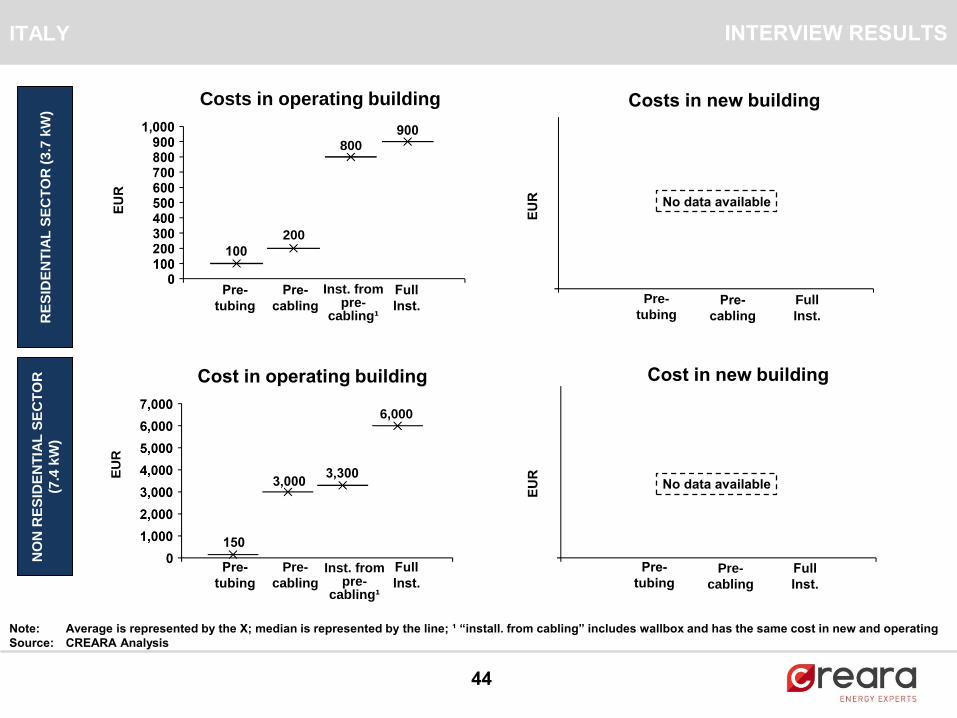
There are specific obligations for any modification of the electric
installations which increase prices in non-residential sector substantially
0
1,000
2,000
3,000
4,000
5,000
6,000
7,000
New building Operatingbuilding
New building Operatingbuilding
Pre-tubing Pre-cabling Full installation
EU
R
700€ 700€ 700€
Min. Sel. value Max.
Residential
Non residential 3,000€ 3,000€ 3,000€
• Pre-installations in
new buildings are
irrelevant (included
in general
construction costs)
Comments about results and interviews
Interviews:•Total contacted: - 35
Successful interviews: - 1
Only one interview has been successfully •carried out in Italy with the only company
specialized in EV charging points and
market leader, with about 100 installations
per year (according to interviewee)
This company- owns the 50% of the public
charging points in Italy
EV charging installation services are mainly •being carried out by general electric
installers
Source: CREARA Analysis
RESIDENTIAL SECTOR NON RESIDENTIAL SECTOR
Cost of the total installation starting from different
pre-installations
Range of prices for a wallbox
37
NETHERLANDS INTERVIEW RESULTS
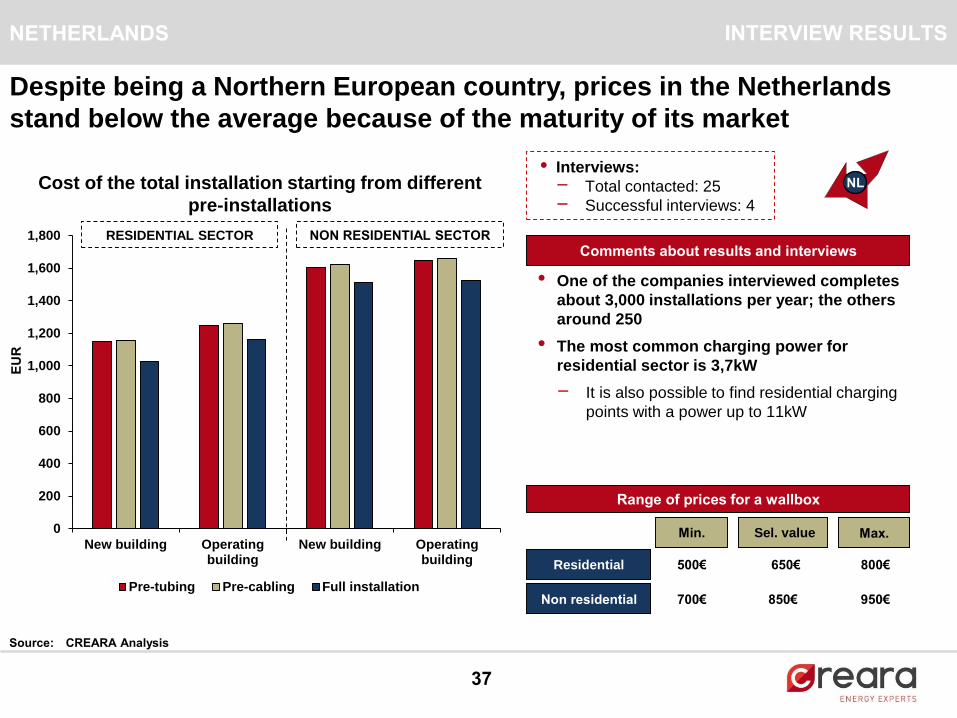
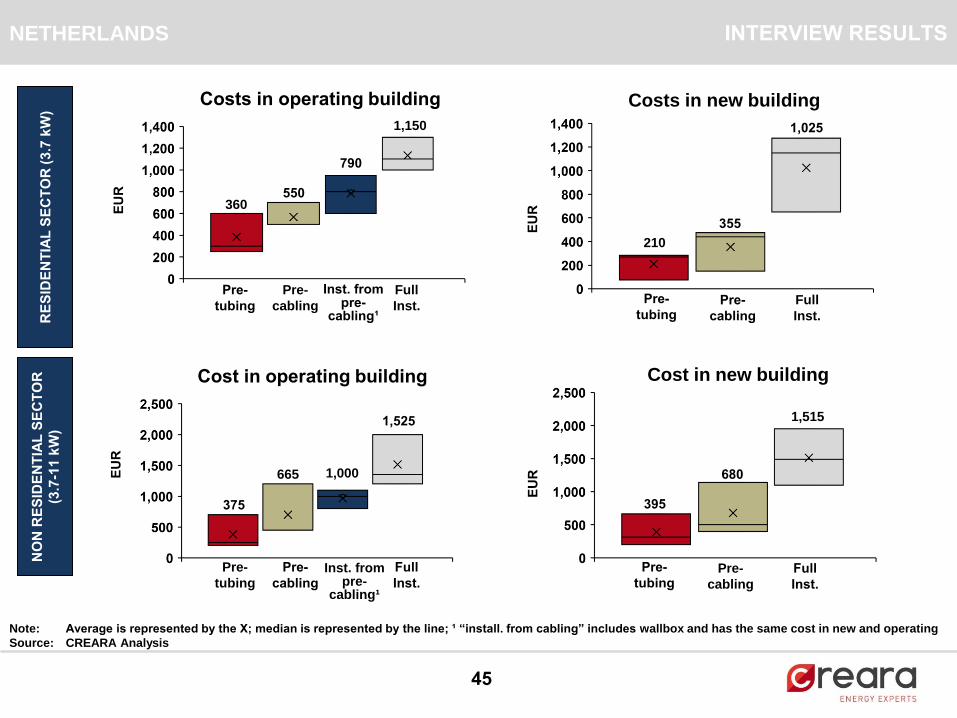
• One of the companies interviewed completes
about 3,000 installations per year; the others
around 250
• The most common charging power for
residential sector is 3,7kW
- It is also possible to find residential charging
points with a power up to 11kW
NL
Despite being a Northern European country, prices in the Netherlands
stand below the average because of the maturity of its market
0
200
400
600
800
1,000
1,200
1,400
1,600
1,800
New building Operatingbuilding
New building Operatingbuilding
Pre-tubing Pre-cabling Full installation
EU
R
500€ 650€ 800€
Min. Sel. value Max.
Residential
Non residential 700€ 850€ 950€
Comments about results and interviews
• Interviews:
- Total contacted: 25
- Successful interviews: 4
Source: CREARA Analysis
RESIDENTIAL SECTOR NON RESIDENTIAL SECTOR
Cost of the total installation starting from different
pre-installations
Range of prices for a wallbox
38
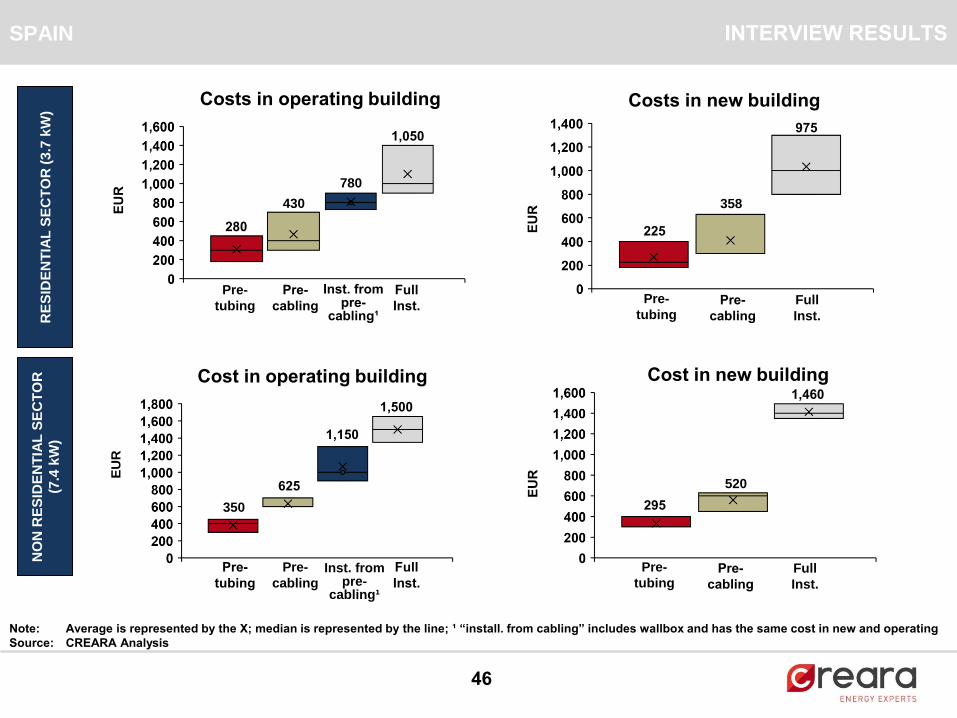
SPAIN INTERVIEW RESULTS
SP
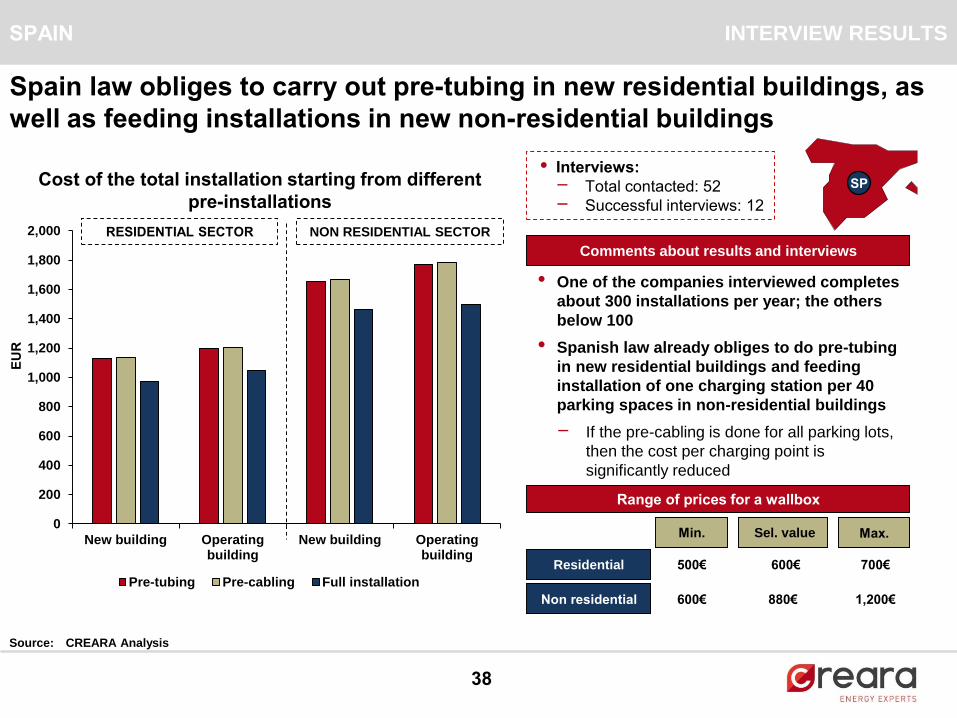
• One of the companies interviewed completes
about 300 installations per year; the others
below 100
• Spanish law already obliges to do pre-tubing
in new residential buildings and feeding
installation of one charging station per 40
parking spaces in non-residential buildings
- If the pre-cabling is done for all parking lots,
then the cost per charging point is
significantly reduced
Spain law obliges to carry out pre-tubing in new residential buildings, as
well as feeding installations in new non-residential buildings
500€ 600€ 700€
Min. Sel. value Max.
Residential
Non residential 600€ 880€ 1,200€
0
200
400
600
800
1,000
1,200
1,400
1,600
1,800
2,000
New building Operatingbuilding
New building Operatingbuilding
Pre-tubing Pre-cabling Full installation
EU
R
Comments about results and interviews
Interviews:•Total contacted: - 52
Successful interviews: - 12
Source: CREARA Analysis
RESIDENTIAL SECTOR NON RESIDENTIAL SECTOR
Cost of the total installation starting from different
pre-installations
Range of prices for a wallbox
39
UK INTERVIEW RESULTS
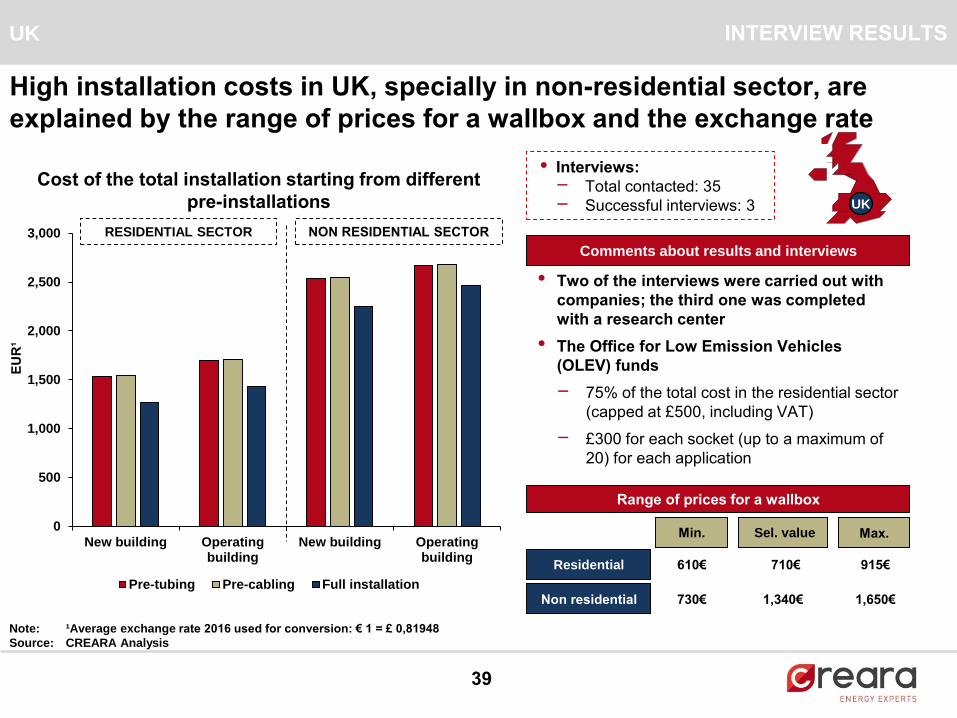
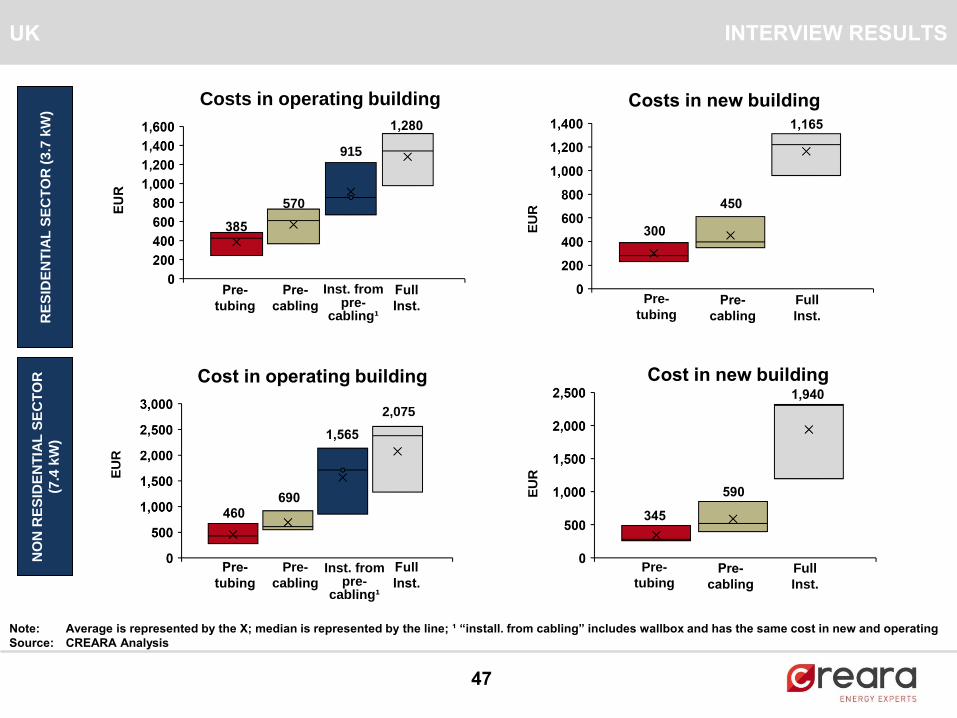
Note: ¹Average exchange rate 2016 used for conversion: € 1 = £ 0,81948
Source: CREARA Analysis
Two of the interviews were carried out with •companies; the third one was completed
with a research center
The Office for Low Emission Vehicles •(OLEV) funds
75- % of the total cost in the residential sector
(capped at £500, including VAT)
- £300 for each socket (up to a maximum of
20) for each application
UK
High installation costs in UK, specially in non-residential sector, are
explained by the range of prices for a wallbox and the exchange rate
610€ 710€ 915€
Min. Sel. value Max.
Residential
Non residential 730€ 1,340€ 1,650€
0
500
1,000
1,500
2,000
2,500
3,000
New building Operatingbuilding
New building Operatingbuilding
Pre-tubing Pre-cabling Full installation
EU
R¹
Comments about results and interviews
Interviews:•Total contacted: - 35
Successful interviews: - 3
RESIDENTIAL SECTOR NON RESIDENTIAL SECTOR
Cost of the total installation starting from different
pre-installations
Range of prices for a wallbox
40
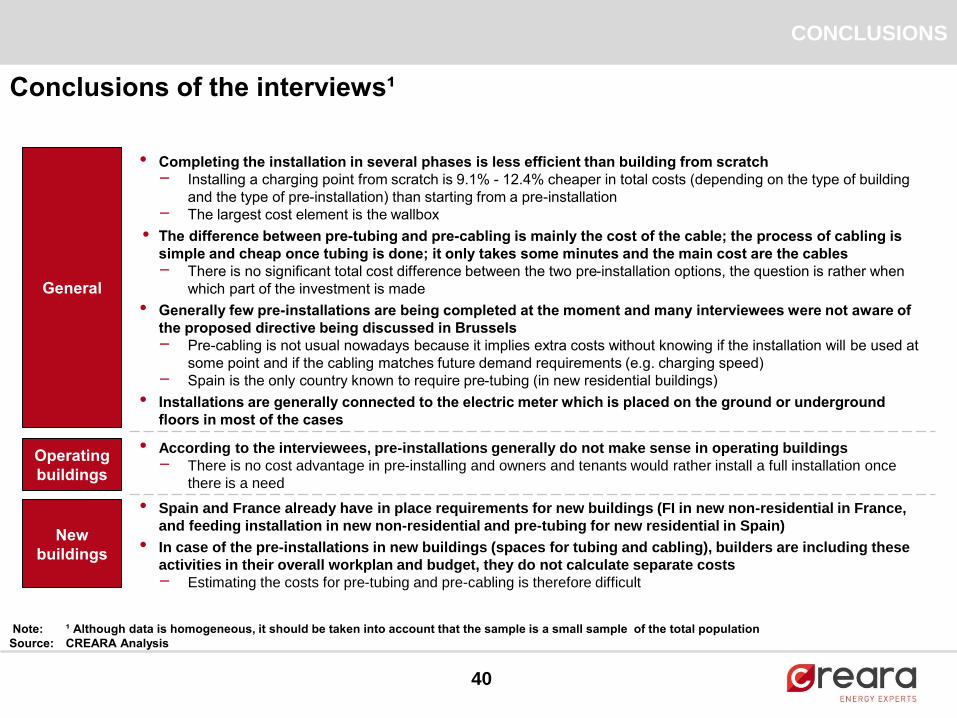
Conclusions of the interviews¹
CONCLUSIONS
Note: ¹ Although data is homogeneous, it should be taken into account that the sample is a small sample of the total population
Source: CREARA Analysis
• According to the interviewees, pre-installations generally do not make sense in operating buildings
- There is no cost advantage in pre-installing and owners and tenants would rather install a full installation once
there is a need
General
Operating
buildings
New
buildings
• Spain and France already have in place requirements for new buildings (FI in new non-residential in France,
and feeding installation in new non-residential and pre-tubing for new residential in Spain)
• In case of the pre-installations in new buildings (spaces for tubing and cabling), builders are including these
activities in their overall workplan and budget, they do not calculate separate costs
- Estimating the costs for pre-tubing and pre-cabling is therefore difficult
Completing the installation in several phases is less efficient than building from scratch•Installing a charging point from scratch is - 9.1% - 12.4% cheaper in total costs (depending on the type of building
and the type of pre-installation) than starting from a pre-installation
The largest cost element is the - wallbox
The difference between pre• -tubing and pre-cabling is mainly the cost of the cable; the process of cabling is
simple and cheap once tubing is done; it only takes some minutes and the main cost are the cables
There is no significant total cost difference between the two pre- -installation options, the question is rather when
which part of the investment is made
Generally few pre• -installations are being completed at the moment and many interviewees were not aware of
the proposed directive being discussed in Brussels
Pre- -cabling is not usual nowadays because it implies extra costs without knowing if the installation will be used at
some point and if the cabling matches future demand requirements (e.g. charging speed)
Spain is the only country known to require pre- -tubing (in new residential buildings)
Installations are generally connected to the electric meter which is placed on the ground or underground •floors in most of the cases
41
Agenda
• Introduction
• Legal framework
• Interview results and conclusions
• Back-up
Inst. from pre-
cabling¹
42
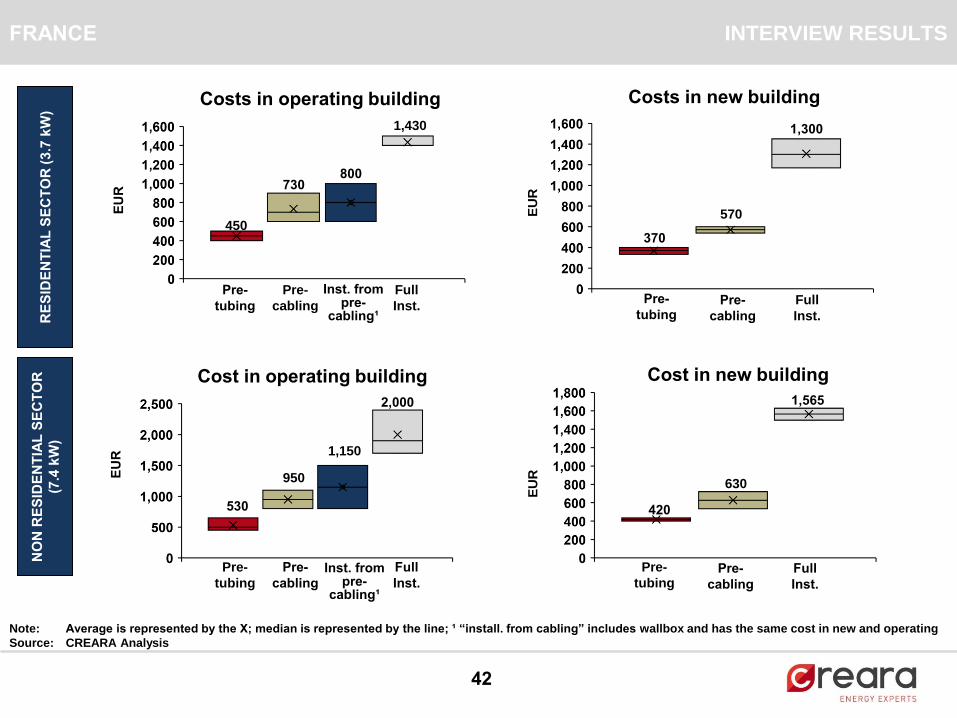
FRANCE INTERVIEW RESULTS
370
570
1,300
EU
R
Costs in new building
Pre-
tubingPre-
cabling
Full
Inst.
Costs in operating building
450
800
1,430
730
EU
R
Pre-
tubing
Pre-
cabling
Inst. from pre-
cabling¹
Full
Inst.
RE
SID
EN
TIA
L S
EC
TO
R (
3.7
kW
)
Note: Average is represented by the X; median is represented by the line; ¹ “install. from cabling” includes wallbox and has the same cost in new and operating
Source: CREARA Analysis
NO
N R
ES
IDE
NT
IAL
SE
CT
OR
(7.4
kW
)
Cost in operating building
530
1,150
2,000
950EU
R
Pre-
tubing
Pre-
cabling
Full
Inst.
420
630
1,565
EU
R
Cost in new building
Pre-
tubingPre-
cabling
Full
Inst.
Full
Inst.Inst. from
pre-cabling¹
43
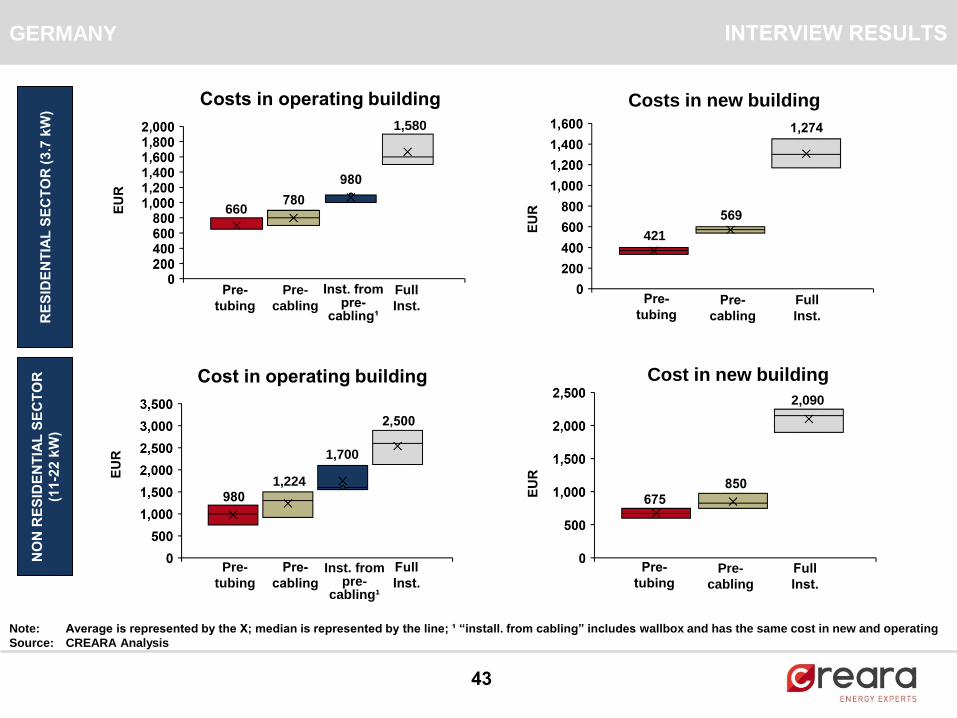
GERMANY INTERVIEW RESULTS
421
569
1,274
EU
R
Costs in new buildingCosts in operating building
660
980
1,580
780
EU
R
Pre-
tubing
Pre-
cabling
Inst. from pre-
cabling¹
Full
Inst.
RE
SID
EN
TIA
L S
EC
TO
R (
3.7
kW
)
Note: Average is represented by the X; median is represented by the line; ¹ “install. from cabling” includes wallbox and has the same cost in new and operating
Source: CREARA Analysis
NO
N R
ES
IDE
NT
IAL
SE
CT
OR
(11
-22
kW
)
Cost in operating building
980
1,700
2,500
1,224
EU
R
Pre-
tubing
Pre-
cabling
675
850
2,090
EU
R
Cost in new building
Pre-
tubingPre-
cabling
Full
Inst.
Pre-
tubingPre-
cabling
Full
Inst.
Full
Inst.Inst. from
pre-cabling¹
44
ITALY INTERVIEW RESULTS
EU
R
Costs in new buildingCosts in operating building
100
800900
200
EU
R
Pre-
tubing
Pre-
cabling
Inst. from pre-
cabling¹
Full
Inst.
RE
SID
EN
TIA
L S
EC
TO
R (
3.7
kW
)
Note: Average is represented by the X; median is represented by the line; ¹ “install. from cabling” includes wallbox and has the same cost in new and operating
Source: CREARA Analysis
NO
N R
ES
IDE
NT
IAL
SE
CT
OR
(7.4
kW
)
Cost in operating building
150
3,300
6,000
3,000
EU
R
Pre-
tubing
Pre-
cabling
EU
R
Cost in new building
Pre-
tubingPre-
cabling
Full
Inst.
Pre-
tubingPre-
cabling
Full
Inst.
No data available
No data available
Full
Inst.Inst. from
pre-cabling¹
45
NETHERLANDS INTERVIEW RESULTS
210
355
1,025
EU
R
Costs in new buildingCosts in operating building
360
790
1,150
550
EU
R
Pre-
tubing
Pre-
cabling
Inst. from pre-
cabling¹
Full
Inst.
RE
SID
EN
TIA
L S
EC
TO
R (
3.7
kW
)
Note: Average is represented by the X; median is represented by the line; ¹ “install. from cabling” includes wallbox and has the same cost in new and operating
Source: CREARA Analysis
NO
N R
ES
IDE
NT
IAL
SE
CT
OR
(3.7
-11
kW
)
Cost in operating building
375
1,000
1,525
665EU
R
Pre-
tubing
Pre-
cabling
395
680
1,515
EU
R
Cost in new building
Pre-
tubingPre-
cabling
Full
Inst.
Pre-
tubingPre-
cabling
Full
Inst.
Full
Inst.Inst. from
pre-cabling¹
46
SPAIN INTERVIEW RESULTS
Costs in operating building
280
780
1,050
430
EU
R
Pre-
tubing
Pre-
cabling
Inst. from pre-
cabling¹
Full
Inst.
RE
SID
EN
TIA
L S
EC
TO
R (
3.7
kW
)
Note: Average is represented by the X; median is represented by the line; ¹ “install. from cabling” includes wallbox and has the same cost in new and operating
Source: CREARA Analysis
NO
N R
ES
IDE
NT
IAL
SE
CT
OR
(7.4
kW
)
Cost in operating building
350
1,150
1,500
625
EU
R
Pre-
tubing
Pre-
cabling
225
358
975
EU
R
Costs in new building
Pre-
tubingPre-
cabling
Full
Inst.
295
520
1,460
EU
R
Cost in new building
Pre-
tubingPre-
cabling
Full
Inst.
Full
Inst.Inst. from
pre-cabling¹
47
UK INTERVIEW RESULTS
Costs in operating building
385
915
1,280
570
EU
R
Pre-
tubing
Pre-
cabling
Inst. from pre-
cabling¹
Full
Inst.
RE
SID
EN
TIA
L S
EC
TO
R (
3.7
kW
)
Note: Average is represented by the X; median is represented by the line; ¹ “install. from cabling” includes wallbox and has the same cost in new and operating
Source: CREARA Analysis
NO
N R
ES
IDE
NT
IAL
SE
CT
OR
(7.4
kW
)
Cost in operating building
460
1,565
2,075
690
EU
R
Pre-
tubing
Pre-
cabling
300
450
1,165
EU
R
Costs in new building
Pre-
tubingPre-
cabling
Full
Inst.
345
590
1,940
EU
R
Cost in new building
Pre-
tubingPre-
cabling
Full
Inst.

ESCOConsulting SoftwareEngineering