the benefits of pipeline innovation · figure 1: the benefit of pipeline innovation (bpi) 0 10 20...
TRANSCRIPT

THE BENEFITS OF PIPELINE INNOVATION
The advantages of using plastics for water and sewerage in Italy

2 2
THE BENEFIT OF PIPELINE INNOVATION
The advantages of using plastics
for water and sewerage in Italy.
Alessandro Marangoni
Team
Stefano Clerici
Simona Fontana
Partners of the project:
We are grateful for the valuable technical contributions of Giuseppe Asti, Luigi Guarrera, Giancarlo Leoni, Pietro Lisanti, Alberto Mariani, Carlo Torre, Paolo Trombetti.
We are grateful for the valuable information supplied by Acegas‐Aps, Aem Milano, Amap, Aqp, Arkema, Ato Genova, Basell Polyolefins, Borealis Italia, Hera, Ineos Polyolefins, Ineos Vinyls Italia, Iride, MM, Sabic, Solvin, Teppfa, Total Petrochemi‐cals.
ATRIP

3 3

4 4
Summary
Introduction
The project: aim and assumptions
The methodology
Pipelines: the present state
The infrastructural gap
Costs analysis
The Benefits of Pipeline Innovation
Conclusions and recommendations

5 5

6 6
The welfare of a nation, its wealth and quality of life, is closely con‐nected with its infrastructural equipment.
Utilities networks (water, gas, telecommunications and electric‐ity) are key factors to guarantee satisfactory services for all the citizens.
Many countries, Italy included, are characterised by infrastructural lacks and lags, that produce poor quality services and high costs for the customers.
During recent years, development and innovation in pipelines has been stopped or slowed down by bureaucratic delays, low attention to research and development, un‐clear evolution of authorisations, political apathy, project problems, shortage of financial resources and so on.
Low innovation and lack of satis‐factory pipelines – in other words, non action – burden everyone with damages, not only economic, but also of the environment and
the community. Costs of non ac‐tion have a damaging effect on countries, for their industrial ac‐tivities, for the environment and for the general welfare.
This document summarises the most important findings of a lar‐ger study realised by Agici, which analyses the benefits of using plastic materials in order to build mains and sewers. This first study is focused on Italy.
In particular, as shown in Figure 1, the benefit of pipeline innovation (BPI), i.e. cost saving in Italy of us‐ing plastics for mains compared with iron, amounts to about 22.2 billion €. The benefits of using plastics for sewers compared with iron pipes amount to 63.6 billion € and compared with cement 54.4 billion €.
Figure 1: The Benefit of Pipeline Innovation (BPI)
0
10
20
30
40
50
60
70
VS iron VS iron VS cement
Mains Sewers
18,8
48,842,4
3,4
14,811,9
Billion
BPI Total Substitutions
BPI Total New constructions
Introduction
Up to 86 billion €.
It is the benefit of pipeline
innovation using plastics for mains and
sewers.

7 7
Aim of the study
The project has as its mission to evaluate the economic, environ‐mental and technical effects of us‐ing plastics in drinking water and wastewater networks, through a cost‐benefit analysis.
The analysis of using different ma‐terials for pipelines has to con‐sider several factors:
The different impacts: eco‐nomic, technical and environ‐mental
The time factor: different im‐pacts are deeply influenced by the considered time range
The transported product: drink‐ing water, wastewater
Assumptions Our main assumptions are:
Innovation is a key factor in the infrastructural development
Use of plastics for water and wastewater pipelines is a tech‐nological change that improves the performance and durability of networks
Adopting new installation tech‐nologies can increase the reli‐ability of pipelines
All these elements produce im‐portant benefits throughout the Italian community
Perimeter of the study
The study is done on homogene‐ous groups of networks, both mains and sewers.
We consider only public utilities networks for drinking water and wastewater in Italy. The study does not include indoor, agricul‐tural, industrial and private net‐works.
We consider three materials fami‐lies and four/five classes of diame‐ters (see Figure 2).
Our analysis considers a period of 50 years, usually assumed as ma‐terials’ durability. The life of dif‐ferent materials may be, of course, longer. Anyway, we as‐sume 50 years, as a caution, since financial analyses often consider shorter periods.
Figure 2: Materials families and classes of diameters
Family Type Size Mains Sewers
300‐315
250‐315 450‐500
500‐630 600‐630
‐ 800
Iron
Cements
Materials
S
M
L
XL
XXL
PVC
Iron
Steel
Cement
Concrete
Clay
Diameters (mm)
PE
PPPlastics
80‐90 100‐125
150‐180
The project: aim and assumptions

8 8
The project is based on the Cost‐Benefit Analysis approach. It has been applied by Agici to industrial and economic systems as well as on plant projects.
To evaluate the Balance of Pipe‐line Innovation, a keen cost‐benefit analysis is applied, to ap‐preciate the direct and indirect ef‐fects of using plastics in different types of pipelines.
The basic assumption of the work is that the use of plastics in pipe‐lines is a technological change that improves performances. We consider different classes of costs/benefits:
Economic: benefits (or avoided costs) and costs (or missed benefits) of using plastic;
Environmental: financial valua‐tion of environmental and so‐cial benefits (or avoided costs) and environmental costs (or missed benefits);
Technical: financial valuation of technical benefits (or avoided costs) and technical costs (or missed benefits).
Steps of the analysis
The analysis is composed of sever‐al steps (see Figure 3): 1. Analysis of the state of present
networks: materials, diameters and performances, also with reference to other countries.
2. Definition of the policy on the basis of national best practices and benchmarks.
3. Definition of the infrastructural gap, in terms of kilometrage of networks to be built and to be replaced, through the compari‐son between the state of pre‐sent networks and the policy.
4. Costs analysis: for each materi‐als family we compare the life‐cycle costs. This means to con‐sider all the costs (economic and environmental) of different pipeline materials and of dif‐ferent diameters over a period of 50 years.
5. Balance of Pipelines Innovation: evaluating the difference be‐tween the costs and benefits of using plastics instead of tradi‐tional materials to build mains and sewers.
Figure 3: Steps of the analysis
Balance of the Benefits of using plastics for mainsBalance of the Benefits of using plastics for sewers
Balance of the Benefits of Pipeline Innovation
PIPELINESSTATE
POLICY
Km of networkto be replaced
GAP OF PERFORMANCE
Km of networkto be built
GAP ANALYSIS COSTS ANALYSIS
Technical data Cost
Plastics
Cement
Iron
Wastewater
Technical data Cost
Plastics
Cement
Iron
Drinking Water
Comparison on:‐Materials Costs‐ Building Costs‐Maintenance Costs‐ Environmental Costs
Balance of using plastics for mains
Balance of using plastics for sewers
Benefits of Pipeline Innovation
The methodology

9 9
We analyse the equipment of pre‐sent networks in several European countries and then we focus our attention on Italy. The aim is to compare the state and perform‐ance of Italian mains and sewers with those in other parts of Europe.
European Framework
We analyse the present situation of networks in Italy, the United Kingdom, France, Spain and Germany, considering: length of pipelines; leakages (only for mains); density of networks per area (km/km2) and per capita (km/inhabitants). In water distribution Italy has very poor performance. Mains have a high rate of leakages (about 38%–45%), compared with the best performers in Europe, Germany (8%–15%) and United Kingdom (15%–16%).
In Italy water leakages amount to 3‐4 trillion m3 per year, thus, the cost for Italy (evaluated at the Ital‐ian drinking water tariff), can be estimated in about 3.9–5.2 billion € per year. Italy is below the European aver‐age if we consider km of mains per area, but if we consider the den‐sity per capita, Italy seems to be comparable with other European countries. The situation of Italian sewers is worse. In fact, considering the network equipment, both density per capita and density per area are inadequate compared with other European countries. These figures emphasise the in‐vestment needed in pipelines in‐frastructures.
Figure 4: Density of mains and sewers in some European countries
Pipelines: the present state
Italy1 UK France Spain Germany
Mains (length of) km 294.194 409.820 825.000 100.000 500.000
million m3 4.102 7.054 6.276 5.299 5.409
Leakages % 38%‐45% 15%‐16% 20%‐22% 0 8%‐15%
mains/area km/km2 1,24 1,69 1,51 0,20 1,40
mains per capitakm/
1000 inh6,19 6,75 13,71 2,24 6,07
Italy1 UK France Spain Germany
Sewers (Length of) km 145.354 347.635 328.703 n.a. 486.000
mains/area km/km2 0,61 1,43 0,60 n.a. 1,36
mains per capitakm/
1000 inh 3,06 5,72 5,46 n.a. 5,90
1 The figures concerning Italy regard a sample (source Bluebook) representing only the 83,4% of whole population
Water Household Consumption
Density of network
Source: Agici estimates on Utilitatis, Drinking Water Inspectorate, Office Parlamentaire d'èvaluation des choix scientifiques et technologiques, German technical and scientific association for gas and water, Ofwat and European Commission data
Density of network
The costs of italian mains
leakages are 5,2 billion € per
year.

10 10
Italian situation
In Italy there is an heterogeneous infrastructural situation among the different regions of the coun‐try. The situation can be summa‐rised by a Present State Index (PSI) that considers the network density related to geographical extent. If we consider the PSI for mains, the Northern regions, with 2.4 km of water pipelines per km2, are bet‐ter than the Middle and Southern regions. We draw similar conclusions with regard to sewers. The Present State Index of the North is 1.4 km/km2 compared with the Italian average value of 1.0 km/km2. In order to define the present situation of Italian mains and sew‐ers, we analyse a sample of ATO Plans1, representing about 25%‐27% of the Italian population. Through this analysis we calculate the breakdown of mains and sew‐ers by material family and pipe di‐ameter.
1
Italian mains are mostly made of iron (62.1%) and plastics (19.6%). There is also a significant presence of asbestos cement, which must be replaced according to law. In contrast, in Italian sewers the leading type of material is cement (74.2%), which includes clay, as‐bestos cement, concrete and ma‐sonry; plastics represent the sec‐ond most common type with a share of 14.2% of the present network. The presence of asbestos cement in sewers and in mains re‐quires a rapid programme of re‐placement and this could repre‐sent a great opportunity for plastic pipelines. Mains diameters are mainly small (60–150 mm); in contrast, sewer pipe diameters are mainly large (>800 mm), with a peak in diame‐ters of between 180 and250 mm.
Figure 5: Drinking water and wastewater Italian networks
An ATO Plan is an official strategic plan made by each Italian local water Authority. According to Italian law 36/1994 (Galli Law), Italy is divided into 92 ATO (Ambito Territoriale Ottimale), that can be defined as optimal water management areas.
The italian infrastructural
situation is very poor, mainly if compared with other european
countries.
NORTH MIDDLE SOUTH ISLANDS ITALY
Drinking Water Network
km 107.677 64.359 88.002 34.156 294.194
Area km2 119.899 69.081 62.469 49.800 301.249
Present State Index (PSI) km/km2 2,4 1,6 1,7 0,8 1,8
Source: Bluebook
NORTH MIDDLE SOUTH ISLANDS ITALY
Wastewater Network
km 55.823 28.450 41.475 19.606 145.354
Area kmq 119.899 69.081 62.469 49.800 301.249
Present State Index (PSI) km/km2 1,4 0,8 0,9 0,5 1,0
Source: Bluebook

11 11
In this section we calculate the network need in terms of new construction and replacement for the present Italian pipelines.
New construction The infrastructural gap for new pipes is calculated by assuming as our policy target the infrastruc‐tural parameters of the best per‐forming area in Italy. This assumption is prudential, as it represents a minimum goal, not enough to reach the average of other European Countries, but aimed to reduce the Italian delay in local infrastructural equipment. Anyway, this hypothesis assumes that a bigger equipment in Italian network could improve perform‐ance, in terms of safety, leakage rates, service quality, population coverage and costs saving. Our policy target is the level of the present state of infrastructure in North Italy, called PSIBenchmark. In order to convert this parameter into km of new network, we apply the PSIBenchmark to the entire Italian area, weighted on population. This is explained in the following formula:
Where: i = Middle, South, Island PSIBenchmak = PSI of North Italy PSIi = Present State Index of i area Km2
i= Extension of i area POPi = Population of i area POPBenchmak = Population of North Italy. If we apply this formula to the Ital‐ian situation, we obtain an infra‐structural gap of 30,247 km for mains and of 20,606 km for sew‐ers (see Figure 6).
Replacement In order to calculate the kilo‐metrage of old networks that should be replaced, we estimate a fair rate of replacement for Italian networks on the basis of a se‐lected sample of ATO plans, repre‐senting about 25%‐27% of the Ital‐ian population, respectively for mains and sewers. We apply the mentioned rate of replacement to the whole Italian networks, both for drinking water and for wastewater. By the analysis of our sample, 42.5% of present mains and 31.6% of present sewers should be re‐placed in a period of 50 years. This represents an infrastructural replacement of 125,000 km of whole Italian mains and 46,000 km of whole Italian sewers in a period of 50 years (see Figure 6).
Figure 6: Infrastructural gap for mains and sewers
km New construction Replacement Total gap
Mains 30.247 125.000 155.247
Sewers 20.606 46.000 66.606
The infrastructural gap
To improve performances of italian network
we need 155.000 km of new mains and 67.000 km of new sewers.

12 12
This part of the study concerns the costs analysis. For each materials family we compare the life‐cycle costs. This means to consider all the unit costs (€/km) of different
materials pipelines and for differ‐ent classes of diameters over a pe‐riod of 50 years. We identify at least four classes of costs as shown in Figure 7.
Material costs
The materials costs consider the cost of pipes in different materials and for different diameters. We have surveyed about 20 dif‐ferent sources of Italian pipe sup‐plies, in order to define an average price for each class of diameters and materials family.
Construction costs
The construction costs derive from the analysis of some case studies and of some specifications of Ital‐
ian utilities. They have been calcu‐lated by summing the cost items of each step (Figure 8) of a tradi‐tional construction project, both for the different materials and the various diameters. The advantages of plastics are very high and the use of No Dig may increase them. We have therefore assumed the use of 30% of No Dig technologies only for plastics. This assumption does not reflect the actual Italian situation, where trenchless tech‐nologies are only 5%, but reflects
Figure 7: Classes of costs
Figure 8: Cost items and technologies
Source: Agici estimates on case studies, general contractors’ interviews and utilities data
Materials Costs
• Pipe costs
Construction Costs
• Yard costs• Installation costs
• Fitting costs
Maintenance Costs
• Number of failures
• Maintenance Costs
Environmental Costs
• Energy consumption
• Externality of yard
• Externality of maintenance
Class Cost Items €/kmAsphalt cuttingExcavationRefillingProvisional and final paving TrasportationWaste managementLyingInstallation of pipeWelding costsTechnical costsInvestigationPlanimetry updateSafety costsAdministrative costsTestCathode protection
Fitting costs
Dep
ends on differen
t location and differnt aspects of
unde
rgroun
d
Installation costs
Road yard costs
Traditional technologiesClass Techniques Cost saving
Slip Lining 30‐50%
Compact Pipe 20‐30%
Roll‐Down 10‐20%
Pipe Bursting 20‐30%
Pipe Splitting 20‐30%
RestorationCured in Place Pipe
(CIPP)15%
Trenchless technologies
Renewal
Substitution
Costs analysis
Italian utilities have to consider not only pipes costs, but also installation,
maintenance and deeply
environmental costs.

13 13
the European situation, and repre‐sents a goal for Italy. On the basis of case studies and interviews with contractors, we estimate that the use of No Dig in‐volves an additional reduction in construction costs of about 20%–25%.
Maintenance costs Maintenance costs depend on the number of failures of different materials and on the repair costs. The number of failures, described in Figure 9, is based on interna‐tional data, weighted on present Italian pipeline breakdowns per material. The repair costs derive from costs forecasts in specifica‐tions of Italian utility companies.
Environmental costs The environmental costs derive from two classes of externalities. The first class is impacts of the phase of pipe production, consid‐ering the energy consumption.
Starting from data on energy con‐sumption, we convert this into electric power and CO2
emissions, evaluated at the price of the emis‐sion certificates. Producing 1 km of pipe in plastic, instead of iron, saves about 33–249 tonnes (de‐pending on pipe diameters) of CO2 emission. The second class of en‐vironmental costs considers the externalities of the operations for installation and maintenance. In particular it refers to the impact of the transportations to the con‐struction site2, considering the costs in terms of: accidents, noise, pollution, climate change, nature and landscape changes and urban effects. According to the assump‐tions of previous sections, the use of trenchless technologies could produce additional savings in such operational externalities.
Figure 9: Number of failures per materials family
Source: Agici estimates on DVGW, Arhus Water Supply Company and UKWIR data
25,7
10,7
5,7
0,0
5,0
10,0
15,0
20,0
25,0
30,0
Iron Cement Plastics
Num
ber o
f failures p
er 100
km
2 See INFRAS values estimated in the document: “Les couts externs des Transports. Etude d’actualisation “, 2004
14 14
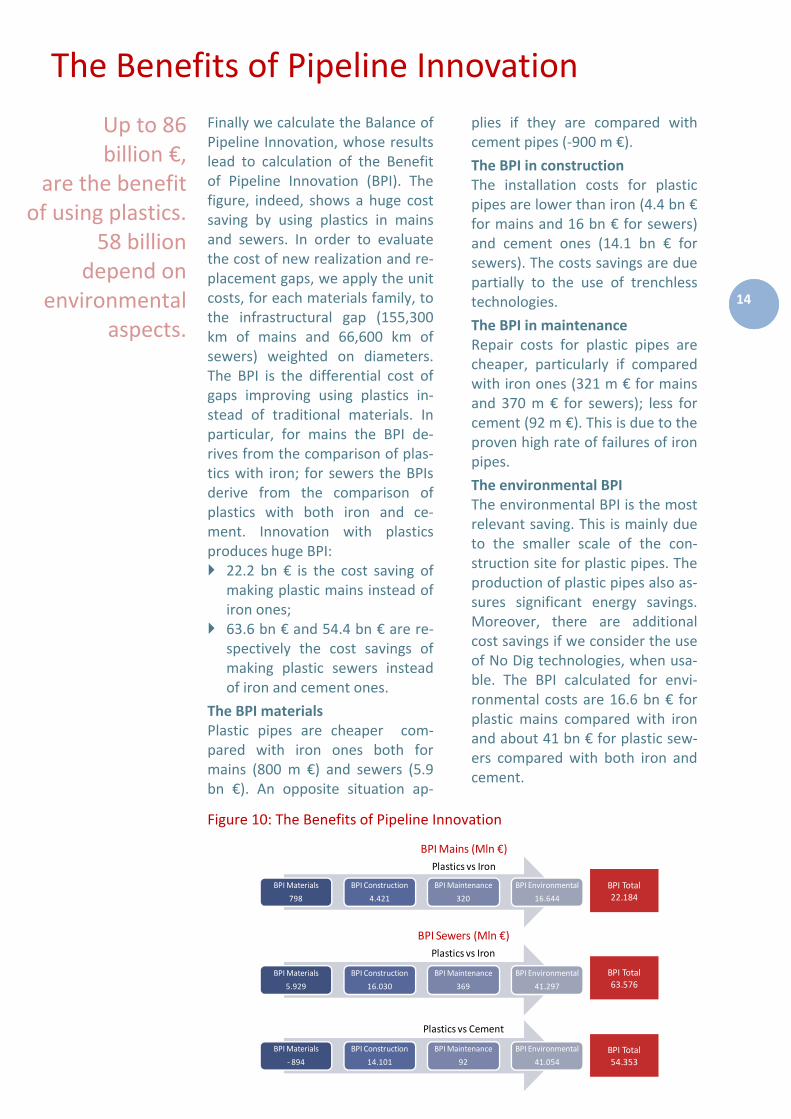
Finally we calculate the Balance of Pipeline Innovation, whose results lead to calculation of the Benefit of Pipeline Innovation (BPI). The figure, indeed, shows a huge cost saving by using plastics in mains and sewers. In order to evaluate the cost of new realization and re‐placement gaps, we apply the unit costs, for each materials family, to the infrastructural gap (155,300 km of mains and 66,600 km of sewers) weighted on diameters. The BPI is the differential cost of gaps improving using plastics in‐stead of traditional materials. In particular, for mains the BPI de‐rives from the comparison of plas‐tics with iron; for sewers the BPIs derive from the comparison of plastics with both iron and ce‐ment. Innovation with plastics produces huge BPI: 22.2 bn € is the cost saving of making plastic mains instead of iron ones;
63.6 bn € and 54.4 bn € are re‐spectively the cost savings of making plastic sewers instead of iron and cement ones.
The BPI materials Plastic pipes are cheaper com‐pared with iron ones both for mains (800 m €) and sewers (5.9 bn €). An opposite situation ap‐
plies if they are compared with cement pipes (‐900 m €).
The BPI in construction The installation costs for plastic pipes are lower than iron (4.4 bn € for mains and 16 bn € for sewers) and cement ones (14.1 bn € for sewers). The costs savings are due partially to the use of trenchless technologies.
The BPI in maintenance Repair costs for plastic pipes are cheaper, particularly if compared with iron ones (321 m € for mains and 370 m € for sewers); less for cement (92 m €). This is due to the proven high rate of failures of iron pipes.
The environmental BPI The environmental BPI is the most relevant saving. This is mainly due to the smaller scale of the con‐struction site for plastic pipes. The production of plastic pipes also as‐sures significant energy savings. Moreover, there are additional cost savings if we consider the use of No Dig technologies, when usa‐ble. The BPI calculated for envi‐ronmental costs are 16.6 bn € for plastic mains compared with iron and about 41 bn € for plastic sew‐ers compared with both iron and cement.
Figure 10: The Benefits of Pipeline Innovation
BPI Materials
5.929
BPI Construction
16.030
BPI Maintenance
369
BPI Environmental
41.297
BPI Materials
798
BPI Construction
4.421
BPI Maintenance
320
BPI Environmental
16.644
BPI Sewers (Mln €)Plastics vs Iron
Plastics vs Cement
Socio
BPI Mains (Mln €)Plastics vs Iron
BPI Total22.184
BPI Materials
‐ 894
BPI Construction
14.101
BPI Maintenance
92
BPI Environmental
41.054
BPI Total63.576
BPI Total54.353
The Benefits of Pipeline Innovation
Up to 86 billion €,
are the benefit of using plastics.
58 billion depend on
environmental aspects.

15 15
In conclusion, our study leads to these final considerations: The use of plastics in water and wastewater networks assures important cost savings.
In Italy, these savings amount to 22,2 bn € for mains built with plastics instead of iron. The benefits of using plas‐tics for sewers compared to iron are 63,6 bn € and com‐pared with cement 54,4 bn€.
The costs of not investing are not sustainable in the long term. The cost of leakages in Italy amounts to 3.9–5.2 bn € per year.
No dig technologies are an in‐novation opportunity for the utility companies. They may enhance the already huge ad‐vantages of plastic pipes.
From the point of view of the utilities companies, an overall cost analysis instead of a tradi‐tional one, may radically chan‐ge investment choices. The Unit BPI (see Figure 11), in fact, shows the different classes of
cost/benefit of each km of network installed.
The reference to material costs does not explain completely the benefits of using plastic; in‐deed plastic pipes are cheaper than iron but more expensive than cement pipes.
Plastic’s advantages emerge clearly when we consider not only materials cost, but also the construction, maintenance and environmental ones.
In Italy, the utility companies should adopt choosing criteria that consider also the impacts on quality of environment and services.
At present in Italy, environmen‐tally‐friendly solutions are not properly considered by pipeline installers, because their addi‐tional costs are not recognized by public administrations. The tenders for pipelines building should consider also criteria that evaluate financial benefits of environmentally‐friendly so‐lutions.
Figure 11: The Unit Benefit of Pipeline Innovation
BPI Materials
‐ 13.431
BPI Construction
211.717
BPI Maintenance
1.387
BPI Environmental
616.373
BPI Materials
89.017
BPI Construction
240.672
BPI Maintenance
5.549
BPI Environmental
619.277
BPI Materials
5.141
BPI Construction
28.478
BPI Maintenance
2.065
BPI Environmental
107.212
BPI Sewers (€/km in 50 years)Plastics vs Iron
Plastics vs Cement
BPI Total142.896 €/km
BPI Total954.514 €/km
BPI Total816.041 €/km
BPI Mains (€/km in 50 years)Plastics vs Iron
Conclusions and recommendations
143.000 €/km are the benefits
of building mains with
plastics. Up to 955.000 €/km are the benefits of
building sewers with plastics.

Autore Alessandro Marangoni
Agici CEO and Senior Partner, he is an expert on Economics and Corporate Finance. He is a professor with wide experience on strategy in different sectors. He is the author of several publications on management and strategy.
Steering Commitee
Cino Serrao PE 100+ Association(Coordinator)
Bruno Balestri PE100+ AssociationAntonio Belforte PE100+ AssociationPierre Belloir PE100+ AssociationFabio Bernardi PVC4 PipesTullio Bosi AtripEnrico Casazza AtripClaudio Celata AssocomaplastCarlo Ciotti Centro di Informazione sul PVCAnnibale De Lorenzo PE100+ AssociationPascale Godon PE100+ AssociationWalter Moretti I.I.P.Andrea Pavan Politecnico di Milano Marco Piana Centro di Informazione su PVC Giuseppe Riva Plastic Europe ItaliaFrancesca Tisi PE100+ AssociationPaolo Trombetti I.A.T.T.Graziano Vidotto I.I.P.
This document may not be re‐produced in any form, eitherin whole or in part, withoutthe written consent of AgiciFinanza d’Impresa. For further information: [email protected]
This document reflects theopinions of its author. Although the utmost care hasbeen taken in preparing thisdocument, the author declinesany and all the responsibilityfor any improper uses of itscontents.
The present work is part ofwider Agici study “The Bene‐fits of Pipeline Innovation. Theadvantages of using plasticsfor water and sewerage in I‐taly”.

17 17
Agici Finanza d’Impresa is an independent firm that provides strategy and financial advisory services. The company is active in the fields of strategy analyses, extraordinary financing and financial and economic research. Agici has a wealth of experience in both public utilities and environmental concerns. The company conducts studies, in Italian and English, both as part of its Global Utility Research Unit (GURU) and on behalf of leading public and private organizations. It also coordinates the observatory on strategies and alliances for Italian and European utilities. www.agici.it Copyright ©2007 AGICI Finanza d’Impresa All rights reserved.
20121 Milano ‐ via Brentano, 2 Tel. +39 02 54.55.801‐ Fax + 39 02 54.11.85.32
E‐Mail: [email protected] ‐ www.agici.it