the assistant - gmsl - soluzioni per crescere© 2014 minitab, inc. making data analysis even easier...
TRANSCRIPT

© 2014 Minitab, Inc.
The Assistant:
Analyze Data with Confidence

© 2014 Minitab, Inc.
Making Data Analysis Even Easier
► Over the years, customers have told us:
“I don’t know which tool to use”
“Minitab has too many options”
“The dialogs are too technical”
“I need help interpreting my results”

© 2014 Minitab, Inc.
Assistant Overview
►Ideal for:• Green/Black Belts
• Occasional Minitab users
• New to statistics or Minitab
►Includes the most commonly used
tools
►Makes data analysis easiereasiereasiereasier and
safersafersafersafer

© 2014 Minitab, Inc.
Top EnhancementsExample 1: Hypothesis Tests

© 2014 Minitab, Inc.
Example 1: Hypothesis Tests
► Suppose you work for a food manufacturer
and you need to test if the weight of a
product is equal to 140 grams.
► You randomly sample 90 items
and measure the weight of each.

© 2014 Minitab, Inc.
Example 1: Hypothesis Tests
► Find the right tool using interactive
decision trees

© 2014 Minitab, Inc.
Example 1: Hypothesis Tests
► Ensure your analysis is successful using
guidelines for:
• Collecting the data
• Evaluating the results
• Etc.

© 2014 Minitab, Inc.
Top EnhancementsExample 2: Control Charts

© 2014 Minitab, Inc.
Example 2: Control Charts
► Suppose you want to evaluate if the amount
of time it takes airline passengers to
pass through security is consistent over
time.
► There are 5 inspection lanes, so you
randomly select 1 passenger per lane
per hour.

© 2014 Minitab, Inc.
Example 2: Control Charts
► Assistant > Control Charts

© 2014 Minitab, Inc.
Example 2: Control Charts
► Run your analysis using dialogs that are:
• Simplified
• Easy to understand
• Dynamic

© 2014 Minitab, Inc.
Top EnhancementsExample 3: Process Capability

© 2014 Minitab, Inc.
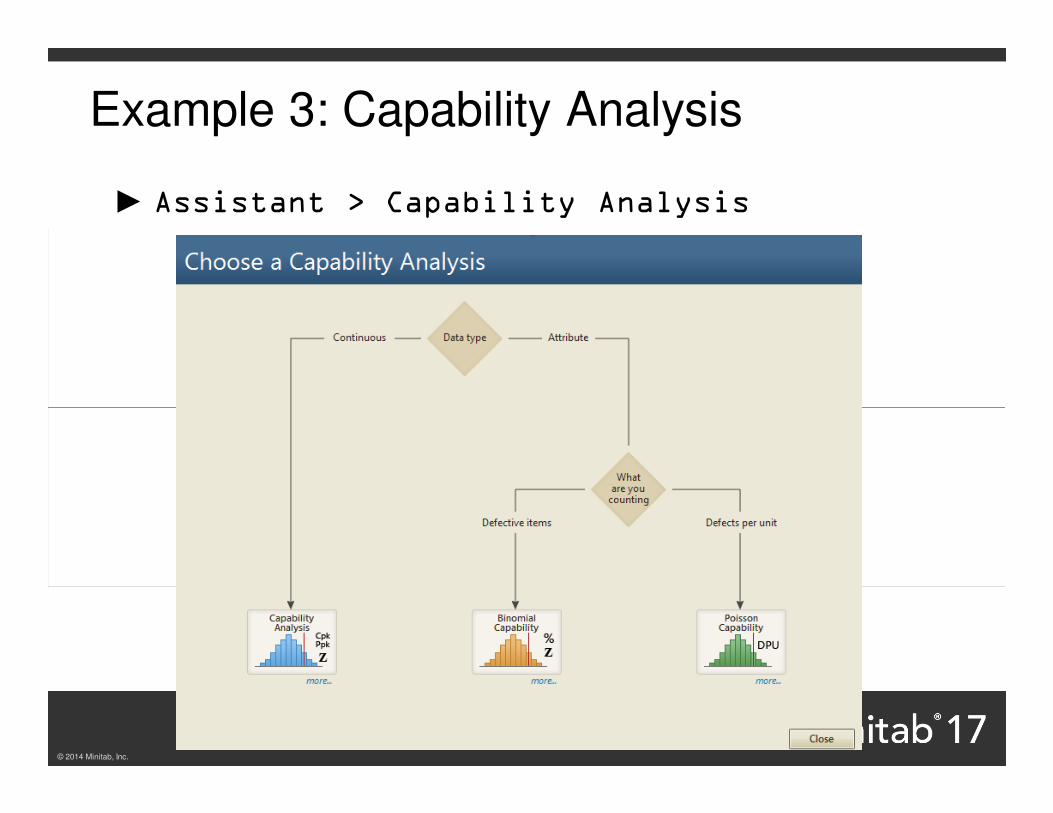
Example 3: Capability Analysis
► Suppose you work for a call center and
want to evaluate the amount of time
customers are put on hold.
► Customers should not wait longer than 10
minutes (upper specification limit)
► You randomly sample 125 calls and measure
the hold time for each call.
© 2014 Minitab, Inc.
Example 3: Capability Analysis
► Assistant > Capability Analysis

© 2014 Minitab, Inc.
Making data analysis easier & safer
► It interprets your resultsIt interprets your resultsIt interprets your resultsIt interprets your results
► It alerts you when your analysis may be
suspect
► It even checks for normality and
transforms your data if possible

© 2014 Minitab, Inc.
Making data analysis easier & safer
► It interprets your results
► It alerts you when your analysis may be It alerts you when your analysis may be It alerts you when your analysis may be It alerts you when your analysis may be
suspectsuspectsuspectsuspect
► It even checks for normality and
transforms your data if possible

© 2014 Minitab, Inc.
Making data analysis easier & safer
► It interprets your results
► It alerts you when your analysis may be
suspect
► It even checks for normality and It even checks for normality and It even checks for normality and It even checks for normality and
transforms your data if possibletransforms your data if possibletransforms your data if possibletransforms your data if possible

© 2014 Minitab, Inc.
Top EnhancementsExample 4: Regression

© 2014 Minitab, Inc.
Example 4: Regression
► HeightHeightHeightHeight can often be used to predict
weightweightweightweight. Given that height is typically
easier to measure than weight, you want to
explore the relationship between these two
variables.
► You also record gendergendergendergender and ageageageage.
► Can you use height, gender or age to
predict weight?

© 2014 Minitab, Inc.
Example 4: Regression
► Assistant > Regression
Another example of Assistant’s powerfulfeatures
Export to ►PowerPoint with one click
◄

© 2014 Minitab, Inc.
The Assistant
► Find the right tool
► Review guidelines
► Easily run your analysis
► Interpret the output
► Present your results

© 2014 Minitab, Inc.
To Try or Buy Minitab 17
►Visit www.minitab17.comwww.minitab17.comwww.minitab17.comwww.minitab17.com
►To contact us, visit
www.minitab.com/contactswww.minitab.com/contactswww.minitab.com/contactswww.minitab.com/contacts to find
your local Minitab representative