the application of exploratory data analysis (eda) …raw.rutgers.edu/docs/wcars/28wcars/28wcars...
TRANSCRIPT
The Application of Exploratory Data Analysis
(EDA) in Auditing
Qi Liu Ph.D. Candidate (A.B.D.)
Dept. of Accounting & Information Systems
Rutgers University
28th WCARS
November 9, 2013

Outline
Introduction
An overview of EDA concept
EDA in Auditing
An application of EDA in auditing – A credit card retention case
Future Research
2

Motivation
Audit is a data intensive process; data analysis plays an important role
in audit process.
Current data analysis approaches used in auditing process focus on
validating predefined audit objectives, which can not discover unaware
risks from the data.
EDA is often linked to detective work, and one of its objectives is to
identify outliers.
Even though some EDA techniques have been used in some auditing
procedures, EDA has never been systematically employed in auditing.
Contribution
This research contributes to the auditing literature by taking the first cut
to use exploratory data analysis in auditing and illustrate a real-world
application in audit process.
3
Introduction

Definition of EDA
Exploratory data analysis (EDA) is a data analysis approach emphasizing
on pattern recognition and hypothesis generation.
4

Exploratory Data Analysis (EDA) Confirmatory Data Analysis (CDA)
Reasoning Type Inductive Deductive
Goal Pattern Recognition and Hypothesis
generation
Estimation, Modeling, Hypothesis testing
Applied Data Observation Data (data collected without
well-defined hypothesis)
Experimental data (data collected through
formally designed experiments)
Techniques Descriptive Statistics, Data Visualization,
Clustering Analysis, Process Mining…
Traditional statistical techniques of
inference, significance, and confidence
Advantages • No assumptions required
• Promotes deeper understanding of the
data
• Precise
• Well-established theory and methods
Disadvantages • No conclusive answers
• Difficult to avoid bias produced by
overfitting
• Required unrealistic assumptions
• Difficult to notice unexpected results
Confirmatory Data Analysis (CDA) is a widely used data analysis approach
emphasizing on experimental design, significance testing, estimation, and
prediction (Good, 1983).
5
EDA vs CDA

Since 1980s, EDA has been applied to diversified disciplines such as interior
design, marketing, industrial engineering, and geography (Chen et al., 2011;
Nayaka and Yano, 2010; Koschat and Sabavala, 1994; Wesley et al., 2006; De
Mast and Trip, 2007, 2009) .
A framework to apply EDA in practical problem solving issues include: (1)
display the data; (2) identify salient features; (3) interpret salient features (De
Mast and Kemper, 2009).
6
Current Applications of EDA
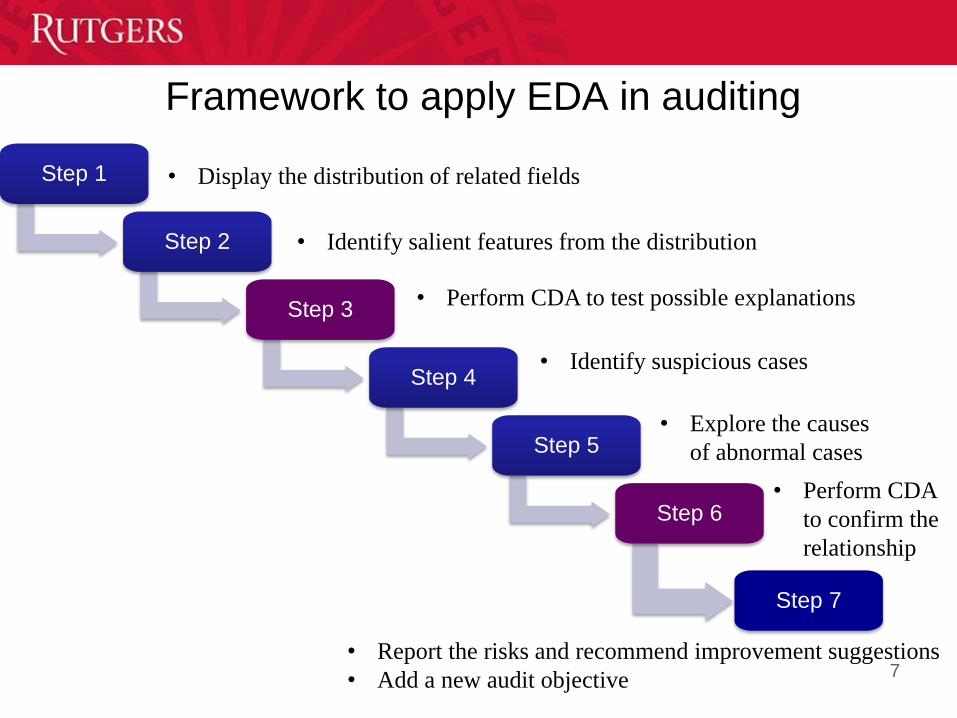
Framework to apply EDA in auditing
7
Step 1
Step 2
Step 3
Step 4
Step 5
Step 6
Step 7
• Display the distribution of related fields
• Identify salient features from the distribution
• Perform CDA to test possible explanations
• Identify suspicious cases
• Explore the causes
of abnormal cases
• Perform CDA
to confirm the
relationship
• Report the risks and recommend improvement suggestions
• Add a new audit objective
8
Purpose
Demonstrate the benefits of applying EDA in audit process
Provide a real example to support the proposed guidelines
Scenario: Clients call the bank asking for a reduction of their card fees. Bank
representatives offer discounts to clients to retain their accounts.
Objectives: identify the situations of loss of revenue in the negotiation of
fees caused by bank representatives, as b:
bank representatives offer higher discounts than allowed
bank representatives usually offer the highest allowable discounts without
putting enough efforts to negotiate lower discounts
bank representatives offer discounts without any negotiation with the
clients
Credit Card Retention Case

Data Description
9
Data (Retention Dataset) Selected Attributes
Each record represents a
customer call
195,694 records
162 fields
Time frame: January, 2012
Original fee (VLR_ANUIDADE_G)
Actual fee (_Valor da Anuidade de Saída)
Agent identification (Funcional do Agente)
Supervisor identification (Funcional do
Supervisor)
Location of the customer service center
(Polo de Atendimento)
Call duration (Tempo de Atendimento de
Retenti)

Data Preprocess
Discount Calculation
Applied EDA techniques
Descriptive Statistics
Data Visualization
Data Transformation
Methodology
10

Bank policy allows bank representatives to offer discounts up to 100% of
the annuity to retain the customer
Results Analysis (1/8)
11
Policy-violating bank representatives and negative discounts
0.15%
0.59%
0.69%
1.21%
4.60%
5.71%
15.66%
31.34%
13.39%
15.14%
11.51%
0%
0.00% 5.00% 10.00% 15.00% 20.00% 25.00% 30.00% 35.00%
<0
0-10%
10%-20%
20%-30%
30%-40%
40%-50%
50%-60%
60%-70%
70%-80%
80%-90%
90%-100%
>100%
Dis
co
un
t
Descriptive statistics of discounts
Frequency distribution of discounts
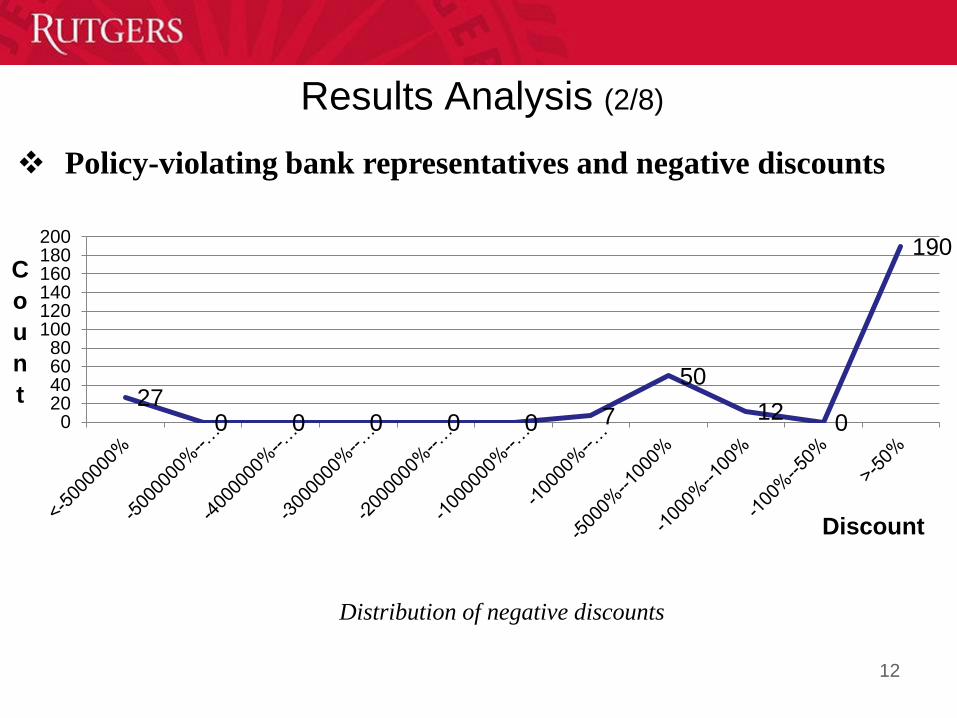
Results Analysis (2/8)
12
Policy-violating bank representatives and negative discounts
27 0 0 0 0 0 7
50
12 0
190
020406080
100120140160180200
C
o
u
n
t
Discount
Distribution of negative discounts

Results Analysis (3/8)
13
Policy-violating bank representatives and negative discounts
New Audit Objective:
Actual fees are recorded correctly.
Original fees reflect the number of cards in an account.
Relationships between negative discounts and original and actual fees

Results Analysis (4/8)
14
Effortless bank representatives and inactive representatives
Distribution of bank representatives offered 100% discounts in the whole retention data and
the 100% discount subset
Bank representatives who always offer 100% discounts should be considered
not putting enough effort to negotiate with the clients for a lower discount.
0
100
200
300
400
500
600
700
86
156
390
954
790
654
290
557
290
666
195
238
290
507
790
522
890
633
291
252
190
448
791
266
699
959
790
013
290
072
290
670
498
564
187
098
795
239
090
839
790
891
490
192
790
535
590
933
990
007
891
178
691
397
491
192
790
796
491
158
590
858
690
960
292
395
199
798
190
797
290
901
292
170
891
536
195
048
890
469
999
055
999
809
991
188
791
185
490
572
090
787
191
491
291
190
690
858
5
F
r
e
q
u
e
n
c
y
Bank Representatitves ID
Frequency in total Frequency in 100% discount subset

Results Analysis (5/8)
15
Effortless bank representatives and inactive representatives
Descriptive statistics of frequency distribution of bank representatives
Inactive
representatives
32%
Supervisor
3%
35% Active
representatives
65%
Distribution of bank representatives
Results Analysis (6/8)
16
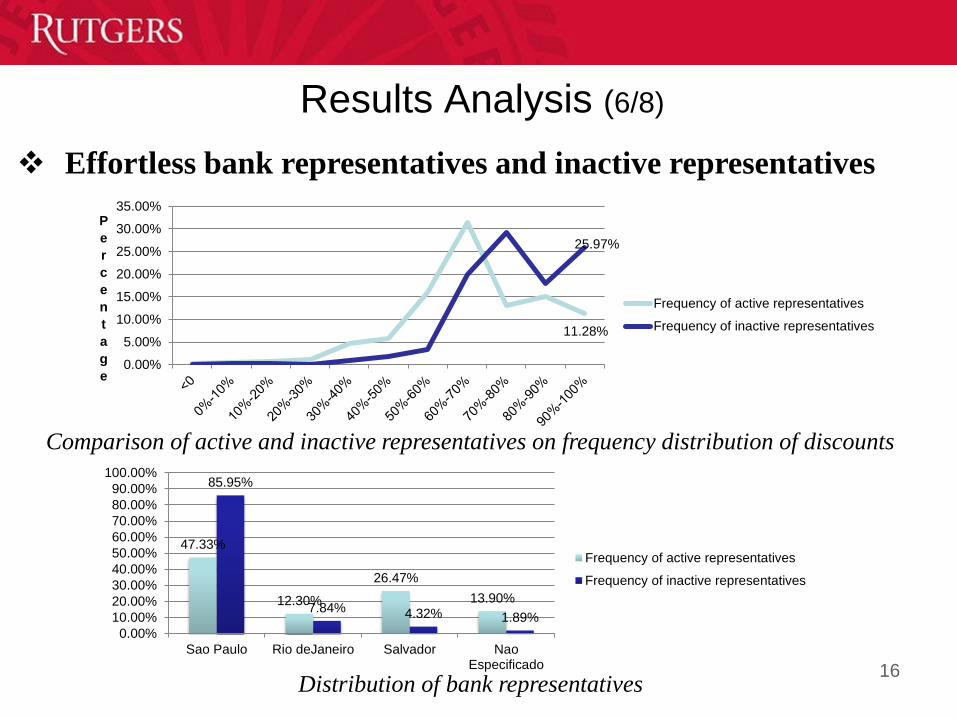
Effortless bank representatives and inactive representatives
Comparison of active and inactive representatives on frequency distribution of discounts
Distribution of bank representatives
11.28%
25.97%
0.00%
5.00%
10.00%
15.00%
20.00%
25.00%
30.00%
35.00%P
e
r
c
e
n
t
a
g
e
Frequency of active representatives
Frequency of inactive representatives
47.33%
12.30%
26.47%
13.90%
85.95%
7.84% 4.32% 1.89%
0.00%
10.00%
20.00%
30.00%
40.00%
50.00%
60.00%
70.00%
80.00%
90.00%
100.00%
Sao Paulo Rio deJaneiro Salvador NaoEspecificado
Frequency of active representatives
Frequency of inactive representatives

Results Analysis (7/8)
17
Non-negotiation bank representatives and short calls
Frequency distribution of call duration less than 600 seconds
Bank representatives who offer a discount without negotiation usually related
to short call duration
Descriptive statistics of call duration
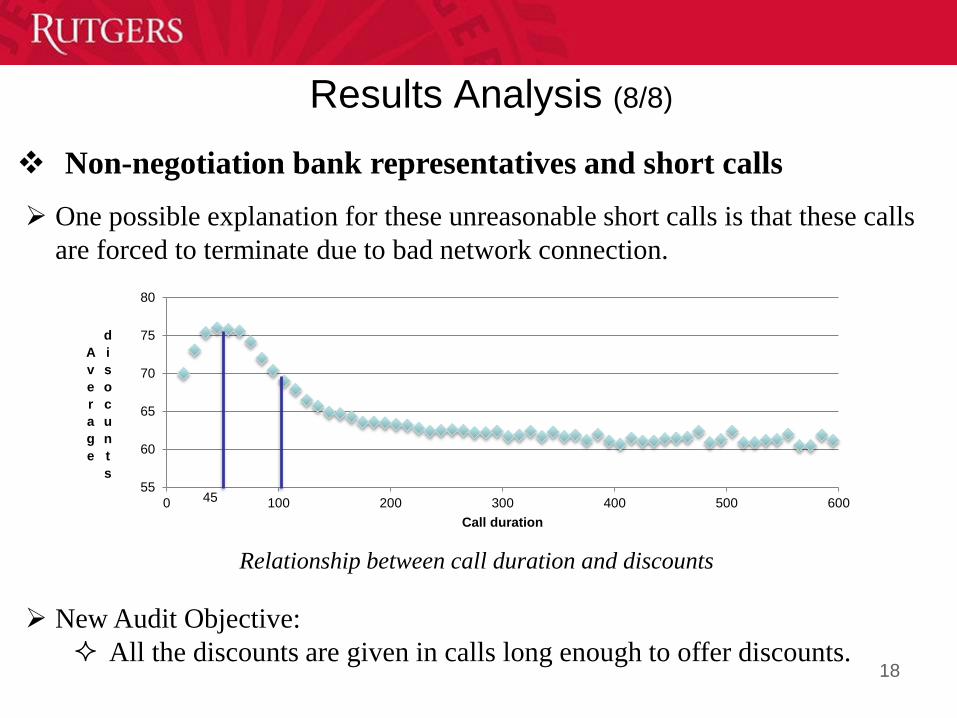
One possible explanation for these unreasonable short calls is that these calls
are forced to terminate due to bad network connection.
New Audit Objective:
All the discounts are given in calls long enough to offer discounts.
Results Analysis (8/8)
18
Non-negotiation bank representatives and short calls
Relationship between call duration and discounts
45 55
60
65
70
75
80
0 100 200 300 400 500 600
A
v
e
r
a
g
e
d
i
s
o
c
u
n
t
s
Call duration
Future research directions
Demonstrate the application of EDA in the audit of financial
statement related business cycle.
Demonstrate the application of EDA in other types of auditing.
Extend current framework to continuous auditing environment.
Explore the application of other EDA technologies in auditing.
Explore the most suitable EDA techniques for each audit
procedure.
19

Thank You!
20