01 - introduction to st 597 - github pages · i exploratory data analysis (eda) ... i this course...
TRANSCRIPT

01 - Introduction to ST 597
ST 597 | Spring 2017University of Alabama
01-Intro.pdf
ST 597 | Sp 2017 1/43
Preliminaries
What is Analytics?
Syllabus
Course Tools
About
Last Things
ST 597 | Sp 2017 2/43
Preliminaries
ST 597 | Sp 2017 3/43
The Course
I This is ST 597: Introduction to Data AnalyticsI Me: Dr. PorterI Meet the TA: Huan Li
ST 597 | Sp 2017 4/43
About you
Fill out a notecard with the following information:
1. Your name (with pronunciation hints)2. Degree, Major and expected graduation date3. Summer plans (intern, research, etc.). What industry or
topics?4. List coding/programming experience. Language and level
(Scale 1-5, 5 highest).5. Why are you taking this course?6. Is there anything specific you want to learn?7. 3 interesting things about you (to help me remember you)
ST 597 | Sp 2017 5/43
Course Webpage
I Course material (including syllabus) can be found at:https://mdporter.github.io/ST597/
I Some material (e.g., solutions) will be posted on blackboard
ST 597 | Sp 2017 6/43

What is Analytics?
ST 597 | Sp 2017 7/43
Famous Quotes
Statistical thinking will one day be as necessary for efficientcitizenship as the ability to read and write.
H. G. Wells
Not many executives are information-literate. They know how toget data. But most still have to learn how to use data.
Peter Drucker
The greatest value of a picture is when it forces us to notice whatwe never expected to see.
John Tukey
ST 597 | Sp 2017 8/43

Data Analytics
I This course will provide you with an introduction to DataAnalytics (using the R software).
I There are lots of buzzwords and opinions about definitions.I Some topics we cover may be described as:
I AnalyticsI Data ScienceI Statistical/Machine LearningI Exploratory Data Analysis (EDA)I Statistical ComputingI Data MiningI Big Data
I Mix of data analysis, computing, and statistics
ST 597 | Sp 2017 10/43
Statistics and Data Science
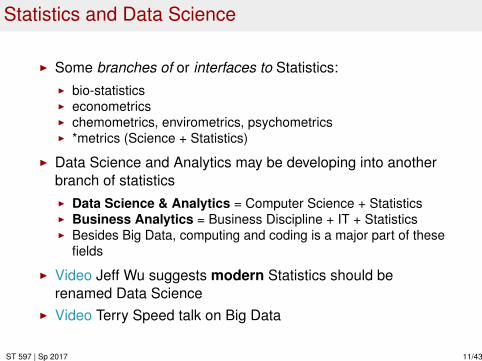
I Some branches of or interfaces to Statistics:I bio-statisticsI econometricsI chemometrics, envirometrics, psychometricsI *metrics (Science + Statistics)
I Data Science and Analytics may be developing into anotherbranch of statisticsI Data Science & Analytics = Computer Science + StatisticsI Business Analytics = Business Discipline + IT + StatisticsI Besides Big Data, computing and coding is a major part of these
fields
I Video Jeff Wu suggests modern Statistics should berenamed Data Science
I Video Terry Speed talk on Big Data
ST 597 | Sp 2017 11/43
What is Statistics?
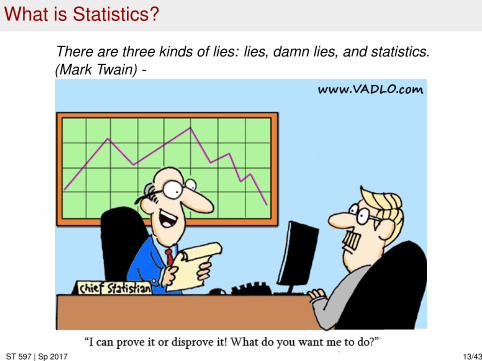
There are three kinds of lies: lies, damn lies, and statistics.(Mark Twain) -
ST 597 | Sp 2017 13/43
What is Statistics?
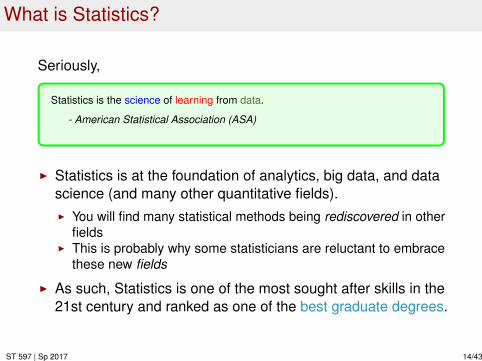
Seriously,
Statistics is the science of learning from data.
- American Statistical Association (ASA)
I Statistics is at the foundation of analytics, big data, and datascience (and many other quantitative fields).I You will find many statistical methods being rediscovered in other
fieldsI This is probably why some statisticians are reluctant to embrace
these new fields
I As such, Statistics is one of the most sought after skills in the21st century and ranked as one of the best graduate degrees.
ST 597 | Sp 2017 14/43
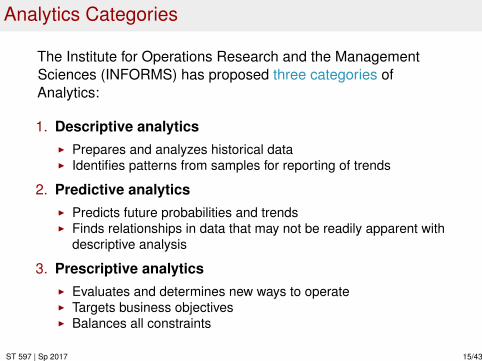
Analytics Categories
The Institute for Operations Research and the ManagementSciences (INFORMS) has proposed three categories ofAnalytics:
1. Descriptive analyticsI Prepares and analyzes historical dataI Identifies patterns from samples for reporting of trends
2. Predictive analyticsI Predicts future probabilities and trendsI Finds relationships in data that may not be readily apparent with
descriptive analysis
3. Prescriptive analyticsI Evaluates and determines new ways to operateI Targets business objectivesI Balances all constraints
ST 597 | Sp 2017 15/43
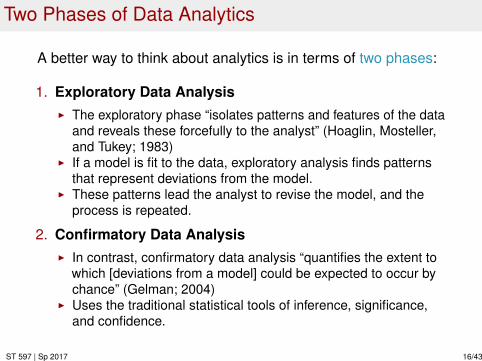
Two Phases of Data Analytics
A better way to think about analytics is in terms of two phases:
1. Exploratory Data AnalysisI The exploratory phase “isolates patterns and features of the data
and reveals these forcefully to the analyst” (Hoaglin, Mosteller,and Tukey; 1983)
I If a model is fit to the data, exploratory analysis finds patternsthat represent deviations from the model.
I These patterns lead the analyst to revise the model, and theprocess is repeated.
2. Confirmatory Data AnalysisI In contrast, confirmatory data analysis “quantifies the extent to
which [deviations from a model] could be expected to occur bychance” (Gelman; 2004)
I Uses the traditional statistical tools of inference, significance,and confidence.
ST 597 | Sp 2017 16/43
Exploratory and Confirmatory Analytics
I Exploratory data analysis is sometimes compared to detectivework: it is the process of gathering evidence.
I Confirmatory data analysis is comparable to a court trial: it isthe process of evaluating evidence.
I Exploratory analysis and confirmatory analysis “can -andshould- proceed side by side” (Tukey; 1977).
ST 597 | Sp 2017 17/43
Why learn stats
http://stattrak.amstat.org/2013/08/01/insurance/
I recently went on a recruiting trip to a top school with botha stats department and a very well recognized “analytics”program, but we only visited the stats department. Thatwas intentional because we have found that the graduateswe have seen from that analytics program didn’tunderstand the fundamentals of statistics or modeling, andthat’s so important to what we do it was a deal breaker.They knew how to push the right buttons and in what order,but the conversation broke down when we asked them whythey push those buttons, and what happens if they deviatefrom that script?
I Andy Pulkstenis, program director of analytics for StateFarm Insurance
ST 597 | Sp 2017 18/43

Students perspective
MBA switching to analytics
I Several decent comments in this post. Notice how there is noagreement on what each term does. Good news is there arejobs for people with your exact skills, no matter the technicallevel.
ST 597 | Sp 2017 19/43

Syllabus
ST 597 | Sp 2017 20/43
Syllabus
Let’s check out the course syllabus:https://mdporter.github.io/ST597/syllabus.html
I Course InfoI Course Pre-Reqs
ST 597 | Sp 2017 21/43
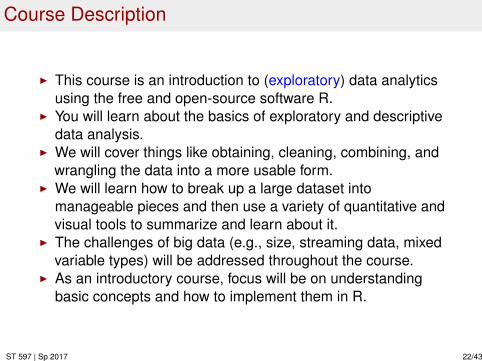
Course Description
I This course is an introduction to (exploratory) data analyticsusing the free and open-source software R.
I You will learn about the basics of exploratory and descriptivedata analysis.
I We will cover things like obtaining, cleaning, combining, andwrangling the data into a more usable form.
I We will learn how to break up a large dataset intomanageable pieces and then use a variety of quantitative andvisual tools to summarize and learn about it.
I The challenges of big data (e.g., size, streaming data, mixedvariable types) will be addressed throughout the course.
I As an introductory course, focus will be on understandingbasic concepts and how to implement them in R.
ST 597 | Sp 2017 22/43

Coding is not optional
I You will need to write codeI Learning a new language is frustrating, but will be rewardingI Languages: R
I Optionally: RMarkdown (to create html or pdf)
I Software: R, RStudio
ST 597 | Sp 2017 23/43

Textbooks and Software
I TextbooksI Software
ST 597 | Sp 2017 24/43

Course Assessment
I Homework with DataCampI I will use your email address from blackboard, so look for emailI Homework posted athttps://mdporter.github.io/ST597/homework.html
I Start homework early - you will get more out of lectureI Note: 1st HW due in a week
I In-Class ParticipationI Midterm Exam
I similar to in-class problems
I Group Project
ST 597 | Sp 2017 25/43
More Syllabus
I Course OutlineI Schedule (https://mdporter.github.io/ST597/)I Read before class. And try the exercises.
I Don’t forget that the homework overlaps too!
I Academic Misconduct
Any questions about the syllabus?
ST 597 | Sp 2017 26/43
Course Tools
ST 597 | Sp 2017 27/43

What is R?
I https://www.r-project.org/about.htmlST 597 | Sp 2017 28/43
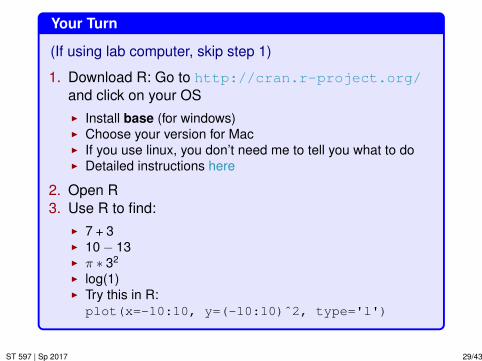
Your Turn
(If using lab computer, skip step 1)
1. Download R: Go to http://cran.r-project.org/and click on your OSI Install base (for windows)I Choose your version for MacI If you use linux, you don’t need me to tell you what to doI Detailed instructions here
2. Open R3. Use R to find:
I 7 + 3I 10 − 13I π ∗ 32
I log(1)I Try this in R:plot(x=-10:10, y=(-10:10)ˆ2, type='l')
ST 597 | Sp 2017 29/43
Who uses R?
I Core language of almost all StatisticiansI Top data science and analytics tool
I 49% of Data Scientists use RI #5 overall programming languageI Overall popularity
I R is forefront of many on-line coursesI DataCampI Coursera: Data Science Specialization
I Many companies using RI MicrosoftI GoogleI New York TimesI AirbnbI General Mills, LexisNexis Risk Solutions, NovartisI and many, many others
ST 597 | Sp 2017 30/43
Why use R?
I $115K average salary for R users (Dice.com 2014 survey)I R is Good for BusinessI R is PopularI R is free!I R is the best program for interactive data analysisI R can detect credit card fraud at 1M transactions/secondI R can run on multiple platforms (Windows, Mac, Linux)I R is open-source
I Companies can use and modifyI R used at MicrosoftI R incorporated into SQL server 2016
I You can find out what the code is actually doing
I SAS (and many other programs) allows you to run R codeI We will do a textual analysis of business analytics postings
which will reveal the growing demand of R
ST 597 | Sp 2017 31/43
What can R do?
I R is a programming language so you can get it to do all sortsof thingsI but its core strength is data analysis
I Some basic functionality:https://www.r-project.org/about.html
I But strength of R is in its packagesI Contributed by usersI Over 12,000 R packages
I Task Views http://cran.r-project.org/web/views/I Reproducible research
ST 597 | Sp 2017 32/43
RStudio
I RStudio is an integrated development environment (IDE) for RI It is also free, open source, and cross-platform!I Download RStudioI Install after R
http://vimeo.com/97166163
I We will do all "coding" in RStudioI RI Rmarkdown
I RStudio also facilitates Shiny for interactive visualizations:http://shiny.rstudio.com/gallery/
I Note: RStudio is not R. But it facilitates the use of R (andmany other things).
Open RStudio if you have it loaded
ST 597 | Sp 2017 33/43
RMarkdown
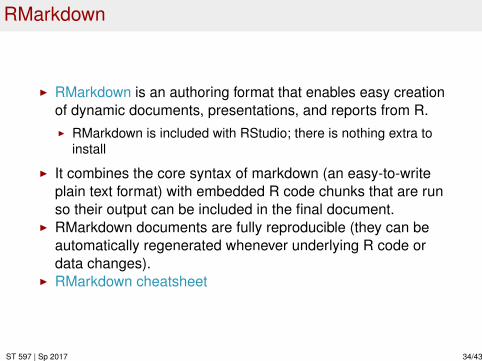
I RMarkdown is an authoring format that enables easy creationof dynamic documents, presentations, and reports from R.I RMarkdown is included with RStudio; there is nothing extra to
install
I It combines the core syntax of markdown (an easy-to-writeplain text format) with embedded R code chunks that are runso their output can be included in the final document.
I RMarkdown documents are fully reproducible (they can beautomatically regenerated whenever underlying R code ordata changes).
I RMarkdown cheatsheet
ST 597 | Sp 2017 34/43
Final Class Details
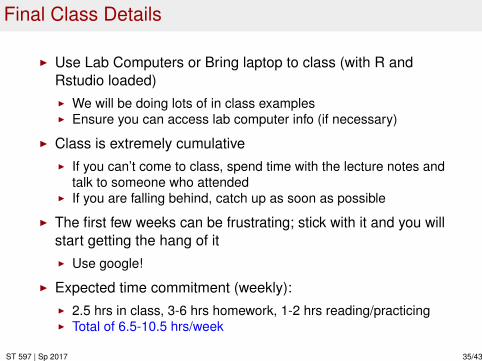
I Use Lab Computers or Bring laptop to class (with R andRstudio loaded)I We will be doing lots of in class examplesI Ensure you can access lab computer info (if necessary)
I Class is extremely cumulativeI If you can’t come to class, spend time with the lecture notes and
talk to someone who attendedI If you are falling behind, catch up as soon as possible
I The first few weeks can be frustrating; stick with it and you willstart getting the hang of itI Use google!
I Expected time commitment (weekly):I 2.5 hrs in class, 3-6 hrs homework, 1-2 hrs reading/practicingI Total of 6.5-10.5 hrs/week
ST 597 | Sp 2017 35/43

About
ST 597 | Sp 2017 36/43
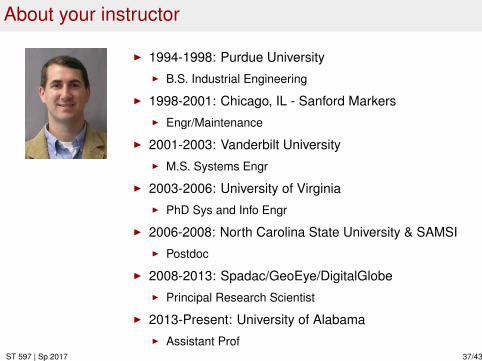
About your instructor
I 1994-1998: Purdue UniversityI B.S. Industrial Engineering
I 1998-2001: Chicago, IL - Sanford MarkersI Engr/Maintenance
I 2001-2003: Vanderbilt UniversityI M.S. Systems Engr
I 2003-2006: University of VirginiaI PhD Sys and Info Engr
I 2006-2008: North Carolina State University & SAMSII Postdoc
I 2008-2013: Spadac/GeoEye/DigitalGlobeI Principal Research Scientist
I 2013-Present: University of AlabamaI Assistant Prof
ST 597 | Sp 2017 37/43

My Family
ST 597 | Sp 2017 38/43

About you
Fill out a notecard with the following information:
1. Your name (with pronunciation hints)2. Degree, Major and expected graduation date3. Summer plans (intern, research, etc.). What industry or
topics?4. List coding/programming experience. Language and level
(Scale 1-5, 5 highest).5. Why are you taking this course?6. Is there anything specific you want to learn?7. 3 interesting things about you (to help me remember you)
ST 597 | Sp 2017 39/43
Last Things
ST 597 | Sp 2017 40/43

ToDo
I Start DataCamp homework (look for email)I Read R4DS 1 and 2I Note any questions from reading and homeworkI Get these RStudio Cheatsheets
I Data VisualizationI Data WranglingI Base RI Regular Expressions
ST 597 | Sp 2017 41/43

Interesting Reading
I Deliberate Practice: the making of an expert https://hbr.org/2007/07/the-making-of-an-expert
ST 597 | Sp 2017 42/43
# Hello from R World
ST 597 | Sp 2017 43/43