the aon benfield aggregatethoughtleadership.aonbenfield.com/documents/201409_aba_1... ·...
TRANSCRIPT

Aon Benfield
Analytics | Market Analysis
Risk. Reinsurance. Human Resources.
The Aon Benfield Aggregate Results for the six months ended June 30, 2014

2 The Aon Benfield Aggregate – Results for the six months ended June 30, 2014
Table of Contents
Global Reinsurer Capital ................................................................................................... 3
Executive Summary .......................................................................................................... 4
ABA Capital ...................................................................................................................... 5
Capital Development ......................................................................................................... 5
Capital Management .......................................................................................................... 7
Premium Income .............................................................................................................. 8
Earnings .........................................................................................................................12
Underwriting Performance ............................................................................................... 13
Investment Results ........................................................................................................... 15
Net Income ...................................................................................................................... 16
Return on Equity .............................................................................................................. 17
ABA Business Model Evolution ........................................................................................20
Who Are The New Investors? ........................................................................................... 20
How Is New Money Being Deployed? .............................................................................. 20
Implications for ‘Traditional’ Reinsurers ............................................................................ 20
Convergence in Action .................................................................................................... 20
ABA Valuation ................................................................................................................22
Financial Strength Ratings ..............................................................................................23
Appendix 1: ABA Data ....................................................................................................24

Aon Benfield Analytics | Market Analysis 3
Global Reinsurer Capital Aon Benfield estimates that global reinsurer capital totaled USD570 billion at June 30,
2014, an increase of 6% relative to the end of 2013. This calculation is a broad measure
of capital available for insurers to trade risk with and includes both traditional and
alternative forms of reinsurer capital.
Exhibit 1: Global Reinsurer Capital
Source: Company reports, Aon Benfield Analytics
Major insurers and reinsurers generally maintained their solid operating performance during the first half of 2014, aided by below average insured catastrophe losses, economic recovery in the United States, exposure growth in emerging markets and relatively stable capital market conditions. Retained earnings were bolstered by unrealized gains on bond portfolios, driven in particular by lower yields in the eurozone, providing a boost to reported capital positions.
The involvement of capital market investors in the reinsurance sector through non-equity participations continues to expand. This is evidenced by record levels of catastrophe bond issuance in the first half of 2014 (exceeding the prior year period by almost 50%), growth in fully collateralized placements, the establishment of new sidecar vehicles and the exploration of alternative business models by hedge fund managers.
17 22 19 22 24 28 39 50 59
368 388321
378447 428
466490 511
6% -17% 18%18%
-3% 11%7%
6%
385410
340
400
470 455505
540570
0
100
200
300
400
500
600
700
FY 2006 FY 2007 FY 2008 FY 2009 FY 2010 FY 2011 FY 2012 FY 2013 1H 2014
USD
(b
illio
ns)
Traditional CapitalAlternative CapitalGlobal Reinsurer Capital

4 The Aon Benfield Aggregate – Results for the six months ended June 30, 2014
Executive Summary In the absence of significant catastrophe losses, industry capital continues to build.
Aon Benfield estimates that global reinsurer capital rose by 6% to USD570 billion during the six months to June 30, 2014, driven by generally solid earnings, unrealized gains on bond portfolios and a continuing influx of new funds from capital markets investors.
The reported shareholders’ funds of the 31 ABA companies stood at USD351 billion (62% of global reinsurer capital), an increase of 4%, driven by net income of USD18.6 billion and unrealized gains of USD9.4 billion.
Convergence is driving risk transfer costs down and freeing-up equity capital.
Net catastrophe exposures are reducing as ABA companies lay-off increasing amounts of risk to the capital markets via sidecars, insurance-linked securities and more cost effective retrocession cover.
Public dividends and share buybacks rose by 11% to USD12.4 billion in the first half of 2014. This was equivalent to 5.4% of opening capital, up from 5.0% previously.
Most ABA companies continue to achieve premium growth, despite difficult market conditions.
Property and casualty premiums written by the listed ABA (excluding NICO and Gen Re – see below) rose by 4% to USD109 billion in the first half of 2014, with growth split evenly between insurance and reinsurance business.
The main drivers were acquisitions, diversification into new lines, expansion in emerging markets, a shift towards longer-tail proportional business and the impact of multi-year contracts.
Reactions to lower property catastrophe pricing varied, with some companies shrinking their books on both a gross and net basis and others leveraging third party capital to maintain or build their business positions.
Increased competition is impacting underwriting margins.
The combined ratio of the listed ABA rose by 0.4 percentage points to 90.3% in the first half of 2014, while P&C underwriting profit was unchanged at USD7.9 billion. Reported catastrophe losses declined relative to the prior year period and were well below the long-term average.
Underlying fundamentals were negative. Weakening pricing and business mix changes impacted attritional loss and expense ratios and support from prior year reserve development was reduced.
Low interest rates continue to depress underlying investment results.
The listed ABA reported a 4% increase in ordinary investment income to USD13.4 billion, driven by underlying asset growth and portfolio repositioning. However the yield of 2.9% is down by a third relative to 2007.
Headline return on equity remains resilient, but is declining on an underlying basis.
Net income reported by the listed ABA rose by 12% to USD14.0 billion, an annualized return on average equity of 12.2%. This result was heavily influenced by realized and unrealized capital gains. Return on equity based on pre-tax operating profit stood at 10.3%.
Evolution of the ABA
Aon Benfield Aggregate (ABA) reports are produced on a half-yearly basis and cover the reported results of 31 major reinsurers worldwide, with the aim of identifying the latest trends in the P&C reinsurance marketplace.
The study comprises 29 publicly-listed holding companies (‘the listed ABA’) and two US-domiciled subsidiaries of Berkshire Hathaway, namely National Indemnity Company (NICO) and General Reinsurance Corporation (Gen Re).
NICO entered into a significant intra-group reinsurance transaction with GEICO Group effective January 1, 2014, which has had a material impact on its reported results. To provide a more meaningful picture of the sector’s underlying performance, many of the charts and ratios used in this report focus on the listed ABA.

Aon Benfield Analytics | Market Analysis 5
ABA Capital The reported shareholders’ funds of the 31 ABA companies stood at USD351 billion at
June 30, 2014, an increase of 4% or USD14 billion since the end of 2013. The total for
the listed ABA was USD239 billion, an increase of 4% or USD10 billion.
Exhibit 2: ABA Shareholders’ Funds
Source: Company reports, Aon Benfield Market Analysis
Capital Development The main drivers of the growth in ABA capital were net income of USD18.6 billion and unrealized investment gains of USD9.4 billion, partly offset by dividends of USD10.1 billion and share buybacks of USD4.2 billion.
The most significant unrealized gains were reported by Munich Re (USD2.4 billion), Swiss Re (USD1.7 billion), NICO (USD1.2 billion), ACE (USD0.9 billion) and Mapfre (USD0.6 billion).
Exhibit 3: Year-to-Date ABA Shareholders’ Funds Development
Source: Company reports, Aon Benfield Market Analysis
12% -17% 29%
15%2% 12%
6%4%
201226
187
242278 283
317337 351
0
100
200
300
400
FY 2006 FY 2007 FY 2008 FY 2009 FY 2010 FY 2011 FY 2012 FY 2013 1H 2014
USD
(b
illio
ns)
337.5 0.5
18.6 0.69.4 -4.2
-10.1
-1.1 351.3
300
325
350
375
FY 2013SHF
Additionalcapital
Netincome
FX Investmentgains
Sharebuybacks
Dividends Other 1H 2014SHF
USD
(b
illio
ns)

6 The Aon Benfield Aggregate – Results for the six months ended June 30, 2014
Between them, NICO and Gen Re reported USD112 billion of shareholders’ funds at June 30, 2014, representing 32% of the ABA total. On a combined basis, Munich Re, Swiss Re and ACE contributed USD101 billion or 29%. More than half of the ABA companies (17) reported shareholders’ funds in excess of USD5 billion, while five remained below USD2 billion.
Exhibit 4: Reported Shareholders’ Funds at June 30, 2014 by ABA Constituent
Source: Company reports, Aon Benfield Market Analysis
All but four ABA companies reported capital growth in the first half of 2014, generally driven by retained earnings and/or unrealized investment gains taken directly to equity. QBE also benefited from a USD250 million debt conversion and significant foreign exchange gains. The reductions in shareholders’ funds at Beazley, Hiscox and RenaissanceRe were driven by active capital management, as shown in Exhibit 6.
Exhibit 5: Year-to-Date Movement in Reported Shareholders’ Funds
Source: Company reports, Aon Benfield Market Analysis
0
10
20
30
40
50
60
70
80
90
100
0
10
20
30
40
USD
(b
illio
ns)
4%
-6%
-4%
-2%
0%
2%
4%
6%
8%
10%
12%
14%ABA

Aon Benfield Analytics | Market Analysis 7
Capital Management Surplus equity is being returned to investors in growing amounts, partly reflecting increased interaction with third party capital structures. Capital repatriation by the listed ABA increased by 10.9% to USD12.4 billion in the first half of 2014. This was equivalent to 5.4% of opening shareholders’ funds, up from 5.0% in the prior year period. Dividend payments rose by 4% to USD8.2 billion, while share buybacks climbed by 26% to USD4.2 billion.
Exhibit 6: Dividends & Share Buybacks as a Percentage of Opening Shareholders’ Funds
Source: Company reports, Aon Benfield Market Analysis
0%
2%
4%
6%
8%
10%
12%
14%
16%Dividends
Share buybacks

8 The Aon Benfield Aggregate – Results for the six months ended June 30, 2014
Premium Income Total premiums written by the ABA rose by 13% to USD171 billion in the first half of
2014. The portion related to P&C business rose by 17% to USD128 billion, but was up
by only 4% to USD109 billion excluding NICO and Gen Re.
Exhibit 7: ABA P&C Gross Premiums Written
Source: Company reports, Aon Benfield Market Analysis
NICO reported a fourfold increase in gross premiums written, driven by a new 50% intra-group quota share reinsurance agreement with GEICO Group, effective January 1, 2014. P&C premium growth of 4% across the listed ABA was split evenly between insurance and reinsurance business. The main drivers were acquisition effects, diversification into new lines, expansion in emerging markets, a shift towards longer-tail proportional business and the impact of multi-year contracts.
Exhibit 8 shows the splits of P&C premium between direct insurance and assumed reinsurance across the ABA in the first half of 2014, based on (sometimes inconsistent) company disclosure. Munich Re includes Risk Solutions business within its P&C Reinsurance segment (24% of revenues in 2013).
Exhibit 8: 1H 2014 P&C Gross Premiums Written by ABA Constituent
Source: Company reports, Aon Benfield Market Analysis
56 58
49 51
93 99
1997
103 109
128
0
50
100
150
1H 2011 1H 2012 1H 2013 1H 2014
USD
(b
illio
ns)
NICO & Gen Re Insurance Reinsurance Total
0
2
4
6
8
10
12
14
16
18
20
USD
(b
illio
ns)
P&C InsuranceP&C Reinsurance
Aon Benfield Analytics | Market Analysis 9
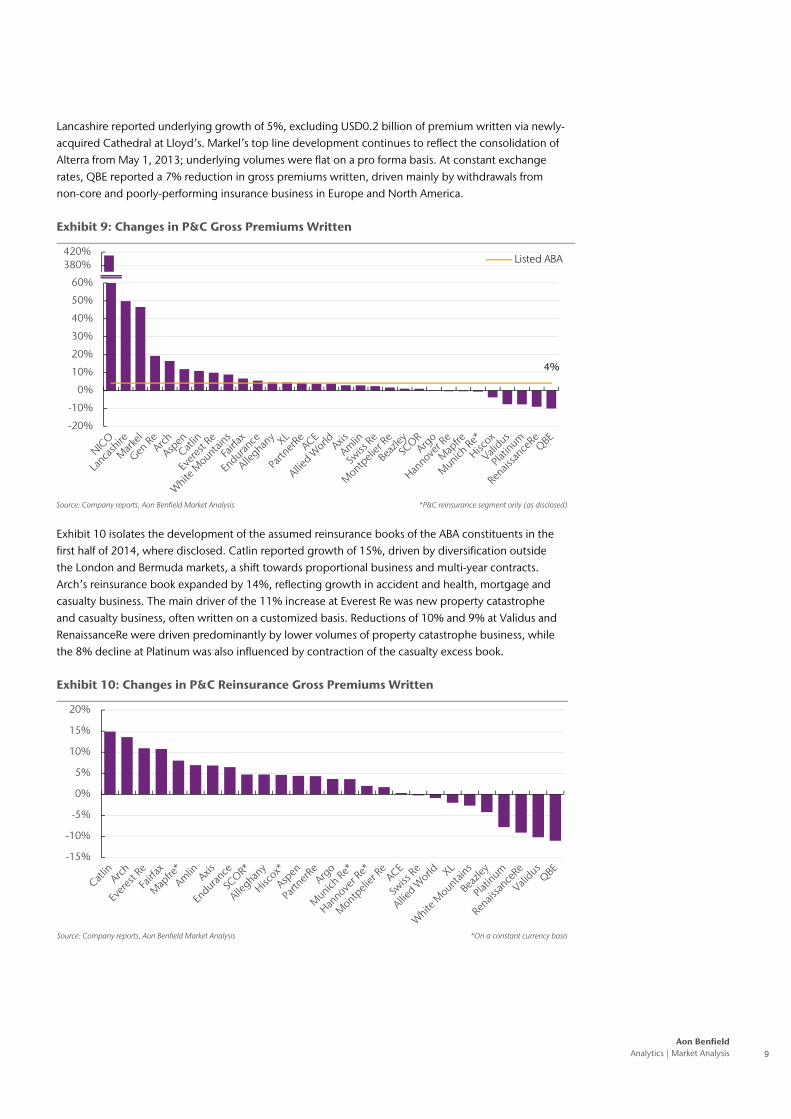
Lancashire reported underlying growth of 5%, excluding USD0.2 billion of premium written via newly-acquired Cathedral at Lloyd’s. Markel’s top line development continues to reflect the consolidation of Alterra from May 1, 2013; underlying volumes were flat on a pro forma basis. At constant exchange rates, QBE reported a 7% reduction in gross premiums written, driven mainly by withdrawals from non-core and poorly-performing insurance business in Europe and North America.
Exhibit 9: Changes in P&C Gross Premiums Written
Source: Company reports, Aon Benfield Market Analysis *P&C reinsurance segment only (as disclosed)
Exhibit 10 isolates the development of the assumed reinsurance books of the ABA constituents in the first half of 2014, where disclosed. Catlin reported growth of 15%, driven by diversification outside the London and Bermuda markets, a shift towards proportional business and multi-year contracts. Arch’s reinsurance book expanded by 14%, reflecting growth in accident and health, mortgage and casualty business. The main driver of the 11% increase at Everest Re was new property catastrophe and casualty business, often written on a customized basis. Reductions of 10% and 9% at Validus and RenaissanceRe were driven predominantly by lower volumes of property catastrophe business, while the 8% decline at Platinum was also influenced by contraction of the casualty excess book.
Exhibit 10: Changes in P&C Reinsurance Gross Premiums Written
Source: Company reports, Aon Benfield Market Analysis *On a constant currency basis
-20%20%60%
100%140%180%220%260%300%340%380%420%
Listed ABA
4%
-20%
-10%
0%
10%
20%
30%
40%
50%
60%
-15%
-10%
-5%
0%
5%
10%
15%
20%

10 The Aon Benfield Aggregate – Results for the six months ended June 30, 2014
Net P&C insurance and reinsurance premiums written by the ABA rose by 20% to USD110 billion in the first half of 2014. The listed ABA reported a 4% increase to USD92 billion, based on a virtually unchanged cession rate of 15.8%. Reinsurance utilisation rose most significantly at RenaissanceRe, Endurance and XL, while the biggest reductions were at Lancashire, Swiss Re and Amlin.
Exhibit 11: Ceded RI as a Percentage of 1H 2014 P&C Gross Premiums Written
Source: Company reports, Aon Benfield Market Analysis *P&C reinsurance segment only (as disclosed)
Net P&C insurance and reinsurance premiums earned by the ABA rose by 19% to USD97 billion in the first half of 2014. The listed ABA reported a 5% increase to USD82 billion, with the five largest constituents contributing USD43 billion, or 53% of the total.
Exhibit 12: 1H 2014 P&C Net Premiums Earned by ABA Constituent
Source: Company reports, Aon Benfield Market Analysis *P&C reinsurance segment only (as disclosed)
16%
0%
5%
10%
15%
20%
25%
30%
35%Listed ABA
0
2
4
6
8
10
12
14
16
USD
(b
illio
ns)

Aon Benfield Analytics | Market Analysis 11
Exhibit 13 shows the year-on-year movements in P&C net premiums earned across the ABA. Two-thirds of the constituent companies reported growth in the first half of 2014.
Exhibit 13: Changes in P&C Net Premiums Earned
Source: Company reports, Aon Benfield Market Analysis *P&C reinsurance segment only (as disclosed)
-20%
30%
80%
130%
180%
230%
280%
330%
380%Listed ABA
5%
-20%
-10%
0%
10%
20%
30%
40%
50%
12 The Aon Benfield Aggregate – Results for the six months ended June 30, 2014
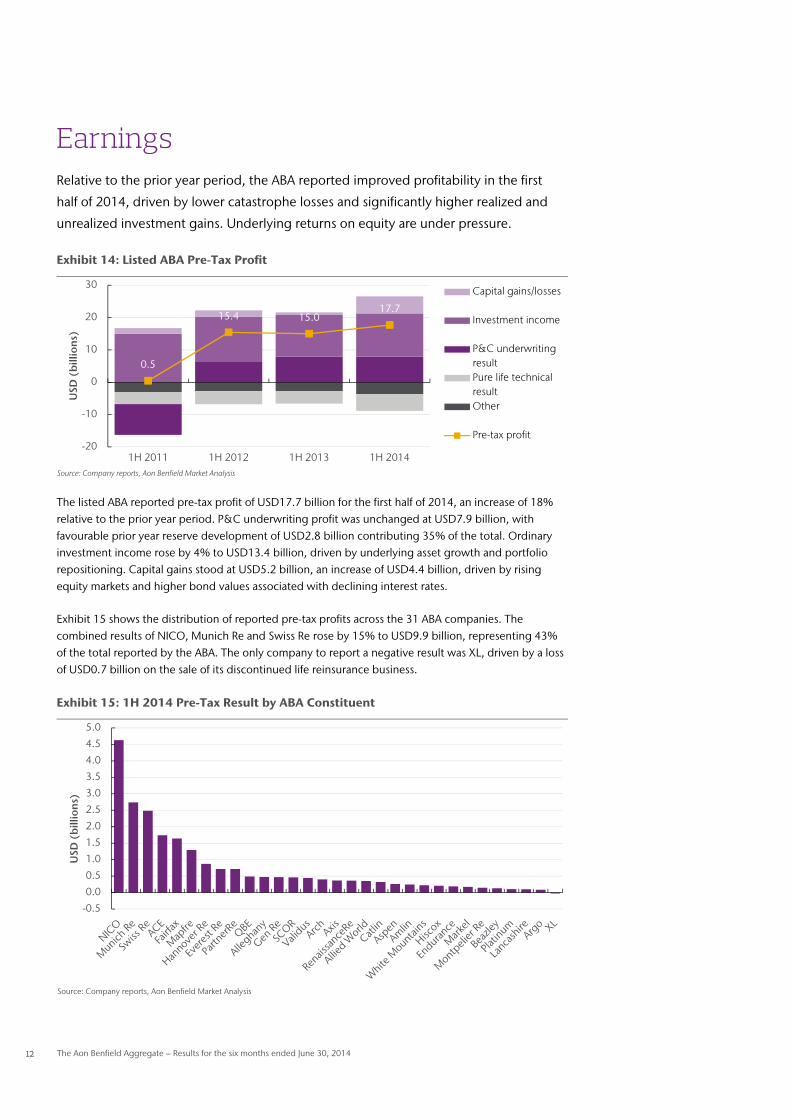
Earnings Relative to the prior year period, the ABA reported improved profitability in the first
half of 2014, driven by lower catastrophe losses and significantly higher realized and
unrealized investment gains. Underlying returns on equity are under pressure.
Exhibit 14: Listed ABA Pre-Tax Profit
Source: Company reports, Aon Benfield Market Analysis
The listed ABA reported pre-tax profit of USD17.7 billion for the first half of 2014, an increase of 18% relative to the prior year period. P&C underwriting profit was unchanged at USD7.9 billion, with favourable prior year reserve development of USD2.8 billion contributing 35% of the total. Ordinary investment income rose by 4% to USD13.4 billion, driven by underlying asset growth and portfolio repositioning. Capital gains stood at USD5.2 billion, an increase of USD4.4 billion, driven by rising equity markets and higher bond values associated with declining interest rates.
Exhibit 15 shows the distribution of reported pre-tax profits across the 31 ABA companies. The combined results of NICO, Munich Re and Swiss Re rose by 15% to USD9.9 billion, representing 43% of the total reported by the ABA. The only company to report a negative result was XL, driven by a loss of USD0.7 billion on the sale of its discontinued life reinsurance business.
Exhibit 15: 1H 2014 Pre-Tax Result by ABA Constituent
Source: Company reports, Aon Benfield Market Analysis
0.5
15.4 15.017.7
-20
-10
0
10
20
30
1H 2011 1H 2012 1H 2013 1H 2014
USD
(b
illio
ns)
Capital gains/losses
Investment income
P&C underwritingresultPure life technicalresultOther
Pre-tax profit
-0.5
0.0
0.5
1.0
1.5
2.0
2.5
3.0
3.5
4.0
4.5
5.0
USD
(b
illio
ns)

Aon Benfield Analytics | Market Analysis 13
Underwriting Performance The combined ratio of the listed ABA rose by 0.4 percentage points to 90.3% in the first half of 2014. Reported catastrophe losses were significantly reduced relative to the prior year period and well below the long-term average. Underlying trends were negative, as weakening pricing and business mix changes, particularly a shift towards longer-tail proportional contracts, impacted attritional loss and expense ratios. In addition, the support from the favourable development of prior year reserves was reduced, partly influenced by deterioration of the Costa Concordia loss.
Exhibit 16: Listed ABA Combined Ratio Composition
Source: Company reports, Aon Benfield Market Analysis
Exhibit 17 shows the distribution of reported combined ratios across the listed ABA for the first half of 2014. All of the constituents were profitable on a calendar year basis, although half of them reported weaker results.
Exhibit 17: 1H 2014 Calendar Year Combined Ratios
Source: Company reports, Aon Benfield Market Analysis *P&C reinsurance segment only (as disclosed) **Excluding funds withheld
-4.2% -2.9% -3.8% -3.5%
30.2% 30.7% 30.7% 31.4%
59.1% 59.6% 57.6% 58.8%
29.1%3.7% 5.4% 3.6%
114.1%
91.1% 89.9% 90.3%
-20%
0%
20%
40%
60%
80%
100%
120%
140%
1H 2011 1H 2012 1H 2013 1H 2014
Total catastrophelosses
Attritional loss ratio
Expense ratio
Prior year reserveadjustment
90.3%
0%
20%
40%
60%
80%
100%
120%Loss ratio Expense ratio Listed ABA combined ratio

14 The Aon Benfield Aggregate – Results for the six months ended June 30, 2014
Exhibit 18 shows the P&C underwriting results reported by the listed ABA companies. On a combined basis, Swiss Re, ACE and Munich Re contributed USD2.6 billion, or 33% of the total.
Exhibit 18: 1H 2014 P&C Underwriting Result by ABA Constituent
Source: Company reports, Aon Benfield Market Analysis
*P&C reinsurance segment only (as disclosed) **Excluding funds withheld
Exhibit 19 shows prior year reserve development as a percentage of net premiums earned by the listed ABA companies. Unchanged or modestly improved results were reported in 11 cases, while 14 companies reported lower releases, some of the reductions being material. Overall adverse reserve development was reported by QBE (Argentinian workers’ compensation), Hannover Re (Costa Concordia) and Lancashire (marine and energy).
Exhibit 19: Loss Reserve Adjustments as a Percentage of Net Premiums Earned
Source: Company reports, Aon Benfield Market Analysis *P&C reinsurance segment only (as disclosed) **No disclosure
***Excluding funds withheld
0
200
400
600
800
1,000
1,200
USD
(m
illio
ns)
-5%
0%
5%
10%
15%
20%
25%
30%
35%
40%1H 2014 1H 2013

Aon Benfield Analytics | Market Analysis 15
Exhibit 20 shows the reported accident year combined ratios of the listed ABA companies (excluding prior year reserve movements). Only Markel and PartnerRe were unprofitable on this basis.
Exhibit 20: 1H 2014 Accident Year Combined Ratios
Source: Company reports, Aon Benfield Market Analysis *P&C reinsurance segment only (as disclosed) **Excluding funds withheld
Investment Results The listed ABA reported cash and investments of USD939 billion at June 30, 2014, an increase of 2% relative to the end of 2013. Asset allocation was virtually unchanged and as follows: fixed-income 64%, cash and short-term 10%, loans 8%, deposits with cedants 6%, equities 5% and other 7%.
The underlying and total investment yields reported through income statements since 2006 are captured in Exhibit 21. The former has fallen by a third since 2007, reflecting the impact of the low interest rate environment.
Exhibit 21: Listed ABA Investment Yield (1H 2014 Annualized)
Source: Company reports, Aon Benfield Market Analysis *Reported through income statements, excluding unit-linked and with-profit business
93.8%
0%
20%
40%
60%
80%
100%
120%Listed ABA
4.9% 4.8%
1.9%
3.9%4.2%
3.7%3.9%
3.3%
4.0%
4.1%4.3%
3.9%3.7%
3.3% 3.4%3.0% 2.9% 2.9%
1%
2%
3%
4%
5%
6%
FY 2006 FY 2007 FY 2008 FY 2009 FY 2010 FY 2011 FY 2012 FY 2013 1H 2014
Total investment yield (incl. capital gains/losses)*
Underlying investment yield*

16 The Aon Benfield Aggregate – Results for the six months ended June 30, 2014
Exhibit 22 shows the annualized underlying and total investment yields reported by the ABA companies through their income statements in the first half of 2014. Investment classification varies and result comparison can therefore be misleading. Unrealized gains and losses are recognized in the income statements of some companies (e.g. PartnerRe, Fairfax and White Mountains), but in most other cases the majority are taken directly to equity.
Exhibit 22: Investment Yield by ABA Constituent (Annualized)
Source: Company reports, Aon Benfield Market Analysis *Reported through income statements, excluding unit-linked and with-profit business
Net Income The ABA companies reported net income attributable to common shareholders of USD18.4 billion for the first half of 2014, an increase of 15% relative to the prior year period. Net income across the listed ABA rose by 12% to USD14.0 billion.
Exhibit 23: ABA Common Net Income
Source: Company reports, Aon Benfield Market Analysis
0%
2%
4%
6%
8%
10%
12%
14%
16%Underlying investment yield*
Total investment yield*
12.2 12.4 14.0
2.2
2.9 3.64.4
2.5
15.116.0
18.4
0
5
10
15
20
1H 2011 1H 2012 1H 2013 1H 2014
USD
(b
illio
ns)
NICO & Gen Re
Listed ABA

Aon Benfield Analytics | Market Analysis 17
Exhibit 24 shows the distribution of net income attributable to common shareholders by ABA constituent. The combined results of NICO, Munich Re, Swiss Re and ACE rose by 10% to USD9.9 billion, representing 54% of the total. Investment classification varies and result comparison can therefore be misleading.
Exhibit 24: 1H 2014 Common Net Income / Loss by ABA Constituent
Source: Company reports, Aon Benfield Market Analysis
Return on Equity Exhibit 25 shows the development of net income attributable to common shareholders relative to average common shareholders’ funds across the ABA since 2006. Return on equity (ROE) across the listed ABA over this period (which encompasses both the financial crisis and the record year for insured catastrophe losses) averaged 11.3%.
Exhibit 25: ABA Common Net Income ROE (1H 2014 Annualized)
Source: Company reports, Aon Benfield Market Analysis
-0.5
0.0
0.5
1.0
1.5
2.0
2.5
3.0
3.5
4.0
4.5
USD
(b
illio
ns)
17.6%
16.6%
3.7%
14.1%
10.8%
4.4%
11.4% 11.1%12.2%
17.7%
15.3%
3.6%
12.5%10.7%
5.4% 10.1% 10.6% 10.8%
0%
5%
10%
15%
20%
FY 2006 FY 2007 FY 2008 FY 2009 FY 2010 FY 2011 FY 2012 FY 2013 1H 2014
Listed ABA
ABA

18 The Aon Benfield Aggregate – Results for the six months ended June 30, 2014
Exhibit 26 shows ROE based on reported net income by ABA constituent for the first half of 2014. Investment classification varies and result comparison can therefore be misleading. The three companies with the strongest results all report unrealized gains through their income statements.
Exhibit 26: 1H 2014 Common Net Income ROE by ABA Constituent (Annualized)
Source: Company reports, Aon Benfield Market Analysis
Pre-Tax Operating ROE The distortion caused by differing accounting treatment (and tax regimes) can be addressed by comparing pre-tax operating performance, eliminating realized and unrealized gains. On this basis, the ABA reported an annualized ROE of 9.0% for the first half of 2014, taking the average since 2006 to 11.8%. For the listed ABA, annualized ROE was 10.3% and the average since 2006 stood at 12.5%.
Exhibit 27: ABA Pre-Tax Operating ROE (1H 2014 Annualized)
Source: Company reports, Aon Benfield Market Analysis
Only nine ABA constituents reported improved performance on this measure in the first half of 2014 (see data in Appendix 1).
12.2%
-5%
0%
5%
10%
15%
20%
25%
30%
Listed ABA
18.0%
18.6% 16.8%15.9%
9.6%
3.4%
9.8% 10.3% 10.3%
18.2%
16.0%14.8% 15.4%
9.2% 4.9% 9.4% 9.6% 9.0%
0%
5%
10%
15%
20%
FY 2006 FY 2007 FY 2008 FY 2009 FY 2010 FY 2011 FY 2012 FY 2013 1H 2014
Listed ABA
ABA

Aon Benfield Analytics | Market Analysis 19
Exhibit 28: 1H 2014 Pre-Tax Operating ROE by ABA Constituent (Annualized)
Source: Company reports, Aon Benfield Market Analysis
Total Comprehensive Income ROE Another way to eliminate the distortion caused by differing accounting treatment is to compare total comprehensive income, including all realized and unrealized gains (whether reported through income statements or taken directly to equity). On this basis, the ABA reported annualized ROE of 16.0% for the first half of 2014, taking the average since 2006 to 11.7%. For the listed ABA, annualized ROE was 18.4% and the average since 2006 stood at 11.0%.
Exhibit 29: ABA Total Comprehensive Income ROE (1H 2014 Annualized)
Source: Company reports, Aon Benfield Market Analysis
Virtually all ABA constituents reported improved performance on this measure in the first half of 2014, as lower yields drove bond values higher.
Exhibit 30: 1H 2014 Total Comprehensive Income ROE (Annualized)
Source: Company reports, Aon Benfield Market Analysis
10.3%
-5%
0%
5%
10%
15%
20%Listed ABA
16.4%
14.5%
-10.3%
20.6%
13.4%
6.6%
14.1%
5.5%
18.4%19.1%
13.9%
-12.9%
22.1%
14.7%
6.7%
14.8%11.3%
16.0%
-15%
-5%
5%
15%
25%
FY 2006 FY 2007 FY 2008 FY 2009 FY 2010 FY 2011 FY 2012 FY 2013 1H 2014
Listed ABAABA
18.4%
0%
5%
10%
15%
20%
25%
30%Listed ABA
20 The Aon Benfield Aggregate – Results for the six months ended June 30, 2014
ABA Business Model Evolution A structural shift in the way capital is raised and
deployed to mitigate insurance risk is underway. The
pool of potential investors is broadening and new
money is flowing towards structures offering access to
quality business at relatively low cost. These changes
are forcing the ABA companies to re-evaluate their
business models.
Who Are The New Investors? Reinsurance as an asset class has performed relatively well in an environment of low interest rates and is viewed as having limited correlation with broader capital market movements. These attributes have attracted new investors such as pension funds, high net worth individuals and sovereign wealth funds, who typically:
only enter the sector after extensive due diligence;
invest a small percentage of the substantial assets at their disposal as a diversifying strategy;
seek lower, more stable returns over longer timeframes than has historically been the case.
How Is New Money Being Deployed? Much of the new capital is being channelled to specialist fund managers, who then deploy it into the insurance-linked securities (ILS) sector via products such as catastrophe bonds and industry loss warranties, or other ‘alternative’ structures such as sidecars and collateralized reinsurance. The current focus is property catastrophe and retrocession business, particularly in the US market where exposures tend to be best understood, although diversification into other lines and territories is underway.
Implications for ‘Traditional’ Reinsurers New vehicles operating at a lower cost of capital are making in-roads into higher-margin areas that remain a key driver of profits for ‘traditional’ reinsurers. These dynamics are forcing many ABA constituents to rethink their business models in the pursuit of differentiation and relevance in the market. In the catastrophe reinsurance space, this increasingly means being able to offer larger line sizes, a full product suite including collateralized limits and enhanced claims service. Companies that are successful in attracting and deploying third party capital will potentially be able to advance their client offering, reduce earnings volatility through fee income, lower their own risk transfer costs and manage their capital bases more effectively.
Convergence in Action A summary of recent convergence activity among the ABA companies is presented in Exhibit 31. Several are now actively involved in raising and managing third party capital. Others have invested in strategic partnerships with established independent specialist fund managers. Sidecar structures that allow sponsors to grow their footprint in the market without assuming additional balance sheet risk continue to be in vogue.
The availability of lower cost capital has allowed most ABA companies to drive down their own risk transfer costs. Retrocession pricing has reduced and in some cases additional protection has been purchased, with consequent impact on disclosed modeled exposures. In addition, a number of catastrophe bond transactions have recently been brought to the market by ABA sponsors.

Aon Benfield Analytics | Market Analysis 21
Exhibit 31: Recent Examples of Convergence Activity
Company Catastrophe Bonds Third Party Capital Vehicles Other
ACE Altair Re II formed with $95m of capital to provide collateralized support for ACE Tempest Re (Jan 2014).
Around 20% of a restructured global cat reinsurance program incepting Jul 1 was placed on a fully collateralized basis, without a reinstatement.
Alleghany Transatlantic ownership of Pillar Capital increased to 50% (Jun 2014). Operates an internal sidecar (Pangaea Re) and is exploring other facilities. TransRe Capital Partners under development.
Alleghany partnership with Ares Management effective Jul 2013. Investments in Pillar Capital and its managed funds totaled $220m at Jun 30.
Allied World Partnership with Aeolus Capital effective Dec 2012. Reported to be working on a new reinsurance venture with Pine River Capital.
A restructured cat program provides global aggregate cover (1st event $150m xs $300m; 2nd event $100m xs $100m). The entire program is placed on fully collateralized basis. The largest 1-in-250 PML (US wind) now represents 15.9% of total capital, down from 18.2% in Q1.
Amlin Tramline Re II (Jun 2013)
In Jul 2014, Amlin agreed to increase its ownership of Leadenhall Capital from 40% to 75% by 2016. SPS 6106 (2009-2013).
The 2014 retro program incorporates the discontinued SPS and has been placed with lower retentions at reduced cost. Tail risk is said to have increased only marginally.
Arch Co-sponsored Watford Re with asset manager Highbridge (Mar 2014). Arch conducts all the underwriting and invested $100m for an 11% stake in the holding company.
Watford Re wrote net premiums of $84m in 1H 2014, of which $69m was for Arch and $15m for third parties. Increased retro purchases reduced Arch's largest 250-year PML for a single event (North-East US wind) to 11% of common shareholders' equity at Jul 1.
Argo Loma Re (Dec 2013)
Renewed property insurance & reinsurance sidecar Harambee Re (Jan 2014).
Formed ILS fronting partnership with Horseshoe Re (Mar 2014).
Aspen Sidecar Silverton Re formed with $65m of capital ($50m from third parties) to provide collateralized quota share support to Aspen Re's property cat book (Jan 2014).
Aspen Capital Markets now has $135m of third party funds under management and has allowed Aspen to grow its cat business on a gross basis, while maintaining similar net exposures.
Axis Northshore Re (Aug 2013)
AXIS Re Ventures formed with $50m of third party capital to cater for investors interested in deploying funds directly into the property cat and related short tail reinsurance business (Jan 2014).
Additional retro purchased on the cat reinsurance book in Jun 2014. The peak 1-in-250 PML has reduced from 17.6% to 15.8% of total shareholders' equity.
Beazley SPS 6107 (since 2010).
Catlin Galileo Re (Oct 2013)
A 'Portfolio Participation Vehicle' provides collateralized reinsurance support for non-syndicate entities (Jan 2014). SPSs 2088, 6111, 6112 and 6119.
Catlin benefits from $300m of third party capital support in 2014, generating fees and commissions of $25m in 1H 2014. An additional $40m of retro cover has been purchased for the Florida book, replacing $100m of expiring ILW cover. Net PMLs have reduced by an average of 40% over the last two years.
Endurance Purchased $50m of additional global aggregate XL protection in Q2, taking total cover to $150m xs $100m. The peak 1-in-100 year PML reduced to 11.1% of shareholders' equity at Jul 1, 2014, from 12.8% a year earlier.
Everest Re Kilimanjaro Re (Apr 2014)
Permanent sidecar Mt. Logan Re (operating from Jul 2013) now provides around $400m of collateralized property cat capacity, third parties having injected a further $50m in Q2.
Everest Re is growing its property cat book, but has kept its net risk appetite stable in the past six months, by sponsoring its first cat bond (upscaled to $450m) and purchasing ILWs to hold its Florida PML steady.
Hannover Re
Multiple sponsor Structured Alamo Re obo TWIA (Jun 2014)
Multiple sidecar sponsor.
As part of its extended ILS activities, Hannover Re writes collateralized fronting arrangements, passing risks assumed from ceding companies on to institutional investors outside the group using structured entities. Hannover Re opened its internal ILS fund to third parties via Leine Investment from Jan 2013.
Hiscox Reinsurance sidecar Kiskadee Re is collateralized by third party investors and began operating in Jun 2013. SPS 6104 (since 2008).
Kiskadee Investment Managers deployed $110m of third party capital at Jan 1 and began seeking investors for two new funds. Hiscox Re enjoys growing support from quota share business partners. Partnership with Third Point (Oct 2012).
Lancashire Kinesis Re I Ltd (formed Jun 2013; Lancashire has a 10% equity interest) writes multi-class reinsurance business on a fully-collateralized basis, deploying ~$340m of limit in the year to Jul 1.
Kinesis Capital Management was formed in Jun 2013 to focus on the management of third party capital. Peak exposures have reduced across the board since Apr 2012. Substantially more limit was purchased for risk and cat covers in 2014.
Markel New Point Re VI commenced writing property retro business on a fully collateralized basis (Jan 2014), backed by $215m of capital.
Erik Manning (ex GC/Deutsche Bank) joined as Managing Director of Alternative Solutions at Markel Re in Jun 2014.
Montpelier Re
Collateralized property cat reinsurance via Blue Water Re and Blue Capital Re.
Blue Capital was launched in 2012 as an asset management platform offering a range of property cat-linked investment products to institutional and retail investors. GPW within the Collateralized Reinsurance segment rose by 71% in 1H 2014.
Munich Re Multiple structurer and sponsor
Sidecar Eden Re provides $63m of fully collateralized capacity to support the property cat book in 2014.
Munich Re has operated an internal ILS fund for 6+ years. Third party ILS transactions doubled to $1.2bn in 2013. Increased retro purchases in 2013 and 2014.
PartnerRe Sidecar Lorenz Re formed with $75m of third party capital to provide additional capacity for a diversified portfolio of cat reinsurance treaties over a multi-year period on a fully collateralized basis (Mar 2013).
Property cat exposures have been cut significantly over the past two years. Net limits deployed in respect of natural cat risk totalled $1.4bn at Jun 30, 2014, compared with a Board-approved limit of $2.3bn.
Platinum Purchased a $50m property cat aggregate cover in Q2, protecting the portfolio against higher return period events for all natural perils in the US, as well as Caribbean hurricanes, Japanese typhoons and Canadian earthquakes.
QBE VenTerra Re (Dec 2013)
RenRe Mona Lisa Re (Jul 2013)
Upsilon Re renewed with $280m of capital, targeting structured aggregate reinsurance and retro worldwide (Jan 2014).
Internal ILS fund Medici opened to third parties (Jun 2013). Purchased $180m of additional retro to protect peak Florida exposures in Q2. Stake in DaVinci reduced to 26.5% in 1H 2014.
SCOR Multiple sponsor Sidecar Atlas X ($55m of capital) provides 3 years of collateralized QS capacity to SCOR Global P&C’s property cat book (Jan 2014).
Alternative Solutions unit created in May 2014, following the formation of Atropos in 2011. Four ILS funds are offered to third party investors (~$300m of AuM at YE 2013).
Swiss Re Multiple structurer and sponsor
Sector Re sidecar series. No plans to open internal ILS fund to third parties.
Validus Collateralized property cat and retro underwritten via AlphaCat Re sidecar series ($204m of limit fully deployed in Jan 2014). Top layer cat written via PaCRe (owned 10% by Validus).
At Jun 30, AlphaCat had $1.5bn of AuM, split $0.3bn to Validus and $1.2bn to third-parties ($165m in the AlphaCat sidecars, $450m in the AlphaCat ILS funds and $575m in PaCRe). Reinsurance was purchased for AlphaCat in Q2.
White Mountains
Class 3 Bermudian insurer Alstead Re was formed to write collateralized reinsurance and retro business from Jan 2014.
Sirius Capital Markets, launched in May 2013, now operates from offices in Bermuda and New York.
XL Vector Re writes global property cat business on a collateralized basis from Jan 2014.
New Ocean Capital Management was established in partnership with Stone Point in Nov 2013. Vector Re's net assets were $89m at Jun 30.
Source: Company reports, Aon Benfield Market Analysis SPS = Special Purpose Syndicate; AuM = assets under management

22 The Aon Benfield Aggregate – Results for the six months ended June 30, 2014
ABA Valuation The overall market capitalization of the ABA companies has fallen by 4% since the beginning of 2014. The trailing
price-to-book ratio has deteriorated from 1.09x to 1.01x over the same period.
Exhibit 32: ABA Market Capitalization
Source: Bloomberg Note: As of August 29, 2014, excluding Berkshire Hathaway
Exhibit 33 shows the share price development of individual ABA companies since the beginning of 2014.
Exhibit 33: Year-to-Date Share Price Development
Source: Bloomberg Note: As of August 29, 2014
Exhibit 34: ABA Trailing Price-to-Book Ratio
Source: Bloomberg Note: As of August 29, 2014, excluding Berkshire Hathaway
Exhibit 35 shows the evolution of the trailing price-to-book values of individual ABA companies since the beginning of 2014.
Exhibit 35: Trailing Price-to-Book Ratios
Source: Bloomberg
40
60
80
100
120
140
Jan-08 Jan-10 Jan-12 Jan-14
-30% -20% -10% 0% 10% 20%
LancashireSCORCatlin
HiscoxMapfre
ArchMunich Re
ValidusAmlin
Allied WorldBeazley
EnduranceQBE
Hannover ReAxis
Swiss RePlatinum
ACEAspen
Everest ReWhite Mountains
RenaissanceRePartnerRe
XLAlleghany
Montpelier ReArgo
MarkelFairfax
0.6
0.7
0.8
0.9
1.0
1.1
1.2
1.3
Jan-08 Jan-10 Jan-12 Jan-14
0.0 0.5 1.0 1.5 2.0
SCORSwiss Re
CatlinXL
PartnerRePlatinum
AspenAxis
ValidusWhite Mountains
AlleghanyMontpelier Re
Munich ReEndurance
Allied WorldEverest Re
MapfreArgoACE
Hannover ReFairfax
RenaissanceReQBEArch
MarkelLancashire
AmlinHiscox
Beazley
January 1, 2014
August 29, 2014

Aon Benfield Analytics | Market Analysis 23
Financial Strength Ratings Several ABA companies have benefited from positive rating actions in 2014, as shown in Exhibit 36. However, all
four leading rating agencies now view the outlook for the reinsurance sector as negative, meaning that downgrades
are more likely than upgrades over the medium-term.
Exhibit 36: Financial Strength Ratings
Main Operating Company A.M. Best Standard & Poor’s
ACE Tempest Reinsurance Ltd A++ Stable AA Stable
Allied World Assurance Co Ltd A Stable A Stable
Amlin AG A Stable A Stable
Arch Reinsurance Ltd A+ Stable A+ Stable
Argo Re Ltd A Stable - -
Aspen Bermuda Ltd A Stable A Stable
AXIS Specialty Ltd A+ Stable A+ Stable
Beazley Insurance Company, Inc A Stable - -
Catlin Insurance Company Ltd A Stable A Stable
Endurance Specialty Insurance Ltd A Stable A Stable
Everest Reinsurance (Bermuda) Ltd A+ Stable A+ Stable
General Reinsurance Corporation A++ Stable AA+ Stable
Hannover Rück SE A+ Stable AA- Stable
Hiscox Insurance Company (Bermuda) Ltd A Stable - -
Lancashire Insurance Company Ltd A Stable A- Stable
MAPFRE Re, Compania de Reaseguros SA A Stable A Stable
Markel Bermuda Ltd A Stable A Stable
Montpelier Reinsurance Ltd A Stable A- Stable
Munich Reinsurance Co A+ Stable AA- Stable
National Indemnity Company A++ Stable AA+ Stable
Odyssey Reinsurance Company A Stable A- Stable
Partner Reinsurance Co Ltd A+ Stable A+ Stable
Platinum Underwriters Bermuda Ltd A Stable A- Stable
QBE Re (Europe) Ltd A Negative A+ Negative
Renaissance Reinsurance Ltd A+ Stable AA- Stable
SCOR Global P&C SE A Stable A+ Positive
Sirius International Insurance Corp A Stable A- Stable
Swiss Reinsurance Co A+ Stable AA- Stable
Transatlantic Reinsurance Co A Positive A+ Stable
Validus Reinsurance Ltd A Stable A Stable
XL Re Ltd A Stable A+ Stable
Source: A.M. Best, Standard & Poor’s Upgrade / outlook raised since January 1, 2014
Downgrade / outlook lowered since January 1, 2014
Ratings as at September 2014

24 The Aon Benfield Aggregate – Results for the six months ended June 30, 2014
Appendix 1: ABA Data Exhibit 37: Results for the six months ended June 30, 2014
Company
Reporting Currency (millions)
P&C Gross Premiums
Written1H 2013
P&C Gross Premiums
Written1H 2014 Change
P&C Net Premiums
Earned 1H 2013
P&C Net Premiums
Earned1H 2014 Change
Listed Groups
ACE USD 9,953 10,332 4% 6,683 7,328 10%
Alleghany USD 2,578 2,693 4% 2,143 2,153 0%
Allied World USD 1,602 1,662 4% 970 1,068 10%
Amlin GBP 1,839 1,891 3% 1,062 1,118 5%
Arch USD 2,204 2,567 16% 1,512 1,767 17%
Argo USD 980 983 0% 632 662 5%
Aspen USD 1,461 1,635 12% 1,055 1,183 12%
Axis USD 2,966 3,053 3% 1,820 1,946 7%
Beazley USD 1,067 1,078 1% 759 805 6%
Catlin USD 3,299 3,660 11% 1,913 2,038 7%
Endurance USD 1,750 1,847 6% 963 878 -9%
Everest Re USD 2,441 2,683 10% 2,240 2,417 8%
Fairfax USD 3,597 3,837 7% 2,877 2,917 1%
Hannover Re EUR 4,097 4,078 0% 3,404 3,370 -1%
Hiscox GBP 1,018 979 -4% 629 643 2%
Lancashire USD 424 635 50% 261 361 39%
Mapfre EUR 8,665 8,623 0% 6,568 6,416 -2%
Markel USD 1,844 2,703 47% 1,349 1,915 42%
Montpelier Re USD 504 513 2% 299 319 7%
Munich Re1 EUR 8,533 8,478 -1% 8,066 8,028 0%
PartnerRe USD 2,607 2,719 4% 1,899 2,034 7%
Platinum USD 283 261 -8% 270 251 -7%
QBE USD 9,446 8,491 -10% 7,333 6,947 -5%
RenaissanceRe USD 1,339 1,217 -9% 563 547 -3%
SCOR EUR 2,378 2,400 1% 2,115 2,059 -3%
Swiss Re USD 11,538 11,809 2% 8,003 9,044 13%
Validus USD 1,807 1,668 -8% 1,079 949 -12%
White Mountains USD 1,261 1,373 9% 993 997 0%
XL USD 4,349 4,540 4% 2,953 2,851 -3%
ABA (Listed Sector) USD 104,803 109,075 4% 77,644 81,562 5%
Gen Re USD 485 578 19% 276 279 1%
NICO USD 3,572 18,217 410% 3,129 14,753 372%
ABA (Total) USD 108,860 127,871 17% 81,050 96,594 19% Source: Company reports, Aon Benfield Market Analysis Figures in reporting currencies, but converted to USD (millions) for ABA lines
1P&C reinsurance segment only (as disclosed)

Aon Benfield Analytics | Market Analysis 25
Exhibit 37: Results for the six months ended June 30, 2014 (cont’d)
Calendar Year
Company Loss Ratio
1H 2013 Loss Ratio
1H 2014
Expense Ratio
1H 2013
Expense Ratio
1H 2014
Combined Ratio
1H 2013
Combined Ratio
1H 2014 Change
Listed Groups
ACE 58.0% 58.0% 30.1% 30.2% 88.1% 88.2% 0.2pp
Alleghany 56.8% 57.6% 31.0% 31.8% 87.9% 89.4% 1.5pp
Allied World 54.6% 55.3% 29.3% 29.8% 84.0% 85.1% 1.2pp
Amlin 53.1% 53.7% 31.9% 33.3% 85.0% 87.0% 2.1pp
Arch 54.1% 52.2% 31.9% 33.5% 86.0% 85.7% -0.4pp
Argo 58.4% 55.5% 40.4% 40.1% 98.8% 95.7% -3.2pp
Aspen 57.1% 52.9% 36.6% 36.0% 93.7% 88.8% -4.9pp
Axis 59.4% 57.0% 33.3% 34.3% 92.7% 91.3% -1.4pp
Beazley 52.0% 51.0% 37.0% 39.0% 89.0% 90.0% 1.0pp
Catlin 54.6% 50.6% 33.5% 34.4% 88.1% 85.0% -3.2pp
Endurance 60.0% 49.7% 30.2% 35.4% 90.2% 85.0% -5.2pp
Everest Re 58.2% 56.1% 26.0% 26.4% 84.2% 82.5% -1.7pp
Fairfax 62.3% 60.5% 31.8% 32.3% 94.1% 92.8% -1.2pp
Hannover Re1 68.6% 69.2% 26.0% 26.1% 94.6% 95.3% 0.7pp
Hiscox3 37.5% 38.5% 37.2% 43.5% 74.7% 82.0% 7.3pp
Lancashire 23.5% 34.5% 35.3% 36.1% 58.8% 70.6% 11.8pp
Mapfre 67.2% 67.9% 27.9% 27.8% 95.1% 95.7% 0.6pp
Markel 54.1% 60.2% 43.9% 37.7% 98.0% 97.9% -0.1pp
Montpelier Re 32.6% 29.4% 32.9% 34.4% 65.5% 63.8% -1.7pp
Munich Re2 62.9% 63.5% 29.6% 30.7% 92.5% 94.2% 1.7pp
PartnerRe 61.4% 57.3% 28.6% 30.5% 90.0% 87.8% -2.2pp
Platinum 28.4% 30.8% 32.3% 32.7% 60.7% 63.5% 2.8pp
QBE 59.4% 63.1% 33.3% 33.4% 92.8% 96.5% 3.7pp
RenaissanceRe 23.3% 25.7% 25.8% 28.5% 49.1% 54.1% 5.0pp
SCOR 64.5% 60.4% 29.7% 30.5% 94.3% 90.9% -3.4pp
Swiss Re 55.8% 56.4% 30.2% 31.2% 86.0% 87.6% 1.6pp
Validus 38.0% 33.9% 31.7% 34.6% 69.7% 68.5% -1.2pp
White Mountains 52.3% 51.4% 34.0% 35.8% 86.3% 87.2% 0.9pp
XL 60.3% 58.2% 30.5% 30.8% 90.8% 89.0% -1.7pp
ABA (Listed Sector) 59.2% 59.0% 30.7% 31.4% 89.9% 90.3% 0.5pp
Gen Re3 53.9% 38.2% 41.0% 41.7% 94.9% 79.9% -14.9pp
NICO3 42.9% 84.0% 25.4% 13.1% 68.3% 97.1% 28.8pp
ABA (Total) 58.5% 62.7% 30.5% 28.6% 89.0% 91.4% 2.3pp Source: Company reports, Aon Benfield Market Analysis
1Excluding funds withheld 2P&C reinsurance segment only (as disclosed)
3As calculated by Aon Benfield Market Analysis

26 The Aon Benfield Aggregate – Results for the six months ended June 30, 2014
Exhibit 37: Results for the six months ended June 30, 2014 (cont’d)
Accident Year
Company
Prior Year Reserve
Adjustment 1H 2013
Prior Year Reserve
Adjustment1H 2014
Prior Year Reserve
Adjustment as % of NPE1H 2013
Prior Year Reserve
Adjustment as % of NPE1H 2014
Accident Year Combined
Ratio 1H 2013
Accident Year Combined
Ratio1H 2014 Change
Listed Groups
ACE -198 -188 3.0% 2.6% 91.0% 90.8% -0.2pp
Alleghany -134 -102 6.2% 4.7% 94.1% 94.1% 0.0pp
Allied World -92 -94 9.5% 8.8% 93.5% 93.9% 0.4pp
Amlin -61 -40 5.8% 3.6% 90.8% 90.6% -0.1pp
Arch -124 -176 8.2% 9.9% 94.2% 95.6% 1.4pp
Argo -17 -23 2.7% 3.5% 101.6% 99.2% -2.4pp
Aspen -54 -60 5.1% 5.1% 98.8% 93.9% -4.9pp
Axis -97 -129 5.3% 6.6% 98.0% 98.0% 0.0pp
Beazley -61 -73 8.0% 9.1% 97.0% 99.1% 2.1pp
Catlin -56 -49 2.9% 2.4% 91.0% 87.4% -3.7pp
Endurance -113 -105 11.8% 11.9% 102.0% 96.9% -5.1pp
Everest Re -1 -3 0.0% 0.1% 84.3% 82.6% -1.6pp
Fairfax -142 -131 4.9% 4.5% 99.0% 97.3% -1.7pp
Hannover Re1 0 33 0.0% -1.0% 94.6% 94.3% -0.3pp
Hiscox -74 -90 11.7% 14.0% 86.4% 96.0% 9.6pp
Lancashire -7 2 2.8% -0.5% 61.7% 70.1% 8.5pp
Mapfre n.d. n.d. n.d. n.d. n.d. n.d. n.d.
Markel -204 -167 15.1% 8.7% 113.1% 106.6% -6.5pp
Montpelier Re -66 -73 22.1% 22.8% 87.7% 86.6% -1.1pp
Munich Re2 -250 -320 3.1% 4.0% 95.6% 98.2% 2.6pp
PartnerRe -310 -325 16.3% 16.0% 106.3% 103.7% -2.6pp
Platinum -99 -76 36.6% 30.1% 97.3% 93.6% -3.7pp
QBE 178 131 -2.4% -1.9% 90.3% 94.6% 4.3pp
RenaissanceRe -64 -34 11.4% 6.2% 60.6% 60.3% -0.3pp
SCOR -31 0 1.5% 0.0% 95.7% 90.9% -4.9pp
Swiss Re -445 -296 5.6% 3.3% 91.6% 90.9% -0.7pp
Validus -107 -112 9.9% 11.8% 79.6% 80.3% 0.7pp
White Mountains -14 -7 1.4% 0.7% 87.7% 87.9% 0.2pp
XL -150 -123 5.1% 4.3% 95.8% 93.4% -2.5pp
ABA (Listed Sector) -2,955 -2,822 3.8% 3.5% 93.7% 93.8% 0.1pp
Gen Re3 -70 -60 25.5% 21.5% 120.3% 101.5% -18.9pp
NICO3 -652 -314 20.8% 2.1% 89.1% 99.3% 10.1pp
ABA (Total) -3,677 -3,196 4.5% 3.3% 93.6% 94.7% 1.1pp Source: Company reports, Aon Benfield Market Analysis Figures in reporting currencies, but converted to USD (millions) for ABA lines n.d. = not disclosed
1Excluding funds withheld 2P&C reinsurance segment only (as disclosed)
3As calculated by Aon Benfield Market Analysis

Aon Benfield Analytics | Market Analysis 27
Exhibit 37: Results for the six months ended June 30, 2014 (cont’d)
Company
Net
Investment Income
1H 2013
Net Investment
Income1H 2014
Capital Gains / Losses
1H 2013
Capital Gains / Losses
1H 2014
Total Investment
Return 1H 2013
Total Investment
Return1H 2014 Change
Listed Groups
ACE 1,065 1,109 310 -177 1,375 932 -32%
Alleghany 219 225 37 132 256 357 39%
Allied World 71 84 -36 139 35 224 531%
Amlin 24 25 37 51 61 76 24%
Arch 159 152 53 56 212 208 -2%
Argo 53 44 21 30 74 74 0%
Aspen 94 96 9 45 103 141 37%
Axis 192 198 43 57 235 254 8%
Beazley 29 27 -29 20 0 47 n.m.
Catlin 54 63 -45 79 9 142 n.m.
Endurance 82 80 16 6 98 86 -12%
Everest Re 295 254 161 80 455 335 -27%
Fairfax 258 254 -97 1,656 161 1,910 n.m.
Hannover Re 650 619 39 88 689 708 3%
Hiscox 21 20 1 9 22 29 33%
Lancashire 23 16 12 -4 35 12 -64%
Mapfre 768 1,013 41 58 809 1,071 32%
Markel 143 179 29 25 172 203 18%
Montpelier Re 33 25 -62 43 -29 68 n.m.
Munich Re1 3,522 3,330 18 982 3,540 4,312 22%
PartnerRe 248 247 -276 308 -28 555 n.m.
Platinum 36 35 23 -1 59 34 -43%
QBE 330 339 29 89 359 428 19%
RenaissanceRe 79 85 -55 42 24 127 435%
SCOR 216 240 -7 48 209 288 38%
Swiss Re1 1,948 2,119 516 509 2,464 2,628 7%
Validus 55 51 -143 113 -88 163 n.m.
White Mountains 57 53 38 178 95 231 143%
XL 558 498 77 100 635 598 -6%
ABA (Listed Sector) 12,921 13,441 809 5,235 13,730 18,676 36%
Gen Re 512 445 40 -35 552 410 -26%
NICO 2,967 2,996 -20 1,653 2,946 4,649 58%
ABA (Total) 16,399 16,882 829 6,853 17,228 23,735 38% Source: Company reports, Aon Benfield Market Analysis Figures in reporting currencies, but converted to USD (millions) for ABA lines n.m. = not meaningful
1Reported through income statements, excluding unit-linked and with-profit business

28 The Aon Benfield Aggregate – Results for the six months ended June 30, 2014
Exhibit 37: Results for the six months ended June 30, 2014 (cont’d)
Company
Pre-Tax Result
1H 2013
Pre-Tax Result
1H 2014 Change
Pre-Tax Operating ROE*
1H 2013
Pre-Tax Operating ROE*
1H 2014 Change
Listed Groups
ACE 2,081 1,739 -16% 12.9% 13.0% 0.0pp
Alleghany 400 471 18% 11.3% 9.4% -1.8pp
Allied World 158 352 122% 11.6% 11.8% 0.2pp
Amlin 160 147 -9% 15.6% 11.4% -4.2pp
Arch 443 402 -9% 15.0% 10.9% -4.1pp
Argo 80 87 9% 8.0% 7.2% -0.7pp
Aspen 139 261 88% 7.7% 12.6% 4.9pp
Axis 401 364 -9% 12.6% 10.4% -2.2pp
Beazley 82 133 61% 18.8% 17.3% -1.4pp
Catlin 145 318 119% 10.9% 12.4% 1.5pp
Endurance 165 188 14% 10.9% 12.1% 1.2pp
Everest Re 792 717 -9% 18.9% 17.3% -1.7pp
Fairfax -195 1,643 n.m. -2.3% -0.3% 1.9pp
Hannover Re 630 635 1% 18.3% 16.1% -2.2pp
Hiscox 181 125 -31% 26.1% 16.9% -9.2pp
Lancashire 137 99 -28% 18.9% 13.9% -5.0pp
Mapfre 866 942 9% 16.2% 17.2% 0.9pp
Markel 163 170 4% 5.2% 4.2% -1.0pp
Montpelier Re 73 147 101% 16.4% 11.0% -5.4pp
Munich Re 1,902 1,999 5% 14.2% 7.5% -6.6pp
PartnerRe 23 716 n.m. 9.0% 11.9% 2.9pp
Platinum 146 106 -27% 13.5% 12.2% -1.3pp
QBE 585 487 -17% 9.8% 7.3% -2.5pp
RenaissanceRe 272 362 33% 14.6% 13.0% -1.7pp
SCOR 237 336 42% 10.2% 11.4% 1.1pp
Swiss Re 2,600 2,486 -4% 13.0% 11.9% -1.1pp
Validus 183 443 142% 15.2% 15.2% -0.1pp
White Mountains 155 221 42% 5.6% 1.9% -3.6pp
XL 671 -29 n.m. 10.3% -2.3% -12.6pp
ABA (Listed Sector) 15,002 17,699 18% 12.5% 10.3% -2.2pp
Gen Re 568 468 -18% 10.2% 8.5% -1.6pp
NICO 3,445 4,633 34% 8.3% 6.1% -2.3pp
ABA (Total) 19,015 22,799 20% 11.3% 9.0% -2.3pp Source: Company reports, Aon Benfield Market Analysis Figures in reporting currencies, but converted to USD (millions) for ABA lines n.m. = not meaningful
*Calculated by excluding the impact of net realized and unrealized investment gains/losses reported through income statements

Aon Benfield Analytics | Market Analysis 29
Exhibit 37: Results for the six months ended June 30, 2014 (cont’d)
Company
Common Net Income
1H 2013
Common Net Income
1H 2014 Change
Return on Equity*
1H 2013
Return on Equity*
1H 2014 Change
Listed Groups
ACE 1,844 1,513 -18% 13.5% 10.2% -3.2pp
Alleghany 310 354 14% 9.6% 9.9% 0.3pp
Allied World 157 329 109% 9.4% 18.3% 8.9pp
Amlin 140 136 -3% 17.8% 16.3% -1.6pp
Arch 422 380 -10% 17.3% 13.5% -3.8pp
Argo 64 79 22% 8.6% 9.9% 1.3pp
Aspen 115 232 101% 8.1% 16.2% 8.1pp
Axis 375 328 -13% 14.7% 12.5% -2.2pp
Beazley 72 114 58% 12.2% 17.5% 5.3pp
Catlin 118 273 131% 8.1% 16.7% 8.5pp
Endurance 145 171 18% 12.6% 13.3% 0.7pp
Everest Re 660 584 -11% 19.8% 16.3% -3.4pp
Fairfax -27 1,119 n.m. -0.7% 29.1% 29.8pp
Hannover Re 423 444 5% 14.6% 14.5% -0.1pp
Hiscox 158 120 -24% 23.0% 17.5% -5.5pp
Lancashire 134 105 -22% 20.2% 14.2% -6.1pp
Mapfre 456 458 0% 11.6% 11.2% -0.4pp
Markel 117 128 10% 4.6% 3.7% -0.9pp
Montpelier Re 65 127 96% 8.9% 16.9% 7.9pp
Munich Re 1,491 1,684 13% 11.3% 12.6% 1.3pp
PartnerRe 20 553 2643% 0.7% 18.6% 17.9pp
Platinum 136 100 -27% 15.0% 11.3% -3.6pp
QBE 477 392 -18% 8.5% 7.3% -1.2pp
RenaissanceRe 217 272 25% 13.9% 15.7% 1.8pp
SCOR 189 256 35% 8.0% 10.2% 2.2pp
Swiss Re 2,166 2,028 -6% 13.5% 12.2% -1.3pp
Validus 254 316 24% 13.3% 16.9% 3.6pp
White Mountains 147 191 30% 7.9% 9.5% 1.6pp
XL 623 -24 n.m. 12.2% -0.5% -12.7pp
ABA (Listed Sector) 12,435 13,988 12.5% 11.6% 12.2% 0.6pp
Gen Re 539 355 -34% 10.4% 6.0% -4.3pp
NICO 3,029 4,060 34% 7.3% 8.2% 0.9pp
ABA (Total) 16,004 18,403 15% 10.4% 10.8% 0.5pp Source: Company reports, Aon Benfield Market Analysis Figures in reporting currencies, but converted to USD (millions) for ABA lines n.m. = not meaningful
*Common net income as a percentage of average common equity

30 The Aon Benfield Aggregate – Results for the six months ended June 30, 2014
Exhibit 37: Results for the six months ended June 30, 2014 (cont’d)
Company
Cash and Investments
FY 2013
Cash and Investments
1H 2014 Change
Shareholders’ Funds
FY 2013
Shareholders’ Funds
1H 2014 Change
Listed Groups
ACE 61,977 64,684 4% 28,825 30,325 5%
Alleghany 19,490 19,683 1% 6,924 7,398 7%
Allied World 9,026 9,205 2% 3,520 3,683 5%
Amlin 4,510 4,401 -2% 1,678 1,670 0%
Arch 14,050 16,111 15% 5,647 6,229 10%
Argo 4,237 4,184 -1% 1,563 1,633 4%
Aspen 8,300 8,653 4% 3,300 3,554 8%
Axis 14,768 15,678 6% 5,818 5,956 2%
Beazley 4,430 4,387 -1% 1,339 1,262 -6%
Catlin 9,209 9,286 1% 3,783 3,954 5%
Endurance 6,575 6,755 3% 2,887 3,116 8%
Everest Re 16,824 17,868 6% 6,968 7,323 5%
Fairfax 24,893 26,413 6% 8,353 9,361 12%
Hannover Re 46,149 47,080 2% 5,888 6,412 9%
Hiscox 3,157 3,026 -4% 1,409 1,332 -6%
Lancashire 2,484 2,529 2% 1,460 1,504 3%
Mapfre 40,133 43,637 9% 7,834 8,485 8%
Markel 17,612 18,236 4% 6,674 7,143 7%
Montpelier Re 3,306 3,426 4% 1,642 1,668 2%
Munich Re1 203,556 211,000 4% 25,983 27,422 6%
PartnerRe 18,274 18,326 0% 6,710 6,910 3%
Platinum 3,612 3,517 -3% 1,747 1,778 2%
QBE 30,632 31,373 2% 10,356 11,228 8%
RenaissanceRe 7,230 7,001 -3% 3,904 3,836 -2%
SCOR 23,755 23,776 0% 4,940 5,110 3%
Swiss Re1 143,332 145,392 1% 32,952 33,628 2%
Validus 8,110 8,135 0% 3,704 3,777 2%
White Mountains 8,003 8,001 0% 3,906 4,106 5%
XL 36,192 31,896 -12% 9,998 10,034 0%
ABA (Listed Sector) 917,848 939,108 2% 228,672 239,480 5%
Gen Re 15,810 16,085 2% 11,562 12,020 4%
NICO 148,939 161,943 9% 97,226 99,765 3%
ABA (Total) 1,082,597 1,117,137 3% 337,460 351,264 4% Source: Company reports, Aon Benfield Market Analysis Figures in reporting currencies, but converted to USD (millions) for ABA lines
1Excluding unit-linked and with-profit business

Aon Benfield Analytics | Market Analysis 31
Contacts
Mike Van Slooten
Head of Market Analysis - International Aon Benfield Analytics +44.207.7522.8106 [email protected]
Mike McClane
Head of Market Analysis - Americas Aon Benfield Analytics +1.215.751.1596 [email protected]
Jonny Eggins
Analyst Market Analysis - International Aon Benfield Analytics +44.207.7522.3898 [email protected]
Marie Teissier
Analyst Market Analysis - International Aon Benfield Analytics +44.207.7522.3951 [email protected]
Eleanore Obst
Analyst Market Analysis - International Aon Benfield Analytics +44.207.7522.3823 [email protected]
Aon UK Limited trading as Aon Benfield (for itself and on behalf of each subsidiary company of Aon Plc) (“Aon Benfield”) reserves all rights to the content of this report. This document is intended as a courtesy to the recipient for general information and marketing purposes only and should not be construed as giving advice or opinions of any kind (including but not limited to insurance, tax, regulatory or legal advice). The contents of this document are based on publicly available information and/or third party sources in respect of which Aon Benfield has no control and which have not necessarily been verified. The content of this document is made available without warranty of any kind and without any other assurance whatsoever as to its completeness or accuracy. Aon Benfield disclaims any legal or other liability to any person or organization or any other recipient of this document (together a "Recipient") for loss or damage caused by or resulting from any reliance placed on this document or its contents by such Recipient.
Best's Credit Ratings are under continuous review and subject to change and/or affirmation. For the latest Best’s Credit Ratings and Best’s Credit Reports (which include Best’s Credit Ratings), visit the A.M. Best website at http://www.ambest.com. See Guide to Best’s Credit Ratings for explanation of use and charges. Best's Credit Ratings reproduced herein appear under license from A.M. Best and do not constitute, either expressly or impliedly, an endorsement of (Licensee's publication or service) or its recommendations, formulas, criteria or comparisons to any other ratings, rating scales or rating organizations which are published or referenced herein. A.M. Best is not responsible for transcription errors made in presenting Best's Credit Ratings. Best’s Credit Ratings are proprietary and may not be reproduced or distributed without the express written permission of A.M. Best Company. A Best’s Financial Strength Rating opinion addresses the relative ability of an insurer to meet its ongoing insurance obligations. It is not a warranty of a company’s financial strength and ability to meet its obligations to policyholders. View our Important Notice: Best's Credit Ratings for a disclaimer notice and complete details at http://www.ambest.com/ratings/notice.

About Aon
Aon plc (NYSE:AON) is the leading global provider of risk management, insurance and reinsurance brokerage, and human resources solutions and outsourcing services. Through its more than 66,000 colleagues worldwide, Aon unites to empower results for clients in over 120 countries via innovative and effective risk and people solutions and through industry-leading global resources and technical expertise. Aon has been named repeatedly as the world’s best broker, best insurance intermediary, best reinsurance intermediary, best captives manager, and best employee benefits consulting firm by multiple industry sources. Visit aon.com for more information on Aon and aon.com/manchesterunited to learn about Aon’s global partnership with Manchester United.
About Aon Benfield
Aon Benfield, a division of Aon plc, is the world’s leading reinsurance intermediary and full-service capital advisor. We empower our clients to better understand, manage and transfer risk through innovative solutions and personalized access to all forms of global reinsurance capital across treaty, facultative and capital markets. As a trusted advocate, we deliver local reach to the world’s markets, an unparalleled investment in innovative analytics, including catastrophe management, actuarial and rating agency advisory. Through our professionals’ expertise and experience, we advise clients in making optimal capital choices that will empower results and improve operational effectiveness for their business. With more than 80 offices in 50 countries, our worldwide client base has access to the broadest portfolio of integrated capital solutions and services. To learn how Aon Benfield helps empower results, please visit aonbenfield.com.