the anatomy of the cds market - columbia business school · pdf filethe anatomy of the cds...
TRANSCRIPT
The Anatomy of the CDS Market ∗
Martin Oehmke†
Columbia University
Adam Zawadowski‡
Central European University
April 25, 2016
Abstract
Using novel position and trading data for single-name corporate credit default swaps (CDSs), we
provide evidence that CDS markets emerge as “alternative trading venues” that serve a standardiza-
tion and liquidity role. CDS positions and trading volume are larger for firms with bonds that are
fragmented into many separate issues and have heterogeneous contractual terms. Whereas hedging
motives are associated with trading volume in the bond and CDS markets, speculative trading con-
centrates in the CDS. Cross-market arbitrage links the CDS and bond market via the basis trade,
compressing the negative CDS-bond basis and reducing price impact in the bond market.
∗We would like to thank the DTCC for providing the data used in this research. For comments and suggestions, weare grateful to three anonymous referees, Viral Acharya, Tobias Berg, Andras Danis, Merritt Fox, Larry Glosten, ValentinHaddad, Jing-Zhi Huang, Andrew Karolyi (the editor), Dino Palazzo, Or Shachar, Kumar Sivakumar, Rene Stulz, RaghuSundaram, and Suresh Sundaresan. We also thank conference participants at the Econometric Society 2012 Winter Meeting(Chicago), European Finance Association 2012 Annual Meeting (Copenhagen), ESSFM 2012 (Gerzensee), American Eco-nomic Association 2013 Annual Meeting (San Diego), the Oxford/Columbia Conference on Derivatives Regulation after theCrisis, the 2013 Five Star Conference at NYU, and the 3rd Annual ITAM Finance Conference, as well as seminar participantsat the Bank of England, Boston University, Central European University, FGV Sao Paolo, UNC, University of Houston, CUBoulder, UT Dallas, Goethe Universitat Frankfurt, and the Frankfurt School of Finance and Management. We thank theProgram for Financial Studies at Columbia University for support, and Adam Laiacano, Aditya Dugar, Shyam Iyer, and TimScully for assistance with the data.†Columbia Business School, 420 Uris Hall, 3022 Broadway, New York, NY 10027, e-mail: [email protected],
http://www0.gsb.columbia.edu/faculty/moehmke‡Central European University, Nador u. 9., 1051 Budapest, Hungary, e-mail: [email protected], http://www.personal.ceu.
edu/staff/Adam_Zawadowski/

Th market for credit default swaps (CDSs) has grown from an exotic niche market to a large and
active venue for credit risk transfer—making it one of the most significant financial innovations of the
last decades.1 Concurrently, CDS markets have become the subject of a number of policy debates,
including their role in the recent financial crisis (Stulz, 2010), their impact on the debtor-creditor
relationship (Hu and Black, 2008; Bolton and Oehmke, 2011), as well as firms’ costs of capital, financing
choices, and credit risk (Ashcraft and Santos, 2009; Saretto and Tookes, 2013; Subrahmanyam et al.,
2014).
However, despite their growing importance, relatively little is known about the motivations that
determine trading and positions in CDS markets. This paper aims to fill this void: Using newly
available, disaggregated data on single-name CDS positions and trading volume, we investigate the
motivations for trading in CDS markets and, more broadly, the economic function these markets
perform.
Our evidence suggests that CDS markets are “alternative trading venues” for hedging and specu-
lation. CDS markets are larger when the reference entity’s bonds are fragmented into many separate
issues, suggesting a standardization and liquidity role of CDS markets: While investors can usually
make the same economic trade in the underlying bond, the CDS market is attractive because trading
frictions in the CDS market are smaller than in the underlying bond. This interpretation is sup-
ported by the finding that bond fragmentation is associated with both higher trading costs and lower
turnover in the underlying reference bonds. We also show that, whereas hedging motives are reflected
to a comparable extent in bond and CDS trading volume, speculative trading, which is likely to be
more sensitive to the relative liquidity advantage of the CDS market, concentrates in the CDS market.
Finally, we document arbitrage activity that links the CDS and the bond market via the basis trade.
We provide evidence that basis traders compress the negative bond basis and, by acting as absorbers
of bond supply shocks, reduce price impact in the bond market.
1In a CDS, a protection seller agrees to make a payment to the protection buyer in the case of a credit event on a prespecifiedreference entity. In exchange for this promised payment, the protection seller receives a periodic premium payment (andpotentially an upfront payment) from the protection buyer. Credit events usually include bankruptcy, non-payment of debt,and, in some CDS contracts, debt restructuring.
1

The data underlying our analysis are newly-available CDS market statistics on net notional CDS
amounts and CDS trading volume for individual reference entities from the Depository Trust & Clear-
ing Corporation (DTCC). Because the DTCC provides disaggregated information at the reference
entity level, the data allows a much more detailed investigation of motivations of trading in the CDS
market than was previously possible. In our analysis, we focus on net notional CDS positions on
individual reference entities, which is calculated as the sum of net protection bought (or sold) by
counterparties that are net buyers (sellers) of protection for a particular reference entity. Intuitively
speaking, the net notional amount captures the stock of credit risk that is transferred via the CDS
market. In addition to the stock of credit risk transferred, we also investigate the flow of credit risk
by examining trading volume in the CDS market and the underlying reference bonds.
We first provide evidence consistent with the view that CDSs are being used as instruments for
hedging. Specifically, we show that firms that have more bonds outstanding also have larger net
notional CDS positions. This positive relation between insurable interest and net notional amounts in
the CDS market indicates that at least some market participants use the CDS market to hedge their
bond exposure. Our baseline estimate of 7.77 cents of net CDS positions per dollar of outstanding
bonds suggests that this hedging role is economically significant: A move from the 25th to the 75th
percentile in bonds outstanding is associated with a 31.9% increase in CDS positions for the median
firm. While non-bond debt (e.g., bank loans) is generally not associated with larger net notional
CDS positions, some other proxies for insurable interest are. For example, net notional CDS positions
are larger for firms that provide credit guarantees (e.g., monoline insurers) or have large amounts of
accounts payable and therefore represent counterparty risk to other market participants. Turning to
trading volume in the bond and CDS markets, we document a similar pattern in the sense that hedging
motives are associated with comparable amounts of trading volume in the bond and the CDS market
(8.62 cents on the dollar in monthly trading volume in the bond market, 2.83 cents on the dollar
in the CDS market in our the baseline specification). Taken together, the documented link between
2

insurable interest and net notional CDS amounts suggests that at least some market participants use
the CDS market to hedge their debt, bond, or counterparty exposure.
Second, we document that proxies for speculative trading motives are associated with larger net
CDS positions. Specifically, we show that disagreement about a reference entity’s future earnings
prospects (as measured by analyst earnings forecast dispersion) is associated with larger net notional
CDS amounts, in an economically significant way: A one-standard deviation increase in disagreement
is associated with an 18% increase in net notional CDS positions for the median firm in our baseline
specification. This indicates that, in addition to hedging, investors use the CDS market to speculate by
taking views on the default probabilities of traded reference entities. Interestingly, trading in response
to speculative motives seems to occur almost exclusively in the CDS market, not in the underlying
bonds: A one-standard deviation increase in disagreement is associated with 43.1% more CDS trading
for the median firm, but no more trading (of statistical or economic significance) in the underlying
bond. This finding is consistent with the view that speculators, who generally have shorter trading
horizons, value the liquidity advantage of the CDS and thus take short-term views in the CDS market.
While taken together these results suggest that both hedging and speculation are determinants of
CDS positions, they do not explain why investors choose to trade in the CDS market as opposed to
trading directly in the underlying bond. This leads to the main finding of our paper, which suggests
that CDS markets serve a standardization role: Holding constant the amount of bonds outstanding
and speculative trading motives, net notional CDS amounts are larger for firms with bonds that are
fragmented into many separate issues, as proxied by a Herfindahl index of bond issues. Above-median
bond fragmentation is associated with $272m more in net notional CDS positions, an increase of
33% relative to the median firm. Similarly, when we replace bond fragmentation with a more direct
measure of contractual heterogeneity among bond issues, we find that firms whose bond issues exhibit
more heterogeneity in contractual terms (e.g., callable, puttable, etc.) haver larger net notional CDS
positions. Contractual heterogeneity across bonds is associated with $291m more in net notional CDS
positions, an increase of 36% relative to the median firm. The same pattern emerges when looking at
3

trading volume. Bond fragmentation and contractual heterogeneity among bond issues are associated
with more trading volume in the associated CDS and less trading in the underlying bond. Taken
together, these findings lend strong support to the view that CDS markets serve a standardization
role: CDS markets, which are relatively standardized, are attractive precisely when the underlying
bonds are fragmented and have heterogeneous contractual terms.
What is the mechanism through which the standardized nature of the CDS market attracts in-
vestors? Here, our evidence suggests that this mechanism is related to liquidity. Specifically, we show
that higher bond fragmentation and contractual heterogeneity among bond issues are associated with
higher roundtrip trading costs and lower turnover in the underlying bonds. This result echoes the
view, commonly held among bond market practitioners, that the fragmentation of the corporate bond
market impedes its liquidity, thereby generating potential benefits from standardization (BlackRock,
2013). Our evidence suggests that, in the absence of more standardized bonds, the CDS market can
step in to provide a standardized trading venue for credit risk.
Finally, we provide evidence that net notional CDS positions reflect arbitrage between the bond
and CDS markets. In particular, net notional CDS positions are increasing in the negative CDS-bond
basis, a measure of price differences between the underlying bond and the CDS. When the CDS-bond
basis is negative (as it has been for many reference entities since the financial crisis), the underlying
bond is cheap relative to a synthetic bond formed out of a CDS and a risk-free bond. This situation
gives rise to the so-called negative basis trade, in which a trader purchases the bond and buys CDS
protection to exploit the relative price difference between the bond and CDS markets. Consistent
with the predictions of the equilibrium model of Oehmke and Zawadowski (2015), we show that CDS
positions are increasing in the negative basis, particularly when funding conditions for basis traders
are favorable. This result suggests that arbitrageurs use CDSs to lean against the negative CDS-bond
basis—an interpretation that is supported by the finding that the effect is larger during times when
funding conditions for arbitrageurs are better. The presence of basis traders has major economic
implications, because it affects pricing in the bond and CDS market: First, we show that the CDS-
4

bond basis is, on average, less negative when basis traders are active. Second, we show that, by acting
as absorbers of supply shocks, the presence of levered basis traders reduces price impact in bond
market. These positive effects of CDSs complement the results of Saretto and Tookes (2013), who
document that the presence of CDSs allows firms to borrow more and at longer maturities.
To our knowledge, this is the first comprehensive study of CDS positions and trading volume at the
reference entity level. While our analysis is largely descriptive, the goal of the paper is to provide a set
of descriptive results and tests that lay a foundation for future theoretical and empirical work on CDS
markets. A few other recent empirical studies have investigated CDS positions or transaction volume,
but are mostly based on less disaggregated data or shorter sample periods. Stulz (2010) provides a
number of summary statistics based on aggregate position data from the DTCC and survey data from
the Bank for International Settlements (BIS), which were the main source of position information
before the DTCC data became available. Using three months of confidential trading data, Chen
et al. (2011) document relatively low unconditional trading volume in CDSs, with spikes in trading
around credit events. Consistent with the standardization function of CDS markets documented in
this paper, they show that trading in CDS markets concentrates in the more standardized contracts
that conform with the industry’s “big bang” protocol change. Shachar (2011) uses transaction level
data to investigate price effects of traded volume, order imbalances and dealer inventories in the CDS
market. In addition, a number of recent papers investigate the CDS-bond basis (Blanco et al., 2005;
Bai and Collin-Dufresne, 2013; Nashikkar et al., 2011; Fontana, 2011). Our paper contributes to this
literature by linking the CDS-bond basis to quantities in the CDS market.2
2More broadly, our paper relates to a growing literature that investigates the effects of CDS markets on informationtransmission, risk transfer, and credit market outcomes (Acharya and Johnson (2007), Qiu and Yu (2012), Minton et al.(2009), Ashcraft and Santos (2009), Hirtle (2009), and Saretto and Tookes (2013)), as well as a growing theory literature onthe uses of CDSs (Duffee and Zhou (2001), Parlour and Plantin (2008), Thompson (2009), Parlour and Winton (2013), Boltonand Oehmke (2011), Zawadowski (2013), Atkeson et al. (2015), Che and Sethi (2014), Fostel and Geanakoplos (2012), andOehmke and Zawadowski (2015)). Du and Zhu (2013), Gupta and Sundaram (2012), and Chernov et al. (2013) investigateCDS settlement auctions.
5

1 Empirical Hypotheses
Taken together, the theory literature on credit default swaps suggests several economic motives for
trading in the CDS market. We distill these motives into four main hypotheses. These hypotheses
should be seen as broadly guiding our empirical analysis and allowing us to perform a number of
descriptive tests that shed light on trading patterns in the CDS market. In particular, because of lack
of natural experiments we are generally not able to identify causal effects. The aim of this paper is
therefore to provide a set of descriptive results that can lay a foundation for future theoretical and
empirical work on CDS markets.
First, to the extent that CDSs are used for hedging, insurable interest should play a role in
determining net notional CDS amounts and CDS trading volume. For example, in a setting in which
some fraction of investors insure their bond holdings, more bonds outstanding (i.e., larger insurable
interest) is naturally associated with larger net notional CDSs amounts and, potentially, more trading
volume in the CDS. Note that, whereas hedging demand is naturally related to insurable interest,
there is no reason to believe that speculative trading activity (i.e., bets on future changes in credit
quality) in the CDS market should be directly related to insurable interest.
Second, investors may use CDS contracts as speculative vehicles in order to express views about a
reference entity’s default prospects, even if they do not own the bond or have other exposure to the
reference entity (see, for example, Fostel and Geanakoplos, 2012; Che and Sethi, 2014). To the extent
that CDSs are used as speculative instruments, reference entities on which investors’ beliefs differ
more should have larger outstanding CDS positions than reference entities with less disagreement. To
the extent that speculative bets represent short-term views, they should also be associated with more
CDS trading volume.
Third, because investors can choose between trading in the CDS market or directly in the under-
lying bond, CDS markets should be more attractive when there are frictions in the market for the
underlying bonds. One of the main differences between bonds and CDSs is their level of standard-
6

ization: While different bond issues usually differ significantly in their contractual terms (covenants,
callability features, coupon, etc.), CDS are standardized products that generally follow a set of stan-
dardized contractual terms set forth in the ISDA protocol (see, for example BlackRock, 2013). The
larger this standardization advantage of the CDS, the more attractive the CDS market should be for
investors.
Fourth, CDS positions could be driven by arbitrage activity. No arbitrage implies that a long
position in a bond hedged with the appropriate CDS should earn (approximately) the risk-free rate
(Duffie, 1999). Deviations from this no-arbitrage relationship should be associated with larger net CDS
positions, as arbitrageurs attempt to exploit these deviations through the basis trade. For example,
if insuring the bond in the CDS market is cheap relative to the default premium offered by the bond
(a negative basis), arbitrageurs will enter a negative basis trade where they purchase the bond and
CDS protection, thereby increasing the amount of CDSs outstanding. Here we base our hypotheses
on the theoretical framework of Oehmke and Zawadowski (2015), who show that in equilibrium such
arbitrage trades lead to a positive correlation between a more negative CDS-bond basis (due to bond
illiquidity or bond supply shocks) and the size of CDS positions taken by arbitrageurs. Their model
also predicts that stronger arbitrage activity influences economic outcomes, by compressing the CDS-
bond basis and reducing price impact in the bond market. (We develop more detailed hypotheses
regarding the CDS-bond basis in Section 4.)
2 Data and Summary Statistics
Our data on CDS positions and CDS trading comes from the Trade Information Warehouse of the
Depository Trust & Clearing Corporation (DTCC).3 The position and trading data from the DTCC
3The DTCC provides clearing, settlement and trade confirmation in a number of markets, such as equities, corporateand municipal bonds, and over-the-counter derivatives. In the CDS market, the DTCC provides trade processing and traderegistration services. All major dealers register their standard CDS trades with the DTCC. The DTCC then enters thesetrades into a Trade Information Warehouse (TIW). The data is available on the DTCC’s website at www.dtcc.com/repository-otc-data.aspx.
7

capture almost the entire market for standard single-name CDSs. According to the DTCC (2009), their
data capture around 95% of globally traded CDSs, making it the most accurate and comprehensive
publicly available dataset for CDS positions and trading.4
Weekly CDS position data is available from October 31, 2008 in Table 6 of Section I of the DTCC
data. In its weekly reports on outstanding CDS positions, the DTCC discloses both the aggregate
gross notional as well as the aggregate net notional amounts outstanding on a particular reference
entity, where “notional” refers to the par amount of credit protection that is bought or sold. In
our analysis, we focus on the net notional amount, because it provides a more meaningful measure
of the amount of credit risk transferred in the CDS market: The net notional amount outstanding
adjusts the gross notional amount5 for offsetting positions in order to better reflect the actual amount
of credit risk transferred in the CDS market. Specifically, the DTCC calculates the net notional
amount outstanding as the sum of net protection bought by counterparties that are net buyers of
protection for a particular reference entity (or equivalently, as the sum of net protection sold by all
counterparties that are net sellers of protection for a particular reference entity). Intuitively, one can
thus interpret the net notional amount outstanding as the maximum amount of payments that need to
be made between counterparties in the case of a credit event on a particular reference entity.6 Figure
1 provides a simple example to illustrate the difference between gross notional and net notional.
4Prior to the release of position data by the DTCC, the main source of information about position sizes in the CDS marketwas the survey data from the BIS available at www.bis.org/statistics/derstats.htm. Relative to the DTCC data, the BISdata has a number of disadvantages. First, the BIS data only provides aggregate market statistics, while the DTCC dataprovides positioning at the reference entity level. Second, the BIS data is based on surveys as opposed to actual registeredpositions in the market. Third, because of its survey-based nature, the BIS data is prone to double counting: The same CDStransaction may be reported both by the buyer and the seller to the transaction, resulting in a double count.
5The gross notional amount outstanding is simply the sum of all notional CDS contracts on a given reference entity. Thegross notional amount thus reflects the total par amount of credit protection bought (or equivalently sold). It is defined aseither the sum of all long or, equivalently, the sum of all short CDS contracts outstanding. With the exception of occasionalcompression trades, in which offsetting CDS positions are eliminated, the gross notional amount outstanding increases withevery trade. The gross notional position increases even if a trade offsets an existing trade and thus reduces the overall amountof credit risk transfer in the CDS market. This makes the gross notional amount outstanding a very imprecise proxy for theamount of credit risk that is transferred in the CDS market.
6It is the maximum amount of payments, because actual payments will usually be less than the par value of the CDS,reflecting non-zero recovery rates on the defaulted bonds as well as previous marking-to-market by counterparties.
8

Weekly CDS trading data is available starting July 16, 2010 in Section IVa of the DTCC data.
These data capture all trades recorded with the DTCC that constitute market risk activity, which
means that trades are recorded only if they result in a transfer of credit risk among market participants
(this includes, for example, new trades, the termination of existing transactions, assignment of an
existing transactions to a third party etc.). Trades that do not transfer risk are excluded (for example,
the clearing of existing bilateral trades by central counterparties, portfolio compression trades, and
backloaded trades). The resulting measure of CDS trading volume is therefore directly comparable to
trading volume in the underlying bond.
Our sample is comprised of public U.S. (parent) companies in Compustat that are traded reference
entities in the CDS market. We define existence of a CDS market as having at least 3 CDS dealers
that provide quotes on a 5-year CDS in the Markit data and/or being one of the top 1,000 reference
entities in the DTCC data (we hand-match Compustat firms to DTCC and Markit). We assume that
once a CDS market exists for a reference entity, it continues to exist for the remainder of our sample.
We include only firms which, in a given month, have at least one bond registered with the SEC and are
rated by S&P (in order to control for credit quality). We also restrict our sample to public companies
with at least 2 analysts to be able to control for disagreement. As data sources, we rely on Compustat
(balance sheet data, credit ratings, and industry codes), Mergent FISD (data on outstanding bonds),
TRACE Enhanced7 (bond trading data), CRSP (stock price data), IBES (earnings forecasts), and
Markit (CDS spreads). A detailed description of our sample construction and matching procedures
can be found in Appendix A. We provide all variable definitions in Table 1.
Our final sample has 496 firms, out of which 302 appear in the DTCC data at least once during
our sample period. We can calculate the CDS-bond basis for 123 of these companies, 97 of which
appear in the DTCC data. We use monthly data as most controls, such as ratings and disagreement,
7TRACE Enhanced is preferable to TRACE because it contains transaction information, such as trade size, that is notalways available in TRACE (for example, TRACE does not contain trade sizes for large trades). TRACE Enhanced alsoincludes transactions that at the time of trading were not subject to reporting (for example, trades in non-investment gradecorporate bonds. Using TRACE Enhanced (rather than TRACE) therefore allows us to more accurately calculate bondturnover and bond trading costs.
9

are only available on a monthly basis. Altogether the time series length of our baseline sample on net
notional CDS is 52 months: October 2008 to December 2012. The length of the CDS trading data is
somewhat shorter; these data are available for 29 months from August 2010 to December 2012.
Table 1 provides summary statistics for our baseline sample of firms that are traded reference
entities in the CDS market. Overall, we have data on gross and net notional CDS positions for
13,441 firm-month observations. For those firms, the mean net notional CDS amount is given by
$1.035bn. The mean gross notional amount of CDS outstanding on a reference entity in our sample is
$13.13bn. The corresponding medians are $817m and $9.914bn, respectively. Hence, netting within
counterparties on average reduces the amount of CDS outstanding by a factor of more than ten.
Firms in our sample have median assets of $10.63bn and $1.798bn of outstanding bonds. For firms
in DTCC, normalizing the amount of CDS protection bought or sold by the total amount of bonds the
reference entity has outstanding, we find that the median net notional amount of CDS as a fraction of
bonds outstanding is equal to 26.1% of bonds when looking at bonds issued directly by that firm and
18.2% when we consolidate bonds to also include bonds issued by subsidiaries. The 90th percentiles
given by 113.8% and 85.9%, respectively. One interesting observation is that, while these numbers
suggest that significant amounts of credit risk are transferred through the CDS market, the data do not
confirm the conventional wisdom that the amounts outstanding in CDS markets usually vastly exceed
insurable interest (at least not when looking at the economically more meaningful quantity of net
protection bought or sold). For most firms, net notional CDS amounts outstanding are significantly
less than bonds outstanding.8
Figure 2 plots the evolution of total net notional CDS amounts over time. The top solid line
depicts the total amount of net CDS outstanding on all single-name reference entities captured by the
DTCC. This is essentially the entire single-name CDS market. As the figure illustrates, since the fall
8Nonetheless, there are some firms for which the amount of net notional of CDS outstanding significantly exceeds theamount of bonds the firm has outstanding. A typical example are potential buyout targets (with low current debt, butpotentially large future debt), such as the clothing retailer Gap and the electronics distributer Arrow Electronics. Othertypes of companies with high net CDS amounts as a fraction of outstanding bonds are homebuilders, mortgage insurers andsuppliers for the automobile industry.
10

of 2008 net notional CDS amounts have decreased by about 35%. Nonetheless, aggregate net notional
in the single-name CDS market is still substantial at around $1tn at the end of 2012.9 The dashed line
depicts the total net notional CDS protection written on the top 1,000 single-name entities. Comparing
this line to the total single-name CDS market demonstrates that the top 1,000 reference entities
make up a large fraction of the overall single-name CDS market, at least when measured in terms of
net notional (in addition to firms, this includes sovereigns, states, and municipalities). Finally, the
dotted line plots the total net notional CDS amounts for our final sample. After dropping sovereigns,
states, municipalities, non-U.S. companies, non-rated companies, and other reference entities that we
cannot match to Compustat, our sample still constitutes a significant fraction of the total single-name
corporate CDS market.
Monthly turnover in the CDS market (trading volume divided by net notional CDS positions) is on
average 50.6% (median 43.7%) and therefore substantially higher than bond turnover, which amounts
to 7.16% for the average firm (median 4.62%). Note that this observation in itself lends preliminary
support to our hypothesis that the CDS market is attractive because it is more liquid than the
associated bond market. Figure 3 plots monthly trading volume in CDSs and the underlying bonds in
our sample. As discussed above, trading volume for CDSs only includes trades that represent market
risk transfer (i.e., trades that change the allocation of credit risk among market participants) and is
available starting August 2010. The plot shows that for traded reference entities monthly trading
volume in the CDS market (solid line) is comparable in size to trading volume in the associated bonds
(dashed line). However, bond turnover is much smaller than CDS turnover because on average the
amount of bonds outstanding is larger than the associated net notional CDS positions. Bonds of
9The decrease in net CDS positions does not necessarily imply that the CDS market has become less relevant over time.In particular, the DTCC data suggests that the downward trend in net CDS positions is primarily due to a decrease ininterdealer positions, whereas customer positions have increased. Although net notional CDS positions are not available bythe counterparty type, Table 1 in Section I of the DTCC TIW reports the gross positions by counterparty type. Over of oursample period, gross interdealer positions in single name CDSs decreased from $12.68tn to $9.23tn. At the same time, grossCDS positions bought by customers (non-dealers) from dealers increased from $1.43tn to $2.04tn, and gross CDS positionssold by customers to dealers increased from $1.26tn to $2.06tn.
11

companies that are not in the DTCC sample have significantly lower bond trading volume (dotted
line).
3 CDSs as Alternative Trading Venues
In this section, we investigate the determinants of net notional CDS positions as well as trading volume
in the CDS and bond markets. The main empirical result is that, controlling for hedging needs and
speculative trading demand, net notional CDS positions and CDS trading volume are larger for firms
whose bonds are fragmented into many separate issues and have heterogeneous contractual terms. We
then provide evidence that these results reflect the economic role of the CDS market as an alternative
trading venue that circumvents trading frictions in the underlying corporate bond market.
3.1 Measures of CDS demand and bond market frictions
Tables 2 and 3 contain our baseline specifications that investigate the determinants of net notional
CDS positions and CDS and bond trading volume, respectively. In both tables, we are interested in
hedging and speculation motives as determinants of CDS positions, as well as the role of frictions in the
underlying bond market. We proxy for hedging motives with the amount of bonds that is outstanding,
which captures insurable interest. We proxy for speculative trading motives using analyst forecast
dispersion normalized by the stock price (disagreement) for the underlying company. To examine
the role of trading frictions in the bond market, we focus on one of the main differences between
bonds and CDSs: Whereas the CDS is a standardized contract with a standard set of contractual
features and standardized maturities, a firm’s bonds are usually split into a number of different issues
with different maturities, coupons, covenants, and embedded options. Since the “big bang” protocol
change of April 2009, CDSs also trade with standardized coupons and standardized accruals, further
increasing standardization.
12

We construct two measures of the relative standardization advantage of CDSs. The first is based
on the fragmentation of a firm’s bonds into separate issues. Specifically, we calculate a Herfindahl
index of bond issues for every firm in our sample.10 We then take the natural logarithm of the
Herfindahl in order to improve the distributional properties of the measure and adjust the measure
for the mechanical relationship between total issuance and the number of bond issues (firms that have
more bonds outstanding usually also have more separate bond issues). We do this by regressing the log
Herfindahl on the log of bonds outstanding of the firm. Our measure of bond fragmentation is given
by the residual of this regression. Finally, we multiply this measure by minus one, such that a higher
value of bond fragmentation means just that. The resulting bond fragmentation measure therefore
captures the fragmentation of a firm’s bond issues controlling for the overall amount of bonds that a
firm has outstanding. Our results are similar when we use a Herfindahl index that is not adjusted for
the amount of bonds bonds a firm has outstanding.
This bond fragmentation measure is attractive for a number of reasons. First, it captures one of
the first-order differences between bonds and CDSs. Whereas a firm’s bonds are usually fragmented
into a number of different issues with different contractual terms, the CDS is a standardized contract.
Therefore, the more fragmented and diverse a company’s bonds, the more attractive the CDS market
should become as a venue for trading credit risk. Second, unlike other common measures of trading
frictions, bond fragmentation is likely to be (relatively) exogenous to CDS trading: It is unlikely that
managers choose the fragmentation of their bond issues to affect CDS trading on their bonds. Bond
fragmentation is therefore a more attractive right hand side variable than direct measures of bond
trading costs, which are usually highly endogenous. Third, while measures of liquidity that rely on
trading costs or trading volume confound the effects of the ease of trading (i.e., how easy is it to trade
10This is done by summing, for each firm i, the squared shares that each bond issue j represents of the overall amount ofbonds firm i has outstanding:
Hi =
N∑j=1
(bi,jBi
)2
,
where bi,j denotes the dollar amount of bond issue j of firm i, and Bi =∑
j bi,j denotes the total dollar amount of bondsthat firm i has outstanding. For example, a firm that has issued $1bn in bonds as one unified issue would have a Herfindahlof one, whereas a firm that has issued the same amount but in five separate issues would have a Herfindahl of 0.2.
13

the bond?) and the demand for trading (i.e., how strong are market participants’ motives to trade?),
the fragmentation of a reference entity’s bonds is likely to be less affected by demand for trading and
therefore provides a cleaner measure of how easy it is to trade the bonds.
On the other hand, one shortcoming of the bond fragmentation measure is that, while suggestive
of a standardization role of CDSs, it does not directly measure contractual heterogeneity among bonds
that the CDS serves to standardize. We therefore construct a second measure of standardization based
directly on the heterogeneity of contractual features among bond issues of a given firm. Specifically,
Mergent FISD provides dummy variable information on whether a particular bond is (i) puttable,
(ii) callable, (iii) convertible, (iv) has a fixed coupon, (v) has covenants, and (vi) is subject to credit
enhancement. We construct a contractual heterogeneity dummy which takes the value 0 for those
firms for which all the above contractual features are the same across all issues and takes the value
1 for all other firms (i.e. for firms that have at least some heterogeneity in contractual features).
The advantage of the contractual heterogeneity measure is that it captures directly the difference of
contractual terms across bond issues and therefore allows us to draw sharper conclusions regarding
a potential standardization role of CDS markets. The slight disadvantage of this measure is that
contractual features of a particular bond issue are measured relatively imprecisely: Mergent FISD
only provides dummy variables as to whether certain contractual features are present in a particular
bond issue.
3.2 Determinants of net notional CDS positions
Table 2 shows the results of our baseline regression of net notional CDS amounts on proxies for
insurable interest and speculative trading demand, as well as bond fragmentation and contractual
heterogeneity. The regression specification is
NetCDSi,t = β ·Xi,t + εi,t, (1)
14
where the vector X contains explanatory variables (our proxies for hedging and speculation as well as
measures of bond fragmentation and contractual heterogeneity), a set of controls, and a constant, and
ε is an error term. Note that controls include credit quality proxied by S&P rating dummies. Note
that we do not scale net CDS by assets. The reason is that neither net CDS nor the trading motives
(e.g., speculation or the basis trade) scale naturally with assets or bonds outstanding. Because the
DTCC provides net notional amounts only for the top 1,000 reference entities, our data is subject to a
censoring problem. In particular, for traded reference entities that do not appear in the 1,000 largest
reference entities provided by the DTCC we know that the CDS amount is positive but lies below
the 1,000th largest reference entity. Because of this, estimates from a simple OLS estimation would
be biased. We therefore run a maximum likelihood estimation that takes account of the censoring in
the data. To mitigate the effect of outliers, we allow the error term to scale with bonds outstanding.
Finally, because of autocorrelation of our regressors, we cluster standard errors at the firm level. The
econometric details of our estimation procedure can be found in Appendix B.
Table 2 shows that, across a number of different specifications, both insurable interest and specu-
lative trading demand are significant determinants of net CDS positions: First, the positive coefficient
on bonds outstanding, significant at the 1% in most specifications, demonstrates that insurable in-
terest is a significant determinant of the net notional positions in the CDS market. This finding
supports the view that at least some traders in the CDS market use CDS to hedge bond exposure.
Quantitatively, the coefficient of 0.0777 in the regression of column (1) that controls for ratings and
includes time and industry fixed effects implies that for each additional dollar in bonds outstanding,
net CDS positions are on average 7.77 cents larger. To gauge the economic magnitude of this effect,
note that in our sample, a move from the 25th to the 75th percentile in terms of bonds outstanding
is associated with an increase in net notional CDS positions of $261m, which raises the net notional
for the median firm (which has $817m in net notional CDS) by about 31.9%.11 When we include firm
11In our sample, the 25th percentile of bonds outstanding is $800m and the 75th percentile $4.15bn. For insurable interest,we use percentiles to gauge economic significance because bonds outstanding is strongly positively skewed. A one-standarddeviation increase in bonds outstanding is associated with a $984m increase in net notional CDS amounts.
15

fixed effects in column (2), the magnitude of the effect is smaller and no longer statistically significant,
but at 1.38 cents on the dollar remains economically significant.12
In addition to bonds outstanding (arguably the most natural proxy for insurable interest because
CDSs directly reference a firm’s bonds), specifications (3) and (4) control for firm size and a number
of additional proxies for insurable interest that may capture relevant hedging motives in the CDS
market. Three observations emerge. First, including other types of debt we find that it is bonds
that matter for CDS positions. Bonds are not simply a proxy for other types of debt or the size of
the firm. In column (3), we add total assets of a firm as an explanatory variable and find it both
economically and statistically insignificant at 0.093 cents per dollar of assets. More importantly, bonds
outstanding is almost unchanged compared to column (1) and remains statistically and economically
significant. Column (4) includes bonds of subsidiaries and other non-bond debt. The coefficient on
bonds of subsidiaries is statistically insignificant and economically small. While other borrowing is
statistically significant, it is negative, which might be due to the fact that it is calculated as a residual
quantity. Most importantly, the coefficient on bonds outstanding remains of similar magnitude and
significant. The evidence is therefore consistent with the hypothesis that CDSs are mainly used to
insure bonds and not other types debt, such as bank loans and debt of the subsidiaries.13 Second,
the large positive and statistically significant coefficient on the dummy variable credit enhancement in
column (4) reflects that there is a large amount of net notional CDS protection written on companies
that provide credit enhancement (e.g., monoline insurers): Firms that provide credit enhancement
12Given our relatively short time series and the fact that, at the firm level, neither the amount of bonds outstanding nornet notional CDS positions vary much over time, it is not surprising that the effect is weaker when we include firm fixedeffects. It is reassuring, however, that even with firm fixed effects the result remains economically significant. In the tradingvolume regression below, where there is more time-series variation, bonds outstanding remains significant even with firm fixedeffects. Finally, note that the sample size drops when we include firm fixed effects. The reason is that in order to identifythe firm fixed effect, a firm has to be observed in the DTCC data at least once. Hence, we lose firms that have traded CDScontracts but are not part of the DTCC position data.
13This finding is perhaps not all that surprising given that CDS directly references a company’s bonds. Recovery ratesfor other types of debt (e.g., loans) differ from those of bonds, such that a CDS is a less precise hedge. There is a separatemarket for loan credit default swaps (LCDSs), but according to the DTCC data this market is very small. For example, inDecember 2011, the net amount of LCDSs registered with the DTCC was $7.2 billion for US companies and $1.1 billion forEuropean companies, compared to regular net CDS of $1.1 trillion.
16

on average have an additional $2bn in net notional CDS positions outstanding.14 This suggests that
investors who rely on insurance from monoline insurance companies and other providers of credit
enhancement purchase CDSs in order to eliminate their counterparty risk, as in Zawadowski (2013).
In these cases, the protection provided by credit enhancement firms represents an insurable interest
that purchasers of this insurance may want to hedge in the CDS market. Third, net notional CDS
amounts tend to be larger for firms with large amounts of accounts payable (by 2.02 cents per dollar
of accounts payable), suggesting that trade creditors use the CDS market to hedge exposures to their
trading partners. These findings corroborate the role of insurable interest as a determinant of net
notional CDS positions. We provide further robustness checks using additional hedging proxies and
controls in Table 8 in the online appendix.
Second, to investigate the role of speculation, Table 2 includes analyst earnings disagreement
as a proxy for speculative trading demand. The rationale for this proxy is that the more traders
disagree on a firm’s earnings prospects, the more they may want to take views on credit risk because
disagreement about default probabilities should naturally be related to disagreement about earnings.
Our disagreement measure divides earnings-per-share forecast dispersion by the share price.15 This
measure can be interpreted as the size of the firm’s equity cushion relative to disagreement on earnings
(one attractive feature of this measure is that, by dividing through the equity cushion, it automatically
adjusts for the firm’s leverage). We find that, across all specifications, higher analyst disagreement
is associated with more net CDS outstanding for traded reference entities, mostly significant at the
1% level. Based on the baseline specification in column (1), which includes ratings controls and time
and industry fixed effects, a one standard-deviation increase in earnings disagreement is associated
with an increase in the net notional CDS amount of $146m, which corresponds to 18% of the median
net notional CDS amount. When controlling for firm fixed effects (column (2)), the magnitude of the
14The list of companies we categorized as providing credit enhancement are: AMBAC, MBIA, Primus Guaranty, TriadGuaranty, Assured Guaranty, XL Group, Radian Group, ACE, Berkshire Hathaway, PMI Group, AIG.
15We use IBES earnings analyst forecasts on two-year earnings per share to calculate the measure of disagreement. Wedivide the standard deviation of forecasts by the CRSP stock price if the stock price is above one dollar and set it to missing(and thus excluded from the sample) otherwise.
17
coefficient is smaller but still statistically significant at the 5% level. In Table 9 in the online appendix
we show that these results continue to hold when using the ratio of CDS trading to bond trading as
an alternative proxy for disagreement.
Third, consistent with the hypothesis that CDS markets are attractive when there are trading
frictions in the underlying bonds, Table 2 shows that the fragmentation of a firm’s bonds into separate
issues is a highly significant determinant of net notional CDS positions.16 Column (5) shows that,
controlling for the total amount of bonds that a reference entity has outstanding, bond fragmentation
is associated with larger net CDS positions. Column (6) repeats the same analysis but using a
dummy variable for above-median bond fragmentation. In both specifications, bond fragmentation
is significant at the 1% level and the effects are economically large. For example, the coefficient of
0.272 on the bond fragmentation dummy variable implies that firms above the 50th percentile of bond
fragmentation on average have $272m more net notional in CDSs outstanding. The coefficient of
0.272 on bond fragmentation in column (5) implies that a one-standard deviation increase in bond
fragmentation is associated with an increase in net notional CDS positions of $110m. Both of these
effects are economically significant when compared to the median firm’s net notional CDS amount of
$817m.
While the fragmentation of a firm’s bonds is arguably more exogenous than other standard mea-
sures of trading frictions (such as trading volume or trading costs), bond fragmentation is ultimately
also a choice variable for firms. For example, one may worry that firms change the fragmentation of
their bonds depending on whether they are traded reference entities. To alleviate such endogeneity
concerns, column (7) repeats the analysis using a predetermined bond fragmentation measure. We
define predetermined bond fragmentation as the fragmentation of a firm’s bonds at the moment that
firm becomes a traded reference entity in the CDS market. In cases where the firm was already a
traded CDS reference entity in January 2002 (when the CDS market was still in its infancy), we use
16All columns that include bond fragmentation and contractual heterogeneity of bond issues include time and industryfixed effects and ratings controls. Because for a given firm bond fragmentation and contractual heterogeneity is essentiallyconstant over time, we cannot not include firm fixed effects in these specifications.
18

the bond fragmentation at that point. This robustness check confirms our results by showing that
also predetermined bond fragmentation is a significant determinant of net CDS positions.
Columns (8) and (9) investigate contractual heterogeneity of outstanding bonds as a determinant
of CDS positions. Column (8) shows that having bonds with different contractual terms is associated
with an increase in CDS positions of $291m. The explicit measure of contractual heterogeneity there-
fore lends further support to the interpretation that the CDS market serves a standardization role.
Column (9) shows that contractual heterogeneity remains significant when also controlling for bond
fragmentation, although the coefficient is sightly reduced. This suggests that bond fragmentation and
contractual heterogeneity capture related but not identical aspects of frictions in the bond market.
3.3 Determinants of CDS and bond trading volume
Table 3 examines trading volume in the bond and CDS markets. Investigating trading volume is
interesting for two reasons. First, it allows us to examine whether the determinants of trading flow
in the CDS market are the same as the determinants of the stock of credit risk that is transferred
via the CDS market (i.e., the net notional). Second, looking at trading volume allows us to directly
compare the determinants of trading volume in the CDS market to the determinants of trading in the
underlying bond, thereby shedding light on the potentially different roles these two markets fulfill.
Table 3 shows the results of a joint regression of CDS and bond trading volume on insurable
interest (bonds outstanding), speculative trading motives (analyst disagreement), bond fragmentation,
and contractual heterogeneity on trading in the bond market and the CDS market. The regression
specification is similar to the above specification for net notional, except that, unlike net notional,
trading volume as an outcome variable is not censored. Rather, because trading volume can be zero
both in the CDS and the bond market, we run a tobit regression. Moreover, because unobservable
variables might lead to trading in both the bond and the CDS market, we estimate the two trading
equations jointly, allowing the error term in the two equations to be correlated, see Appendix B for
details.
19

The results indicate that, across all specifications, insurable interest is a significant determinant
of trading volume, both in the bond market and the CDS market. Disagreement, on the other hand,
is a strong determinant of trading volume in the CDS market but not in the bond market, where
the estimated coefficient is much smaller (and insignificant across all specifications). Table 3 also
shows that there are striking differences in the economic magnitudes of the effects across the two
markets, the baseline specification is column (1). The effect of insurable interest (bonds outstanding)
on trading volume in the bond and the CDS markets are of the same order of magnitude. In the bond
market, an additional dollar of bonds outstanding is associated with an increase in monthly trading
volume of 8.62 cents in the specification of column (1), significant at the 1% level. In the CDS market,
an additional dollar of bonds outstanding is associated with an increase in monthly trading volume
of around 2.83 cents, also significant at the 1% level. The difference between the two coefficients is
statistically significant at the 1% level, but the economic magnitude of the effect is similar. This
changes dramatically when we investigate the effect of disagreement on trading volume: Here, the
effects are at least an order of magnitude larger in the CDS market. Taking the coefficient of 4.594,
a one standard-deviation increase in disagreement is associated with an increase of $144m in monthly
trading volume in the CDS market, which corresponds to 43.1% of median CDS trading volume. In
contrast, in the bond market a one standard-deviation increase in disagreement is associated with a
(statistically insignificant) increase of only $13.3m in monthly trading volume. Again, the difference
between the coefficients is significant at the 1% level but, more importantly, the size of the two effects
are of a different order of magnitude. In specification (2) we repeat the analysis with firm fixed
effects.17 Note that there is much more time variation in trading activity, so the coefficients are much
better identified than in case of explaining net CDS. Both the size and the statistical and economic
significance of the coefficients of bonds outstanding and disagreement are very similar to the case in
column (1) both for bond and CDS trading.
17We had to exclude one firm from the sample in the specification that includes firm fixed effects because, for that firm,there are no bond transactions during our sample period, such that the firm fixed effect cannot be identified.
20

Hence, while insurable interest is associated with more trading volume in both the bond and the
CDS market (with larger effects in the bond market), our evidence suggests that, conditional on the
existence of a CDS market, trading due to speculative motives occurs predominantly in the CDS
market. This finding is consistent with the view that, due to the liquidity advantage of the corporate
CDS market, speculators (typically hedge funds with the ability to trade in both markets) take short-
term views in the CDS market and not in the underlying bonds. On the other hand, irrespective of
the fact that the bond is less liquid, bond investors (hedgers) might still use the bond market to trade
for two reasons. First, liquidity traders who need cash still need to trade in the bond market since
hedging in the CDS market does not necessarily free up the invested cash. Second, many hedgers that
need to offload credit risk could be institutional investors that are restricted in their use of derivatives
(e.g., mutual funds).
Columns (3) to (5) examine the effect of bond fragmentation and contractual heterogeneity of bond
issues on trading volume in the bond and the CDS market. The coefficients on bond fragmentation
and the bond fragmentation dummy indicate that for firms with more fragmented bonds we observe
significantly less trading in the underlying bond and more trading in the CDS. The coefficient on
the dummy variable for fragmentation in column (4) lends itself to a particularly easy interpretation:
Above-median bond fragmentation is associated with $20.1m less in monthly bond trading volume,
which corresponds to a reduction of about 22% for the median firm. In the CDS market, above-median
bond fragmentation is associated with higher trading volume of $89.9m, an increase of about 27% for
the median firm. The difference between the coefficients on fragmentation for CDS and bond trading
is significant at the 1% level both for the continuous and the dummy measure. This finding indicates
that for firms with more fragmented bonds, more trading of credit risk happens in the CDS market
and less in the bond market, suggesting that the CDS market is a substitute trading venue for bonds.
A similar picture emerges in column (5), which investigates the contractual heterogeneity of bond
issues as a determinant of trading volume. Contractual heterogeneity is associated with $84m more
monthly trading volume in the CDS and a reduction of $17.3m of trading volume in the underlying
21

bonds, the difference is again significant at the 1% level. Tables 10 and 11 in the online appendix
show that these results continue to hold when using alternative hedging proxies, size controls, and
controls for lagged CDS returns and volatility.
3.4 CDS markets and trading frictions in the bond market
Taken together, the evidence in Tables 2 and 3 therefore confirms the hypothesis that CDS reference
entities have larger net notional CDS amounts and more CDS trading when the underlying bonds
are fragmented into separate issues and heterogeneous in their contractual terms. We now provide
evidence that the mechanism behind this result is indeed related to trading costs and liquidity.18
Specifically, Table 4 investigates the link between bond fragmentation and two commonly used mea-
sures of liquidity: bond trading costs and bond turnover. We measure bond trading costs as the
“implied spread” that traders pay on a roundtrip bond transaction, following Feldhutter (2012).19
The results show that higher bond fragmentation and more contractual heterogeneity among bonds
are both associated with higher trading costs and lower turnover in the associated bonds. The specifi-
cation in column (1) implies that a one-standard deviation increase in bond fragmentation is associated
with a 6.2% increase in roundtrip trading costs and a reduction of 17.5% in bond turnover (column
(4)) relative to the median firm. Similarly, roundtrip trading costs are 8.8% higher (column (2)) and
monthly bond turnover 21.9% lower (column (5)) for firms with bonds that are contractually hetero-
geneous when compared to the median firm. When adding both bond fragmentation and contractual
heterogeneity in columns (3) and (6) fragmentation drives out the effect of contractual heterogeneity
to a substantial degree. To eliminate potential worries that these results are driven by firms with very
18Because bond trading costs and bond turnover are highly endogenous variables, we did not include them as regressors inour regressions above. However, in order to investigate the mechanism behind the association between activity in the CDSmarket and bond fragmentation, we now use roundtrip trading costs and bond turnover as left-hand-side variables in Table4.
19Specifically, we match bond trades of the same size that are at most 15 minutes and 10 trades apart and then calculatethe roundtrip trading cost, expressed as a spread. Half roundtrip spreads (customer to dealer) are multiplied by 2 to get thefull implied roundtrip cost. We only consider trades with par value of at least $1 million to capture institutional trades.
22

few bond issues, Table 12 in the online appendix show that these results continue to hold when we
restrict the sample to firms with at least three bond issues.
The control variables enter as expected. Firms that have more bonds outstanding have more
liquid bonds, both in terms of lower trading costs and higher turnover.20 Disagreement is associated
with higher implied trading cost (consistent with higher levels of asymmetric information) and higher
turnover (most likely reflecting trading demand created by disagreement). This finding highlights
that turnover is an imperfect measure of liquidity, because it confounds the ease of trading with the
demand for trading.
Overall, our evidence supports the view of the CDS market as an alternative trading venue that
circumvents trading frictions in the underlying bond market. The CDS market is particularly active
for firms with bonds that are fragmented and contractually heterogeneous, making them illiquid
and costly to trade. This finding echoes the view, held among bond market practitioners, that the
fragmentation of the corporate bond market impedes its liquidity, thereby generating potential benefits
to the introduction of more standardized securities. While some market participants have proposed
increasing standardization in the corporate bond market itself (e.g., BlackRock, 2013), our results
indicate that, in the absence of more standardized bonds, the CDS market can step in as a more
standardized trading venue.21
20One interpretation of this result is that, in an OTC market, a larger asset float makes it easier to find trading partners,reducing trading cost. In contrast, as discussed above, the coefficient on bond fragmentation is positive because, for a givenamount of bonds outstanding (recall that bond fragmentation is orthogonalized to size), a more fragmented bond market isassociated with smaller individual issuances, which increases frictions in the bond markets and thus increase trading costs.
21The finding that bond fragmentation is associated with higher trading costs is consistent with the predictions of theoriesof corporate bond markets as OTC markets. Weill (2008) shows that, in a search-based model of OTC markets, bid-askspreads are larger for assets with smaller outstanding supply. Empirically, our finding that bond fragmentation is associatedwith bond liquidity is consistent with the findings in Longstaff et al. (2005) and Mahanti et al. (2008), who document thatbond issues of smaller size tend to have lower secondary market liquidity, such that firms that split their bonds into multiplesmaller issues tend to have less liquid bonds.
23

4 CDSs and Arbitrage
Another major implication of CDS markets is that they allow arbitrage activity between the underlying
bond market and the associated CDS. In this section, we examine this arbitrage role of CDS markets.
The main idea is that arbitrage activity across bond and CDS markets should be reflected in CDS
positions. Moreover, to the extent that such arbitrage activity is present, it may have economic
consequences. Consistent with the theoretical predictions of Oehmke and Zawadowski (2015), our
evidence shows that more arbitrage activity helps eliminate relative mispricing between the bond and
the CDS and, by facilitating the absorption of bond supply shocks, is associated with lower price
impact in the bond market.
4.1 Documenting arbitrage activity
The main quantity of interest for arbitrageurs that connect the bond and CDS markets is the CDS-
bond basis, which has received considerable attention over the last few years (especially during the
financial turmoil of 2008-09). The CDS-bond basis is defined as the CDS spread minus the spread
of the underlying bond over the risk-free rate. Because a hedged portfolio consisting of a long bond
position and a CDS that insures the default risk of the bond should yield the risk-free rate, no arbitrage
implies that the CDS-bond basis should be approximately zero.22
During the recent financial crisis, the CDS-bond basis became significantly negative for many
reference entities, as documented, for example, by Bai and Collin-Dufresne (2013) and Fontana (2011).
A negative CDS-bond basis means that the CDS spread is lower than the spread of the underlying
bond over the risk-free rate. Intuitively speaking, this price difference implies that one can earn a
positive return by purchasing the bond and entering a CDS contract to hedge the bond’s default
risk—a so-called negative basis trade. Because this arbitrage trade involves a long position in the
22Absent limits-to-arbitrage frictions, the CDS-bond basis should be approximately zero (see Duffie, 1999). In practice,the CDS-bond basis has historically been slightly positive for technical reasons, such as imperfections in the repo market andthe cheapest-to-deliver option (see JPMorgan, 2006).
24

CDS, negative-basis arbitrage activity should be associated with larger net notional CDS positions.
Analogously, in a positive basis trade an arbitrageur would short the reference bond and sell credit
protection in order to profit from a situation where the bond spread is higher than the associated
CDS spread. Therefore, also the positive basis trade could lead to an increase in net notional CDS
amounts.
To generate crisp hypotheses regarding CDS positions and the CDS-bond basis, we draw on the
equilibrium model of bond and CDS markets in Oehmke and Zawadowski (2015).23 In particular, their
framework generates four main hypotheses on the relation between CDS positions and the negative
basis. To avoid confusion: In the hypotheses and in the tables that follow, we define the negative basis
as a positive number (i.e., the absolute value of the negative basis). The first hypothesis is that basis
trader positions are increasing in the negative basis. This suggests that in a regression of net notional
CDS positions on the (absolute value of) the negative basis, the coefficient on the negative basis is
predicted to be positive. The second hypothesis is that the coefficient on the negative basis should be
smaller when funding conditions are tough, because tough funding conditions make it more difficult
for basis traders to lever their arbitrage trades. We therefore expect a negative coefficient on the
interaction term of the negative basis with the TED spread (where the TED spread proxies for tough
funding conditions for arbitrageurs). Third, the relation between CDS positions and the negative
basis should be weaker when bond trading costs are high, because this makes it more expensive to set
up a basis trade position. This predicts a negative coefficient on an interaction term of the negative
basis and bond trading costs. Fourth, the relation between the negative basis and CDS positions is
predicted to be weaker for firms with significant disagreement, because in this case it becomes more
attractive for investors to take directional bets rather than join the basis trade. We therefore expect
a negative coefficient on the interaction term of the negative basis and our disagreement proxy.
23In Oehmke and Zawadowski (2015), leverage-constrained arbitrageurs lean against the negative CDS-bond basis thatresults from differences in trading costs between the bond and the CDS. The model yields joint predictions on the negativeCDS-bond basis and the size of the positions that arbitrageurs hold as part of the basis trade. For the theoretical details onwhich the following hypotheses are based, see Section 3.2 and, in particular, Corollary 1.
25

We investigate these predictions in Table 5, which, in addition to disagreement and bonds out-
standing, includes the CDS-bond basis as a determinant of net notional CDS positions. We calculate
the CDS-bond basis using bonds with remaining maturities of 1–30 years, which we match to the as-
sociated CDS spread of equivalent maturity, interpolating where necessary. We eliminate bonds with
embedded options (puttable, redeemable, callable, exchangeable, or convertible), and floating-rate
coupons. To calculate the profitability of a negative basis trade that is implementable (buy bond and
buy CDS) on a large enough scale, we use the realized weighted average bond purchase (ask) price for
transactions over $1 million in face value from TRACE.24 We use the overnight indexed swap (OIS)
rate as the risk-free rate. This procedure yields data on the CDS-bond basis data for 123 companies.
For each company, we use the bond issue with the largest negative or positive basis on a given day,
because the bond issue with the most extreme basis represents the most profitable opportunity for an
arbitrageur. For each firm, we then average these basis values over the given month. If, for a given
issuer, there is no bond with an implementable negative basis, negative basis takes value zero (and
analogously for the positive basis). For robustness, Table 13 in the online appendix shows that all
results continue to hold if instead of the largest negative or positive basis we use the average basis.
Table 5 confirms all four of these hypotheses laid out above. First, the estimated coefficient on the
negative CDS-bond basis is significantly positive across all specifications, which means that a negative
CDS-bond basis is indeed associated with larger net CDS positions, confirming the first hypothesis.
In terms of economic magnitudes, the coefficient of 0.0888 of column (1) in Table 5 indicates that
for bonds with a negative basis, a one standard deviation increase in the negative basis (i.e., a more
negative basis of 149.6 basis points) is associated with an increase in net notional CDS outstanding of
$133m, which, for the median firm in the DTCC data, corresponds to a 16% increase in net notional
CDS positions. In contrast, a positive basis is generally not associated with larger CDS positions,
indicating that the effect of the CDS-bond basis on net notional CDS positions is asymmetric. While
24In a positive basis trade, the arbitrageur has to short sell the bond. We therefore use the bond’s bid price, usingtransactions over $1 million in face value. While in principle one would also like to use realized ask prices for the CDS legof the trade, these are generally not available (Markit does not even report quoted bid-ask spreads). We therefore use themidpoint for the CDS leg.
26
this apparent asymmetry could partially be driven by lack of data (during our sample period positive
CDS-bond bases occur less often than negative CDS-bond bases), the finding is consistent with the
interpretation that there is an asymmetry in the effect of negative and positive CDS-bond bases on
net notional amounts of CDS outstanding: Profiting from a positive CDS-bond basis requires short
selling the bond, which is often difficult and potentially costly. In column (2) we repeat the analysis
with firm fixed effects. Here the sample drops to 97 firms, but the coefficient on the negative basis
remains statistically significant at the 1% level, although the point estimate is slightly smaller. The
coefficient on the positive basis remains insignificant.
To test the second hypothesis, column (3) includes an interaction term between the absolute value
of the negative basis and the TED spread. As predicted, the coefficient on this interaction term is
negative. This corroborates the interpretation that the positive association between net notional CDS
positions and the negative CDS-bond basis reflect arbitrage activity that links bond and CDS markets.
When arbitrageur funding conditions are tough (as proxied by a higher TED spread), the link between
the negative basis and net notional CDS positions is less strong.25
Finally, the results also confirm the third and fourth hypotheses. Columns (4) and (5) show that
the interaction of the negative basis with bond illiquidity is negative as predicted, suggesting that
basis traders are less active when bond trading costs are high. We measure illiquidity of the bond
market two ways, using bond fragmentation in column (4) and implied roundtrip cost in column
(5). Whereas the roundtrip trading cost interaction is significant both by itself (column (5)) and
when all other interactions are included (column (7)), the interaction between bond fragmentation
and the negative basis is significant when all other interaction terms are included (column (7)), but
not by itself (column (4)). Column (6) shows that the interaction term of the negative basis with
disagreement is negative as predicted, reflecting a less active basis trade when market participants
have more directional views.
25The observation that the basis coefficient is lower when funding conditions are difficult makes it unlikely that theassociation between the negative CDS-bond basis and net CDS positions is driven by CDS dealer inventory concerns. Dealerswould react to CDS demand shocks (i.e., increases in net notional) by charging higher CDS spreads, thereby decreasing thenegative basis. In contrast, we find that larger net CDS positions are associated with a more negative basis.
27

4.2 Economic effects of CDS-bond arbitrage
What are the economic implications of the arbitrage activity documented above? Here, the model in
Oehmke and Zawadowski (2015) predicts that more active basis traders are associated with a smaller
negative basis and lower price impact in the bond market (for details, see Corollary 1 and Proposition
3 of that paper). In Tables 6 and 7 we investigate these predictions and examine the effect of arbitrage
activity on the relative pricing of bonds and CDSs and on price impact in the bond market. In both of
these tables, we proxy for the “strength of the basis trade” over time by constructing a time series of
the sensitivity of CDS positions to the negative CDS-bond basis. The basis trade is stronger when this
sensitivity is high. To obtain this time series of the “strength of the basis trade” we rerun the analysis
of column (1) in Table 5 but allow the coefficient on the negative basis to vary over time. Specifically,
we estimate a different cross-sectional regression every month but set the coefficients on the controls
to be the same across months (allowing the coefficients on bonds outstanding and disagreement to
also vary over time yields similar results). Because Tables 6 and 7 are from a two-stage estimation, we
bootstrap standard errors, taking into account that the “strength of the basis trade” is a generated
regressor.26
4.2.1 Leaning against the CDS-bond basis
Figure 5 plots a time series of the “strength of the basis trade” (i.e., the estimated monthly basis
coefficient) with 95% confidence intervals. The figure shows that, at the beginning of our sample
period, the coefficient is essentially zero, reflecting the extremely difficult funding conditions of a basis
trade in late 2008 and early 2009, as also illustrated by the high TED-spread (dashed line). Consistent
with this interpretation, Choi and Shachar (2014) document significant unwinding of the basis trade
after the Lehman default in the fall of 2008. As funding conditions improve later on in the sample,
the basis coefficient becomes positive and statistically different from zero. Finally, towards the end
26Bootstrapped standard errors calculated the following way: We draw 1,000 bootstrap samples by first resampling datesand then resampling firms within each date. We then apply the two-step estimation procedure to each bootstrapped sampleand calculate the standard deviation of the estimated coefficients.
28

of the sample, the basis coefficient seems to decline, potentially reflecting diminished opportunities
in the basis trade. Note that the strength of the basis trade is measured relatively precisely in the
earlier part of our sample, but is measured more imprecisely in the latter half of the sample. Because
this proxy is an estimated coefficient (from a finite cross section), there is an errors-in-variables issue
when using it as a regressor. However, note that this results in a downward bias in the estimated
coefficient on the strength of the basis trade, therefore biasing the analysis that follows against finding
significant effects. We performed Monte Carlo analysis to confirm that the inferences drawn based on
this coefficient are indeed conservative.27
Table 6 investigates the implications of the strength of the basis trade for the relative pricing of the
bond and the CDS (i.e., the level of the negative CDS-bond basis). The table contains the results of
an OLS regression of the negative CDS-bond basis on the proxy for the strength of the basis trade and
a number of other control variables. The significantly negative coefficient on the “strength of the basis
trade” reported in Columns (1)-(3) show that the negative basis is smaller (in absolute value) when
basis trader positions are more sensitive to changes in the CDS-bond basis. Column (1) shows this in
the context of a univariate regression; column (2) adds a number of controls and industry fixed effects,
column (3) adds firm fixed effects. The effect of the strength of the basis trade on the negative CDS-
bond basis is economically significant. Using the results from column (2), a one-standard deviation
increase in the strength of the basis trade is associated with a reduction of the negative basis of
52 basis points. Again, the control variables enter as expected. Disagreement is associated with a
more negative basis in all specifications, as predicted by Oehmke and Zawadowski (2015), even after
controlling for credit quality. Bond fragmentation is associated with a more negative CDS-bond basis,
but is not statistically significant. No clear pattern emerges with respect to the amount of bonds
outstanding, which is insignificant in some specifications and significant in others, with changing sign.
27Specifically, using generated data broadly consistent with the true data, we ran a Monte Carlo analysis of the two-stageestimation procedure used in Tables 6 and 7. The results confirm that the estimated second-stage coefficient is downwardbiased and, importantly, that the standard error of the second-stage coefficient is not downward biased. The inferences drawnin Tables 6 and 7 therefore seem conservative.
29

In columns (4)-(6) we add interaction terms to investigate the role of the strength of the basis trade
during the crisis (defined as October 2008 to December 2009) and after the crisis (January 2010 to
December 2012). This sample split shows that (i) the basis was much more negative during the crisis,
as shown by the significant positive coefficient on the crisis dummy; (ii) unconditionally, the strength
of the basis trade is still a significant determinant of the basis, but with smaller economic magnitude
and somewhat less statistical significance, as shown by the coefficients on the negative basis; and (iii)
the strength of the basis trade has a particularly large influence in reducing the negative basis during
the crisis, as shown by the large and statistically significant coefficient on the interaction of the basis
coefficient and the crisis dummy. Finally, columns (7)-(9) show that these results survive even after
controlling for the TED spread both during and after the crisis. This finding suggests that the results
in columns (1)-(6) are not merely driven by general funding conditions, but work through the CDS
market.
Economically, this evidence on arbitrage activity points to another potentially important role of
CDS markets. By allowing arbitrageurs to lean against price differences between the bond and the
CDS and absorb supply shocks, CDS markets may help to compress spreads for bond issuers. The
presence of CDSs may thereby improve firms’ access to financing. This interpretation echoes the
empirical findings of Saretto and Tookes (2013), who document that the presence of CDSs allows
firms to borrow more and at longer maturities. The finding is also consistent with the theoretical
predictions in Oehmke and Zawadowski (2015), who show that the introduction of CDSs can reduce
bond spreads for issuers via the emergence of levered basis traders.
Note also that the observation that the negative basis is an economically significant determinant of
net notional CDS amounts is a potential explanation for the relation between bond fragmentation and
net notional CDS positions documented in Section 3: It is well known that smaller bond issuances
and more illiquid bonds tend to have more negative CDS-bond bases (see, for example, Longstaff
et al., 2005; Bai and Collin-Dufresne, 2013), which, through the arbitrage channel documented in this
section, is translated into larger net notional CDS positions.
30

4.2.2 Price impact in the bond market
In Table 7 we investigate the effect of basis traders on price impact with respect to bond supply shocks.
The main theoretical prediction that we are after here is that levered basis traders can act as “shock
absorbers” and lower price impact in the bond market (see Proposition 3 in Oehmke and Zawadowski,
2015). To test this prediction, we calculate a bond-market Amihud (2002) price impact measure for
each firm in our sample.28 Table 7 presents the results of an OLS regression of the Amihud price
impact of the bonds of the firms in our sample on the strength of the basis trade and liquidity and size
controls. The results show that when CDS positions are sensitive to changes in the negative basis (i.e.,
basis traders provide significant cushioning), price impact in the bond market is significantly lower.
The coefficient of -2.954 in column (2) implies that a one-standard deviation increase in the strength
of the basis trade is associated with a reduction in the Amihud price impact measure of 28.9% for
the median firm. Hence, a potentially important economic implication of CDSs is that they make the
bond market more resilient to supply shocks because, in the presence of CDSs, levered basis traders
can act as shock absorbers.
Column (1) presents the univariate regression, column (2) adds controls, column (3) firm fixed
effects, columns (4)-(6) repeat the same analysis but with a different coefficient in and out of crisis,
columns (7)-(9) also control for the TED spread in and out of crisis. The results indicate that price
impact in the bond market is significantly lower during times when CDS positions are particularly
sensitive to the negative basis (columns (1)-(3)) and that this effect is concentrated during the financial
crisis (columns (4)-(6)). The finding that the effect is concentrated during the financial crisis lends
28For every bond, we calculate the monthly Amihud price impact as the absolute value of the percentage change in thebond price divided by volume. More specifically, we calculate the mid-price for every trading day using the average of value-weighted bid and ask transaction prices for that day. If these are not available, we use the value-weighted transaction priceof inter-dealer trades. For every trading day t and every bond issue, we then calculate the absolute value of the percentagechange in this mid-price from the previous trading day t− 1 to the next trading day t+ 1 and divide by bond trading volumeon day t. To reduce noise and to concentrate on trades of institutional size, we use only days with volume of at least $1million on trading day t. We then average across bond issues and days in a particular month to generate a monthly Amihudmeasure at the firm level. This measure can be computed for 15, 639 out of 22, 229 firm-month observations, based on anaverage of 26.3 issue-day observations. While the measure is noisy, it seems to capture illiquidity well both in the time seriesand cross section.
31

itself to two interpretations. One interpretation is that the presence of basis traders is more important
during times of dislocations. The other possibility is that the estimated coefficient for the strength
of the basis trade is estimated imprecisely for the second half of our sample (where there is much
less variation in the basis), leading to attenuation bias. Finally, note that also in Table 7 the main
result remains after controlling for the TED spread: the interaction of the basis coefficient with the
crisis dummy remains significant in columns (7)-(8) and is similar in magnitude but insignificant in
column (9), which includes firm fixed effects (as discussed above, insignificance could be due to the
downward bias in the coefficient). The control variables enter as expected. We find that both bond
fragmentation (a proxy for trading costs) and disagreement are associated with a significantly larger
price impact in all specifications, consistent with the predictions in Oehmke and Zawadowski (2015).
More bonds outstanding, on the other hand, are associated with lower price impact, suggesting that
larger supply increases the liquidity of a firm’s bonds.
The result that basis traders can act as shock absorbers in the bond market complement the
findings in Massa and Zhang (2012), who provide evidence—based on event studies around Hurricane
Katrina and downgrades from investment grade to non-investment grade—that the presence of CDSs
can reduce fire sales. However, whereas in Massa and Zhang (2012) CDSs reduce fire sale risk by
reducing the need of investors to sell bonds when credit conditions deteriorate, our evidence suggests
that even conditional on selling pressure in the bond market, CDSs help reduce price impact by
allowing levered basis traders to step in as absorbers of supply shocks.
5 Conclusion
This paper investigates the economic role of the CDS market by analyzing the determinants of the
amount credit protection bought (or equivalently sold) in the market for credit default swaps (CDSs).
Our analysis, based on novel data on net notional CDS positions and CDS trading volume from the
Depository Trust & Clearing Corporation (DTCC), suggests that CDS markets function as “alter-
32

native trading venues” for both hedging and speculation in the underlying bond. In particular, net
notional CDS positions are larger and CDS trading volume higher when the underlying bonds are
fragmented into separate issues and differ in their contractual terms. The evidence therefore supports
a standardization and liquidity role of the CDS market. This interpretation is supported by the finding
that bond fragmentation and contractual heterogeneity among bond issues are associated with higher
trading costs and lower trading volume in the underlying bonds.
Our analysis also points to economically important arbitrage activity that links the CDS and
the bond market via the basis trade: Firms which have a more negative CDS-bond basis (i.e., the
bond is undervalued relative to the CDS) have larger amounts of CDSs outstanding, suggesting that
arbitrageurs use the CDS market to lean against price differences between the bond and the CDS.
This has economic consequences. At times during which basis traders are more active, the discount of
the underlying bond relative to the CDS is smaller, potentially improving firms’ access to financing.
Moreover, price impact in the bond market is lower when basis traders are more active, suggesting
that levered arbitrageurs help absorb supply shocks in the bond market.
References
Acharya, V. V., and T. C. Johnson. 2007. Insider Trading in Credit Derivatives. Journal of Financial
Economics 84:110–141.
Amihud, Y. 2002. Illiquidity and stock returns: Cross-section and time-series effects. Journal of
Financial Markets 5:31–56.
Ashcraft, A. B., and J. A. C. Santos. 2009. Has the CDS Market Lowered the Cost of Corporate Debt.
Journal of Monetary Economics 56:514–523.
Atkeson, A. G., A. L. Eisfeldt, and P.-O. Weill. 2015. Entry and Exit in OTC Derivative Markets.
Econometrica 83:2231–2292.
33

Bai, J., and P. Collin-Dufresne. 2013. The CDS-Bond Basis. Working Paper, Georgetown University
and Swiss Finance Institute.
BlackRock. 2013. Setting New Standards: The Liquidity Challenge II. BlackRock Investment Institute.
Blanco, R., S. Brennan, and I. W. Marsh. 2005. An Empirical Analysis of the Dynamic Relation
between Investment-Grade Bonds and Credit Default Swaps. The Journal of Finance 60:2255–
2281.
Bolton, P., and M. Oehmke. 2011. Credit Default Swaps and the Empty Creditor Problem. Review
of Financial Studies 24:2617–2655.
Che, Y.-K., and R. Sethi. 2014. Credit Market Speculation and the Cost of Capital. AEJ: Microeco-
nomics 6:1–34.
Chen, K., M. Fleming, J. Jackson, A. Li, and A. Sarkar. 2011. An Analysis of CDS Transactions:
Implications for Public Reporting. Federal Reserve Bank of New York Staff Reports 517.
Chernov, M., A. S. Gorbenko, and I. Makarov. 2013. CDS Auctions. Review of Financial Studies
26:768–805.
Choi, J., and O. Shachar. 2014. Did Liquidity Providers Become Liquidity Seekers? Evidence from
the CDS-Bond Basis During the 2008 Financial Crisis. Working paper, University of Illinois at
Urbana-Champaign.
DTCC. 2009. Deriv/SERV Today.
Du, S., and H. Zhu. 2013. Are CDS Auctions Biased and Inefficient? Working paper, MIT Sloan.
Duffee, G. R., and C. Zhou. 2001. Credit derivatives in banking: Useful tools for managing risk?
Journal of Monetary Economics 48:25–54.
Duffie, D. 1999. Credit Swap Valuation. Financial Analyst Journal 55:73–87.
34

Feldhutter, P. 2012. The Same Bond at Different Prices: Identifying Search Frictions and Selling
Pressures. Review of Financial Studies 25:1155–1206.
Fontana, A. 2011. The Negative CDS-bond Basis and Convergence Trading during the 2007/09
Financial Crisis. Working Paper, Geneva Finance Research Institute.
Fostel, A., and J. Geanakoplos. 2012. Tranching, CDS, and asset prices: How financial innovation can
cause bubbles and crashes. AEJ: Macroeconomics 4:190–225.
Gupta, S., and R. K. Sundaram. 2012. CDS Auctions and Informative Biases in CDS Recovery Rates.
Working Paper, NYU.
Hirtle, B. 2009. Credit Derivatives and Bank Credit Supply. Journal of Financial Intermediation
18:125–150.
Hu, H. T. C., and B. Black. 2008. Debt, Equity, and Hybrid Decoupling: Governance and Systemic
Risk Implications. European Financial Management 14:663–709.
JPMorgan. 2006. Credit Derivatives Handbook.
Longstaff, F. A., S. Mithal, and E. Neis. 2005. Corporate Yield Spreads: Default Risk or Liquidity?
New Evidence from the Credit Default Swap Market. Journal of Finance 60:2213–2253.
Mahanti, S., A. Nashikkar, M. Subrahmanyam, G. Chacko, and G. Mallik. 2008. Latent liquidity: A
new measure of liquidity, with an application to corporate bonds. Journal of Financial Economics
88:272–298.
Massa, M., and L. Zhang. 2012. Credit Default Swaps, Fire Sale Risk and the Liquidity Provision in
the Bond Market. Working paper, INSEAD and NTU.
Minton, B., R. M. Stulz, and R. Williamson. 2009. How Much Do Banks Use Credit Derivatives to
Hedge Loans. Journal of Financial Services Research 35:1–31.
35

Nashikkar, A., M. G. Subrahmanyam, and S. Mahanti. 2011. Liquidity and Arbitrage in the Market
for Credit Risk. Journal of Financial and Quantitative Analysis 46:627–656.
Oehmke, M., and A. Zawadowski. 2015. Synthetic or Real? The equilibrium effects of credit default
swaps on bond markets. Review of Financial Studies 28:3303–3337.
Parlour, C. A., and G. Plantin. 2008. Loan Sales and Relationship Banking. Journal of Finance
63:1291–1314.
Parlour, C. A., and A. Winton. 2013. Laying off Credit Risk: Loan Sales versus Credit Default Swaps.
Journal of Financial Economics 107:25–45.
Qiu, J., and F. Yu. 2012. Endogenous liquidity in credit derivatives. Journal of Financial Economics
103:611 – 631.
Saretto, A., and H. Tookes. 2013. Corporate Leverage, Debt Maturity and Credit Default Swaps: The
Role of Credit Supply. Review of Financial Studies 26:1190–1247.
Shachar, O. 2011. Exposing the Exposed: Intermediation Capacity in the Credit Default Swap Market.
Working Paper, NYU Stern.
Stulz, R. M. 2010. Credit Default Swaps and the Credit Crisis. Journal of Economic Perspectives
24:73–92.
Subrahmanyam, M., D. Tang, and S. Q. Wang. 2014. Does the Tail Wag the Dog? The Effect of
Credit Default Swaps on Credit Risk. Review of Financial Studies 27:2927–2960.
Thompson, J. R. 2009. Credit Risk Transfer: To Sell or to Insure. Working Paper, University of
Waterloo.
Weill, P.-O. 2008. Liquidity premia in dynamic bargaining markets. Journal of Economic Theory
140:66–96.
36

Wooldridge, J. M. 2010. Econometric Analysis of Cross Section and Panel Data (2nd edition). MIT
Press.
Zawadowski, A. 2013. Entangled Financial Systems. Review of Financial Studies 26:1291–1323.
37

A Sample Construction
When matching Compustat to DTCC companies, we only took into account exact matches. Thus
the CDS of a subsidiary was not matched to that of the parent. If we found more than one possible
DTCC match for a Compustat firm, we dropped it. We exclude companies once they enter bankruptcy
and/or once a CDS settlement auction takes place. The CDS settlement auction data is available at
www.creditfixings.com.
Given the complicated legal structure of companies, we construct two different measures of bonds
outstanding. The first measure, bonds outstanding (direct issue), includes all bonds issued directly
by the parent company, including all bonds issued by companies that have been acquired and fully
dissolved (in case of mergers and acquisitions, the new parent inherits the bonds of the old company).
The second measure, bonds issued by subsidiaries, includes all bonds issued by all subsidiaries of the
parent company. Parent companies are not be liable for the bonds of their subsidiaries unless they
explicitly guarantee them. Note that Compustat and Capital IQ both look at consolidated balance
sheets thus they treat the bond issuances of all subsidiaries as that of the parent or acquirer.
Bonds outstanding are from Mergent FISD. We exclude all short-term bonds; only bonds with
at least 366 days of original maturity are considered. We also exclude bonds in the month of their
issuance and the month of their redemption. Retail notes (average issue size is only $7 million in
the sample) and bonds with face value of less than $1000 are excluded since these are small issues
catered to retail investors who do not participate in the CDS market. Pass-through notes and foreign
currency bonds are also excluded. In Mergent FISD, we drop bonds that have been effectively recalled
or decrease the amount outstanding by the recall amount. We also drop bonds with zero or unrecorded
offering amount. We calculate bond trading for the bonds in Mergent FISD using Trace Enhanced
and match the two using the CUSIP of the bond issues. Bond turnover is then winsorized at the top
99% at the issuance level.
38

Matching between bond issues and Compustat companies is done along two dimensions. First,
since the firms in our sample are public, we use the CRSP files to match old CUSIPS (e.g., acquired
company) to new CUSIPS (e.g., acquirer). In case of a merger or acquisition, we use the same file to
find the new parent company. We then hand-check all the matches and verify whether the acquired
companies (or subsidiaries) are limited liability entities or not (i.e., whether the parent is liable for
the obligations). Second, we use the Mergent FISD parent identifier to consolidate companies with
the same parent. We also hand-search for parent companies using internet resourses (Bloomberg
BusinessWeek and Wikipedia). We then use the first six digits of CUSIP (which identifies the issuer)
to match Compustat data to bond data from Mergent FISD. In a second round of matching all
unmatched issues in Mergent FISD are, if possible, hand matched to Compustat. We then hand-
match Compustat companies to the Markit CDS spread database.
We drop companies with SIC industry code 9995 (non-operating establishments) and companies
with no assets. We also drop companies for which we have no SIC codes. To avoid possibly erroneous
matches with Capital IQ and Mergent FISD that result in outliers, we filter our matches. We exclude
all Mergent FISD observations for which the total amount bonds outstanding measured by Mergent
FISD exceeds the total amount of debt measured by Compustat by more than 50% of assets. The
results are not sensitive to the exact specification of such data filtering. Companies with SIC code
9997 are hand-assigned to industries based on their dominant area of business. In every month, we
winsorize all unbounded variables at the 1% and 99% level. We winsorize the CDS-bond basis at the
2% and 98% level because of the few observation (typically less than 100 per month). Finally, we
drop (quasi) state-owned companies (Fannie Mae, Federal Home Loan Mortgage Corporation, United
States Postal Service). These companies have large asset bases but no CDS in DTCC, and thus behave
very differently from the regular sample.
39

B Regression Specification and Censoring
For single-name CDSs, the DTCC provides weekly position data (gross and net notional) for the top
1,000 traded reference entities in terms of aggregate gross notional amounts outstanding. This implies
that there is a censoring issue in the data: We do not observe CDS positions for firms that have gross
notional amounts outstanding that are too small to make it into the top 1,000 reference entities. On
the other hand we do observe the trading activity for all of these reference entities regardless of the
amount of trading, i.e. there is no direct censoring in the amount traded.
The censoring issue in notional CDS outstanding is illustrated in Figure 4. The figure plots the
net notional amounts in CDS outstanding as a function of log assets. The figure displays the reference
entities for which we have CDS position data from the DTCC and the censored observations, for which
we do not have CDS position data. We can thus infer that, conditional on a CDS market existing,
these firms have gross notional amounts outstanding that lie below the cutoff to the 1,000 largest
reference entities. Not taking into account this censoring problem would result in censoring bias (see,
e.g., Wooldridge, 2010). For example, the slope coefficient in an OLS regression of net CDS on log
assets, illustrated in Figure 4, would be biased downward. In our empirical analysis we thus use a
censored regression approach that takes into account that firms for which we do not observe CDS
position data are traded but do not make it into the top 1,000 reference entities.
One complication that arises in adjusting for the censoring problem is that, while our analysis
focuses on the net notional outstanding, the DTCC determines the cutoff as to which reference entity
makes the top 1,000 list in terms of the gross notional outstanding. Of course, the resulting censoring
problem carries over to net notional values: Reference entities that have low gross notional amounts
of CDSs outstanding, are also likely to have low net notional amounts outstanding. Hence, because of
the cutoff in terms of gross notional outstanding, our data is also likely to leave out reference entities
with small amounts of net notional CDS outstanding. However, because the DTCC cutoff is in gross
40

notional, in adjusting for this bias we have to make an assumption on the relation between gross
notional and net notional amounts of CDS outstanding.
We make this adjustment by exploiting the empirical relation between gross notional and net
notional amounts. To make the adjustment from gross notional to net notional we assume that for
companies that are left out of our data because their gross notional amount outstanding are too small,
the relation between gross notional to net notional amounts equals the mean of the empirical gross-net
relation of firms for which we observe CDS positions in the same month. Adjusting for the uncertainty
of this cutoff does not have a significant impact on our estimates so it is omitted for simplicity.
For net notional, we run a maximum likelihood estimation that corrects for the cutoff in the
reference entities that we observe in the data. The likelihood function is constructed as follows. We
observe yi = Net CDSi,t for all firms for which yi,t exceeds the threshold yi,t, where
Lt =n∏
i=1
[1
σi,t· φ(yi,t − β ·Xi,t
σi,t
)]di,t·[Φ
(NetCutoff t − β ·Xi,t
σi,t
)]1−di,t
, (B.1)
where di,t is an indicator for observing net notional CDS outstanding,
di,t =
1 if yi,t ≥ NetCutoff t
0 if yi,t < NetCutoff t.
(B.2)
X is a vector that contains our explanatory variables and a constant. φ(·) is the pdf of the standard
normal distribution, and Φ(·) the cdf of the standard normal distribution. We jointly estimate
σi,t = const + γ · bonds outstandingi,t (B.3)
to allow the error term to scale with amount of bonds a firm has outstanding. For example, this type
of scaling is natural if a fraction of outstanding bonds is insured using CDSs. Our main results are
robust to alternative scaling variables, such as alternative measures of debt or total assets.
41

For CDS trading, we run a maximum likelihood tobit estimation that corrects for the fact that
some reference entities have zero trading volume. Zero trading volume can be inferred from the fact
that the firm is missing from the DTCC or Trace trading report. Note, however, that this issue is not
particularly common. In the data, less than 1% of firms have zero CDS trading and less than 5% of
firms have zero bond trading over a full month.
The likelihood function for the tobit estimation is given by
Lt =
n∏i=1
[1
σi,t· φ(yi,t − β ·Xi,t
σi,t
)]di,t·[Φ
(0− β ·Xi,t
σi,t
)]1−di,t
, (B.4)
where yi, t is monthly trading volume for firm i (in the CDS or the underlying bonds) and di,t is an
indicator variable that takes value one when trading volume is positive for firm i in month t,
di,t =
1 if yi,t > 0
0 if yi,t = 0.
(B.5)
X is a vector that contains our explanatory variables and a constant. σi,t is jointly estimated using
the specification B.3.
42

Figure 1: Gross notional and net notional CDS amounts
Example (a): Gross and net notional positions
A
Example (a): Gross and net notional positions
BC
10m
B
Gross CDS bought Gross CDS sold Net CDS
C
Gross CDS bought Gross CDS sold Net CDS
A 0 10 (10)
B 10 0 10
C 0 0 0
Total Gross Notional Bought =10
Gross Notional Sold =10
Net NotionalBought/Sold=10
Example (b): Gross and net notional positions
A
Example (b): Gross and net notional positions
BC
10m
B
Gross CDS bought Gross CDS sold Net CDS
C 10m
Gross CDS bought Gross CDS sold Net CDS
A 0 10 (10)
B 10 10 0
C 10 0 10
Total Gross Notional Bought =20
Gross Notional Sold =20
Net NotionalBought/Sold=10
Example (c): Gross and net notional positions
A
Example (c): Gross and net notional positions
BC
10m10m
B
Gross CDS bought Gross CDS sold Net CDS
C 10m
Gross CDS bought Gross CDS sold Net CDS
A 10 10 0
B 10 10 0
C 10 10 0
Total Gross Notional Bought =30
Gross Notional Sold =30
Net NotionalBought/Sold=0
This figure illustrates the difference between gross notional and net notional amounts in the DTCC data. In Example (a), B has purchased $10min protection from A. Both the gross notional and the net notional amount outstanding are $10m. In Example (b), B offsets the initial trade byselling $10m in protection to C. This raises the gross notional amount to $20m. The net notional amount remains at $10m. In Example (c), Csells $10m in protection to A, such that all three parties have a net zero position. The gross notional is now $30m but, because all net positionsare zero, the net notional is $0.
43

Figure 2: Single-name net notional CDS amounts over time
040
080
012
0016
00ne
t out
stan
ding
(USD
billi
ons)
2009m1 2010m1 2011m1 2012m1 2013m1
total single name net CDStop 1000 single name net CDSsingle name net CDS in sample (rated US parent companies)
This figure plots single-name net notional CDS amounts over time. The top solid line plots the total net notional CDS amount on all single-namereference entities, as reported by the DTCC. It thus captures the entire single-name CDS market. The dashed line plots the total net notionalamount of CDS protection written on the top 1,000 single-name reference entities. Comparing this line to the total single-name CDS marketdemonstrates that the top 1,000 reference entities make up a large fraction of the single-name CDS market when measured in terms of net notionaloutstanding. The dotted line plots the total net notional CDS amount for reference entities in our sample: public rated U.S. (parent) companiesthat are in Compustat and have at least one bond outstanding.
Figure 3: Trading volume in CDSs and bonds
010
020
030
0
cred
it ris
k tra
nsfe
r (U
SD b
illion
s)
2009m1 2010m1 2011m1 2012m1 2013m1
CDS trading (in DTCC) bond trading (in DTCC)bond trading (not in DTCC)
The figure plots trading volume in the bond market and the CDS market. The solid line depicts monthly trading volume in the CDS market asmeasured by trades that represent market risk activity according to the DTCC. The dashed line depicts monthly trading of directly issued bondsin our sample for firms for which we also have CDS trading volume (DTCC companies). The dotted line represents trading of directly issued bondsin our sample for non-DTCC companies.
44

Figure 4: Censoring in net notional CDS amounts
02
46
net C
DS
outs
tand
ing
(USD
billi
ons)
-2 0 2 4 6log(bonds outstanding)
observed in DTCC (in top 1000) censored but CDS exist
This figure illustrates the censoring in our sample based on one example month, December 2009. We plot the net CDS for all companies for whichwe know that the CDS market exists: companies that we observe in the DTCC data and/or for which we can find a Markit CDS quote from atleast 3 dealers. Firms in the DTCC data are denoted by circles, firms not in DTCC by diamonds. For expositional purposes, for firms not inDTCC we set the net notional CDS amount to zero in the figure. However, we know that these firms have positive net notional CDS amounts butdo not make it into the top 1,000 reference entities.
Figure 5: The “strength of the basis trade”0
.51
1.5
22.
5TE
D s
prea
d
-.50
.51
1.5
coef
ficie
nt
2009m1 2010m1 2011m1 2012m1 2013m1
95% confidence interval point estimateTED spread (%)
This figure plots the “strength of the basis trade” which is defined as the time-series of the cross-sectional coefficient of net notional CDS amountson the negative CDS-bond basis (left axis). The regression specification is the same as column (1) of Table 5, but allows for time variation in thecoefficient of both the negative and the positive basis. The grey shaded region denotes the 95% confidence interval. The mean of “strength of thebasis trade” is 0.265 and the standard deviation 0.198. The dashed line plots funding conditions as measured by the TED spread (right axis).
45

Table 1: Summary Statistics
This table provides summary statistics for our data: number of observations, mean, standard deviation, 10th, 50th and 90th percentile. Oursample consists of U.S. public parent companies that are in Compustat, are traded reference entities in the CDS market, have at least one bondoutstanding, are rated by S&P, and for which the disagreement measure can be calculated. Data is monthly from October 2008 to December 2012,with CDS trading data starting only August 2010. The CDS market is assumed to exist once and for all if in a month the firm is in the DTCCdata or has at least 3 dealers in the Markit data. The variables are defined as follows. assets is total assets from Compustat. debt is total longand short-term debt from Compustat. bonds outstanding (direct issue) is the total amount of bonds issued directly by the parent company withat least 1 year of maturity at issuance from Mergent FISD. bonds issued by subsidiaries is the total amount of bonds issued by subsidiaries of theparent with at least 1 year of maturity at issuance from Mergent FISD. other borrowing is non-bond debt defined as debt minus the sum of bondsoutstanding and bonds issued by subsidiaries. accounts payable is from Compustat. We set accounts payable to zero for financial firms, because itincludes deposits and is thus not comparable to non-financials. credit enhancement (dummy) is dummy variable indicating firms providing creditenhancement.net CDS and gross CDS are the net and gross notional CDS amounts, respectively, as reported by the DTCC. 5y CDS spread (bps)is the CDS spread from Markit in basis points. negative basis and positive basis are the absolute value of the smallest daily negative CDS-bondbasis and the largest daily positive CDS-bond basis across issuances of the same firm calculated using implementable trades of at least $1 millionnotional, averaged over the month. Firm-months for which a basis can be calculated but there is no positive maximum or negative minimum areset to zero. CDS volume (monthly) is total monthly CDS trading volume that constitute market risk activity, in dollars of notional as reportedby the DTCC. CDS turnover (monthly) is CDS volume divided by net CDS. bond volume (monthly) is the total monthly bond trading volume indollars of notional for all bonds a company has issued, taken from Trace Enhanced. bond turnover (monthly) is bond volume divided by bondsoutstanding. implied bond roundtrip cost is the implied roundtrip cost of paired bond trades from Trace Enhanced with trade volume above $1million. issuer bond Herfindahl is the Herfindahl measure of a firm’s bond issues based on Mergent FISD. bond fragmentation is negative log(issuerbond Herfindahl) orthogonalized to log(bonds outstanding). S&P rating (notch) captures a firm’s S&P rating; it takes value 1 for AAA, 2 forAA+, etc. The maximum value, 22, indicates that the bond has defaulted. disagreement: analyst std/price is defined as the standard deviationof analyst earnings forecast from IBES normalized by stock price from CRSP if it is above $1. contractual heterogeneity (dummy) is an indicatorvariable of whether all bonds of the issuer have the same contractual features along 6 dimensions: callable, puttable, convertible, fixed coupon,covenants, credit enhancement. Amihud price impact is the change in value-weighted bond mid-price from the previous trading day to the nexttrading day divided by the bond volume on that day (in billions), averaged across issuances and days of the month for a firm. All dollar amountsare in billions. Continuous variables are winsorized at the 1% level (basis measures at the 2% level) every month.
(1) (2) (3) (4) (5) (6)VARIABLES N mean std p10 p50 p90
assets 22,229 51.22 191.3 2.641 10.63 79.55debt 22,229 14.13 65.82 0.690 3.005 17.08bonds outstanding (direct issue) 22,229 4.505 12.66 0.400 1.798 9.252bonds issued by subsidiaries 22,229 2.452 9.046 0 0 4.908other borrowing 22,229 7.861 50.63 0 0.321 5.670accounts payable 22,229 1.462 3.876 0 0.355 3.379credit enhancement (dummy) 22,229 0.00787 0.0884 0 0 0net CDS 13,411 1.035 0.869 0.317 0.817 1.870gross CDS 13,411 13.13 12.19 2.890 9.914 25.40net CDS / bonds (direct issue) 13,411 0.503 0.713 0.0758 0.261 1.138net CDS / bonds (incl. subsidiary) 13,411 0.364 0.535 0.0505 0.182 0.8595y CDS spread (bps) 19,705 249.2 369.0 50.71 138.8 541.3negative basis (%) 3,012 0.917 1.496 0 0.496 2.206positive basis (%) 3,012 0.206 0.575 0 0 0.554CDS volume (monthly) 7,781 0.516 0.646 0.0594 0.334 1.097CDS turnover (monthly) 7,781 0.506 0.344 0.142 0.437 0.950bond volume (monthly) 22,229 0.370 1.094 0.00261 0.0916 0.766bond turnover (monthly) 22,229 0.0716 0.0873 0.00456 0.0462 0.159implied bond roundtrip cost (%) 15,405 0.369 0.323 0.105 0.280 0.723issuer bond Herfindahl 22,229 0.330 0.271 0.0903 0.240 1bond fragmentation 22,229 0.0191 0.406 -0.525 0.0447 0.495S&P rating (notch) 22,229 9.212 3.042 6 9 13disagreement: analyst std/price 22,229 0.0135 0.0313 0.00147 0.00552 0.0260contractual heterogeneity (dummy) 22,229 0.671 0.470 0 1 1Amihud price impact 15,639 3.132 4.056 0.677 2.023 6.522
46

Tab
le2:
Net
noti
onal
CD
Sam
ounts
Th
ista
ble
pre
sents
the
resu
lts
of
ace
nso
red
regre
ssio
nof
net
CD
Son
pro
xie
sfo
rh
edgin
g,
spec
ula
tion
,b
on
dm
ark
etliqu
idit
yan
dco
ntr
ols
.F
or
vari
ab
led
efin
itio
ns
see
Tab
le1.
hig
hfr
agm
enta
tion
(du
mm
y)
isan
ind
icato
rvari
ab
leif
fragm
enta
tion
isab
ove
med
ian
.A
llre
gre
ssio
ns
incl
ud
eti
me
an
dra
tin
gd
um
mie
s.T
he
rati
ng
contr
ols
are
du
mm
ies
for:
AA
an
dab
ove,
A,
BB
B,
B,
CC
Can
db
elow
,w
hile
BB
isom
itte
d.
Colu
mn
(2)
incl
ud
esfi
rmfi
xed
effec
ts,
all
oth
erco
lum
ns
incl
ud
ein
du
stry
du
mm
ies
base
don
firs
t-d
igit
SIC
codes
.N
ote
that
the
con
stant
issu
bsu
med
by
the
contr
ol
du
mm
ies.
Wh
enin
clu
din
gfi
rmfi
xed
effec
ts,
we
on
lyin
clu
de
com
pan
ies
that
ap
pea
rin
the
DT
CC
data
at
least
on
ce.
Th
esa
mp
lep
erio
dis
Oct
ob
er2008
toD
ecem
ber
2012.
We
join
tly
esti
mate
het
erosk
edast
icit
yof
the
erro
rte
rmin
the
fun
ctio
nal
form
of
con
stant
plu
sa
coeffi
cien
tti
mes
bond
sou
tsta
nd
ing.
T-s
tats
are
giv
enin
pare
nth
eses
base
don
stan
dard
erro
rscl
ust
ered
by
firm
.***,
**,
an
d*
den
ote
sign
ifica
nce
at
the
1%
,5%
an
d10%
level
,re
spec
tivel
y.
(1)
(2)
(3)
(4)
(5)
(6)
(7)
(8)
(9)
net
CD
Sn
etC
DS
net
CD
Sn
etC
DS
net
CD
Sn
etC
DS
net
CD
Sn
etC
DS
net
CD
S
dis
agre
emen
t:an
aly
stst
d/p
rice
4.6
72∗∗
∗0.9
28∗∗
4.6
45∗∗
∗2.6
97∗∗
∗4.6
22∗∗
∗4.5
95∗∗
∗4.9
45∗∗
∗4.7
89∗∗
∗4.7
34∗∗
∗
(4.7
4)
(2.3
1)
(4.6
8)
(3.0
0)
(4.7
7)
(4.7
0)
(4.3
2)
(4.8
2)
(4.8
3)
bon
ds
outs
tan
din
g(d
irec
tis
sue)
0.0
777∗∗
∗0.0
138
0.0
651∗∗
∗0.0
874∗∗
∗0.0
772∗∗
∗0.0
764∗∗
∗0.0
875∗∗
∗0.0
692∗∗
∗0.0
705∗∗
∗
(7.3
0)
(1.3
6)
(5.3
4)
(7.1
5)
(7.4
3)
(7.4
0)
(6.9
1)
(7.1
3)
(7.1
6)
bon
dfr
agm
enta
tion
0.2
72∗∗
∗0.1
81∗∗
(3.4
1)
(2.1
6)
hig
hfr
agm
enta
tion
(du
mm
y)
0.2
72∗∗
∗
(4.2
7)
pre
det
erm
ined
bon
dfr
agm
enta
tion
0.1
65∗∗
(2.2
9)
contr
act
ual
het
erogen
eity
(du
mm
y)
0.2
91∗∗
∗0.2
35∗∗
∗
(3.9
7)
(3.0
4)
ass
ets
0.0
00936
(1.2
1)
bon
ds
issu
edby
sub
sid
iari
es0.0
0732
(1.1
0)
oth
erb
orr
ow
ing
-0.0
0535∗∗
(-2.0
6)
acc
ou
nts
payab
le0.0
163∗∗
(2.5
2)
cred
iten
han
cem
ent
(du
mm
y)
2.2
15∗∗
∗
(4.6
3)
rati
ng
contr
ols
Yes
Yes
Yes
Yes
Yes
Yes
Yes
Yes
Yes
tim
efi
xed
effec
tsY
esY
esY
esY
esY
esY
esY
esY
esY
esin
du
stry
fixed
effec
tsY
esN
oY
esY
esY
esY
esY
esY
esY
esfi
rmfi
xed
effec
tsN
oY
esN
oN
oN
oN
oN
oN
oN
oN
um
ber
of
Fir
ms
496
302
496
496
496
496
431
496
496
Nu
mb
erof
Ob
serv
ati
on
s22229
13946
22229
22229
22229
22229
19606
22229
22229
47

Tab
le3:
Bond
and
CD
Str
adin
gvolu
me
Each
pair
of
colu
mn
rep
ort
sth
ere
sult
sof
ajo
int
tob
itre
gre
ssio
nof
CD
Svolu
me
(lef
tco
lum
n)
an
db
on
dvolu
me
(rig
ht
colu
mn
)on
pro
xie
sfo
rh
edgin
g,
spec
ula
tion
,b
on
dm
ark
etli
qu
idit
yan
dco
ntr
ols
.F
or
vari
ab
led
efin
itio
ns
see
Tab
le1,
for
contr
ol
defi
nit
ion
sse
eT
ab
le2.
Th
esa
mp
leco
nsi
sts
of
firm
sw
ith
net
CD
Sre
port
edin
the
DT
CC
data
.N
ote
that
the
con
stant
issu
bsu
med
by
the
contr
ol
du
mm
ies.
Th
esa
mp
lep
erio
dis
Au
gu
st2010
toD
ecem
ber
2012.
We
join
tly
esti
mate
het
erosk
edast
icit
yof
the
erro
rte
rmin
both
regre
ssio
ns
inth
efu
nct
ion
al
form
of
con
stant
plu
sa
coeffi
cien
tti
mes
bon
ds
ou
tsta
nd
ing.
Th
eer
ror
term
sin
the
two
regre
ssio
ns
are
allow
edto
be
corr
elate
d.
T-s
tats
are
giv
enin
pare
nth
eses
base
don
stan
dard
erro
rscl
ust
ered
by
firm
.***,
**,
an
d*
den
ote
sign
ifica
nce
at
the
1%
,5%
an
d10%
level
,re
spec
tivel
y.A
tth
eb
ott
om
of
the
tab
lew
ep
rese
nt
the
prob
ab
ilit
y(p
-valu
e)
of
the
hyp
oth
esi
sth
at
the
regress
or
has
the
sam
ecoeffi
cie
nt
inb
oth
the
CD
San
dth
eb
on
dm
arket.
(1)
(2)
(3)
(4)
(5)
CD
Sb
on
dC
DS
bon
dC
DS
bon
dC
DS
bon
dC
DS
bon
dvolu
me
volu
me
volu
me
volu
me
volu
me
volu
me
volu
me
volu
me
volu
me
volu
me
bon
ds
ou
tsta
nd
ing
(dir
ect
issu
e)0.0
283∗∗
∗0.0
862∗∗
∗0.0
156∗∗
∗0.1
64∗∗
∗0.0
284∗∗
∗0.0
896∗∗
∗0.0
281∗∗
∗0.0
881∗∗
∗0.0
269∗∗
∗0.0
893∗∗
∗
(8.9
4)
(29.7
2)
(2.7
9)
(11.9
0)
(9.0
6)
(28.5
4)
(9.0
1)
(29.6
1)
(8.5
2)
(29.3
8)
dis
agre
emen
t:an
aly
stst
d/p
rice
4.5
94∗∗
∗0.4
27
3.3
52∗∗
∗0.2
08
4.8
31∗∗
∗0.3
50
4.8
90∗∗
∗0.3
91
4.8
25∗∗
∗0.3
67
(3.2
9)
(1.1
4)
(2.9
4)
(1.0
8)
(3.4
2)
(0.9
0)
(3.4
4)
(1.0
8)
(3.5
5)
(1.0
4)
bon
dfr
agm
enta
tion
0.0
825∗∗
-0.0
377∗∗
∗
(2.0
5)
(-3.8
8)
hig
hfr
agm
enta
tion
(du
mm
y)
0.0
899∗∗
∗-0
.0201∗∗
∗
(2.7
4)
(-3.4
5)
contr
act
ual
het
erogen
eity
(du
mm
y)
0.0
843∗∗
-0.0
173∗∗
∗
(2.5
2)
(-2.9
7)
rati
ng
contr
ols
Yes
Yes
Yes
Yes
Yes
Yes
Yes
Yes
Yes
Yes
tim
efi
xed
effec
tsY
esY
esY
esY
esY
esY
esY
esY
esY
esY
esin
du
stry
fixed
effec
tsY
esY
esN
oN
oY
esY
esY
esY
esY
esY
esfi
rmfi
xed
effec
tsN
oN
oY
esY
esN
oN
oN
oN
oN
oN
oN
um
ber
of
Fir
ms
288
287
288
288
288
Nu
mb
erof
Ob
serv
ati
on
s8041
8029
8041
8041
8041
p-v
alu
e:la
rger
coeff
.on
dis
agre
emen
tfo
rC
DS
0.0
05
0.0
07
0.0
02
0.0
03
0.0
02
p-v
alu
e:la
rger
coeff
.on
bon
ds
ou
tst.
for
bond
s0.0
00
0.0
00
0.0
00
0.0
00
0.0
00
p-v
alu
e:la
rger
coeff
.on
fragm
enta
tion
for
CD
S0.0
04
0.0
01
p-v
alu
e:la
rger
coeff
.on
contr
.h
eter
.fo
rC
DS
0.0
02
48

Tab
le4:
Bond
fragm
enta
tion
and
bond
liquid
ity
Colu
mn
s(1
)-(3
)p
rese
nt
resu
lts
ofan
OL
Sre
gre
ssio
nofb
on
dro
un
dtr
iptr
ad
ing
cost
s.C
olu
mn
s(4
)-(6
)are
tob
itre
gre
ssio
ns
ofm
onth
lyb
on
dm
ark
ettu
rnover
.T
he
right
han
dsi
de
vari
ab
les
are
mea
sure
sof
bon
dm
ark
etfr
agm
enta
tion
,co
ntr
act
ual
het
erogen
eity
an
dco
ntr
ols
.F
or
vari
ab
led
efin
itio
ns
see
Tab
le1,
for
contr
ol
defi
nit
ion
sse
eT
ab
le2.
Note
that
the
con
stant
issu
bsu
med
by
the
contr
ol
du
mm
ies.
Th
esa
mp
lep
erio
dis
Oct
ob
er2008
toD
ecem
ber
2012.
T-s
tats
are
giv
enin
pare
nth
eses
base
don
het
erosk
edast
icit
y-c
on
sist
ent
stan
dard
erro
rscl
ust
ered
by
firm
s.***,
**,
an
d*
den
ote
sign
ifica
nce
at
the
1%
,5%
an
d10%
level
,re
spec
tivel
y.
(1)
(2)
(3)
(4)
(5)
(6)
rou
nd
trip
cost
rou
nd
trip
cost
rou
nd
trip
cost
turn
over
turn
over
turn
over
bon
dfr
agm
enta
tion
0.0
426∗∗
∗0.0
388∗∗
∗-0
.0199∗∗
∗-0
.0186∗∗
∗
(3.9
0)
(3.4
5)
(-3.9
8)
(-3.8
5)
contr
act
ual
het
erogen
eity
(du
mm
y)
0.0
246∗∗
0.0
121
-0.0
101∗∗
-0.0
0398
(2.4
6)
(1.1
7)
(-2.5
4)
(-1.1
3)
log(b
on
ds
ou
tsta
nd
ing)
-0.0
0881∗
-0.0
124∗∗
-0.0
108∗∗
0.0
154∗∗
∗0.0
171∗∗
∗0.0
162∗∗
∗
(-1.7
0)
(-2.2
5)
(-1.9
9)
(8.9
8)
(9.6
0)
(9.0
7)
dis
agre
emen
t:an
aly
stst
d/p
rice
2.1
45∗∗
∗2.1
46∗∗
∗2.1
46∗∗
∗0.0
948∗∗
0.0
911∗∗
0.0
933∗∗
(7.2
6)
(7.4
1)
(7.2
8)
(2.1
4)
(1.9
9)
(2.1
2)
tim
efi
xed
effec
tsY
esY
esY
esY
esY
esY
esin
du
stry
fixed
effec
tsY
esY
esY
esY
esY
esY
esra
tin
gco
ntr
ols
Yes
Yes
Yes
Yes
Yes
Yes
Nu
mb
erof
Fir
ms
487
487
487
496
496
496
Nu
mb
erof
Ob
serv
ati
on
s15405
15405
15405
22229
22229
22229
R-s
qu
are
d0.2
40
0.2
38
0.2
40
49

Table 5: Net notional CDS amounts and the CDS-bond basis
This table presents the results of a censored regression of net CDS on the positive basis and negative basis and proxies for hedging, speculation,bond liquidity and controls. For variable definitions see Table 1, for control definitions see Table 2. We calculate the basis for firms with CDSquotes from at least 3 dealers in Markit and at least one fixed coupon bond without embedded options that matures within 1-30 years. We calculatethe basis using an implementable basis trade: First, we use only bond trades of at least $1m in notional size. Second, we calculate the positivebasis based on the bond bid price and and the negative basis based on the bond ask price. Third, for the negative basis we take the minimumamong bonds of the firm every day, for the positive basis the maximum. We then average over the month. Note that the constant is subsumedby the control dummies. The sample period is October 2008 to December 2012. We jointly estimate heteroskedasticity of the error term in bothregressions in the functional form of constant plus a coefficient times bonds outstanding. T-stats are given in parentheses based on standard errorsclustered by firm. ***, **, and * denote significance at the 1%, 5% and 10% level, respectively.
(1) (2) (3) (4) (5) (6) (7)net CDS net CDS net CDS net CDS net CDS net CDS net CDS
negative basis (implementable) 0.0888∗∗∗ 0.0290∗∗∗ 0.203∗∗∗ 0.0923∗∗∗ 0.179∗∗∗ 0.127∗∗∗ 0.267∗∗∗
(2.61) (2.86) (4.16) (2.88) (3.39) (3.11) (4.40)TED spread * neg. basis -0.104∗∗∗ -0.0840∗∗∗
(-3.87) (-3.73)fragmentation * neg. basis -0.104 -0.158∗∗
(-1.34) (-2.08)roundtrip cost * neg. basis -0.123∗∗ -0.0729∗∗
(-2.48) (-2.12)disagreement * neg. basis -1.029∗∗∗ -0.721
(-2.90) (-1.29)positive basis (implementable) -0.0291 0.00230 0.0523 -0.0700 0.0280 -0.000358 -0.0495
(-0.23) (0.09) (0.39) (-0.49) (0.13) (-0.00) (-0.18)TED spread * pos. basis -0.0926 0.103
(-1.12) (1.20)fragmentation * pos. basis 0.490∗ 0.420
(1.70) (1.23)roundtrip cost * pos. basis -0.0794 -0.0473
(-0.88) (-0.54)disagreement * pos. basis -0.238 -0.270
(-0.34) (-0.36)bond fragmentation 0.258 0.275
(1.35) (1.42)implied bond roundtrip cost for large trades (%) 0.329∗∗ 0.204∗
(2.47) (1.67)disagreement: analyst std/price 7.656∗∗∗ 2.354∗∗∗ 7.767∗∗∗ 7.054∗∗∗ 7.902∗∗∗ 9.047∗∗∗ 8.825∗∗∗
(4.95) (4.66) (5.29) (4.85) (3.15) (7.13) (2.63)bonds outstanding (direct issue) 0.0524∗∗∗ 0.0000943 0.0523∗∗∗ 0.0542∗∗∗ 0.0516∗∗∗ 0.0527∗∗∗ 0.0525∗∗∗
(5.14) (0.01) (5.14) (5.15) (4.75) (5.11) (4.72)rating controls Yes Yes Yes Yes Yes Yes Yestime fixed effects Yes Yes Yes Yes Yes Yes Yesindustry fixed effects Yes No Yes Yes Yes Yes Yesfirm fixed effects No Yes No No No No NoNumber of Firms 123 97 123 123 120 123 120Number of Observations 2730 2422 2730 2730 2423 2730 2423
50

Tab
le6:
The
negati
ve
basi
sand
the
stre
ngth
of
the
basi
str
ade
Th
ista
ble
pre
sents
the
resu
lts
of
an
OL
Sre
gre
ssio
nof
the
neg
ati
ve
basi
son
the
stre
ngth
of
the
basi
str
ad
ean
dp
roxie
sfo
rh
edgin
g,
spec
ula
tion
,b
on
dliqu
idit
yan
dco
ntr
ols
.S
ince
the
neg
ati
ve
basi
sis
an
esti
mate
dvari
ab
le,
this
regre
ssio
nis
the
seco
nd
step
ina
two-s
tep
esti
mati
on
.T
he
sam
ple
on
lyin
clu
des
firm
-month
ob
serv
ati
on
sfo
rfi
rms
wit
hat
least
on
eb
on
dw
ith
an
egati
ve
basi
sth
at
month
.T
he
stre
ngth
of
the
basi
str
ad
eis
gra
ph
edan
dd
escr
ibed
inF
igu
re5.
For
vari
ab
led
efin
itio
ns
see
Tab
le1,
for
contr
ol
defi
nit
ion
sse
eT
ab
le2,
for
the
defi
nit
ion
of
the
basi
sse
eT
ab
le5.
Th
esa
mp
lep
erio
dis
Oct
ob
er2008
toD
ecem
ber
2012.
T-s
tats
are
giv
enin
pare
nth
eses
base
don
boots
trap
ped
stan
dard
erro
rsb
ase
don
1,0
00
boots
trap
ped
sam
ple
sd
raw
nby
firs
tre
sam
plin
gd
ate
san
dth
enre
sam
plin
gfi
rms
wit
hin
each
date
.W
eth
enap
ply
the
two-s
tep
esti
mati
on
pro
ced
ure
toea
chb
oots
trap
ped
sam
ple
toca
lcu
late
the
stan
dard
dev
iati
on
of
the
esti
mate
dco
effici
ents
.***,
**,
an
d*
den
ote
sign
ifica
nce
at
the
1%
,5%
an
d10%
level
,re
spec
tivel
y.
(1)
(2)
(3)
(4)
(5)
(6)
(7)
(8)
(9)
neg
.b
asi
sn
eg.
basi
sn
eg.
basi
sn
eg.
basi
sn
eg.
basi
sn
eg.
basi
sn
eg.
basi
sn
eg.
basi
sn
eg.
basi
sst
ren
gth
of
basi
str
ad
e-2
.895∗∗
∗-2
.624∗∗
∗-2
.210∗∗
∗-0
.282∗∗
-0.2
91∗∗
∗-0
.242∗
-0.2
73∗∗
-0.2
79∗∗
∗-0
.229∗
(-4.7
5)
(-4.9
1)
(-5.0
9)
(-2.5
1)
(-2.7
4)
(-1.9
4)
(-2.3
5)
(-2.5
8)
(-1.8
0)
stre
ngth
of
basi
str
ad
e*
cris
is-7
.004∗∗
∗-7
.128∗∗
∗-6
.873∗∗
∗-6
.128∗∗
∗-5
.676∗∗
∗-5
.096∗∗
∗
(-4.2
7)
(-4.4
0)
(-4.6
0)
(-2.9
4)
(-2.9
1)
(-2.7
4)
TE
Dsp
read
0.0
594
0.0
759
0.0
871
(0.2
5)
(0.3
3)
(0.3
8)
TE
Dsp
read
*cr
isis
0.1
30
0.2
38
0.3
10
(0.1
7)
(0.3
2)
(0.4
3)
cris
is(d
um
my)
2.4
78∗∗
∗2.3
98∗∗
∗2.3
76∗∗
∗2.2
30∗∗
∗1.9
79∗∗
∗1.8
60∗∗
∗
(7.0
0)
(6.9
1)
(6.7
6)
(3.2
4)
(3.0
8)
(2.8
8)
log(b
on
ds
ou
tsta
nd
ing)
-0.0
909
-0.3
01∗
0.0
151
0.4
52∗∗
0.0
173
0.4
61∗∗
(-1.5
1)
(-1.6
8)
(0.3
4)
(2.3
2)
(0.3
9)
(2.2
9)
dis
agre
emen
t:an
aly
stst
d/p
rice
15.3
4∗∗
20.4
3∗∗
7.7
37
10.8
77.9
30
11.3
5∗
(2.1
9)
(2.3
9)
(1.4
5)
(1.6
1)
(1.4
8)
(1.6
8)
bon
dfr
agm
enta
tion
0.1
73
0.2
20∗∗
0.2
27
(1.5
6)
(2.2
6)
(1.4
3)
con
stant
2.0
46∗∗
∗2.3
74∗∗
∗0.8
28∗∗
∗1.3
06∗∗
∗0.8
09∗∗
∗1.2
76∗∗
∗
(8.0
8)
(7.6
7)
(18.8
1)
(7.4
2)
(9.0
9)
(8.1
3)
ind
ust
ryfi
xed
effec
tsN
oY
esN
oN
oY
esN
oN
oY
esN
ora
tin
gco
ntr
ols
No
Yes
Yes
No
Yes
Yes
No
Yes
Yes
firm
fixed
effec
tsN
oN
oY
esN
oN
oY
esN
oN
oY
esN
um
ber
of
Date
s51
51
51
51
51
51
51
51
51
Nu
mb
erof
Fir
ms
120
120
120
120
120
120
120
120
120
Nu
mb
erof
Ob
serv
ati
on
s2112
2112
2112
2112
2112
2112
2112
2112
2112
R-s
qu
are
d0.1
16
0.2
39
0.4
39
0.3
03
0.3
97
0.5
61
0.3
04
0.4
00
0.5
65
51

Tab
le7:
Pri
ceim
pact
inth
eb
ond
mark
et
and
the
stre
ngth
of
the
basi
str
ade
Th
ista
ble
pre
sents
the
resu
lts
of
an
OL
Sre
gre
ssio
nof
pri
ceim
pact
inth
eb
on
dm
ark
eton
the
stre
ngth
of
the
basi
str
ad
e.T
he
left
-han
dsi
de
vari
ab
leis
the
Am
ihu
dp
rice
imp
act
mea
sure
of
illiqu
idit
yof
the
bon
dm
ark
etfo
ra
giv
enfi
rmin
agiv
enm
onth
.T
he
right-
han
dsi
de
vari
ab
les
are
the
stre
ngth
of
the
basi
str
ad
ean
dp
roxie
sfo
rh
edgin
g,
spec
ula
tion
,b
on
dliqu
idit
yan
dco
ntr
ols
.S
ince
the
neg
ati
ve
basi
sis
an
esti
mate
dvari
ab
le,
this
regre
ssio
nis
the
seco
nd
step
ina
two-s
tep
esti
mati
on
.T
od
efin
eA
mih
ud
pri
ceim
pact
we
firs
tca
lcu
late
the
ab
solu
tevalu
eof
the
per
centa
ge
chan
ge
inth
em
id-p
rice
of
afi
rm’s
spec
ific
bon
dis
sue
from
the
pre
vio
us
dayt−
1to
the
nex
ttr
ad
ing
dayt
+1
div
ided
by
bon
dtr
ad
ing
volu
me
on
that
trad
ing
dayt
(in
$b
illion
sif
volu
me
exce
eds
$1
million
).W
eth
enaggre
gate
(aver
age)
this
acr
oss
all
days
an
db
on
dis
sues
of
agiv
enfi
rmin
agiv
enm
onth
.T
his
resu
lts
ina
sim
ilar
mea
sure
of
illi
qu
idit
yas
the
on
ein
trod
uce
dby
Am
ihu
d(2
002)
for
stock
s.T
he
stre
ngth
of
the
basi
str
ad
eis
gra
ph
edan
dd
escr
ibed
inF
igu
re5.
For
vari
ab
led
efin
itio
ns
see
Tab
le1,
for
contr
ol
defi
nit
ion
sse
eT
ab
le2.
Th
esa
mp
lep
erio
dis
Oct
ob
er2008
toD
ecem
ber
2012.
T-s
tats
are
giv
enin
pare
nth
eses
base
don
boots
trap
ped
stan
dard
erro
rsb
ase
don
1,0
00
boots
trap
ped
sam
ple
sd
raw
nby
firs
tre
sam
plin
gd
ate
sand
then
resa
mp
lin
gfi
rms
wit
hin
each
date
.W
eth
enap
ply
the
two-s
tep
esti
mati
on
pro
cedu
reto
each
boots
trap
ped
sam
ple
toca
lcu
late
the
stan
dard
dev
iati
on
of
the
esti
mate
dco
effici
ents
.***,
**,
an
d*
den
ote
sign
ifica
nce
at
the
1%
,5%
an
d10%
level
,re
spec
tivel
y.
(1)
(2)
(3)
(4)
(5)
(6)
(7)
(8)
(9)
Am
ihu
dA
mih
ud
Am
ihu
dA
mih
ud
Am
ihu
dA
mih
ud
Am
ihu
dA
mih
ud
Am
ihu
dst
ren
gth
of
basi
str
ad
e-3
.597∗∗
∗-2
.954∗∗
∗-2
.677∗∗
∗0.1
26
0.0
753
-0.0
214
0.3
74
0.3
48
0.2
58
(-3.7
0)
(-3.6
0)
(-3.9
5)
(0.3
3)
(0.2
0)
(-0.0
6)
(1.0
4)
(1.0
2)
(0.7
7)
stre
ngth
of
basi
str
ad
e*
cris
is-1
4.2
3∗∗
∗-1
2.6
7∗∗
∗-1
2.2
8∗∗
∗-5
.221∗∗
-3.3
90∗
-2.8
70
(-4.4
6)
(-4.1
1)
(-4.1
7)
(-2.5
4)
(-1.8
7)
(-1.5
2)
TE
Dsp
read
1.6
17∗∗
1.7
92∗∗
∗1.8
50∗∗
∗
(2.3
8)
(2.7
9)
(2.8
5)
TE
Dsp
read
*cr
isis
0.4
26
0.3
25
0.3
23
(0.4
4)
(0.3
7)
(0.3
8)
cris
is(d
um
my)
4.6
75∗∗
∗4.0
60∗∗
∗3.8
42∗∗
∗2.3
69∗∗
∗1.7
14∗∗
∗1.4
62∗∗
(6.5
0)
(5.7
7)
(5.3
8)
(3.3
9)
(2.8
5)
(2.3
7)
log(b
on
ds
outs
tan
din
g)
-0.6
48∗∗
∗-1
.615∗∗
∗-0
.553∗∗
∗-0
.624∗∗
∗-0
.560∗∗
∗-0
.581∗∗
(-9.9
7)
(-6.1
4)
(-10.6
3)
(-2.6
7)
(-10.9
8)
(-2.3
3)
dis
agre
emen
t:an
aly
stst
d/p
rice
35.0
5∗∗
∗39.5
6∗∗
∗25.6
1∗∗
∗27.3
7∗∗
∗25.4
3∗∗
∗27.3
8∗∗
∗
(8.0
7)
(7.3
2)
(6.5
6)
(5.3
2)
(6.7
2)
(5.7
3)
bon
dfr
agm
enta
tion
0.6
93∗∗
∗-0
.194
0.7
35∗∗
∗0.1
31
0.7
51∗∗
∗0.1
08
(5.0
6)
(-0.3
6)
(5.8
3)
(0.2
6)
(6.7
7)
(0.2
2)
con
stant
4.1
12∗∗
∗3.8
94∗∗
∗2.3
73∗∗
∗2.6
39∗∗
∗1.8
48∗∗
∗2.0
53∗∗
∗
(9.9
1)
(10.9
1)
(18.2
5)
(15.3
4)
(8.3
6)
(14.2
6)
ind
ust
ryfi
xed
effec
tsN
oY
esN
oN
oY
esN
oN
oY
esN
ora
tin
gco
ntr
ols
No
Yes
Yes
No
Yes
Yes
No
Yes
Yes
firm
fixed
effec
tsN
oN
oY
esN
oN
oY
esN
oN
oY
esN
um
ber
of
Date
s51
51
51
51
51
51
51
51
51
Nu
mb
erof
Fir
ms
469
469
469
469
469
469
469
469
469
Nu
mb
erof
Ob
serv
ati
on
s15639
15639
15639
15639
15639
15639
15639
15639
15639
R-s
qu
are
d0.0
305
0.1
33
0.2
59
0.1
26
0.2
00
0.3
11
0.1
42
0.2
18
0.3
28
52

Online Appendix: Additional Robustness Checks
53

Tab
le8:
Net
noti
on
al
CD
Sam
ounts
wit
hdiff
ere
nt
hedgin
gpro
xie
sand
size
contr
ols
Th
ista
ble
rep
eats
the
cen
sore
dre
gre
ssio
nan
aly
sis
of
Tab
le2
colu
mn
(1)
(rep
eate
din
this
tab
leas
colu
mn
(1))
usi
ng
diff
eren
tp
roxie
sfo
rh
edgin
gan
dad
dit
ion
al
contr
ols
.n
etd
ebt
isd
efin
edas
deb
tm
inu
sca
shan
dca
sheq
uiv
ale
nts
.b
ook
lever
age
isd
efin
edas
deb
tover
ass
ets.
idio
syn
crati
cst
ock
vola
tility
isth
est
an
dard
dev
iati
on
of
the
resi
du
al
of
3fa
ctor
Fam
a-F
ren
chre
gre
ssio
nof
the
month
lyst
ock
retu
rnof
the
firm
usi
ng
a5
yea
rro
llin
gw
ind
ow
.C
DX
NA
IGin
dex
isan
ind
icato
rvari
ab
lew
het
her
the
CD
Sof
the
firm
isa
con
stit
uen
tof
the
CD
XN
ort
hA
mer
ica
Inves
tmen
tG
rad
ein
dex
.C
DX
NA
HY
ind
exis
an
ind
icato
rvari
ab
lew
het
her
the
CD
Sof
the
firm
isa
con
stit
uen
tof
the
CD
XN
ort
hA
mer
ica
Hig
hY
ield
ind
ex.
CD
Svola
tility
(%,
lagged
)is
defi
ned
as
the
%st
an
dard
dev
iati
on
of
daily
CD
Ssp
read
chan
ges
over
60
days
bef
ore
the
start
of
the
month
.C
DS
spre
ad
incr
ease
(%,
lagged
)is
the
%ch
an
ge
of
the
CD
Ssp
read
over
the
pre
vio
us
month
over
the
CD
Ssp
read
at
the
beg
inn
ing
of
the
pre
vio
us
month
ifth
ech
an
ge
isp
osi
tive,
zero
oth
erw
ise.
CD
Ssp
read
dro
p(%
,la
gged
)is
the
chan
ge
of
CD
Ssp
read
over
the
pre
vio
us
month
over
the
CD
Ssp
read
at
the
beg
inn
ing
of
the
pre
vio
us
month
ifth
ech
an
ge
isn
egati
ve,
zero
oth
erw
ise.
For
ad
dit
ion
al
vari
ab
led
efin
itio
ns
see
Tab
le1,
for
contr
ol
defi
nit
ion
sse
eT
ab
le2.
We
join
tly
esti
mate
het
erosk
edast
icit
yof
the
erro
rte
rmin
the
fun
ctio
nal
form
of
con
stant
plu
sa
coeffi
cien
tti
mes
bon
ds
ou
tsta
nd
ing.
Th
esa
mp
lep
erio
dis
Oct
ob
er2008
toD
ecem
ber
2012.
T-s
tats
are
giv
enin
pare
nth
eses
base
don
stan
dard
erro
rscl
ust
ered
by
firm
.***,
**,
an
d*
den
ote
sign
ifica
nce
at
the
1%
,5%
an
d10%
level
,re
spec
tivel
y.
alt
ern
ati
ve
size
&debt
measu
res,
contr
ols
(1)
(2)
(3)
(4)
(5)
(6)
(7)
(8)
(9)
(10)
(11)
(12)
net
CD
Snet
CD
Snet
CD
Snet
CD
Snet
CD
Snet
CD
Snet
CD
Snet
CD
Snet
CD
Snet
CD
Snet
CD
Snet
CD
S
bonds
outs
tandin
g(d
irect
issu
e)
0.0
777∗∗∗
0.0
831∗∗∗
0.0
825∗∗∗
0.0
623∗∗∗
0.0
787∗∗∗
0.0
650∗∗∗
0.0
810∗∗∗
0.0
528∗∗∗
0.0
739∗∗∗
(7.3
0)
(6.7
9)
(6.9
7)
(5.4
3)
(7.5
3)
(5.5
7)
(6.3
5)
(7.6
7)
(7.2
7)
debt
0.0
0609
-0.0
0151
(1.4
6)
(-1.0
6)
net
debt
0.0
0515
-0.0
0241
(0.9
4)
(-1.2
4)
ass
ets
0.0
0334∗∗∗
0.0
0113
0.0
0101
(5.8
6)
(1.5
2)
(1.3
8)
book
levera
ge
-0.3
72∗
-0.3
09
(-1.8
0)
(-1.4
4)
dis
agre
em
ent:
analy
stst
d/pri
ce
4.6
72∗∗∗
4.9
42∗∗∗
4.6
25∗∗∗
4.9
71∗∗∗
4.6
24∗∗∗
4.7
83∗∗∗
4.5
85∗∗∗
4.5
56∗∗∗
4.5
35∗∗∗
5.5
81∗∗∗
3.8
10∗∗∗
4.4
64∗∗∗
(4.7
4)
(5.2
0)
(4.7
6)
(5.1
7)
(4.7
6)
(4.8
6)
(4.7
0)
(4.7
4)
(4.6
8)
(6.5
8)
(4.0
3)
(4.5
5)
bond
fragm
enta
tion
0.3
24∗∗∗
0.2
62∗∗∗
0.3
08∗∗∗
0.2
61∗∗∗
0.3
34∗∗∗
0.2
91∗∗∗
0.2
89∗∗∗
0.3
03∗∗∗
0.2
52∗∗∗
0.1
75∗∗
0.2
35∗∗∗
(3.7
4)
(3.2
9)
(3.5
6)
(3.2
6)
(3.7
7)
(3.6
1)
(3.5
8)
(3.7
0)
(2.8
6)
(2.5
3)
(2.9
3)
idio
syncra
tic
(sto
ck)
vola
tility
2.9
87∗∗∗
(2.6
3)
CD
XN
AIG
index
(dum
my)
0.9
67∗∗∗
(12.9
5)
CD
XN
AH
Yin
dex
(dum
my)
0.7
46∗∗∗
(6.9
2)
CD
Svola
tility
(%,
lagged)
0.0
913
(0.1
2)
CD
Ssp
read
incre
ase
(%,
lagged)
1.0
34∗∗∗
(10.8
4)
CD
Ssp
read
dro
p(%
,la
gged)
-1.9
39∗∗∗
(-11.8
2)
rati
ng
contr
ols
Yes
Yes
Yes
Yes
Yes
Yes
Yes
Yes
Yes
Yes
Yes
Yes
tim
efi
xed
eff
ects
Yes
Yes
Yes
Yes
Yes
Yes
Yes
Yes
Yes
Yes
Yes
Yes
indust
ryfi
xed
eff
ects
Yes
Yes
Yes
Yes
Yes
Yes
Yes
Yes
Yes
Yes
Yes
Yes
Num
ber
of
Fir
ms
496
496
496
496
496
496
496
496
496
407
496
450
Num
ber
of
Obse
rvati
ons
22229
22229
22229
22229
22229
22229
22229
22229
22229
15679
22229
18599
54

Tab
le9:
Net
noti
on
al
CD
Sam
ounts
wit
ha
diff
ere
nt
pro
xy
for
specu
lati
ve
dem
and
Colu
mn
s(1
)-(3
)of
this
tab
lere
pea
tth
ece
nso
red
regre
ssio
nan
aly
sis
of
Tab
le2
colu
mn
(1),
wh
ile
colu
mn
s(4
)-(6
)re
pea
tth
ean
aly
sis
of
Tab
le2
colu
mn
(2)
usi
ng
ad
iffer
ent
pro
xy
for
spec
ula
tion
.T
he
ori
gin
al
regre
ssio
ns
are
rep
eate
dh
ere
inco
lum
ns
(1)
an
d(4
)over
the
sam
esu
bsa
mp
lew
her
eth
en
ewp
roxy
isavailab
lest
art
ing
Au
gu
st2010.
log(C
DS
volu
me/
bon
dvolu
me)
mea
sure
sth
elo
gof
CD
Svolu
me
tob
on
dvolu
me.
For
furt
her
vari
ab
led
efin
itio
ns
see
Tab
le1,
for
contr
ol
defi
nit
ion
sse
eT
ab
le2.
We
join
tly
esti
mate
het
erosk
edast
icit
yof
the
erro
rte
rmin
the
fun
ctio
nal
form
of
con
stant
plu
sa
coeffi
cien
tti
mes
bon
ds
ou
tsta
nd
ing.
Th
esa
mp
lep
erio
dis
Oct
ob
er2008
toD
ecem
ber
2012.
T-s
tats
are
giv
enin
pare
nth
eses
base
don
stan
dard
erro
rscl
ust
ered
by
firm
.***,
**,
an
d*
den
ote
sign
ifica
nce
at
the
1%
,5%
an
d10%
level
,re
spec
tivel
y.
alt
ern
ati
ve
dis
agre
emen
tm
easu
res
(1)
(2)
(3)
(4)
(5)
(6)
net
CD
Sn
etC
DS
net
CD
Sn
etC
DS
net
CD
Sn
etC
DS
log(C
DS
volu
me/
bon
dvolu
me)
0.1
12∗∗
∗0.1
12∗∗
∗0.0
0765∗∗
∗0.0
0766∗∗
∗
(9.7
9)
(9.7
4)
(2.7
3)
(2.7
2)
dis
agre
emen
t:an
aly
stst
d/p
rice
3.8
53∗∗
∗3.5
52∗∗
∗0.4
18
0.4
19
(2.8
0)
(3.0
5)
(0.6
7)
(0.6
6)
bon
ds
ou
tsta
nd
ing
(dir
ect
issu
e)0.0
474∗∗
∗0.0
690∗∗
∗0.0
687∗∗
∗0.0
0705
0.0
0899
0.0
0900
(6.6
0)
(6.2
2)
(6.2
3)
(1.1
2)
(1.4
2)
(1.4
2)
bon
dfr
agm
enta
tion
0.1
46∗∗
0.1
18∗∗
0.1
33∗∗
(2.3
7)
(2.1
6)
(2.4
7)
rati
ng
contr
ols
Yes
Yes
Yes
Yes
Yes
Yes
tim
efi
xed
effec
tsY
esY
esY
esY
esY
esY
esin
du
stry
fixed
effec
tsY
esY
esY
esN
oN
oN
ofi
rmfi
xed
effec
tsN
oN
oN
oY
esY
esY
esN
um
ber
of
Fir
ms
287
287
287
287
287
287
Nu
mb
erof
Ob
serv
ati
on
s7735
7735
7735
7735
7735
7735
55

Tab
le10:
Bond
an
dC
DS
tradin
gvolu
me
wit
hdiff
ere
nt
hedgin
gpro
xie
sand
size
contr
ols
Colu
mn
s(1
)-(4
)in
this
tab
lere
pea
tth
eto
bit
regre
ssio
nan
aly
sis
of
Tab
le3
spec
ifica
tion
(3),
wh
ile
colu
mn
(5)
rep
eats
the
an
aly
sis
of
Tab
le3
spec
ifica
tion
(2),
usi
ng
diff
eren
tp
roxie
sfo
rh
edgin
gan
dad
dit
ion
al
contr
ols
for
size
.F
or
vari
ab
led
efin
itio
ns
see
Tab
le1,
for
contr
ol
defi
nit
ion
sse
eT
ab
le2.
Th
esa
mp
leco
nsi
sts
of
firm
sw
ith
net
CD
Sre
port
edin
the
DT
CC
data
.T
he
sam
ple
per
iod
isA
ugu
st2010
toD
ecem
ber
2012.
We
join
tly
esti
mate
het
erosk
edast
icit
yof
the
erro
rte
rmin
both
regre
ssio
ns
inth
efu
nct
ion
al
form
of
con
stant
plu
sa
coeffi
cien
tti
mes
bon
ds
ou
tsta
nd
ing.
Th
eer
ror
term
sin
the
two
regre
ssio
ns
are
allow
edto
be
corr
elate
d.
T-s
tats
are
giv
enin
pare
nth
eses
base
don
stan
dard
erro
rscl
ust
ered
by
firm
.***,
**,
an
d*
den
ote
sign
ifica
nce
at
the
1%
,5%
an
d10%
level
,re
spec
tivel
y.A
tth
eb
ott
om
of
the
tab
lew
ep
rese
nt
the
prob
ab
ilit
y(p
-valu
e)
of
the
hyp
oth
esi
sth
at
the
regress
or
has
the
sam
ecoeffi
cie
nt
inb
oth
the
CD
San
dth
eb
on
dm
arket.
(1)
(2)
(3)
(4)
(5)
CD
Sb
on
dC
DS
bon
dC
DS
bon
dC
DS
bond
CD
Sb
on
dvolu
me
volu
me
volu
me
volu
me
volu
me
volu
me
volu
me
volu
me
volu
me
volu
me
bon
ds
ou
tsta
nd
ing
(dir
ect
issu
e)0.0
208∗∗
∗0.0
894∗∗
∗0.0
261∗∗
∗0.0
896∗∗
∗0.0
174∗∗
∗0.0
893∗∗
∗0.0
161∗∗
∗0.0
892∗∗
∗0.0
206∗∗
∗0.1
64∗∗
∗
(5.5
6)
(28.1
4)
(8.3
5)
(28.5
9)
(4.6
4)
(28.2
0)
(4.3
0)
(28.1
5)
(3.6
4)
(11.9
7)
bon
ds
issu
edby
sub
sid
iari
es0.0
0977∗∗
-0.0
00507
0.0
0587∗
-0.0
0130∗
0.0
147∗∗
∗0.0
0721∗
(2.5
4)
(-0.7
3)
(1.7
8)
(-1.9
0)
(3.5
0)
(1.7
2)
oth
erb
orr
ow
ing
0.0
0305∗∗
∗0.0
0108
0.0
0116
0.0
00831
0.0
0478
-0.0
0752∗∗
(4.1
6)
(0.9
2)
(1.1
6)
(0.6
8)
(1.6
0)
(-2.4
6)
ass
ets
0.0
00961∗∗
∗0.0
00183∗
0.0
00696∗∗
∗0.0
00208∗
0.0
00458
0.0
00175
(4.9
9)
(1.6
6)
(2.6
2)
(1.7
4)
(0.7
9)
(0.6
5)
dis
agre
emen
t:an
aly
stst
d/p
rice
4.8
88∗∗
∗0.3
62
4.9
83∗∗
∗0.3
42
4.8
51∗∗
∗0.3
50
4.9
58∗∗
∗0.3
39
3.3
11∗∗
∗0.2
23
(3.4
9)
(0.9
5)
(3.5
4)
(0.8
9)
(3.4
5)
(0.9
4)
(3.5
4)
(0.9
5)
(2.8
9)
(1.0
8)
bon
dfr
agm
enta
tion
0.0
887∗∗
-0.0
368∗∗
∗0.1
00∗∗
-0.0
377∗∗
∗0.0
972∗∗
-0.0
369∗∗
∗0.1
06∗∗
∗-0
.0367∗∗
∗
(2.2
0)
(-3.8
4)
(2.4
9)
(-3.8
9)
(2.4
2)
(-3.8
8)
(2.6
4)
(-3.8
6)
rati
ng
contr
ols
Yes
Yes
Yes
Yes
Yes
Yes
Yes
Yes
Yes
Yes
tim
efi
xed
effec
tsY
esY
esY
esY
esY
esY
esY
esY
esY
esY
esin
du
stry
fixed
effec
tsY
esY
esY
esY
esY
esY
esY
esY
esN
oN
ofi
rmfi
xed
effec
tsN
oN
oN
oN
oN
oN
oN
oN
oY
esY
esN
um
ber
of
Fir
ms
288
288
288
288
287
Nu
mb
erof
Ob
serv
ati
on
s8041
8041
8041
8041
8029
p-v
alu
e:la
rger
coeff
.on
dis
agre
emen
tfo
rC
DS
0.0
02
0.0
01
0.0
02
0.0
01
0.0
08
p-v
alu
e:la
rger
coeff
.on
bon
ds
ou
tst.
for
bond
s0.0
00
0.0
00
0.0
00
0.0
00
0.0
00
p-v
alu
e:la
rger
coeff
.on
fragm
enta
tion
for
CD
S0.0
02
0.0
01
0.0
01
0.0
01
56
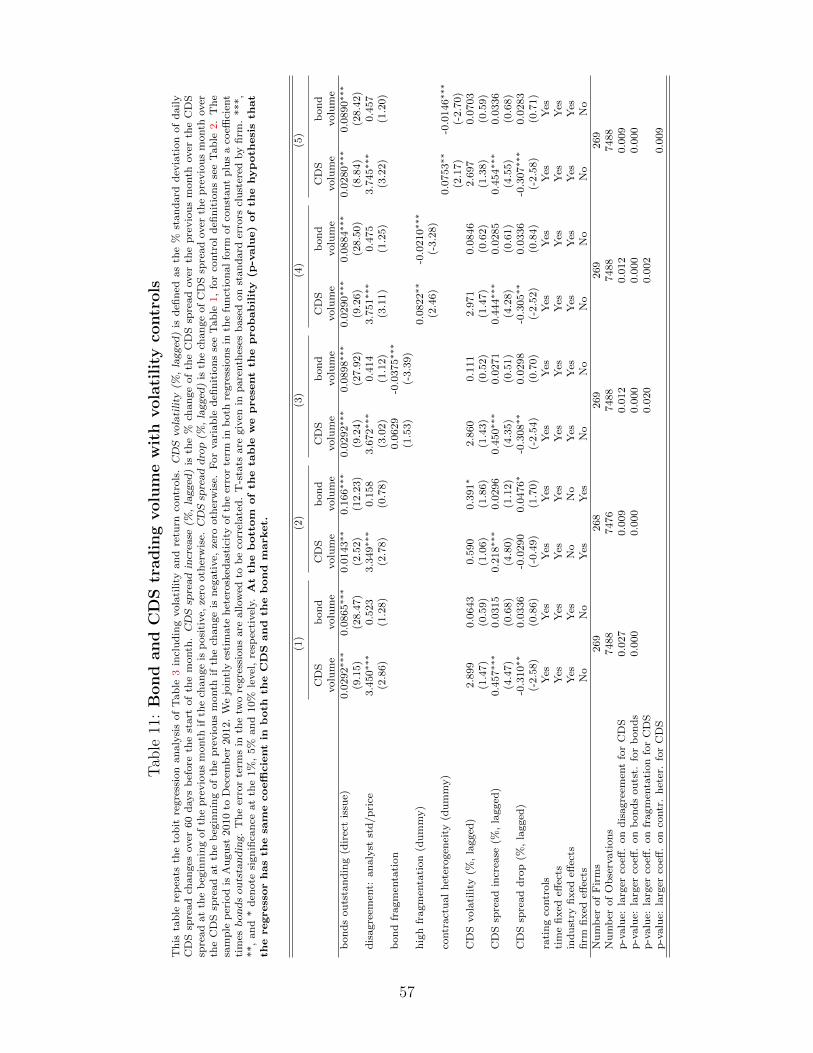
Tab
le11:
Bon
dand
CD
Str
adin
gvolu
me
wit
hvola
tili
tyco
ntr
ols
Th
ista
ble
rep
eats
the
tob
itre
gre
ssio
nan
aly
sis
of
Tab
le3
incl
ud
ing
vola
tility
an
dre
turn
contr
ols
.C
DS
vola
tility
(%,
lagged
)is
defi
ned
as
the
%st
an
dard
dev
iati
on
of
daily
CD
Ssp
read
chan
ges
over
60
days
bef
ore
the
start
of
the
month
.C
DS
spre
ad
incr
ease
(%,
lagged
)is
the
%ch
an
ge
of
the
CD
Ssp
read
over
the
pre
vio
us
month
over
the
CD
Ssp
read
at
the
beg
inn
ing
of
the
pre
vio
us
month
ifth
ech
an
ge
isp
osi
tive,
zero
oth
erw
ise.
CD
Ssp
read
dro
p(%
,la
gged
)is
the
chan
ge
of
CD
Ssp
read
over
the
pre
vio
us
month
over
the
CD
Ssp
read
at
the
beg
inn
ing
of
the
pre
vio
us
month
ifth
ech
an
ge
isn
egati
ve,
zero
oth
erw
ise.
For
vari
ab
led
efin
itio
ns
see
Tab
le1,
for
contr
ol
defi
nit
ion
sse
eT
ab
le2.
Th
esa
mp
lep
erio
dis
Au
gu
st2010
toD
ecem
ber
2012.
We
join
tly
esti
mate
het
erosk
edast
icit
yof
the
erro
rte
rmin
both
regre
ssio
ns
inth
efu
nct
ion
al
form
of
con
stant
plu
sa
coeffi
cien
tti
mes
bond
sou
tsta
nd
ing.
Th
eer
ror
term
sin
the
two
regre
ssio
ns
are
allow
edto
be
corr
elate
d.
T-s
tats
are
giv
enin
pare
nth
eses
base
don
stan
dard
erro
rscl
ust
ered
by
firm
.***,
**,
an
d*
den
ote
sign
ifica
nce
at
the
1%
,5%
an
d10%
level
,re
spec
tivel
y.A
tth
eb
ott
om
of
the
tab
lew
ep
rese
nt
the
prob
ab
ilit
y(p
-valu
e)
of
the
hyp
oth
esi
sth
at
the
regress
or
has
the
sam
ecoeffi
cie
nt
inb
oth
the
CD
San
dth
eb
on
dm
arket.
(1)
(2)
(3)
(4)
(5)
CD
Sb
on
dC
DS
bon
dC
DS
bon
dC
DS
bon
dC
DS
bon
dvolu
me
volu
me
volu
me
volu
me
volu
me
volu
me
volu
me
volu
me
volu
me
volu
me
bon
ds
ou
tsta
nd
ing
(dir
ect
issu
e)0.0
292∗∗
∗0.0
865∗∗
∗0.0
143∗∗
0.1
66∗∗
∗0.0
292∗∗
∗0.0
898∗∗
∗0.0
290∗∗
∗0.0
884∗∗
∗0.0
280∗∗
∗0.0
890∗∗
∗
(9.1
5)
(28.4
7)
(2.5
2)
(12.2
3)
(9.2
4)
(27.9
2)
(9.2
6)
(28.5
0)
(8.8
4)
(28.4
2)
dis
agre
emen
t:an
aly
stst
d/p
rice
3.4
50∗∗
∗0.5
23
3.3
49∗∗
∗0.1
58
3.6
72∗∗
∗0.4
14
3.7
51∗∗
∗0.4
75
3.7
45∗∗
∗0.4
57
(2.8
6)
(1.2
8)
(2.7
8)
(0.7
8)
(3.0
2)
(1.1
2)
(3.1
1)
(1.2
5)
(3.2
2)
(1.2
0)
bon
dfr
agm
enta
tion
0.0
629
-0.0
375∗∗
∗
(1.5
3)
(-3.3
9)
hig
hfr
agm
enta
tion
(du
mm
y)
0.0
822∗∗
-0.0
210∗∗
∗
(2.4
6)
(-3.2
8)
contr
act
ual
het
erogen
eity
(du
mm
y)
0.0
753∗∗
-0.0
146∗∗
∗
(2.1
7)
(-2.7
0)
CD
Svola
tility
(%,
lagged
)2.8
99
0.0
643
0.5
90
0.3
91∗
2.8
60
0.1
11
2.9
71
0.0
846
2.6
97
0.0
703
(1.4
7)
(0.5
9)
(1.0
6)
(1.8
6)
(1.4
3)
(0.5
2)
(1.4
7)
(0.6
2)
(1.3
8)
(0.5
9)
CD
Ssp
read
incr
ease
(%,
lagged
)0.4
57∗∗
∗0.0
315
0.2
18∗∗
∗0.0
296
0.4
50∗∗
∗0.0
271
0.4
44∗∗
∗0.0
285
0.4
54∗∗
∗0.0
336
(4.4
7)
(0.6
8)
(4.8
0)
(1.1
2)
(4.3
5)
(0.5
1)
(4.2
8)
(0.6
1)
(4.5
5)
(0.6
8)
CD
Ssp
read
dro
p(%
,la
gged
)-0
.310∗∗
0.0
336
-0.0
290
0.0
476∗
-0.3
08∗∗
0.0
298
-0.3
05∗∗
0.0
336
-0.3
07∗∗
∗0.0
283
(-2.5
8)
(0.8
6)
(-0.4
9)
(1.7
0)
(-2.5
4)
(0.7
0)
(-2.5
2)
(0.8
4)
(-2.5
8)
(0.7
1)
rati
ng
contr
ols
Yes
Yes
Yes
Yes
Yes
Yes
Yes
Yes
Yes
Yes
tim
efi
xed
effec
tsY
esY
esY
esY
esY
esY
esY
esY
esY
esY
esin
du
stry
fixed
effec
tsY
esY
esN
oN
oY
esY
esY
esY
esY
esY
esfi
rmfi
xed
effec
tsN
oN
oY
esY
esN
oN
oN
oN
oN
oN
oN
um
ber
of
Fir
ms
269
268
269
269
269
Nu
mb
erof
Ob
serv
ati
on
s7488
7476
7488
7488
7488
p-v
alu
e:la
rger
coeff
.on
dis
agre
emen
tfo
rC
DS
0.0
27
0.0
09
0.0
12
0.0
12
0.0
09
p-v
alu
e:la
rger
coeff
.on
bon
ds
ou
tst.
for
bond
s0.0
00
0.0
00
0.0
00
0.0
00
0.0
00
p-v
alu
e:la
rger
coeff
.on
fragm
enta
tion
for
CD
S0.0
20
0.0
02
p-v
alu
e:la
rger
coeff
.on
contr
.h
eter
.fo
rC
DS
0.0
09
57

Tab
le12:
Bond
fragm
enta
tion
and
bond
liquid
ity:
usi
ng
firm
sw
ith
at
least
3b
onds
Th
ista
ble
rep
eats
the
an
aly
sis
of
Tab
le4
usi
ng
on
lyfi
rms
wh
ich
have
at
least
3b
on
ds
ou
tsta
nd
ing.
Colu
mn
s(1
)-(3
)p
rese
nt
resu
lts
of
an
OL
Sre
gre
ssio
nof
bon
dro
un
dtr
iptr
ad
ing
cost
s.C
olu
mn
s(4
)-(6
)are
tob
itre
gre
ssio
ns
of
month
lyb
on
dm
ark
ettu
rnover
.F
or
vari
ab
led
efin
itio
ns
see
Tab
le1,
for
contr
ol
defi
nit
ion
sse
eT
ab
le2.
Th
esa
mp
lep
erio
dis
Oct
ob
er2008
toD
ecem
ber
2012.
T-s
tats
are
giv
enin
pare
nth
eses
base
don
het
erosk
edast
icit
y-c
on
sist
ent
stan
dard
erro
rscl
ust
ered
by
firm
s.***,
**,
an
d*
den
ote
sign
ifica
nce
at
the
1%
,5%
an
d10%
level
,re
spec
tivel
y.
(1)
(2)
(3)
(4)
(5)
(6)
rou
nd
trip
cost
rou
nd
trip
cost
rou
nd
trip
cost
turn
over
turn
over
turn
over
bon
dfr
agm
enta
tion
0.0
425∗∗
∗0.0
395∗∗
∗-0
.0169∗∗
∗-0
.0161∗∗
∗
(3.3
3)
(3.0
9)
(-3.3
7)
(-3.2
1)
contr
act
ual
het
erogen
eity
(du
mm
y)
0.0
254∗∗
0.0
191∗
-0.0
0706∗∗
-0.0
0504
(2.2
0)
(1.6
6)
(-2.2
1)
(-1.6
2)
log(b
on
ds
ou
tsta
nd
ing)
-0.0
0905
-0.0
146∗∗
-0.0
111∗
0.0
140∗∗
∗0.0
162∗∗
∗0.0
146∗∗
∗
(-1.4
5)
(-2.2
5)
(-1.7
4)
(7.1
9)
(8.0
0)
(7.1
8)
dis
agre
emen
t:an
aly
stst
d/p
rice
2.0
44∗∗
∗2.0
61∗∗
∗2.0
49∗∗
∗0.1
29∗∗
∗0.1
24∗∗
∗0.1
27∗∗
∗
(6.3
2)
(6.4
6)
(6.3
5)
(2.8
3)
(2.6
6)
(2.7
8)
tim
efi
xed
effec
tsY
esY
esY
esY
esY
esY
esin
du
stry
fixed
effec
tsY
esY
esY
esY
esY
esY
esra
tin
gco
ntr
ols
Yes
Yes
Yes
Yes
Yes
Yes
Nu
mb
erof
Fir
ms
422
422
422
427
427
427
Nu
mb
erof
Ob
serv
ati
on
s13327
13327
13327
17444
17444
17444
R-s
qu
are
d0.2
48
0.2
46
0.2
48
58

Table 13: Net notional CDS amounts: CDS-bond basis using average basis
This table repeats the censored regression analysis of Table 5 using a different definition of the basis. negative avg. basis is the average basis of allthe bonds of a firm every day and then averaged over the month if this number is negative and zero otherwise. positive avg. basis is the averagebasis of all the bonds of a firm every day and then averaged over the month if this number is positive and zero otherwise. For both, the bond yieldis defined as the average yield for trades over $ 1 million (irrespective of being bid, ask or interdealer price). For variable definitions see Table 1, forcontrol definitions see Table 2. We jointly estimate heteroskedasticity of the error term in the functional form of constant plus a coefficient timesbonds outstanding. The sample period is October 2008 to December 2012. T-stats are given in parentheses based on standard errors clustered byfirm. ***, **, and * denote significance at the 1%, 5% and 10% level, respectively.
(1) (2) (3) (4) (5) (6) (7)net CDS net CDS net CDS net CDS net CDS net CDS net CDS
negative avg. basis 0.107∗∗ 0.0275∗ 0.238∗∗∗ 0.121∗∗∗ 0.189∗∗∗ 0.157∗∗∗ 0.326∗∗∗
(2.46) (1.71) (4.23) (2.90) (2.84) (3.13) (4.47)negative avg. basis * TED spread -0.126∗∗∗ -0.122∗∗∗
(-3.78) (-3.67)fragmentation * neg. basis -0.135∗ -0.203∗∗
(-1.65) (-2.51)roundtrip cost * neg. basis -0.124∗∗ -0.0683∗
(-2.39) (-1.89)disagreement * neg. basis -1.536∗∗∗ -0.949∗∗
(-3.11) (-2.03)positive avg. basis -0.0457 -0.00967 0.0960 0.0523 -0.0863 0.0137 0.0262
(-0.74) (-0.97) (0.62) (0.76) (-0.37) (0.07) (0.09)positive avg. basis * TED spread -0.141 -0.0703
(-1.27) (-1.33)fragmentation * pos. basis 0.383∗∗ 0.308
(2.17) (0.93)roundtrip cost * pos. basis -0.00413 0.0298
(-0.07) (0.49)disagreement * pos. basis -0.343 -0.171
(-0.71) (-0.44)bond fragmentation 0.302 0.316
(1.53) (1.63)implied bond roundtrip cost for large trades (%) 0.340∗∗ 0.183
(2.48) (1.49)disagreement: analyst std/price 7.782∗∗∗ 2.373∗∗∗ 7.867∗∗∗ 7.326∗∗∗ 7.992∗∗∗ 11.08∗∗∗ 9.163∗∗∗
(5.76) (4.63) (6.07) (5.48) (3.28) (5.71) (3.48)bonds outstanding (direct issue) 0.0522∗∗∗ 0.00180 0.0528∗∗∗ 0.0548∗∗∗ 0.0512∗∗∗ 0.0525∗∗∗ 0.0533∗∗∗
(5.22) (0.22) (5.29) (5.23) (4.85) (5.30) (4.93)rating controls Yes Yes Yes Yes Yes Yes Yestime fixed effects Yes Yes Yes Yes Yes Yes Yesindustry fixed effects Yes No Yes Yes Yes Yes Yesfirm fixed effects No Yes No No No No NoNumber of Firms 123 97 123 123 120 123 120Number of Observations 2759 2451 2759 2759 2445 2759 2445
59