the agrometeorological information system – · pdf file275 the agrometeorological...
TRANSCRIPT
275
The Agrometeorological Information System – AgIS
Giampiero Maracchi1
Introduction
In the last decades several changes occurred in the field of agriculture and forestry. In the industrialized countries a specific attention has been devoted to the quality of products and to the environmental safety. On the other hand, in developing countries, due to the huge population increase, a strong need of food commodities exists along with a concern to maintain the sustainability of the system and reduce the danger of desertification and land degradation. In any case, the perspectives of climatic changes due to the global processes highlight the issues of forecasting the impacts of agricultural practices and on the environment (Maracchi and Sivakumar 2000). At present, sensible changes in the general circulation pattern have occurred, both atmospheric and oceanic, as well as in the energy balance of the surface and in the increase of extreme events in temperate areas.
In the meantime the world policy and economy changed to a more global perspective and relevant efforts have been made in the research of new technologies. Earth observation from space, progress in the field of computer science, information technology via the Internet system, development of electronic devices for monitoring environmental parameters, numerical meteorological models, crop models and seasonal climatological models for climate prediction, improved substantially our ability to measure, compute and control the natural processes (Maracchi et al. 1997).
Despite such improvements, our capacities did not develop at the same rate because of several reasons, i.e. difficulties in adapting to such rapid changes both in terms of mentality and of professional skills, lack of innovative organisation and the poor capability to face new situations and possibilities (Rijks et al. 1996). The last argument applies specially in the public sector where any change of the established structure means a risk in terms of employment or impacts on relevant economic interests. 1 IATA-CNR – P.le delle Cascine, 18 – 50145 Firenze, Italy Fax. +39 +55 308910 – Tel. +39 +55 301422, E-mail: [email protected]
276
In particular in the agrometeorological sector, it is now time to shift from a philosophy of "agrometeorological bulletin" to a more innovative concept of "Meteoinformation System for Agriculture".
The Role of Bulletins
The meteorological bulletins for agriculture were thought, since the fifties, to give information concerning the main meteorological parameters such as sunshine, temperature, wind, rainfall and evaporation for a better crop management to the farmers and/or extension services. But since then, some indications have come from international agencies, such as WMO and FAO, to integrate this information with biological data on crops, on the related pests etc.
The guide to agricultural meteorological practices (WMO 1981) prepared by the WMO Commission for Agricultural Meteorology (CAgM), underlines in each chapter how agricultural meteorology depends on the combination of meteorological and biological data as well as on the agricultural practices. In the annex 1E (Outline of a general syllabus), soil science, plant physiology, plant pathology and biometeorological interrelationships are mentioned as crucial parts of the skills of an agrometeorologist.
Although a division of agricultural meteorology has been established in the majority of the meteorological services around the world, the products of this division deal in many cases only with meteorological or climatological data. The bulletin, once printed, is the product with the largest diffusion and is now often available on the web-pages.
In general, 90 % of the extents of the bulletin consists of tables of meteorological data and only 10 % of the bulletin provides some qualitative estimates of the progress of agricultural season, on the pests occurring or on some similar qualitative information.
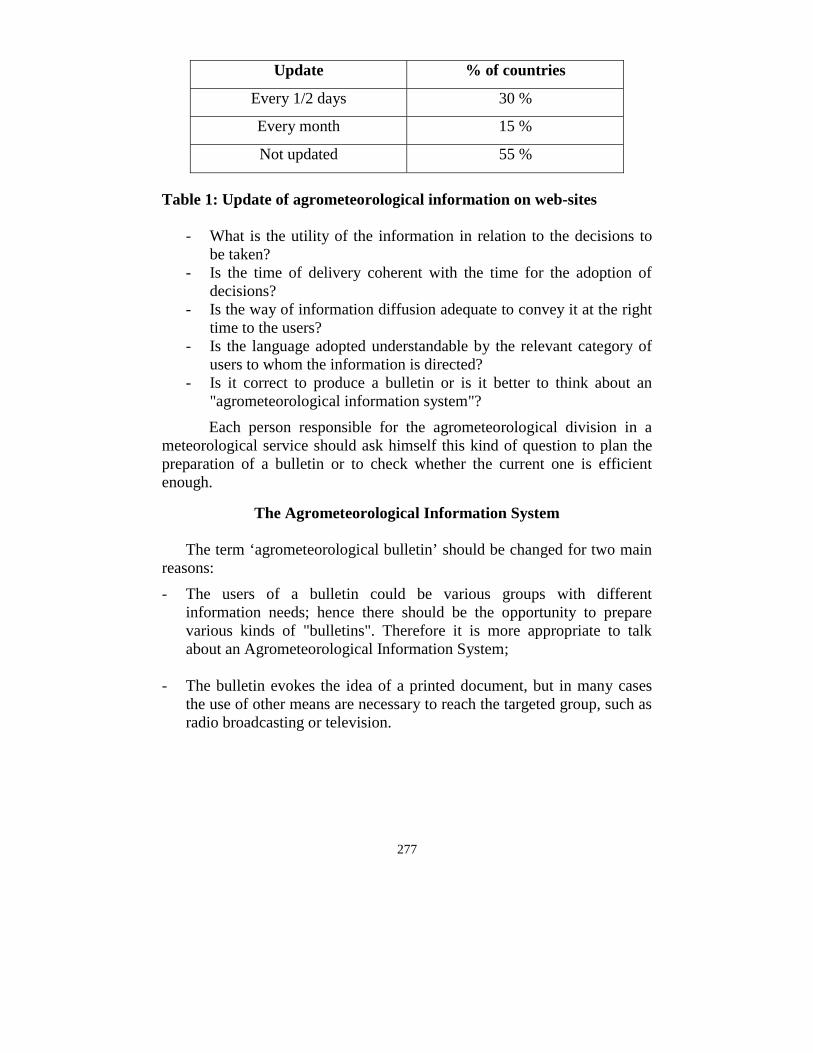
Unfortunately on many web-sites (more than 50% of the observed cases), the information on the predicted and monitored status of the growing season is published critically late. In another 20% of the web-sites, the information is updated with a delay of two days, which can often make the same information totally useless. Table 1 below is given as an example.
To improve the production and the dissemination of information to agriculture in a useful manner, the following questions should be addressed:
- To whom is the information directed?
277
Update % of countries
Every 1/2 days 30 %
Every month 15 %
Not updated 55 %
Table 1: Update of agrometeorological information on web-sites
- What is the utility of the information in relation to the decisions to be taken?
- Is the time of delivery coherent with the time for the adoption of decisions?
- Is the way of information diffusion adequate to convey it at the right time to the users?
- Is the language adopted understandable by the relevant category of users to whom the information is directed?
- Is it correct to produce a bulletin or is it better to think about an "agrometeorological information system"?
Each person responsible for the agrometeorological division in a meteorological service should ask himself this kind of question to plan the preparation of a bulletin or to check whether the current one is efficient enough.
The Agrometeorological Information System
The term ‘agrometeorological bulletin’ should be changed for two main reasons:
- The users of a bulletin could be various groups with different information needs; hence there should be the opportunity to prepare various kinds of "bulletins". Therefore it is more appropriate to talk about an Agrometeorological Information System;
- The bulletin evokes the idea of a printed document, but in many cases
the use of other means are necessary to reach the targeted group, such as radio broadcasting or television.
278
The first step is to define the targeted group to be reached. The main groups identified are the following:
- Decision makers and the extension services for agriculture and environment
- Farmers - Businessmen
Decision makers
The decision-makers are interested in monitoring the agricultural season to help the farmers in adverse years and to provide agroclimatological information for agricultural planning (WMO 2000). Concerning the first item, the information is required some time in advance, concerning the production of the main crops, generally at a level of aggregation corresponding to the administrative subdivisions of the country. The preparation of this type of information needs the conversion of meteorological data into crop yields in a format comparable with the statistical data of historic series. In a certain way, it is possible to state the departure from the average yields of each area as well as the evaluation of the acreage of the crop to compute the production.
Another important information for the decision makers is on extreme events causing damages to the agricultural system or to the environment, as in the case of hurricanes, extreme droughts, floods, frosts, strong winds, very intense rainfall etc. In that case, the users need to know the area affected and the intensity of the phenomena. Farmers
The farmers are interested:
a) Before the beginning of the season, to know the characteristics of the season in order to plan, where possible, which crops to grow. This was completely beyond the forecast possibilities in the past. Nowadays, progress in the seasonal climatology combined with the earth observation from space of the sea surface temperature, brings the time closer when this will be possible operationally for many areas;
b) During the season, the farmers require information which allows them to take decisions in terms of crop management, whether to sow or not, to spray or not, to irrigate or not and if the decision is made to irrigate what should be, the amount of irrigation etc.
279
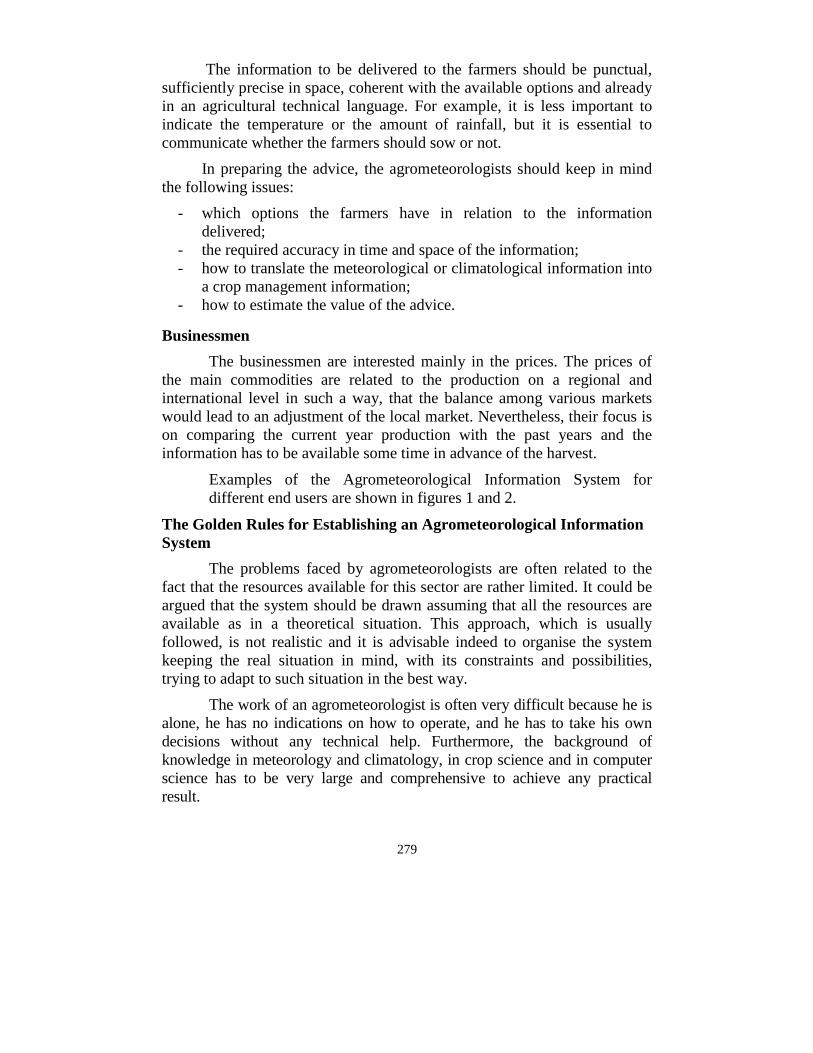
The information to be delivered to the farmers should be punctual, sufficiently precise in space, coherent with the available options and already in an agricultural technical language. For example, it is less important to indicate the temperature or the amount of rainfall, but it is essential to communicate whether the farmers should sow or not.
In preparing the advice, the agrometeorologists should keep in mind the following issues:
- which options the farmers have in relation to the information delivered;
- the required accuracy in time and space of the information; - how to translate the meteorological or climatological information into
a crop management information; - how to estimate the value of the advice.
Businessmen
The businessmen are interested mainly in the prices. The prices of the main commodities are related to the production on a regional and international level in such a way, that the balance among various markets would lead to an adjustment of the local market. Nevertheless, their focus is on comparing the current year production with the past years and the information has to be available some time in advance of the harvest.
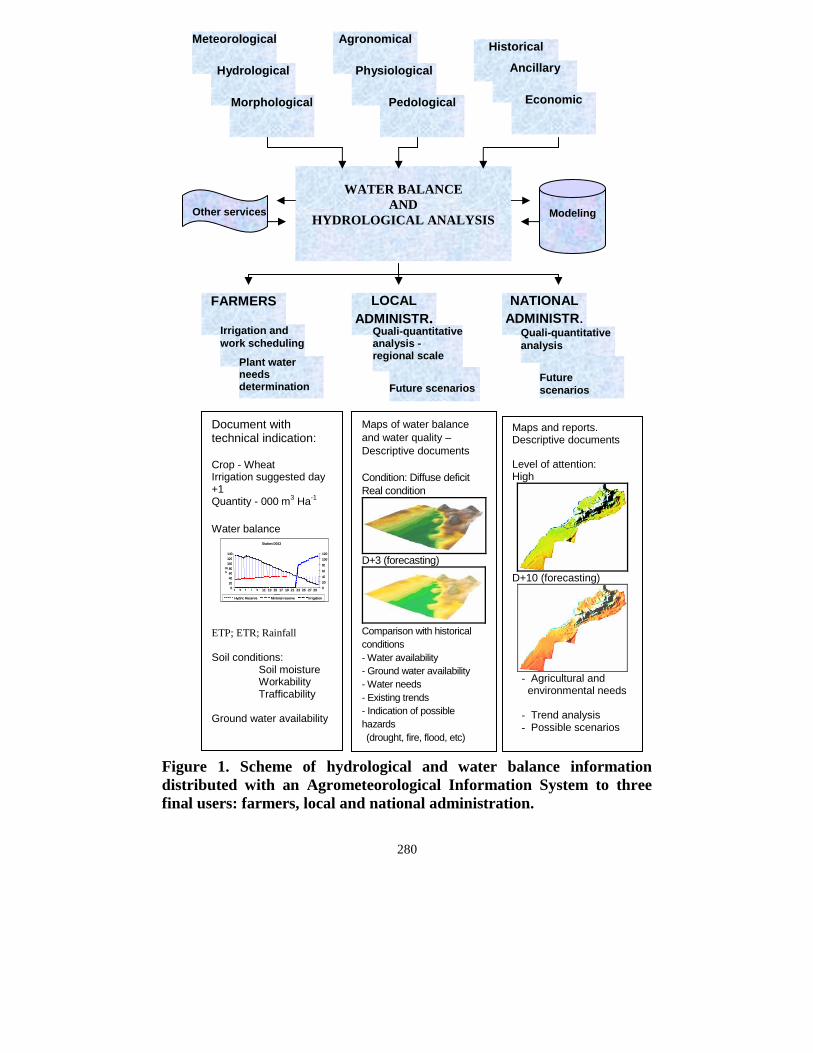
Examples of the Agrometeorological Information System for different end users are shown in figures 1 and 2.
The Golden Rules for Establishing an Agrometeorological Information System
The problems faced by agrometeorologists are often related to the fact that the resources available for this sector are rather limited. It could be argued that the system should be drawn assuming that all the resources are available as in a theoretical situation. This approach, which is usually followed, is not realistic and it is advisable indeed to organise the system keeping the real situation in mind, with its constraints and possibilities, trying to adapt to such situation in the best way.
The work of an agrometeorologist is often very difficult because he is alone, he has no indications on how to operate, and he has to take his own decisions without any technical help. Furthermore, the background of knowledge in meteorology and climatology, in crop science and in computer science has to be very large and comprehensive to achieve any practical result.
280
Figure 1. Scheme of hydrological and water balance information distributed with an Agrometeorological Information System to three final users: farmers, local and national administration.
Meteorological
Hydrological
Agronomical
Physiological
WATER BALANCE
AND HYDROLOGICAL ANALYSIS
FARMERS LOCAL ADMINISTR.
NATIONAL ADMINISTR.
Irrigation and work scheduling
Quali-quantitative analysis - regional scale
Quali-quantitative analysis
Plant water needs determination
Future scenarios
Future scenarios
Pedological
Historical
Ancillary
Economic Morphological
Document with technical indication: Crop - Wheat Irrigation suggested day +1 Quantity - 000 m3 Ha-1 Water balance ETP; ETR; Rainfall Soil conditions: Soil moisture
Workability Trafficability
Ground water availability
Maps of water balance and water quality – Descriptive documents Condition: Diffuse deficit Real condition
D+3 (forecasting)
Comparison with historical conditions - Water availability - Ground water availability - Water needs - Existing trends - Indication of possible hazards (drought, fire, flood, etc)
Maps and reports. Descriptive documents Level of attention: High
D+10 (forecasting)
- Agricultural and
environmental needs
- Trend analysis - Possible scenarios
Modeling Other services
Station D013
020406080
100120140
1 3 5 7 9 11 13 15 17 19 21 23 25 27 29mm
mm
020406080100120
Hydric Reserve Minimal reserve Irrigation
281
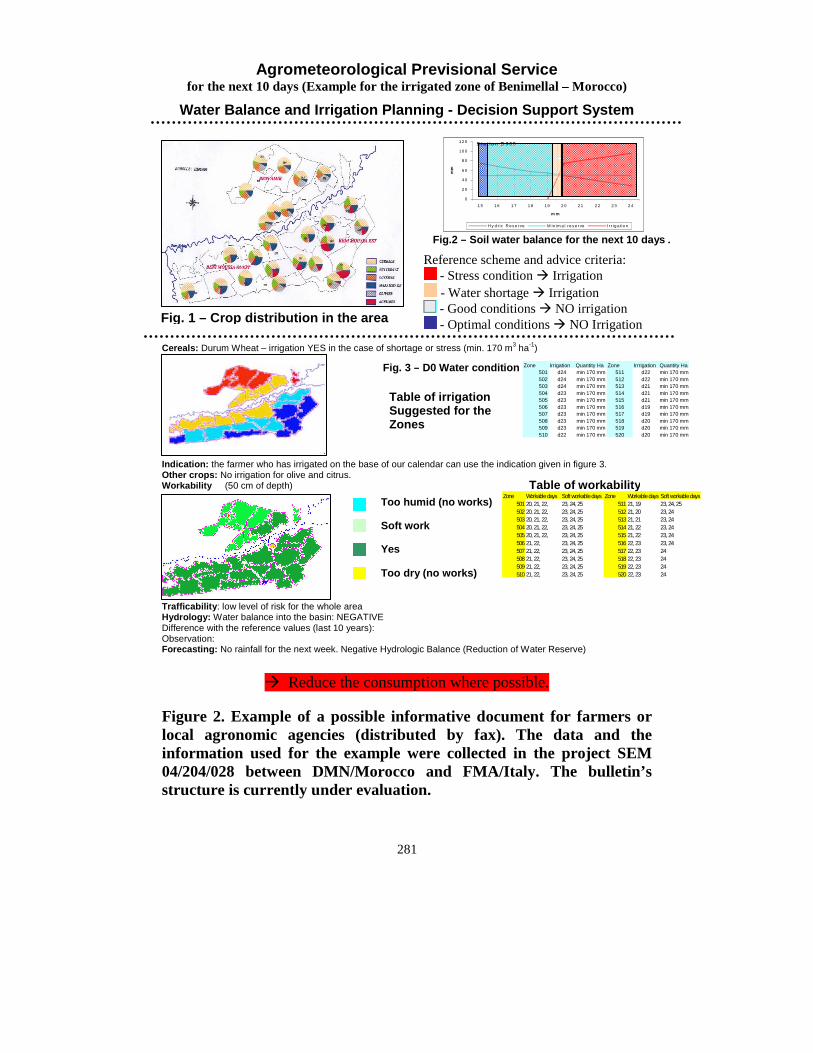
Agrometeorological Previsional Service for the next 10 days (Example for the irrigated zone of Benimellal – Morocco)
Water Balance and Irrigation Planning - Decision Support System
Cereals: Durum Wheat – irrigation YES in the case of shortage or stress (min. 170 m3 ha-1)
Table of irrigation Suggested for the Zones
Indication: the farmer who has irrigated on the base of our calendar can use the indication given in figure 3. Other crops: No irrigation for olive and citrus. Workability (50 cm of depth)
Trafficability: low level of risk for the whole area Hydrology: Water balance into the basin: NEGATIVE Difference with the reference values (last 10 years): Observation: Forecasting: No rainfall for the next week. Negative Hydrologic Balance (Reduction of Water Reserve)
Reduce the consumption where possible.
Figure 2. Example of a possible informative document for farmers or local agronomic agencies (distributed by fax). The data and the information used for the example were collected in the project SEM 04/204/028 between DMN/Morocco and FMA/Italy. The bulletin’s structure is currently under evaluation.
S t a t io n D 0 0 5
0
2 0
4 0
6 0
8 0
10 0
12 0
1 5 16 1 7 1 8 19 2 0 2 1 2 2 2 3 2 4
m m
mm
H y d r ic R es e rve M in im a l re s e r ve Ir r ig a tio n
Too humid (no works)
Soft work
Yes
Too dry (no works)
Fig.2 – Soil water balance for the next 10 days .
Reference scheme and advice criteria: - Stress condition Irrigation - Water shortage Irrigation - Good conditions NO irrigation - Optimal conditions NO Irrigation Fig. 1 – Crop distribution in the area
Zone Irrigation Quantity Ha Zone Irrrigation Quantity Ha501 d24 min 170 mm 511 d22 min 170 mm502 d24 min 170 mm 512 d22 min 170 mm503 d24 min 170 mm 513 d21 min 170 mm504 d23 min 170 mm 514 d21 min 170 mm505 d23 min 170 mm 515 d21 min 170 mm506 d23 min 170 mm 516 d19 min 170 mm507 d23 min 170 mm 517 d19 min 170 mm508 d23 min 170 mm 518 d20 min 170 mm509 d23 min 170 mm 519 d20 min 170 mm510 d22 min 170 mm 520 d20 min 170 mm
Fig. 3 – D0 Water condition
Table of workability Zone Workable days Soft workable days Zone Workable days Soft workable days
501 20, 21, 22, 23, 24, 25 511 21, 19 23, 24, 25502 20, 21, 22, 23, 24, 25 512 21, 20 23, 24503 20, 21, 22, 23, 24, 25 513 21, 21 23, 24504 20, 21, 22, 23, 24, 25 514 21, 22 23, 24505 20, 21, 22, 23, 24, 25 515 21, 22 23, 24506 21, 22, 23, 24, 25 516 22, 23 23, 24507 21, 22, 23, 24, 25 517 22, 23 24508 21, 22, 23, 24, 25 518 22, 23 24509 21, 22, 23, 24, 25 519 22, 23 24510 21, 22, 23, 24, 25 520 22, 23 24
282
Fortunately today the technologies can help substantially in solving
problems which once were impossible to solve. However, to tackle with these technologies, a modern agrometeorologist needs greater skills than before.
The steps to prepare the Agrometeorological System would be:
1. Definition of users and their needs; 2. Division of the country in units coherent with the needs of the users
(administrative etc.); 3. Choice of the crops relevant for the users; 4. Determination of the appropriate information for the users in relation to
the available options; 5. Division of the units in climatological homogeneous sub-units; 6. Establishment of the method to convert the climatological and
meteorological data; 7. Evaluation of the data available concerning weather, climate, ancillary
data, crops, etc. and their accuracy in time and space; 8. Establishment of the methods to convert the data at the requested scale
of time and space (spatialisation); 9. Preparation of the software to make the chain of data processing more
automatic; 10. Definition of the way to deliver the information (E-mail, radio, TV,
World Wide Web, etc.).
Despite the common approach, the contents of each step, as it is understandable, depend from each country. How to Approach Each Step of an Agrometeorological Information System
Data collection
An Agrometeorological Information System needs real time meteorological data in every application, especially in the case of advice to the farmers. This is a problem because in many countries the meteorological stations connected to the headquarters are quite few. The use of the numerical forecast on rainfall and temperature values to fill the gaps of the meteorological network is a compromise becoming increasingly accessible. Subsequently, the station data available will be utilized as control and validation of the forecast information.
283
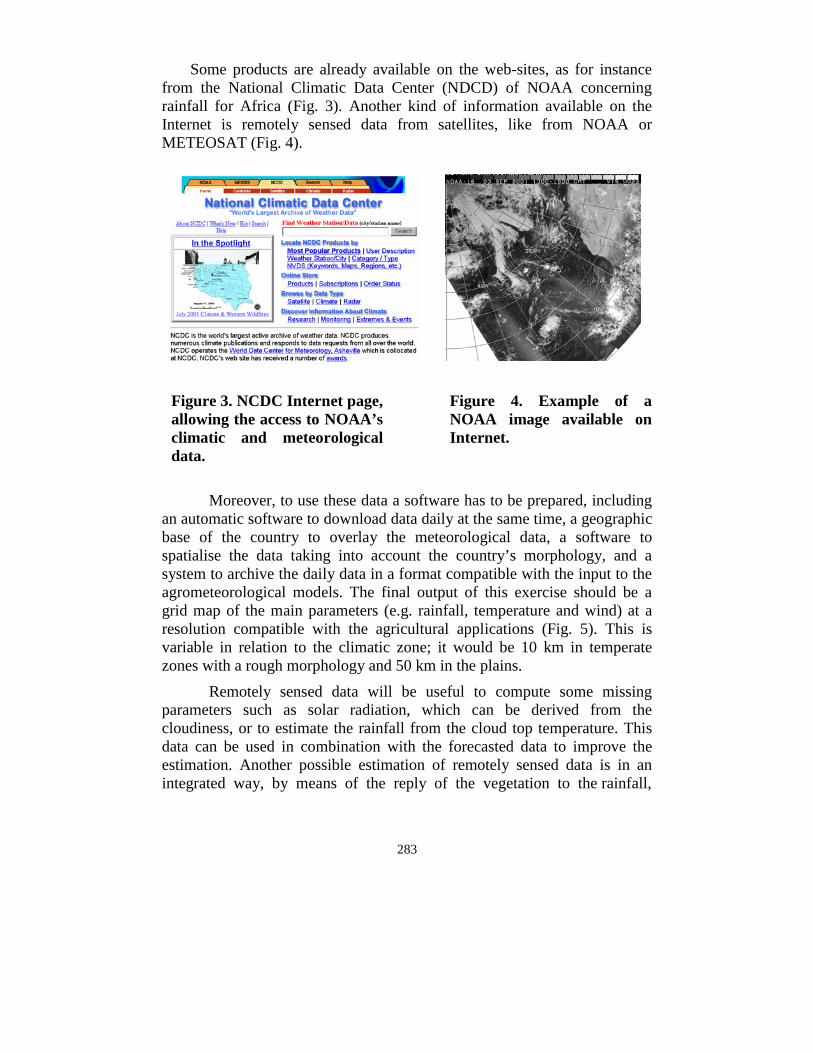
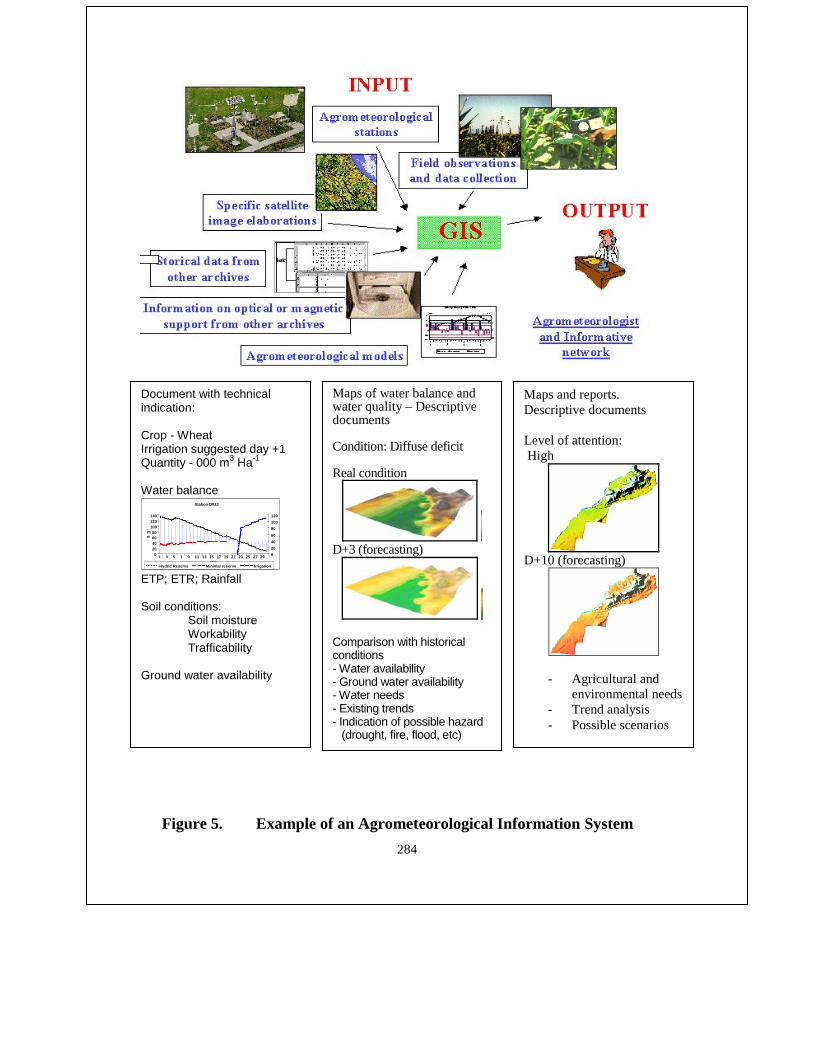
Some products are already available on the web-sites, as for instance from the National Climatic Data Center (NDCD) of NOAA concerning rainfall for Africa (Fig. 3). Another kind of information available on the Internet is remotely sensed data from satellites, like from NOAA or METEOSAT (Fig. 4).
Figure 3. NCDC Internet page, allowing the access to NOAA’s climatic and meteorological data.
Figure 4. Example of a NOAA image available on Internet.
Moreover, to use these data a software has to be prepared, including
an automatic software to download data daily at the same time, a geographic base of the country to overlay the meteorological data, a software to spatialise the data taking into account the country’s morphology, and a system to archive the daily data in a format compatible with the input to the agrometeorological models. The final output of this exercise should be a grid map of the main parameters (e.g. rainfall, temperature and wind) at a resolution compatible with the agricultural applications (Fig. 5). This is variable in relation to the climatic zone; it would be 10 km in temperate zones with a rough morphology and 50 km in the plains.
Remotely sensed data will be useful to compute some missing parameters such as solar radiation, which can be derived from the cloudiness, or to estimate the rainfall from the cloud top temperature. This data can be used in combination with the forecasted data to improve the estimation. Another possible estimation of remotely sensed data is in an integrated way, by means of the reply of the vegetation to the rainfall,
284
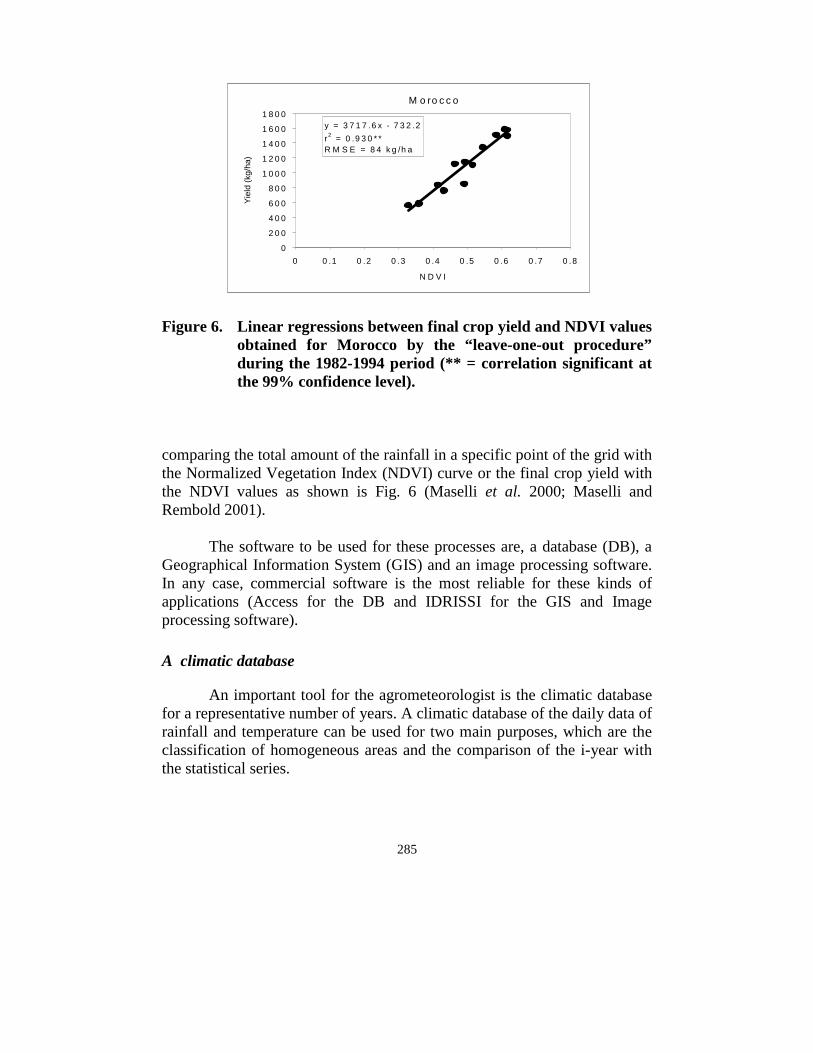
Figure 5. Example of an Agrometeorological Information System
Document with technical indication: Crop - Wheat Irrigation suggested day +1 Quantity - 000 m3 Ha-1 Water balance ETP; ETR; Rainfall Soil conditions: Soil moisture
Workability Trafficability
Ground water availability
Maps of water balance and water quality – Descriptive documents Condition: Diffuse deficit Real condition
D+3 (forecasting)
Comparison with historical conditions - Water availability - Ground water availability - Water needs - Existing trends - Indication of possible hazard (drought, fire, flood, etc)
Maps and reports. Descriptive documents Level of attention: High
D+10 (forecasting)
- Agricultural and environmental needs
- Trend analysis - Possible scenarios
Station D013
020406080
100120140
1 3 5 7 9 11 13 15 17 19 21 23 25 27 29mm
mm
020406080100120
Hydric Reserve Minimal reserve Irrigation
285
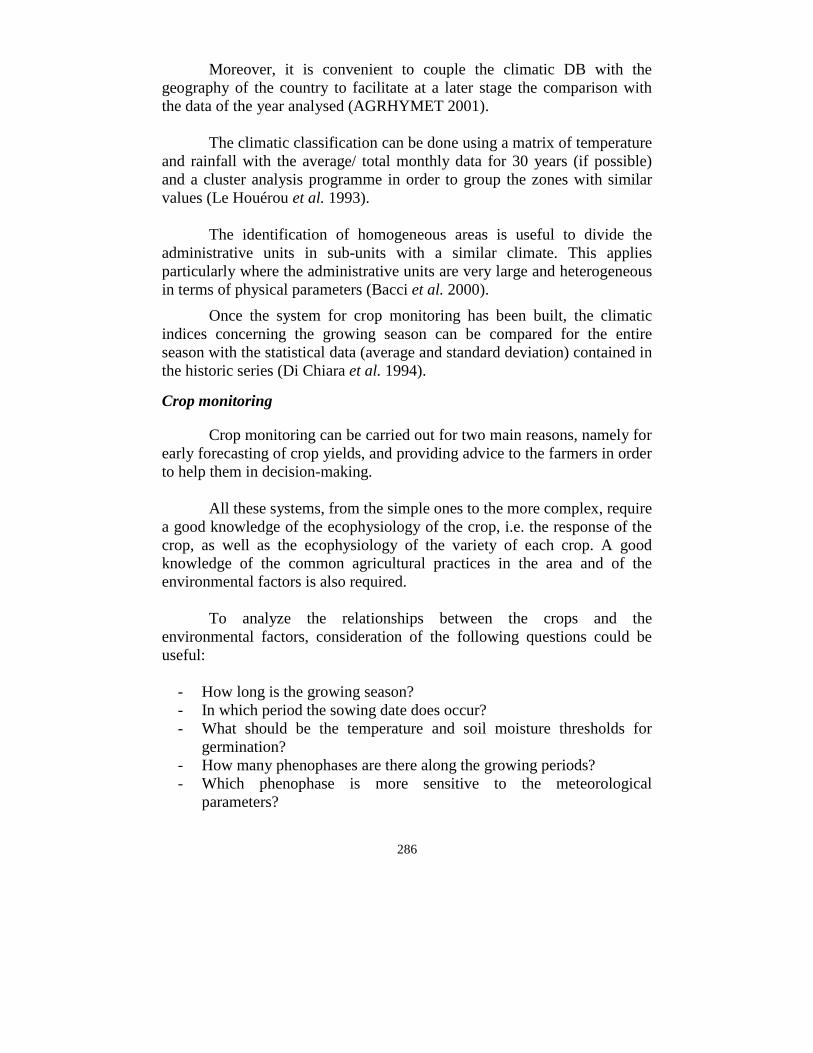
Figure 6. Linear regressions between final crop yield and NDVI values
obtained for Morocco by the “leave-one-out procedure” during the 1982-1994 period (** = correlation significant at the 99% confidence level).
comparing the total amount of the rainfall in a specific point of the grid with the Normalized Vegetation Index (NDVI) curve or the final crop yield with the NDVI values as shown is Fig. 6 (Maselli et al. 2000; Maselli and Rembold 2001).
The software to be used for these processes are, a database (DB), a Geographical Information System (GIS) and an image processing software. In any case, commercial software is the most reliable for these kinds of applications (Access for the DB and IDRISSI for the GIS and Image processing software).
A climatic database
An important tool for the agrometeorologist is the climatic database for a representative number of years. A climatic database of the daily data of rainfall and temperature can be used for two main purposes, which are the classification of homogeneous areas and the comparison of the i-year with the statistical series.
M o ro c c o
y = 3 7 1 7 .6 x - 7 3 2 .2r2 = 0 .9 3 0 * *R M S E = 8 4 k g /h a
0
2 0 0
4 0 0
6 0 0
8 0 0
1 0 0 0
1 2 0 0
1 4 0 0
1 6 0 0
1 8 0 0
0 0 .1 0 .2 0 .3 0 .4 0 .5 0 .6 0 .7 0 .8
N D V I
Yiel
d (k
g/ha
)
286
Moreover, it is convenient to couple the climatic DB with the geography of the country to facilitate at a later stage the comparison with the data of the year analysed (AGRHYMET 2001).
The climatic classification can be done using a matrix of temperature and rainfall with the average/ total monthly data for 30 years (if possible) and a cluster analysis programme in order to group the zones with similar values (Le Houérou et al. 1993).
The identification of homogeneous areas is useful to divide the administrative units in sub-units with a similar climate. This applies particularly where the administrative units are very large and heterogeneous in terms of physical parameters (Bacci et al. 2000).
Once the system for crop monitoring has been built, the climatic indices concerning the growing season can be compared for the entire season with the statistical data (average and standard deviation) contained in the historic series (Di Chiara et al. 1994).
Crop monitoring
Crop monitoring can be carried out for two main reasons, namely for early forecasting of crop yields, and providing advice to the farmers in order to help them in decision-making.
All these systems, from the simple ones to the more complex, require a good knowledge of the ecophysiology of the crop, i.e. the response of the crop, as well as the ecophysiology of the variety of each crop. A good knowledge of the common agricultural practices in the area and of the environmental factors is also required. To analyze the relationships between the crops and the environmental factors, consideration of the following questions could be useful:
- How long is the growing season? - In which period the sowing date does occur? - What should be the temperature and soil moisture thresholds for
germination? - How many phenophases are there along the growing periods? - Which phenophase is more sensitive to the meteorological
parameters?
287
- Which are the more frequent adverse events (droughts, high temperatures, storms, strong winds, pests and diseases, cold, frosts, floods)?
- How much water does the crop need for each phenophase? - What is the average evapotranspiration during each phenophase? - Which are the most important factors affecting the yield and the
production? - How much is the variation in yield between years? What is the
absolute minimum and maximum? - How can the minimum year and the maximum year be characterized
from a climatic point of view? - Can the principal causes of the variation be identified? What is the
coefficient of reduction of the maximum possible yield for each phenophase?
- Which kind of management practices do the farmers use? - How many possible options do they have during the growth periods
(i.e. date of sowing, varieties, timing and amount of fertilizers, spraying for pests and diseases, timing of weeding, amount and scheduling of irrigation, timing of harvest etc.)?
- What are the possibilities for delivering agrometeorological information useful for decision-making? If yes, which kind of decision?
- Are the meteorological forecasts useful to take some decision? - How much time is required before the decision based on the
information is delivered? - Which should be the accuracy of the information on a spatial basis?
The replies to these questions allow building a reasonably efficient
AgIS. The way to compute the final yield or the advice concerning the management techniques can vary from very complex deterministic models to simple evaluations of the relationships between the meteorological parameters and the final yield. While the first approach is quite complex and asks for scientific competency, the second one is more related to the practice and to the knowledge of local situations.
288
Information delivery
The question to be asked in the evaluation of a bulletin’s performance is whether the information is delivered in a timely manner to allow the user to make the appropriate decision. In many situations the output of an agrometeorological division is more related to the need to demonstrate that the salary of the personnel is well spent rather than providing a real service to the farmers or others users.
The printed bulletin, issued on a decadal basis as is most common in the traditional agrometeorological services, can be a useful tool for the monitoring of the agricultural season and whether problems for the final production are foreseen. However, it is generally of poor value to the farmers (Maracchi 2000) for two reasons, first because it will arrive after the decisions are taken and secondly because the information is aggregated at the level of large administrative units. If the activity of the farmers has to be really supported, the focus should be more on the various features of the territory and on using different methods than the printed bulletin. In the industrialized countries where the Internet has become a widespread tool, this would be a good solution, at least for a number of farmers. The possibility to deliver the information timely is also facilitated in this case, because the entire chain of data processing, including the use of images, is coherent with the delivery system and allows tailoring the information in space and for various categories of farmers and crops. In addition, there is the possibility to build an interactive system in which the farmers themselves can provide some local information to improve the preparation of advise.
In less developed countries with regard to the information technologies, another approach to reach the farmers should be researched. One possibility is to reach the local agricultural services through the Internet and then identify jointly the way to reach the farmers in the field. In most situations, the only possibility is through the local broadcasting. Where even this possibility is not available in the organisation of local extension services, the only available means is the national radio broadcasting.
In this case, as the radio has to be paid for the service, the information would be delivered in a very synthetic and efficient way. A specific exercise to convert the agrometeorological information in a useful tool will be done. The information to be delivered should be formulated more like "in the district of x starting from the next Thursday farmers can sow the maize" or "in the district of y farmers should spray the fruits against z".
289
Conclusions
The development of an efficient agrometeorological information system is crucial in many countries where agriculture is the basis of the economy. Nowadays, even if the available resources are quite limited, building a good service and delivering useful products to a variety of users is possible. To achieve this, the main condition is a proactive attitude of the agrometeorologists to tailor the information to the real user needs. We should shift from a simple collection of tables of meteorological data to information helping the users to decide.
The professional capacities of the agrometeorologist are the key to changing attitude. He should know thoroughly the user needs, be able to use the computer possibilities, reinforce the collaboration with the experts of the Ministry of Agriculture to build a joint system, ask for the various information (geographical, biological, climatological etc.) to make the puzzle complete. In many cases he should demonstrate to its service the utility of the products he can deliver and the benefits for the service itself to deliver information appreciated by the rural communities.
In this context, there is a need of further actors helping the local services to organise a well-shaped agrometeorological service, as the international agencies and the research institutions. The entire chain of data processing software, from the data acquisition from Internet to the application of simple models for crop monitoring, is in most cases out of reach of the single agrometeorologist. Therefore, the co-operation between the international agencies as WMO and the research institutions can lead to the preparation of the tools of the chain as well as testing and adapting them to the various situations. In this connection, the preparation of training activities and even of self training software can be very helpful to promote the establishment of an efficient system with very important results for the users, the service and for the individuals in the service. Acknowledgements
The scientific support provided by M. Paganini for the collection and analysis of the agrometeorological bulletins on the Internet, G. Pini for the compared analysis of the climatic predictions with the observed data, and B. Rapi for the contribution given in the selection of applications is gratefully acknowledged.
290
References
AGRHYMET, OMM, CeSIA. 2001. CD-ROM AP3A SGBD version 4.1. Le Système de Géstion de la Banque de Données du projet AP3A, juillet 2001.
Bacci L., Romani M. and G. Maracchi. 2000. Descrizione di una metodologia per la classificazione agroclimatica del territorio e sua applicazione alla regione toscana. Associazione Geofisica Italiana, Bolletino Geofisico Anno XXIII n.1-2: 31-49.
Di Chiara C., Montanelli M., Daouda M. and M. Labo. 1994. Manuel de Suivi de la Campagne agricole et Alerte Précoce au Niger – SISP. CeSIA, Florence, Italy.
Dunkel Z. (ed.). 1995. The use of remote sensing techniques in agricultural meteorology practice. Workshop COST 77, Budapest, Hungary.
Le Houérou H.N., Popov G.F. and L. See. 1993. Agro-bioclimatic classification of Africa. Working Paper of FAO – Agrometeorological series. Rome, Italy.
Maracchi G., Fibbi L. and M. Bindi. 1997. A Guide to data and software sources for applied climatology on Internet. Applied Meteorology Foundation (F.M.A.), Firenze, Italy.
Maracchi G., Pérarnaud V. and A.D. Kleschenko. 2000. Applications of geographical information systems and remote sensing in agrometeorology. Agricultural and Forest Meteorology, Vol. 103: 119-136.
Maracchi G. and M.V.K. Sivakumar (Eds.). 2000. Handbook of GIS application in agrometeorology. WMO, Geneva, Switzerland.
Maselli F. and F. Rembold. 2001. Analysis of GAC NDVI data for cropland identification and yield forecasting in Mediterranean African countries. Photogrammetric Engineering and Remote Sensing 67(5): 593-602.
291
Maselli F., Romanelli S., Bottai L. and G. Maracchi. 2000. Processing of GAC NDVI data for yield forecasting in the Sahelian region. International Journal of Remote Sensing 21(18): 3509-3523.
Rijks D., Terres J.M. and P.Vossen. 1996. Agrometeorological applications for regional crop monitoring and production assessment. Account of the EU Support Group on Agrometeorology (SUGRAM) 1991-1996. Joint Research Centre EU, EUR 17735 EN.
World Meteorological Organization. 1981. Guide to Agricultural Meteorological Practices. Second edition. WMO no. 134. Geneva, Switzerland.
WMO 2000. Le contexte de la vulnérabilité structurelle par système de production au Burkina Faso, Niger, Mali et Sénégal. Edited by WMO, IATA-CNR and CeSIA. WMO, Geneva, Switzerland.