thank you for your sponsorship. the changing american consumer ellen farley fmc associates
TRANSCRIPT

Thank You for your sponsorship

The Changing American Consumer
Ellen Farley FMC Associates

Demographic Trends
•Why Important?– Americans– Marketers
•Highly Diverse– Changing Demographics– Attitudes– Values– Lifestyles
……A New Breed of Consumers

Why Important
• Leo Burnett USA– Typical Day
• 2,904 Commercial Messages– Pay Attention to 52– 56 to 1 Odds against Your Marketing Programs
• Challenge– Understand Today’s Consumers
Identify Best Prospects Improve Product Positioning Develop Relevant Advertising Target Promotions Effectively

Snapshot of American Today
• Nation of 300 Million People– 7 seconds Birth– 13 seconds Death– 31 seconds New Migrant
• Result– 11 seconds Population Increase
• DMCNY May Luncheon– 9,000 seconds +818 People
……Talk about Change!

Major Demographic Trends
•The Maturing of America
•The Emerging Minorities
•Changing Household Composition

Major Demographic Trends•The Maturing of America
– Continued Low Fertility Rates– Aging of the Baby Boomers
•Born 1946 - 1964
•42 - 61 Years Old
– Increased Longevity•Improved Health Care
•Active Lifestyles
•Age 50: the New 30
……Redefining the Concept of Aging

Maturing of America
•Demography is Destiny– Aging of Our Nation– Time Marches On
•7 seconds 50th Birthday
•24 seconds 65th Birthday
– Botox……Cannot Change the Face of
America

Maturing of America
•Trend Continues: 2000 – 2050– Baby Boomers Advance
•85-104
– Fastest growing Age Groups•65-84 114% Growth
•85+ 389% Growth
Maturing of America
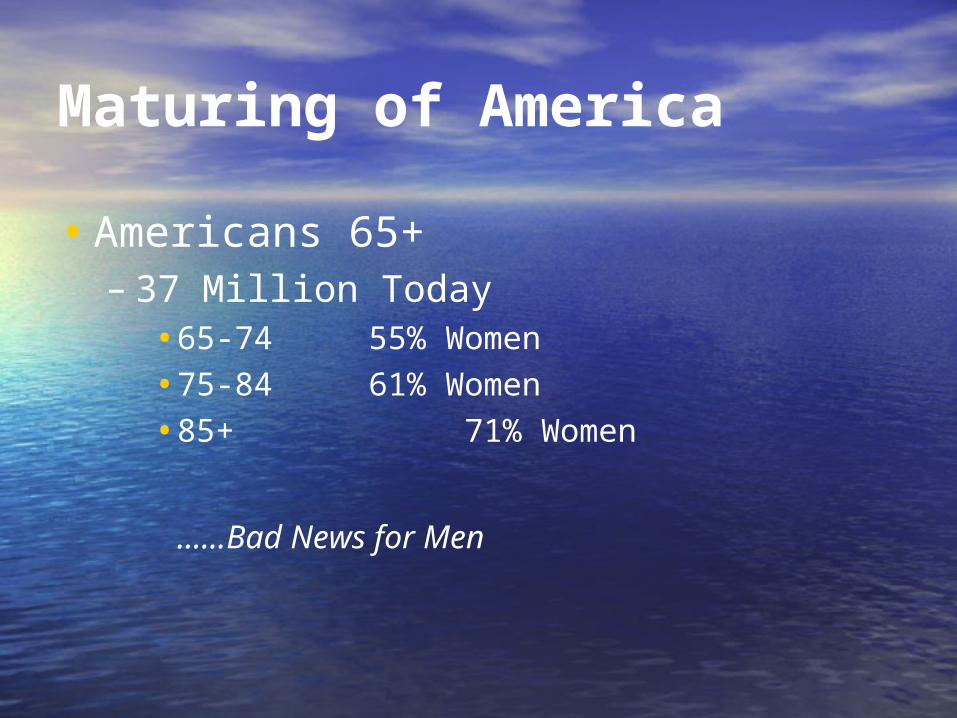
•Americans 65+– 37 Million Today
•65-74 55% Women
•75-84 61% Women
•85+ 71% Women
……Bad News for Men

Maturing of America
•Mature Market Segments– Baby Boomers 40s and 50s– Silent Generation 60s and 70s– GI Generation 80s+– Super Seniors 100+
Maturing of America
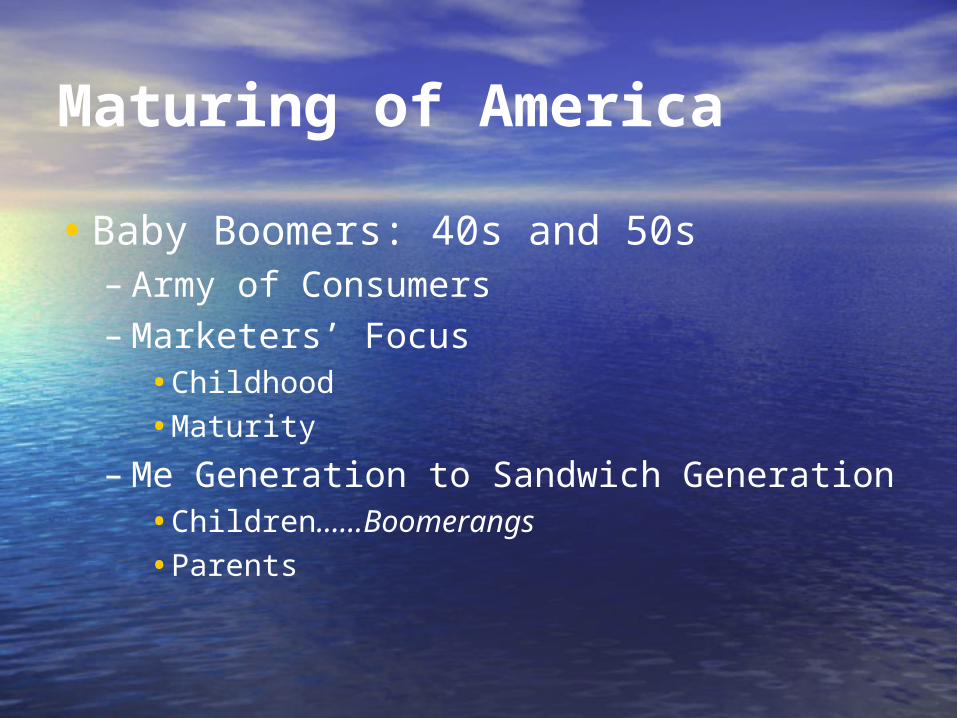
•Baby Boomers: 40s and 50s– Army of Consumers– Marketers’ Focus
•Childhood
•Maturity
– Me Generation to Sandwich Generation•Children……Boomerangs
•Parents

Maturing of America
•Baby Boomers– Household Size
•Well above Average– Declining Numbers of Dependent Children– Increasing Numbers of Not So Independent Children
The Leftovers The Boomerangs……KIPPERS Kids In Parents’ Pockets Eating Retirement
Savings

Maturing of America
•Baby Boomers– Empty Nesters
•Well above Average Income•Self Rewards
– Travel– Second Homes– New Cars– Electronic Toys
……SKIing Spending the Kids’ Inheritance

Maturing of America
• Silent Generation: 60s and 70s– Childhood: Post World War II Prosperity– Adulthood: Silence Was Golden
• Jane Fonda……Very Vocal Exception• Rod Stewart……Redefining Sexagenarian Today
– Parents of Baby Boomers– Empty Nesters– Retirement/ Semi-Retirement
• Last of the Corporate Pensions• Traditional Social Security

Maturing of America
• GI Generation: 80s+ – Tom Brokaw’s Greatest Generation
• GI Joes
• Rosie the Riveter
– Values• Patriotism
• Self Sacrifice
• Educational Attainment
• Family Focus

Maturing of America
•Super Seniors: 100+•Centenarians
•80,000 Consumers
•Willard Scott Overwhelmed by Requests
•Characteristics– Personal Hope– Optimism– Feisty Natures

Maturing of America
•How Old is Old?– Age Continuum
•30s 50s•50s 70s•70s 85
– Baby Boomers’ Limits•79% No Limits before 70•50% No Limits before 80!
……Attitudinal Change

Maturing of America
•How Old is Old?– New York Times Magazine: 5/6/07
•Terminology – Old Age Oldsters– Middle Age Midsters or Midlife
……Support these Attitudinal Changes

Maturing of America
•Marketing Myths– 50+ Market
• Not Brand Switchers– Open to New Experiences– Willing to Try New Products– Time and Money
……Missed Marketing Opportunity
• Not Online– 60% Own PCs– 70% Have Internet Access– 90% of PC Owners Shop Online– Ages 65+ Fastest Growing Segment
……Missed Media Opportunity

Maturing of America
•Marketing Myths– 50+ Market
•No Need for Special Advertising Programs– 75% Dissatisfied with Advertisers’ Efforts– 70% Actively Resent Ads with Juniors
•Reality– 50+ Market
•10% of Ads Targeted to this Segment
•Controls 50% of All Disposable Income

Maturing of America
•Mature Market– Fast Growing Market
•Increased Longevity
•8 More Years of Baby Boomers
– Huge Purchasing Power•$750 Billion in 2010
– Significant Demographic Trend•Major Opportunity for Marketers

Major Demographic Trends
•The Maturing of America
•The Emerging Minorities

Emerging Minorities
•Founding Fathers– WASPs– WASPs minus ASP Criteria
•2000 Census– White 70%– Hispanic 13%......Largest Minority– Black 13%– Asian 4%

Emerging Minorities
• Trend Continues: 2000 – 2050– Hispanics– Asians
• 2050 ProjectionsGrowth Population
– White 7% 50% – Hispanic 188% 24%– Black 71% 15%– Asian 213% 8%

Emerging Minorities• Ethnic Growth Factors
– Continued Immigration• Under 40 Hispanics and Asians
• Over 40 White
– Younger Population• Overall 1 in 7 Hispanic
• Children 1 in 5 Hispanic
– Higher Fertility Rates• Last 5 Years
• Hispanic Births Outnumbered New Immigrants
……Paving the Way for Future Growth

Emerging Minorities
•Hispanic Diversity– Country of Origin
•59% Mexican
•10% Puerto Rican
• 4% Cuban……73% Migrate from 3 Countries

Emerging Minorities
•Asian Diversity– Country of Origin
•24% Chinese
•18% Filipino
•16% Indian
•11% Vietnamese
•11% Korean……80% Migrate from 5 Countries

Emerging Minorities• Urban Concentrations
– Miami 81%– Los Angeles 68%– New York 61%– Houston 54%– San Francisco 47%– Washington, DC 43%– Dallas 43%– Chicago 42%– Atlanta 40%

Emerging Minorities•America in 2050
……A Majority of Minorities
•Major Challenges ……Language, Culture, Assimilation
•Major Opportunities ……Today, American Minorities Represent the
World’s 4th Largest Economy!
Major Demographic Trends
•The Maturing of America
•The Emerging Minorities
•Changing Household Composition

Changing Household Composition
•Demographer’s View– How Many People?– How Are They Related?
•Marketer’s View– Changing Household Composition
•Attitudes
•Values
•Lifestyles……Today’s Changing Breed of Consumers

Changing Household Composition• Census Bureau
– 1880 Census• Introduced Relationship Questions
– 1990 Census Additions• Unmarried Partner
– POSSLQs– Persons of the Opposite Sex Sharing Living Quarters
• Step Child– High Divorce/ Remarriage Rates– Blended Families
• Grandchild– Dependent Parents– Absent Parents– 26% of Grandparents 65+ Provide Custodial Care

Changing Household Composition• Census Bureau
– 2000 Census Additions• Unmarried Partner
– Expanded Coverage– PASSLQs– Persons of Any Sex Sharing Living Quarters
• Son/ Daughter-in-Law– Boomerangs on Steroids– Economic Upheaval
• Parent-in-Law– Widespread Boomer Expectation– Only 8% Plan to Charge Rent
……Increasing Complexity of American Lifestyles

Changing Household Composition
•Complex American Lifestyles– Traditional 1950s Family……
Disappearing– Married with Kids– Single Parents– DINKs– The Single Life– New Partnerships

Changing Household Composition
• Household Types 2000 Census– Family Households: 68%
• Married with Children• Single Moms• Mr. Moms
• Married with No Children……Largest Segment• Other Non-Traditional Families
……11% Growth Rate

Changing Household Composition• Who Qualifies as a Family?
– Census Definition • Married with Children• Single Moms• Mr. Moms • Married with No Children• Other Non-Traditional Families
– American Opinions Vary• POSSLQs• PSSSLQs with Children• PSSSLQs
……Expanding Definitions

Changing Household Composition
• Household Types 2000 Census– Non-Family Households: 32%
• Living Alone……Dominant Segment• Unmarried Partners
……23% Growth Rate
– Highest Household Volume Increase• Married Couples with No Children• Living Alone
– Highest Household Growth Rate• Other Non-Traditional Families• Unmarried Partners
……Increasing Complexity of American Lifestyles
Changing Household Composition
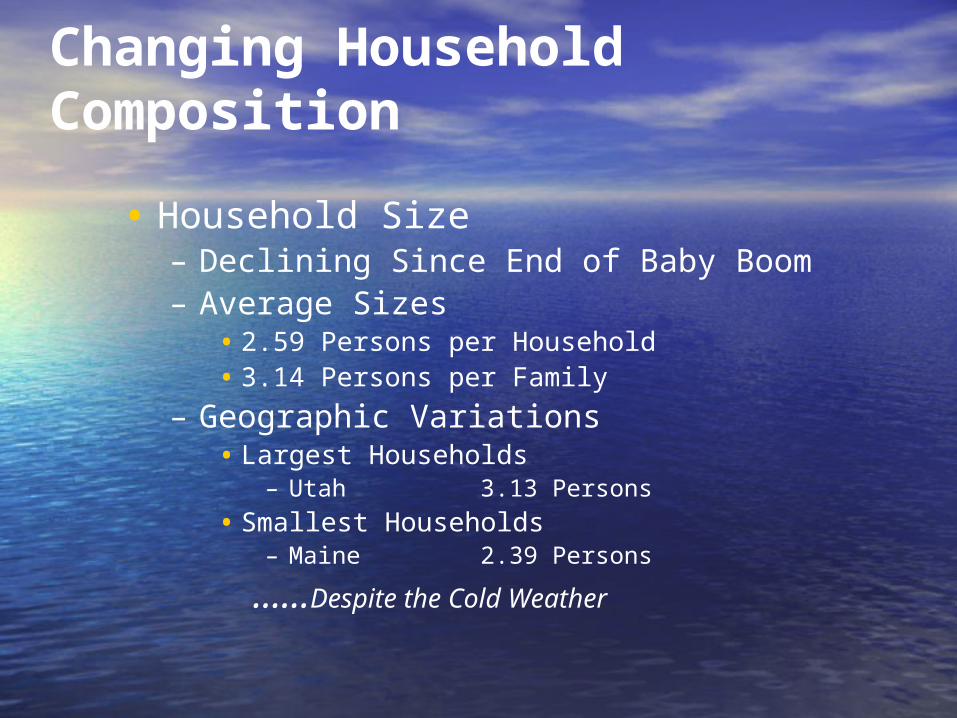
• Household Size– Declining Since End of Baby Boom– Average Sizes
• 2.59 Persons per Household• 3.14 Persons per Family
– Geographic Variations• Largest Households
– Utah 3.13 Persons
• Smallest Households– Maine 2.39 Persons
……Despite the Cold Weather

Changing Household Composition
•Curious Phenomenon……Households Growing Smaller and Homes Growing Larger
•American Dream of Homeownership– 67% Are Owners– Homes Expanding
– Great Rooms– Home Offices– Exercise Rooms
……Era of the McMansion Has Arrived

Changing Household Composition
•Homes Expanding– Gourmet Kitchens
•Grazing Preferred Lifestyle•Share of Stomach at All Time Low
– Eating Habits•83 Meals in Restaurants•117 Fast Food Meals
– More Healthful Foods•Vegetables Up 12%•Most Popular Veggie
– French Fries– Potato Chips

Changing Household Composition
•Eating Habits– Average American’s Annual Consumption
•Veggies 428 Pounds
•Fruits 279
•Red Meat 114
•Chicken 70
•Fish 15
……Increasing Consumption of Feathers and Fins

Changing Household Composition
•Eating Habits– Average American’s Annual
Consumption•Cereal & Flour 200 Pounds•Butter & Oils 75•Cheese 30•Soft Drinks 32 Gallons•Bottled Water 24•Wine 3
……Good News: More Veggies Bad News: More of Everything

Changing Household Composition
• Family Households– Married Couples 52%– Census Marriage Rates: Ages 15+
• Currently Married 54%• Widowed, Divorced 19%• Never Married 27%
– Geographic Variations• Highest Marriage Rate
– Naperville, Illinois 68%• Highest Formerly Married Rate
– Gary, Indiana 27%
……Love ‘em and Leave ‘em Midwest Style

Changing Household Composition
• Marriage RatesAge Never Married
15-19 96%……Good News20-24 79%25-29 49% . .
. .45-54 10%
. . . .
65+ 4%
……The Urge to Merge is Strong

Changing Household Composition
• Marriage Rates– New York Times: 1/16/07
• “51% of Women Are Now Living Without Spouse”– Base Women 15+– Illegal in Many States
– New York Times: 2/11/07• “Can a 15 Year Old Be a ‘Woman Without Spouse’ ?”
– Concerns about 15 Year Olds– Reality ~50%– Tipping Point Still in Sight

Changing Household Composition
• Marriages: Wedding Day– Biggest Concerns
• Money• Choosing the Right Partner• Choosing the Right In-Laws
– Other Concerns• Short Term Thinkers
– Ceremony– Dinner
• Longer Term Thinkers– Maintaining Open Communication– Possibility of Divorce
……Sex Ranked 13th
Changing Household Composition
•Married Couples with Children– 24% of All Households– Traditional Lifestyle Expanding
•Homemaker Moms
•Working Moms
•Homemaker Dads
•Dual Income Families
•Blended Families

Changing Household Composition
•Families with Children– Single Moms
•Adaptive Lifestyle– Unmarried and Unplanned– Widows– Divorced– Single by Choice
•Economic Crunch

Changing Household Composition
•Families with Children– Mr. Moms
•Emerging Lifestyle– Professional Flexibility– Unemployed– Lower Salaries
•Challenges– Scheduling Play dates– Societal Acceptance

Changing Household Composition
• Married Couples without Children• DINKs……Dual Income No Kids
– Higher Discretionary Spending Power– 3 Typologies
• Starter Families– Under 35s
• Committed DINKs– 40-55
• Empty Nesters– 55+
……Baby Boomers Are Cycling through All Groups
Changing Household Composition
• Non-Family Households– Singles Living Alone
• First Time• Committed Singles• Recycled
– Wide Variety of Lifestyles• Swinging• Non-Swinging• Metrosexuals• Ubersexuals
– Highest Incidence• Washington, DC
……Politics Makes Strange Bedfellows or None at All

Changing Household Composition
• Singles Living Alone– Satisfaction Levels
• Generally High• Interest in Transition
– Transition Odds• Census Bureau
– Number of Men for Every 100 Women– Romance Index
• Hot Spots– Levenworth, Kansas– Monroe, Florida– Alaska……The odds are good, but the goods are odd!

Changing Household Composition
• Unmarried Partners– 5% Households……Understated– Rapid Growth Rate– Types
• POSSLQs• PASSLQs• PSSSLQs
– PASSLQ Status• Permanent Choice• Only Option• Life Stage
– Married Couples– Recycled Singles

Changing Household Composition
• Complexity of American Lifestyles
• Importance of Information Resources– Demographic Data– Lifestyle Data– Vertical Lists– Profile Analysis– Cluster Analysis– Custom Analytics– Database Marketing……Helping Marketers Understand Today’s
Consumers!
Major Demographic Trends
The Maturing of AmericaThe Emerging MinoritiesChanging Household Composition
Major Challenges for Marketers– Understand This Diversity– Reposition Products Appropriately– Create Relevant Advertising– Target Marketing Programs Effectively– Develop Integrated Marketing Communications
Major Opportunities for Marketers Who Meet These Challenges!
