th obser v er - nasa's earth observing system obser v er the ear national aeronautics and space...
TRANSCRIPT
ervth
ob
ser
the
ear
National Aeronautics and Space Administration
The Earth Observer. July - August 2012. Volume 24, Issue 4.
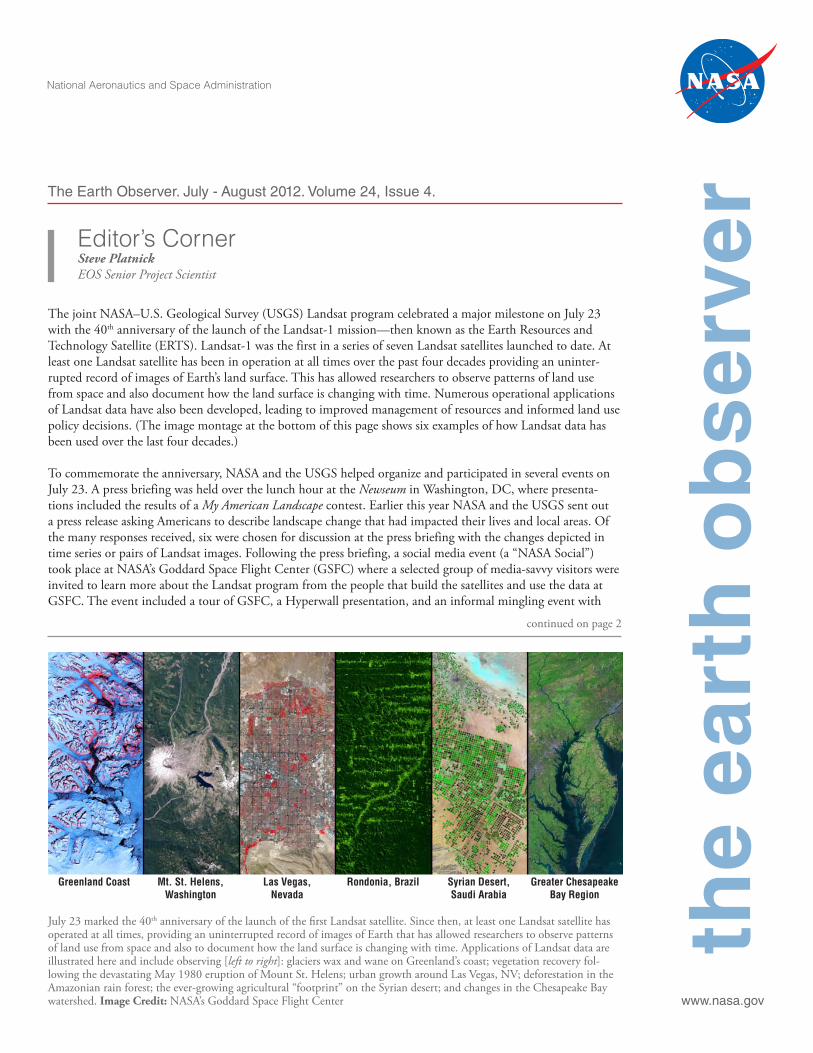
The joint NASA–U.S. Geological Survey (USGS) Landsat program celebrated a major milestone on July 23 with the 40th anniversary of the launch of the Landsat-1 mission—then known as the Earth Resources and Technology Satellite (ERTS). Landsat-1 was the first in a series of seven Landsat satellites launched to date. At least one Landsat satellite has been in operation at all times over the past four decades providing an uninter-rupted record of images of Earth’s land surface. This has allowed researchers to observe patterns of land use from space and also document how the land surface is changing with time. Numerous operational applications of Landsat data have also been developed, leading to improved management of resources and informed land use policy decisions. (The image montage at the bottom of this page shows six examples of how Landsat data has been used over the last four decades.)
To commemorate the anniversary, NASA and the USGS helped organize and participated in several events on July 23. A press briefing was held over the lunch hour at the Newseum in Washington, DC, where presenta-tions included the results of a My American Landscape contest. Earlier this year NASA and the USGS sent out a press release asking Americans to describe landscape change that had impacted their lives and local areas. Of the many responses received, six were chosen for discussion at the press briefing with the changes depicted in time series or pairs of Landsat images. Following the press briefing, a social media event (a “NASA Social”) took place at NASA’s Goddard Space Flight Center (GSFC) where a selected group of media-savvy visitors were invited to learn more about the Landsat program from the people that build the satellites and use the data at GSFC. The event included a tour of GSFC, a Hyperwall presentation, and an informal mingling event with
continued on page 2
Editor’s CornerSteve PlatnickEOS Senior Project Scientist
Greenland Coast Mt. St. Helens, Las Vegas, Rondonia, Brazil Syrian Desert, Greater Chesapeake Washington Nevada Saudi Arabia Bay Region
July 23 marked the 40th anniversary of the launch of the first Landsat satellite. Since then, at least one Landsat satellite has operated at all times, providing an uninterrupted record of images of Earth that has allowed researchers to observe patterns of land use from space and also to document how the land surface is changing with time. Applications of Landsat data are illustrated here and include observing [left to right]: glaciers wax and wane on Greenland’s coast; vegetation recovery fol-lowing the devastating May 1980 eruption of Mount St. Helens; urban growth around Las Vegas, NV; deforestation in the Amazonian rain forest; the ever-growing agricultural “footprint” on the Syrian desert; and changes in the Chesapeake Bay watershed. Image Credit: NASA’s Goddard Space Flight Center www.nasa.gov

The Earth Observer July - August 2012 Volume 24, Issue 4 02ed
itor's
cor
ner
eos.nasa.gov
In This IssueEditor’s Corner Front Cover
Feature Articles
Aquarius: One Year After Launch 4SMAP Applications: Improving
Communication for the Palo Verde Nuclear Generating Station 10
Weird Science: NASA Inspires a Creative Expedition 12NASA Scientists Lead Earth and
Climate Change Forum 14
Meeting/Workshop Summaries
SORCE SSI Workshop Summary 17HDF and HDF-EOS Workshop 21MODIS Science Team Meeting 23Suomi NPP Science Team Meeting 25CERES Science Team Meeting Summary 28
In The News
NASA Discovers Unprecedented Blooms of Ocean Plant Life 32
NASA Mission Sending Unmanned Aircraft Over Hurricanes This Year 34
SORCE/TIM Views the 2012 Transit of Venus 36
Regular Features
NASA Earth Science in the News 38NASA Science Mission Directorate –
Science Education and Public Outreach Update 40
Science Calendars 41
Reminder: To view newsletter images in color, visit: eospso.gsfc.nasa.gov/eos_homepage/for_scientists/earth_observer.php
Goddard personnel. The NASA Social visitors were encouraged to share their experience in real time via social media such as Twitter, Facebook, and Google+. The anniversary was capped by an evening reception for past and present Landsat program contributors and supporters at the Rayburn House Office Building. The event was organized by the Alliance for Earth Observa-tions and sponsored by Ball Aerospace & Technologies
Corporation, Orbital Sciences Corporation, and Stinger Ghaffarian Technologies.
The Landsat program is still going strong. The USGS preserves a 40-year archive of Landsat images at its Earth Resources Observation and Science (EROS) Center in Sioux Falls, SD. The general public can search and browse the archive and receive high-quality, well-cali-brated image data over the Internet at no cost upon re-quest. The Landsat Data Continuity Mission (LDCM) is scheduled to launch in early 2013—at which point it will be known as Landsat-8—to continue the collection of these critical observations for many years.
Meanwhile, NASA’s Aquarius instrument aboard the Aquarius/SAC-D1 observatory celebrated its first year in space on June 10, 2012. Since late August 2011, Aquarius has been continuously collecting and distrib-uting data, allowing scientists to study global salinity patterns such as the freshwater plume pouring from the Amazon River and localized changes in the Gulf of Mexico saltiness following Tropical Storm Lee. Aquari-us data have also showed better-than-expected align-ment with ocean circulation features, including eddies with diameters from tens-to-hundreds of kilometers that can persist from days to weeks. The countdown to reaching Aquarius’ principal scientific objective of achieving a monthly average global measurement error of less than 0.2 practical salinity units (psu) at 150-km (93-mi) resolution began on December 1, 2011, after the post-launch assessment review process was complet-ed. To read more about Aquarius’ first year in orbit and the “road to 0.2,” turn to page 4 of this issue.
In June, NASA selected the Cyclone Global Navigation Satellite System (CYGNSS) as the inaugural Earth Ven-ture-class PI-led spaceborne mission (EV-2). CYGNSS uses innovative measurements of direct and reflected GPS signals from 8 micro-satellites deployed from a single launch into a 500 km 35° inclination orbit. The reflected signals are used to retrieve ocean surface wind speeds in tropical cyclone cores with sufficient temporal sampling to study cyclone genesis and intensification. The mission, led by Principal Investigator Chris Ruf at the University of Michigan, is nominally expected to launch in mid-2016. Congratulations to Chris and his team that includes the Southwest Research Institute of Texas, Surrey Satellite Technology of Colorado, and NASA Ames Research Center!
I am happy to report that the Afternoon Constellation or “A-Train” welcomed a new member on June 29, the Global Change Observation Mission – Water (GCOM-W1) “SHIZUKU” satellite, which was launched by the Japan Aerospace Exploration Agency (JAXA) on
1 SAC-D stands for Satélite de Aplicaciones Cientificas-D, meaning Satellite for Scientific Applications-D.

The Earth Observer July - August 2012 Volume 24, Issue 4 03
edito
r's c
orne
rMay 18. SHIZUKU successfully executed a series of orbit control maneuvers required to position itself in its control box “at the front” of the A-Train—i.e., it is now positioned in front of Aqua, making it the lead satellite in the constellation2. As reported in our last is-sue, CloudSat successfully returned to the A-Train orbit (705 km) on May 15, 20123.
On July 3, the antenna rotation on the Advanced Microwave Scanning Radiometer 2 (AMSR2), on SHIZUKU, was increased from a rate of 11 rpm to 40 rpm—matching the rate at which AMSR-E on Aqua
2 SHIZUKU will “lead” the A-Train until the second Orbit-ing Carbon Observatory (OCO-2) joins the constellation, which is currently scheduled for launch in late 2014.3 In the Editorial of our May–June issue of The Earth Ob-server, we reported that the A-Train is back to five satellites for the first time since PARASOL was lowered in December 2009 [Volume 24, Issue 3, p. 3.] This distinction applies to the main A-Train constellation. However, PARASOL is lo-cated 9.5 km below the main A-Train constellation and still considered “part of the A-Train” until it makes its final exit in Fall 2013.
had rotated when it was fully operational—and the first images were obtained4. JAXA plans to continue the initial functional verification of AMSR2 for the next month or so. Meanwhile, a meeting with JAXA at GSFC is scheduled for mid-July to discuss low rpm spin-up plans for the AMSR-E antenna (referred to as Stage 2 recovery)5.
For the twelfth consecutive year, NASA’s Earth Ob-serving System Project Science Office (EOSPSO) sponsored an Odyssey of the Mind long-term creative problem. This year’s event was held May 23-26 at Iowa State University. There were more than 110 teams participating in the NASA-sponsored challenge. To find out who won top honors in their division and to learn about other NASA activities that took place during the event, turn to page 12 of this issue.
4 Please visit: www.jaxa.jp/press/2012/07/20120704_shizuku_e.html to learn more and view the images.5 See the Editorial of the March-April 2012 issue of The Earth Observer to learn more [Volume 24, Issue 2, p. 2.]
June 28, 2012 June 30, 2012
philadelphia philadelphia
clouds
baltimore baltimore
Washington, dc Washington, dc
Derecho Dims the Lights. On the afternoon and evening of June 29, 2012, an intense, long-lived, bow-shaped line of thun-derstorms—called a derecho, the Spanish word for “straight”—formed in a hot, humid air mass and raced southeastward along a stationary front from the Upper Midwest to the Mid-Atlantic coast. At its peak, the squall line stretched for hundreds of miles, and produced storms with heavy rain, vivid lightning, and a brief but intense burst of near-hurricane-force winds—clocked at upwards of 60 mph (~96.5 kph). The storms left snapped branches, toppled trees, and downed powerlines in their wake. As a re-sult, 22 people were killed, and 4.3 million homes in were plunged into darkness—in many cases the power was not restored for several days.
So widespread were the power outages that the change in light level could be detected from space. This image pair focuses on the Baltimore, MD–Washington, DC area. The images were taken with the day/night band of the Visible Infrared Imaging Radiom-eter Suite (VIIRS) onboard the Suomi National Polar-orbiting Partnership (Suomi NPP) satellite before, June 28 [left], and after, June 30, [right] the storms.
While clouds obscure the lights of Philadelphia, PA, and other areas north and east of Baltimore in the “after” image, significant changes in light intensity can be seen in the remainder of the image, particularly north and west of Washington, DC, along the 270 and 66 interstate highways and Maryland route 267.
Image Credit: Jesse Allen and Robert Simmon, NASA Earth Observatory
Suomi NPP is the result of a partnership between NASA, the National Oceanic and Atmospheric Administration, and the De-partment of Defense.

The Earth Observer July - August 2012 Volume 24, Issue 4 04fe
atur
e ar
ticle
s Aquarius: One Year After Launch Annette deCharon, Darling Marine Center, University of Maine, [email protected]
NASA’s Aquarius in-strument was success-fully launched from Vandenberg Air Force Base as part of the U.S./Argentina Aquarius/SAC-D observatory on June 10, 2011. The Aquarius instrument was designed primar-ily to measure global sea surface salinity.
Introduction
NASA’s Aquarius instrument was successfully launched from Vandenberg Air Force Base as part of the U.S./Argentina Aquarius/SAC-D1 observatory on June 10, 2011. The Aquarius instrument was designed primarily to measure global sea surface salinity. The observatory “bus,” built by the Space Agency of Argentina, or Comisión Nacio-nal de Actividades Espaciales (CONAE), also accommodates several other instruments developed by CONAE and its partners, including the French Space Agency (Centre National d’Études Spatiales), the Italian Space Agency (Agenzia Spaziale Italiana), and the Canadian Space Agency2.
After a brief commissioning period, the Aquarius instrument was switched into mis-sion mode on August 25, 2011. The “first-light” global image was released on Septem-ber 22, 2011, and featured two-and-half weeks of sea surface salinity data—the first such data ever collected by a NASA satellite. This map, shown in Figure 1, demon-strated Aquarius’ ability to detect large-scale salinity patterns clearly and with sharp
contrast. About one month later, NASA Administrator Charles Bolden Jr. met with Ar-gentine President Cristina Fernandez de Kirchner to witness the signing of a Framework Agreement on Cooperation in the Peace-ful Use of Outer Space be-tween the U.S. and Argen-tinian governments—see Figure 2.
The post-launch assessment review process for Aquarius
was completed on December 1, 2011, marking both the beginning of the Aquarius science operations phase and transition of the Aquarius Project Office from NASA/Jet Propulsion Laboratory (JPL), to NASA’s Goddard Space Flight Center (GSFC). This event also triggered the “countdown clock” to reaching Aquarius’ principal sci-entific objective of achieving a monthly average global measurement error of less than 0.2 practical salinity units (psu) at 150-km (93-mi) resolution—where salinity levels in the open ocean generally range from 32–37 psu—within one year. Equivalent to about one-eighth teaspoon of salt in a gallon of water, this accuracy presents a formidable yet exciting challenge for the Aquarius team and the oceanographic community at large.
Science Team and Early Findings
In 2009 NASA and CONAE conducted a joint solicitation and selection of scientific investigations and innovative application demonstration projects using Aquarius/SAC-D observations. NASA selected 15 projects, while CONAE and the Argentine Minis-try of Science, Technology, and Innovative Production selected 15 projects, with par-ticipation of scientists from Chile and Brazil. An additional 10 proposals were selected from scientists in Italy and Japan to form a more diverse international science team.
1 SAC-D stands for Satélite de Aplicaciones Cientificas-D, meaning Satellite for Scientific Applications-D. 2 A story about collaborative efforts to build the Aquarius/SAC-D observatory at Argentina’s INVAP facility is featured in the Spring 2012 issue of NASA’s Ask magazine, available online at www.nasa.gov/offices/oce/appel/ask/issues/46.
Figure 1. The first global map of the salinity of Earth’s ocean surface produced by NASA’s Aquarius instrument reveals a rich tapestry of global salinity patterns, demonstrating Aquar-ius’ ability to resolve large-scale salinity distribution features clearly and with sharp contrast. Image credit: NASA/GSFC/JPL-Caltech

The Earth Observer July - August 2012 Volume 24, Issue 4 05
feat
ure
artic
les
Figure 2. The U.S. and Argentina sign a Space Cooperation Agreement on October 25, 2011. Pictured are [far right] Cristina Fernandez de Kirchner [President of Argentina], [left center] Charles Bolden [NASA Administrator], and [far left] Vilma Martinez [U.S. Ambassador to Argentina]. Image credit: U.S. Department of State
After the successful Aquarius/SAC-D launch, 11 new mem-bers were added to the NASA Ocean Salinity Science Team, whose collective goal is “to pro-vide the scientific underpinning for production of the best possi-ble satellite-derived ocean salin-ity datasets and to demonstrate the Earth science and applica-tions arising from analyses of the ocean surface salinity data.” A list of the NASA investigators and their projects is available at aquarius.nasa.gov/people.html.
The first-light image (Figure 1) reveals general patterns of global sea surface salinity. The image confirmed that the central North Atlantic Ocean is home to the world’s highest open-ocean salinities; the South Atlantic Ocean shows a similar pattern. These salinity maxima are found at ap-proximately the same latitudes as the major desert regions in Africa; clearly, in these regions, evaporation dominates over precipitation. Conversely, an extensive band of low sea surface salinity is found in the central Pacific Ocean near the Equator, roughly corresponding to the location of the Intertropical Convergence Zone (ITCZ)—a re-gion of extensive convective precipitation.
On average, the Atlantic loses more fresh water by evaporation to the atmosphere than it gains from precipitation and river runoff; the opposite is true in the Pacific Ocean. Aquarius’ first-light image generated a lot of excitement—even among veteran ocean
Best of Both Worlds: Patagonia’s Heart of Technology It’s hard to imagine a more unlikely, or beautiful place to build a satellite than Bariloche, Argentina. Sur-rounded by the Nahuel Huapi National Park, this skiing and mountain trekking destination is home to IN-VAP, where Aquarius/SAC-D was built. Founded in 1976, INVAP is a technology spinoff company whose founders hail from the local Balseiro Institute. Among the most competitive academic programs in Latin America, the Balseiro Institute currently admits about 45 students per year who have completed two years of university studies in physics or engineering. Many of its graduates have made their careers at CONAE, in-cluding its executive director, Conrado Varotto. In 1994, CONAE released high-level goals for Argentina’s
space program that included developing and applying advanced technological knowledge; enhancing economic and human resources; and fostering international cooperation. A major initiative is the SAC satellite series, the fourth of which is Aquarius/SAC-D. Each sat-ellite was built by INVAP; ground control op-erations for each mission have been conducted in Córdoba, Argentina. However, working close to the Andes has its risks: Many of the INVAP personnel almost missed the launch of Aquarius/SAC-D because of the eruption of the Puyehue-Cordón Caulle volcano five days earlier that covered the area in five centimeters of ash, closing the airport.
Mountain view from Bariloche. Image credit: Annette deCharon

The Earth Observer July - August 2012 Volume 24, Issue 4 06fe
atur
e ar
ticle
sHow Does Aquarius Measure Salinity?
The Aquarius instrument measures the ocean’s surface microwave emission at 1.413 GHz (in the L-band portion of the spectrum usually protected for radio astronomy). The emissivity—measured as a parameter called brightness temperature—is modulated by the electrical conductivity of seawater, hence, salinity. The seawater microwave signature comes from the top centimeter (0.4 in) of the ocean surface. In addition to this passive measurement, Aquarius also measures radar backscatter at 1.26 GHz, to mitigate the emissivity variations due to ocean surface roughness, the largest uncertainty term in the salinity retrieval error budget.
Figure 3. This image shows the Aquarius/SAC-D satellite ground tracks (thin black lines) superim-posed on sea surface salinity data. The thick black line shows one example track with correspond-ing data swaths (pink ovals) from Aquarius’s three radiometers. The inset shows the dimensions of each swath (pink ovals) that to-gether comprise a swath width of 390 km (242 mi). In the inset, 0 km “cross-track distance” cor-responds to the track directly be-low the satellite. Image credit: Gary Lagerloef
scientists such as Arnold Gordon [Columbia University—Aquarius Science Team] who said, “This is a great moment in the history of oceanography. The first image raises many questions that oceanographers will be challenged to explain.”
Since late August 2011, Aquarius has been continuously collecting and distributing data, allowing scientists to study changes in salinity associated with water cycle events
such as major storms and river outflows. Interestingly, given Aquarius’ relatively large viewing footprint—three micro-wave radiometer beams ranging in size from 90 km (55.9 mi) to 150 km (93.2 mi) to form a 390 km (242.3 mi) swath (see Figure 3)—and associated poten-tial for contamination by the strong sig-nal from land areas, scientists have been pleasantly surprised by the instrument’s ability to detect coastal ocean salinity features. For example, within 10 days of its first data collection, Aquarius im-aged a strong low-salinity region in the Gulf of Mexico, just east of the Missis-sippi River Delta, that disappeared by late October 2011. Scientific analysis indicates that this temporary freshening of the Gulf was associated with Tropi-cal Storm Lee, which made landfall over New Orleans in early September 2011. The storm caused a surge of fresh-water river discharge from the Mississippi, as well as heavy rainfall directly over the
sea surface that decreased the surface salinity in this region. During an educational webinar about the early science results, Gary Lagerloef [Earth and Space Research—Aquarius Principal Investigator] stated, “We were able to see some very important fea-tures in the coastal ocean that we didn’t expect to see when we launched Aquarius. This was a very positive development very early in the mission.”
The sequence of monthly salinity maps of the tropical Atlantic Ocean from Septem-ber–November 2011 showed another unexpected early discovery using Aquarius data: namely, a large amount of freshwater input from the Amazon and Orinoco Rivers—see Figure 4. The Amazon River empties into the Atlantic Ocean along the Equator, discharging freshwater from the largest watershed on Earth. The mouth of the Orino-co, one of the longest rivers in South America, is located in Venezuela at about 8.6 °N lat-itude. Aquarius data have revealed that, during these months, the river plumes appeared to merge and were carried eastward by the North Atlantic Counter Current. This period also coincided with high rainfall over the tropical Atlantic, which likely contributed to the large freshwater signal at the ocean surface. Scientists will continue to observe sa-

The Earth Observer July - August 2012 Volume 24, Issue 4 07
feat
ure
artic
leslinity trends in this and other regions, particularly in
terms of how seasonal variations in rainfall and river output are tied to changes in ocean circulation.
Aquarius data are already showing better-than-ex-pected alignment with ocean circulation features, in-cluding eddies with diameters from tens-to-hundreds of kilometers that can persist from days to weeks. One preliminary study of the eastern tropical Pacific indicates that the motion of low-salinity features corresponds closely to near-real-time global ocean surface currents derived from satellite altimeter and scatterometer data—see www.oscar.noaa.gov. These low-salinity features are associated with heavy pre-cipitation bands in the ITCZ. This level of detail of sea surface dynamical structure cannot be resolved with traditional salinity observations, emphasizing Aquarius’ important role in monitoring ocean fea-tures to better understand their role in climate. “This is brand-new information that will allow oceanogra-phers to do some important research to better under-stand how the ocean works,” said Gary Lagerloef.
The Road to 0.2
The first post-launch Aquarius/SAC-D Science Team Meeting was held in Buenos Aires, Argentina from April 11-13, 2012. More than 120 scientists and engineers from around the world shared scientific findings along with the status of each observatory instrument and its data. Many of the presentations focused on Aquarius data accuracy and the prog-ress toward—and challenges ahead for—achieving a monthly average global measurement error less than 0.2 psu at 150-km (93-mi) resolution. Simon Yueh [JPL— Aquarius Project Scientist] gave an overview of the instrument performance and assessment of the salinity accuracy trend over time. He shared that the Aquarius instrument has “been performing exceptionally well” and that “on-orbit thermal con-trol meets the design requirement of 0.1 °C stability.”
The evolution of the accuracy of Aquarius’ salinity data over time is shown in Figure 5; it also shows the data processing software version outputs that have been available to the ocean sciences community since September 2011. Version 1.1 was used to gener-
Figure 4. Sequence of monthly Aquarius data maps from Sep-tember–November 2011, fo-cused on the tropical Atlantic Ocean. In these images a white box highlights the band of rela-tively low salinity surface water that stretches between South America and Africa. Image credit: NASA/GSFC/JPL-Caltech
Figure 5. This graph shows the accuracy of Aquarius salin-ity data since September 2011. The vertical axis shows the monthly average global root-mean-square measurement er-ror on the 1978 practical salin-ity scale at 150-km (~93-mi) spatial resolution. Data process-ing software versions (i.e., 1.1 through 1.3) are shown from September 2011–May 2012, along with the mission goal of measurement error of 0.2 psu by December 2012. Image credit: Simon Yueh, NASA/JPL-Caltech

The Earth Observer July - August 2012 Volume 24, Issue 4 08fe
atur
e ar
ticle
s ate the first-light image (Figure 1) and was superseded by Version 1.2 in early Novem-ber 2011 after a small calibration drift was discovered by the Aquarius calibration/validation team—a drift that erroneously made the global ocean appear saltier over time. In October 2011, the team implemented an adaptive time-varying calibration correction using reference information from in situ instruments such as buoys. With the release of software Version 1.2, all Aquarius data were reprocessed from the begin-ning (i.e., since late August 2011), a strategy that will continue to be employed as the overall system is better understood and newer algorithms are developed.
During early 2012 the calibration/validation team designed and tested a new correc-tion to radiometer calibration drift using internal sensor data. Along with the new drift correction,Version 1.3 of the processing software included an improved ocean
roughness model and additional near-coast land cor-rections. The team continues to investigate a small bias that has been detected between the data collected on ascending passes (moving south-to-north at 6 PM local time) and descending passes (moving north-to-south at 6 AM local time). Another issue that will require attention is the accuracy of data from areas such as the Southern Ocean, where high winds and low surface temperatures make the retrieval of salinity prone to error.
In addition to reviewing the status of Aquarius, cali-bration, and the salinity retrieval algorithm, the sci-ence team members in attendance discussed future research to improve salinity products. The two ma-jor themes that emerged from the discussion were to coordinate efforts to investigate upper-ocean salin-ity using in-water instruments; and to “harmonize” Aquarius measurements with those from the Europe-an Space Agency’s (ESA’s) Soil Moisture and Ocean Salinity (SMOS) satellite.
Like other ocean-observing satellite instruments, Aquarius detects surface seawater properties to depths of about 1 cm (~0.4 in). Given the dynamic nature of Earth’s seas, it is important to link Aquarius’ “skin” measurements with other observations of the upper ocean. A key advance in this effort is a special series of Argo profiling floats3 being developed at the Univer-sity of Washington (UW), designed to acquire salin-ity and temperature in the upper 10 cm (~4 in) of the
ocean; currently, the shallowest available data are at a depth of 3-5 m (~10-16 ft) with conventional Argo floats. To date, only about 1% of more than 3000 Argo floats have this enhanced capability. However, Jessica Anderson [UW—Graduate Student] pre-sented preliminary results during the science team meeting that suggest that the upper few meters of the ocean are well-mixed at most times, interrupted by significant and often short-lived warming, cooling, and freshening events. Stephen Riser [UW—Ocean Salinity Science Team Investigator] stated that, “This work shows the promise of using Aquarius and Argo together to improve our knowledge of the freshwater cycle in the ocean.” Future deployment of additional enhanced Argo floats, coupled with extensive instrumentation from the Salinity Processes in the Upper Ocean Regional
3 To learn more about Argo, visit: www.argo.ucsd.edu.
Discovering What Drives the Ocean Desert The Salinity Processes in the Upper Ocean Regional Study (SPURS) field experiment will investigate how changes in the water cycle and ocean circulation impact sea surface salinity. SPURS will use a variety of tools—floats, gliders, drifters, moorings, ships, satellites (e.g., Aquarius/SAC-D), and computer models—to help scientists understand the processes controlling upper-ocean salinity. Beginning in summer 2012, the international investigation will focus on the North Atlantic Ocean where salinity is at a maximum, and evidence shows it has been increasing in recent decades. Science objectives include determining what processes maintain the salinity maximum and influence salinity variations over time, finding where the excess salt goes, and examining the effects of salinity change on ocean circulation. For more information, visit: spurs.jpl.nasa.gov.

The Earth Observer July - August 2012 Volume 24, Issue 4 09
feat
ure
artic
lesStudy (SPURS) field experiment, will provide key data for improved understanding of
Aquarius salinity data.
Launched in November 2009, ESA’s SMOS satellite collects ocean salinity data at the same frequency as Aquarius (1.4 GHz), but uses a different technology: an interfero-metric technique in which the signals from many small antennas are used to achieve the resolution of a large antenna. Despite the difference in technology, SMOS data are very complementary to Aquarius data. In fact, early indications from researcher Chris Banks [National Oceanography Centre —U.K.] are that intercomparison of results from these two satellites will be crucial in better understanding the differences between ascending passes and descending passes seen in both missions, the cause of which may be geophysical in nature. A major outcome of the Aquarius/SAC-D Sci-ence Team Meeting was that providing observation-based measurements that are har-monized between Aquarius, SMOS, and in-water surface-based instruments such as Argo floats will be the most help to the scientific community.
Dissemination of Science Information and Future Steps
The Aquarius Science Team is dedicated to sharing its results with the scientific com-munity and public in a timely manner. In February 2012, JPL’s Physical Oceanogra-phy Distributed Active Archive Center (PO.DAAC) released its interactive Aquarius Level 3 image browser. The browser allows navigation and viewing of PO.DAAC Aquarius imagery data by time period as individual global sea surface salinity maps and animation sequences4. GSFC also has a high-resolution image display tool that provides access to Level 2 mapped images at different projections and time periods, including daily, weekly, monthly, and seasonal windows5. The Aquarius Science Team is also investigating the possibility of creating new science products for land surfaces including soil moisture, which may be derived from changes in dielectric properties resulting from variations in water content. Such information from Aquarius would augment data from targeted soil moisture missions such as SMOS and the NASA Soil Moisture Active Passive (SMAP) mission, currently under development.
The Aquarius Education and Public Outreach (EPO) team is developing and sharing content pertinent to science, technology, engineering, and mathematics (STEM). The design and engineering of the satellite, the science of ocean observations, the technical specifications for the mission, and the importance of understanding global processes through data can all be illustrated using Aquarius. The EPO team has taken a multi-pronged approach to creating educational products and opportunities for educators, including bilingual products (i.e., English/Spanish products), online salinity data tools and interactive games, educator workshops, and webinars featuring Aquarius scientists and engineers.
Gary Lagerloef summarized the first year since launch this way: “Overall, the report is that we’re making excellent progress, producing global maps of the ocean salinity field. We’re starting to find some small-scale features that we didn’t expect to see, like the Amazon River outflow, Gulf of Mexico freshening with Tropical Storm Lee, coupling between salinity and circulation—in the ITCZ, for example—and yet we still have work to do on calibration of the Aquarius instrument.” Fortunately, the global oceano-graphic community sees the significant contribution that such high-quality salinity data bring to the table in terms of understanding our ocean and are joining Aquarius on the road to 0.2.
4 To view these images, visit: podaac.jpl.nasa.gov/aquarius/gallery.5 This tool is available at aquarius.nasa.gov/data.html.
Gary Lagerloef sum-marized the first year since launch this way: “Overall, the report is that we’re making excel-lent progress, producing global maps of the ocean salinity field. We’re start-ing to find some small-scale features that we didn’t expect to see, like the Amazon River out-flow, Gulf of Mexico freshening with Tropical Storm Lee, coupling be-tween salinity and cir-culation—in the ITCZ, for example—and yet we still have work to do on calibration of the Aquarius instrument.”

The Earth Observer July - August 2012 Volume 24, Issue 4 10fe
atur
e ar
ticle
s SMAP Applications: Improving Communication for the Palo Verde Nuclear Generating Station Vanessa Escobar, NASA’s Goddard Space Flight Center/Sigma Space, [email protected] Amaller, StormCenter Communications, Inc., [email protected]
Introduction
NASA’s Soil Moisture Active Passive (SMAP) mission—scheduled to launch in 2014—will use a combined microwave radiometer and high-resolution radar to mea-sure surface soil moisture and freeze/thaw state. It is one of four first-tier missions rec-ommended by the National Research Council’s Committee on Earth Science and Ap-plications from Space in its 2007 Decadal Survey.
SMAP data will have significant value for science and applications, as the accuracy, resolution, and global coverage of SMAP soil moisture and freeze/thaw measurements are invaluable across many relevant disciplines. Soil moisture information at high reso-lution enables improvements in weather, flood, and drought forecasts, and predictions of agricultural productivity and climate change.
In an effort to connect NASA Earth-observing satellite data to practical applications that benefit society, application strategies for the SMAP mission have been developed, and prelaunch activities are now being implemented across a variety of disciplines. These application strategies will provide a fundamental understanding of how SMAP products can be integrated into operational procedures to improve decision-making efforts across multiple disciplines. One such application is described here.
Practical SMAP Application Strategies: Palo Verde Nuclear Power Plant
On February 29, 2012, the SMAP Application Team facilitated a SMAP Applications Focus Session at the Palo Verde Nuclear Generating Station (PVNGS) in Tonopah, AZ. The PVNGS is the largest nuclear generation facility in the U.S., averaging over 3.3 gigawats (GW) of electrical power production in 2008 to serve some four million people. The plant is located approximately 55 miles west of downtown Phoenix and is the primary focus for the Arizona Division of Emergency Management’s (ADEM) Ra-diological Emergency Preparedness (REP) Program. Drills and exercises are conducted regularly to evaluate emergency plans, response capabilities, and related protocols.
The PVNGS is the only nuclear generating facility in the world that is not situated adjacent to a large body of above-ground water. The facility evaporates water from the treated sewage of several nearby municipalities to meet its cooling needs. The safe operation of such an innovative system is contingent on plant operators having ac-cess to timely and accurate information on a variety of environmental factors. The application of remote sensing products (e.g., those from SMAP) may offer an effec-tive means of meeting these requirements. Satellites can monitor changing water re-sources (crucial for maintaining reactor cooling under the stress of climate change) and track field operations; this information can be made available to decision makers in remote areas. Other products might address the environmental factors that would trigger changes to emergency responses and decisions.
Many of the complex geographic information systems (GIS) tools used today by de-cision makers exist as standalone modules that are not designed to be interoperable. To address such deficiencies, the Focus Session exercise was designed to introduce a collaborative real-time tool—called the Envirocast® VisionTM Collaboration Module (EVCM)1—that will serve as the plant’s geospatial Collaborative Common Operat-ing Picture (C-COP) to facilitate the delivery of NASA data products for fusion with end-user products, datasets, and maps from other sources. EVCM also enabled other 1 The Envirocast® VisionTM Collaboration Module (EVCM) was developed by StormCenter Communications, Inc.
SMAP data will have significant value for sci-ence and applications... Soil moisture informa-tion at high resolution enables improvements in weather, flood, and drought forecasts, and predictions of agricul-tural productivity and climate change.
The Earth Observer July - August 2012 Volume 24, Issue 4 11
feat
ure
artic
lesfederal agencies—such as the National Oceanic and Atmospheric Administration and
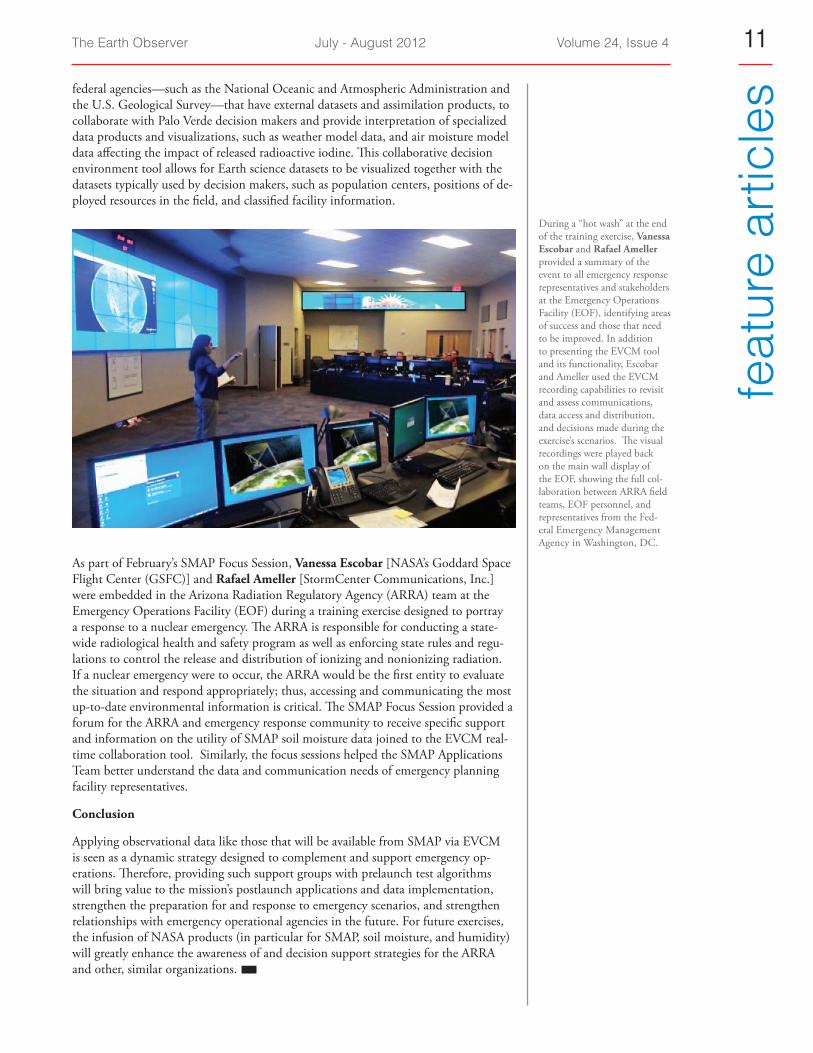
the U.S. Geological Survey—that have external datasets and assimilation products, to collaborate with Palo Verde decision makers and provide interpretation of specialized data products and visualizations, such as weather model data, and air moisture model data affecting the impact of released radioactive iodine. This collaborative decision environment tool allows for Earth science datasets to be visualized together with the datasets typically used by decision makers, such as population centers, positions of de-ployed resources in the field, and classified facility information.
As part of February’s SMAP Focus Session, Vanessa Escobar [NASA’s Goddard Space Flight Center (GSFC)] and Rafael Ameller [StormCenter Communications, Inc.] were embedded in the Arizona Radiation Regulatory Agency (ARRA) team at the Emergency Operations Facility (EOF) during a training exercise designed to portray a response to a nuclear emergency. The ARRA is responsible for conducting a state-wide radiological health and safety program as well as enforcing state rules and regu-lations to control the release and distribution of ionizing and nonionizing radiation. If a nuclear emergency were to occur, the ARRA would be the first entity to evaluate the situation and respond appropriately; thus, accessing and communicating the most up-to-date environmental information is critical. The SMAP Focus Session provided a forum for the ARRA and emergency response community to receive specific support and information on the utility of SMAP soil moisture data joined to the EVCM real-time collaboration tool. Similarly, the focus sessions helped the SMAP Applications Team better understand the data and communication needs of emergency planning facility representatives.
Conclusion
Applying observational data like those that will be available from SMAP via EVCM is seen as a dynamic strategy designed to complement and support emergency op-erations. Therefore, providing such support groups with prelaunch test algorithms will bring value to the mission’s postlaunch applications and data implementation, strengthen the preparation for and response to emergency scenarios, and strengthen relationships with emergency operational agencies in the future. For future exercises, the infusion of NASA products (in particular for SMAP, soil moisture, and humidity) will greatly enhance the awareness of and decision support strategies for the ARRA and other, similar organizations.
During a “hot wash” at the end of the training exercise, Vanessa Escobar and Rafael Ameller provided a summary of the event to all emergency response representatives and stakeholders at the Emergency Operations Facility (EOF), identifying areas of success and those that need to be improved. In addition to presenting the EVCM tool and its functionality, Escobar and Ameller used the EVCM recording capabilities to revisit and assess communications, data access and distribution, and decisions made during the exercise’s scenarios. The visual recordings were played back on the main wall display of the EOF, showing the full col-laboration between ARRA field teams, EOF personnel, and representatives from the Fed-eral Emergency Management Agency in Washington, DC.
The Earth Observer July - August 2012 Volume 24, Issue 4 12fe
atur
e ar
ticle
s Weird Science: NASA Inspires a Creative Expedition Heather Hyre, NASA’s Goddard Space Flight Center/Wyle, [email protected] Graham, NASA’s Goddard Space Flight Center/Wyle, [email protected]
Have you ever been on a scientific expedition to uncover the cause of a mysterious event? What was the destination of your expedition? How did you get there? Did you collect samples? If so, what type of device did you use to collect the samples? What did you discover?
For those who have actually been on a scientific expedition, these questions would be easy to answer, but for others, only imagination can provide answers.
For the twelfth consecutive year, NASA’s Earth Observing System Project Science Of-fice (EOSPSO) sponsored an Odyssey of the Mind (OM) long-term creative problem to be solved during the school year, with regional winners competing at the World Fi-nals. This year’s NASA-sponsored problem was Weird Science. Given a budget of $145 U.S. dollars, student teams were tasked with creating and presenting a performance about a team of scientists on an expedition to uncover the cause of a mysterious event. However, there was a catch: Each team had to select the destination of their expedition from a specified set of NASA Earth Observatory images, as found at: earthobservatory.nasa.gov/OdysseyOfTheMind.
The 2012 OM World Finals took place May 23-26 at Iowa State University in Ames, IA. During the competition, 815 teams from 33 states and 15 countries competed for the title of World Champion across several challenges.
Out of the 113 teams participating in the NASA-sponsored Weird Science challenge, the following won top honors in their division:
Division 1 (Grades K-5 in the U.S.; age under 12 for international teams)
1st Place: Ekologiczna Szkola Spoleczna—Rumia, Poland 2nd Place: St. Jude the Apostle Catholic School—Atlanta, GA 3rd Place: Stratford Landing Elementary School—Alexandria, VA 4th Place: Hackler International School—Mountain Home, AR 5th Place: Colonial Elementary School—Plymouth Meeting, PA 6th Place: EP Pearce Elementary School—Greensboro, NC 7th Place: Mary Blair Elementary School—Loveland, CO
Division 2 (Grades 6-8 in the U.S.; age under 15 for international teams)
1st Place: Foshan Jiujian Junior Middle School—Foshan, China 2nd Place: Sarasota Christian School—Sarasota, FL
3rd Place: Wildwood Christian Academy— Marble Hill, GA 4th Place (tied for 4th): Sandburg Middle School— Alexandria, VA 4th Place (tied for 4th): St. Jude the Apostle Catholic School—Atlanta, GA 5th Place: Magnolia Intermediate School— Grass Valley, CA 6th Place (tied for 6th): Parkway School—Boone, NC 6th Place (tied for 6th): Ekologicana Szkola Spoleczna— Rumia, Poland 7th Place: North Rockford Middle School—Rockford, MI
For the twelfth con-secutive year, NASA’s Earth Observing Sys-tem Project Science Of-fice (EOSPSO) spon-sored an Odyssey of the Mind (OM) long-term creative problem to be solved during the school year, with regional win-ners competing at the World Finals. This year’s NASA-sponsored prob-lem was Weird Science.
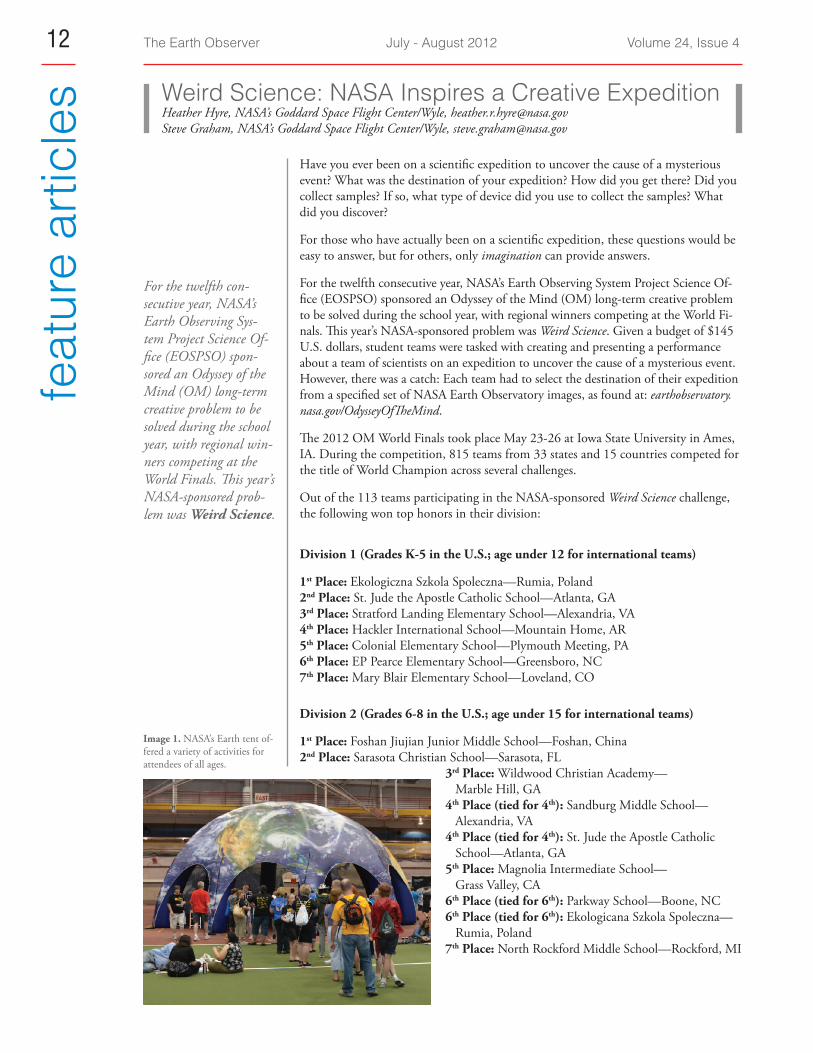
Image 1. NASA’s Earth tent of-fered a variety of activities for attendees of all ages.

The Earth Observer July - August 2012 Volume 24, Issue 4 13
feat
ure
artic
les
Division 3 (Grades 9-12 in the U.S.; other international not covered by Divisions 1 or 2)
1st Place: Raffles Girls Secondary School—Singapore, Singapore 2nd Place: Southlake Carroll High School—Grapevine, TX 3rd Place: Myers Park High School White—Charlotte, NC 4th Place (tied for 4th): Penndale Middle School—Lansdale, PA 4th Place (tied for 4th): Lake Norman High School—Mooresville, NC 5th Place: The Charter School of Wilmington—Wilmington, DE 6th Place: Hunter Tannersville Middle/High School—Tannersville, NY 7th Place: Newtown High School—Newtown, CT
Division 4 (Collegiate groups and adults)
1st Place: Pima Community College—Tucson, AZ 2nd Place: Ulsan National Institute of Science Technology—Ulsan, South Korea 3rd Place: University of Delaware—Newark, DE 4th Place: St. Josephs University Parish—Terre Haute, IN
In between dramatic costume changes and unique performances, students, coaches, parents, and community members alike participated in various on-campus activities, including several sponsored by NASA. The NASA Science exhibit featured a large 40’x40’ Earth tent, filled with educational materials for students and teachers—see Image 1. As part of the exhibit, a scavenger hunt gave participants the opportunity to examine large images that revealed extraordinary facts about our home planet—see Image 2.
In addition to the NASA Science exhibit, students were able to design, and keep their own satellite models built using Lego blocks at the Engineer a Satellite activity—see Image 3. Also, the Earth Science E-theatre provided audience members with unique views of our home planet, using data from many of NASA’s Earth-observing satellites—see Image 4.
The title of next year’s NASA-sponsored long-term creative problem is It’s How You Look at It. Each team will have to create and present an original humorous performance that in-cludes two characters who act naturally by their own standards, but oddly to those around them. One scene will establish the “normal” behavior of one character who, at some point in the performance, is among others who react to what they see as out-of-place behavior. The other character’s behavior will stand out too, but this character will end up in a setting where the “odd” behavior is considered normal. The performance will need to include a meter that indicates the degree of odd/normal behavior, and a creative scene change. Next year’s World Finals will be held at Michigan State University in Lansing, MI. For more in-formation about OM, visit: www.odysseyofthemind.com.
Image 2. Participants completed the NASA Scavenger Hunt activity outside the NASA Earth tent.
Image 3. Students used Lego blocks to build their own satellites dur-ing the Engineer a Satellite activity.
Image 4. During an Earth Science E-theatre pre-sentation, Steve Graham [NASA’s Goddard Space Flight Center] described the changes in strato-spheric ozone concentrations over Antarctica.

The Earth Observer July - August 2012 Volume 24, Issue 4 14fe
atur
e ar
ticle
s NASA Scientists Lead Earth and Climate Change Forum Ernest Hilsenrath, University of Maryland Baltimore County, [email protected]
Introduction
NASA scientists recently participated in a two-day forum held to discuss the latest findings on climate change based on satellite observations. The Howard Commu-nity College (HCC) Science and Technology Division, the Climate Change Initiative of Howard County, Howard County’s Office of Environmental Sustainability, and NASA sponsored the two-part event held at HCC in Columbia, MD. The goal of the forum was to raise student and public awareness about the Earth’s changing climate and NASA’s role in studying our ever-changing planet.
A student event was held on Wednesday, March 21, followed by a community event that took place on Saturday, March 25. During both events, NASA scientists present-ed the latest data and images from Earth-observing satellites, and discussed how cli-mate change impacts the Earth’s atmosphere, oceans, ice, and land. Ernest Hilsenrath [NASA retiree, University of Maryland Baltimore County Fellow, and Climate Change Initiative of Howard County member] organized and moderated the two events. To complement the official forums, personnel from NASA’s Education and Public Out-reach (EPO) offices and local Howard County environmental advocacy groups provid-ed engaging exhibits dealing with space observations of our planet and information on sustainability. Nearly 200 people attended each event.
Student Event
For the student event, Robert “Bob” Cahalan [NASA’s Goddard Space Flight Center (GSFC)] used satellite data to provide an overview of how the Earth’s environment is
responding to climate change, and showed evidence that human activities are the source of recent global warming. The satellite data show decadal trends in sea level rise, glacial mass and snow cover decrease, and global temperature rise, all of which are probably caused at least in part by increases in carbon dioxide (CO2) emissions, and which are also responsible for increases in ocean acidity. Cahalan provided strong arguments that observed changes in the Sun’s output do not explain the temperature increases of recent decades, nor the stratospheric cooling observed over the same period. Cahalan is NASA’s chief scientist whose responsibilities include collecting, verifying, and distributing solar intensity satellite data. He also touched on how global warming is affecting flora and fauna species, diversity, and survival. Speaking from a personal perspective after his formal presenta-
tion, Cahalan began the student question and answer (Q&A) period by citing various grass-roots efforts to mitigate global climate change and providing a “reason for hope,” stating, “…the fact that humans are causing climate change is good news. That means we can do something about it,” citing actions to cut greenhouse gases and to reduce the severity of the impacts, such as lowering our energy consumption, investing in re-newable energy, planting trees, and more.
Community Event
The community event had two parts: The first consisted of three lectures from senior NASA Earth scientists who use satellite data to conduct climate change research; the second, a Q&A period. Claire Parkinson [GSFC], whose talk was titled Sea Ice, Ice Sheets, and Why They Matter, gave an overview of the importance of sea ice and ice
The goal of the forum was to raise student and public awareness about the Earth’s changing climate and NASA’s role in studying our ever-changing planet.
Ernest Hilsenrath [left] and Bob Cahalan [right] at the student event. Image credit: NASA

The Earth Observer July - August 2012 Volume 24, Issue 4 15
feat
ure
artic
lessheets and what we are learning about them through satellite data. Comparisons were
made between the Arctic and Antarctic sea- and land-ice changes over the last 30 years, highlighting the record-low Arctic sea ice areal extent in 2007 and the impor-tance of land-ice changes to sea-level rise. Prominent Arctic sea ice decreases since the late 1970s were attributed at least in part to warm-ing in the Arctic region, whereas the mixed pattern of sea ice increases and decreases in the Antarctic re-quire more complicated explanations, including pos-sible circulation changes.
Ralph Kahn’s [GSFC] presentation, titled, How the Sun and a Changing Atmosphere Affect Climate, focused on how climate is controlled by changes in various radiative forcing components. The ma-jor components are greenhouse gases, such as CO2 and water vapor; airborne particles, such as wildfire smoke, desert dust, volcanic ash, and urban and in-dustrial pollution; the reflectivity of Earth’s surface; and the Sun. The strongest evidence pointing to human-caused climate changes were temperature simulations covering the last 90 years, reported by the Intergovernmental Panel on Climate Change (IPCC). They showed the differences between climate model results that included and excluded anthropogenic forcing (primarily measured CO2 increases). Those sim-ulations that included the increased anthropogenic forcing matched the observed temperatures much more closely.
Compton Tucker [GSFC], whose presentation was titled, The Carbon Cycle: Obser-vations of Sources and Sinks, began by reviewing the carbon cycle and then discussed the impact of climate change on the biosphere. Using satellite data, he showed that as the Arctic warmed, it became greener. In contrast, satellite data showed that tropical glacier mass decreased significantly (27% in 20 years), and was correlated to the in-creased temperatures.
The following Q&A period (with questions submitted by the audience during the break) was handled by a panel consisting of the three NASA scientists and three guest experts representing the science policy community: Gray Maxwell [U.S. Senator Ben Cardin’s Floor Manager], Mandy Warner [Environmental Defense Fund (EDF)—Climate and Air Quality Analyst], and Clark Weaver [Goddard Earth Sciences and Technology Center (GEST), representing the American Geophysical Union (AGU)]. Before the Q&A period, each of the guest panelists commented on the preceding GSFC lectures and then described their own experience with climate change policy.
Maxwell, on behalf of Senator Cardin, initially thanked GSFC for its climate research efforts. He went on to explain the difficulties Congress encounters when trying to move climate legislation forward because of strong political positions taken by Con-gress members, regardless of scientific results and predictions.
Warner explained the advocacy role of the EDF in working with Congress and gov-ernment agencies such as the Environmental Protection Agency (EPA) and the U.S. Department of Energy. Progress has been limited because of increased partisanship at the national level. However, Warner assured the attendees that there is progress at state and local levels for reducing emissions, as exemplified by activities in California. She also noted the success in implementating the administration’s new Corporate Average Fuel Efficiency (CAFE) automobile gas mileage standards and the pending EPA re-strictions on power plant emissions.
Weaver, representing the AGU, gave an account of his visit to Capitol Hill to discuss climate change with members of Congress and their staffs. He pointed out that their
[Left to right] Gary Maxwell, Mandy Warner, Compton Tucker, Claire Parkinson, and Ralph Kahn during the Q&A period at the community event. Image credit: NASA

The Earth Observer July - August 2012 Volume 24, Issue 4 16fe
atur
e ar
ticle
s interests focused primarily on the impacts of global warming in their districts, and that any attempt to curtail CO2 emissions had to have no negative impact on jobs. He did point out that staff members were interested in climate science, so that they would be better able to explain their congressperson’s votes, should a constituent ask.
The Q&A period with the panel was very lively, with relatively little dissent regarding the science presented. However, there were questions dealing with validity of long-term satellite datasets and whether the temperature anomalies now seen could be part of natural cycles. These questions were convincingly answered by the NASA scientists through further elaboration of topics covered in their lectures.
The most arousing issue in the debate was how the print and electronic media report on climate change. The panel’s concern was that those who argue against links be-tween human activity and climate change in many instances have little expertise, but are given the same attention as researchers who have spent their careers producing peer-reviewed climate science.
The Q&A period ended shortly after Gray Maxwell quoted one of his former em-ployers, Senator Daniel Patrick Moynihan from New York, who once said that, “Peo-ple are entitled to their own opinions, but not to their own facts.”
Kudos Elizabeth (Betsy) Middleton [NASA’s Goddard Space Flight Center (GSFC)—Physical Scientist] of the Bio-spheric Sciences Laboratory has been named this year’s recipient of the William Nordberg Memorial Award for Earth Science. This high-achievement award recognizes the employee from GSFC who best exhibits the quali-ties of broad scientific accomplishments in the area of Earth sciences that exemplified Nordberg’s own career.
Middleton is a trained ecologist and botanist who joined GSFC in 1978, during the early days of the Eastern Regional Remote Sensing Applications Center (ERRSAC), predecessor of the Biospheric Sciences Laboratory, where she was a project manager and remote sensing specialist. Over the past two decades, her research has focused on hyperspectral reflectance and fluorescence properties of vegetation, with emphasis on applications for remote sensing retrievals of important carbon cycle science parameters. In addition to basic laboratory and field studies to untangle the interaction of reflectance and fluorescent properties of vegetation, she has man-aged a team that pioneered the use of “ocean bands” of the Moderate Resolution Imaging Spectroradiometer for land applications, specifically for terrestrial vegetation assessments of photosynthetic efficiency over forests.
kudo
s Middleton is a member of the Ecological Society of America (ESA); the American Institute of Biological Sci-ences (AIBS); the American Association for the Advancement of Science (AAAS); the Institute of Electrical and Electronics Engineers (IEEE); and the American Geophysical Union (AGU), with over 100 publications.
Please join us in congratulating Betsy Middleton on receiving this award.

The Earth Observer July - August 2012 Volume 24, Issue 4 17
mee
ting/
wor
ksho
p su
mm
arie
s SORCE SSI Workshop SummaryJerald Harder, Laboratory for Atmospheric and Space Physics, University of Colorado, [email protected] Rice, National Institute of Standards and Technology, [email protected] Snow, Laboratory for Atmospheric and Space Physics, University of Colorado, [email protected] Woods, Laboratory for Atmospheric and Space Physics, University of Colorado, [email protected]
From February 28–March 1, 2012, over 30 scientists and calibration specialists gathered at the National In-stitute of Standards and Technology (NIST) in Gaith-ersburg, MD, for the first Solar Spectral Irradiance (SSI) Variations Workshop. The purpose of the workshop was to address the interesting and conflicting differences for the SSI variations reported during the Solar Radiation and Climate Experiment (SORCE) mission and other missions. The SORCE Science Team, in collaboration with NIST and NASA’s Goddard Space Flight Center (GSFC), met with other SSI instrument teams and cali-bration experts to examine these discrepancies by focus-ing on issues primarily related to understanding degra-dation trends that affect the measurement of solar cycle variations in irradiance. The agenda included:
• Reviewing various SSI instrument observations, capa-bilities, and their estimated irradiance uncertainties;
• discussing how each instrument team analyzed the spectral data, to separate instrument effects (e.g. degradation) from intrinsic solar variations;
• discussing the reported SSI differences and refine-ment of the uncertainties, to gain a better under-standing of them; and
• planning future methods, to identify the significant differences (e.g., new studies, new calibrations, etc.) and refine uncertainties.
A summary of this workshop, including PDF versions of many of the presentations, is available at lasp.colorado.edu/sorce/workshops/index.htm.
Gary Rottman [Laboratory for Atmospheric and Space Physics, University of Colorado (LASP/CU)—Original SORCE Principal Investigator] opened the workshop and discussed the challenges in understanding SSI so-lar cycle variability. He cautioned that space is a hostile environment for optical instruments used to observe the Sun. The responsivity of all instruments changes with time and exposure for several reasons, but degra-dation presents the greatest obstacle to determining so-lar variability.
A critical requirement for this workshop was that participants examine the methods used to perform long-term instrument degradation corrections. The techniques used for correcting on-orbit irradiance vary from instrument to instrument, so analysis of how these corrections are performed and uncertainty estimates for those corrections are necessary.
The importance of this problem is shown in Figure 1. The top panel shows how the solar spectrum is “filtered” from the top of the atmosphere to the surface, showing that solar variability is significant throughout the entire spectrum. The lower panel portrays one model’s esti-mate of the solar variability based on partitioning to-tal solar irradiance (TSI) measurements in the visible/infrared (VIS/IR) and applying measured variability in the 200–400-nm range from the Upper Atmosphere
Figure 1. [Top] Solar radiation is absorbed differentially across its spec-trum by the Earth’s atmosphere. [Bottom] Solar variability predicted from models based on total solar irradiance (TSI) and ultraviolet SSI observations [adapted from Solanki and Unruh, 1998]. Horizontal lines show limits of detectable variability achievable with current instru-ments (dotted) and capabilities required to measure solar variability at visible wavelengths (dashed). Image credit: Gary Rottman
Artist’s rendering of SORCE in orbit.
The Earth Observer July - August 2012 Volume 24, Issue 4 18m
eetin
g/w
orks
hop
sum
mar
ies
Research Satellite (UARS), with a standard uncertainty of about 1% in this region. However, measurements of variability in the VIS and near-infrared (NIR) spectral ranges are much less certain, because in spite of the low-er degradation in the VIS/IR portion of the spectrum. The degradation corrections become comparable to the expected variability. To understand the degradation cor-rections, a measurement equation approach is necessary to define the irradiance corrections and to evaluate the uncertainties in the observations. The same approach is used to evaluate where potential systematic uncertain-ties arise in the measurements.
Representatives from several U.S. and international SSI instrument teams made presentations at the workshop. These included the following:
• Marty Snow, Bill McClintock, and Tom Woods [all from LASP/CU] – SORCE Solar-Stellar Irradi-ance Comparison Experiment (SOLSTICE) and UARS SOLSTICE;
• Linton Floyd and Jeff Morrill [both from Naval Research Laboratory] – UARS Atmospheric Labo-ratory for Applications and Science (ATLAS) Solar Ultraviolet Spectral Irradiance Monitor (SUSIM);
• Matt DeLand [Science Systems and Applications Inc.] – Solar Backscatter Ultraviolet Instrument (SBUV);
• Gérard Thuillier [Laboratoire Atmosphères, Mi-lieux, Observations Spatiales (LATMOS-CNRS)] – ATLAS Solar Spectrum (SOLSPEC);
• Christoph Wehrli [Physikalisch-Meteorologisches Observatorium (PMOD), Davos, Switzerland] – Solar and Heliospheric Observatory (SOHO) Vari-ability of solar Irradiance and Gravity Oscillations (VIRGO);
• Jerry Harder and Juan Fontenla [both from LASP/CU] – SORCE Spectral Irradiance Monitor (SIM); and
• Gäel Cessateur [PMOD] – PICARD1 Precision Monitoring Sensor (PREMOS).
Each had an opportunity to explain how their instru-ment adheres to a measurement equation and to explain additional contributions and/or omissions.
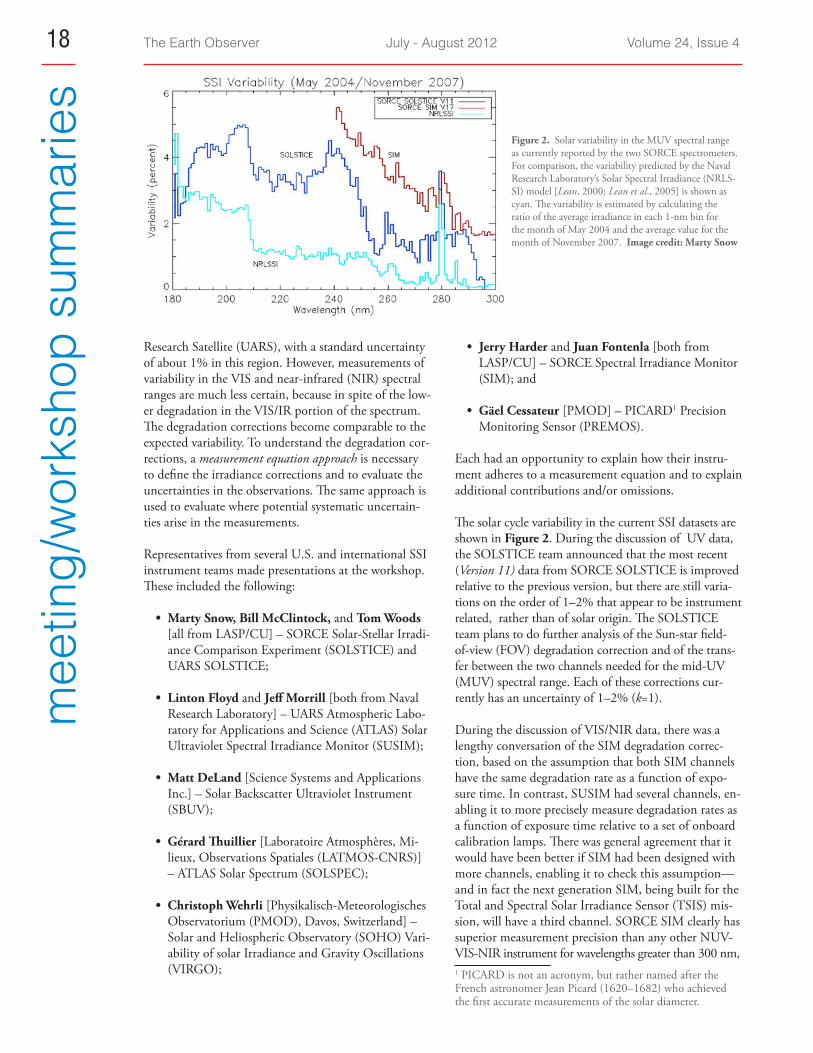
The solar cycle variability in the current SSI datasets are shown in Figure 2. During the discussion of UV data, the SOLSTICE team announced that the most recent (Version 11) data from SORCE SOLSTICE is improved relative to the previous version, but there are still varia-tions on the order of 1–2% that appear to be instrument related, rather than of solar origin. The SOLSTICE team plans to do further analysis of the Sun-star field-of-view (FOV) degradation correction and of the trans-fer between the two channels needed for the mid-UV (MUV) spectral range. Each of these corrections cur-rently has an uncertainty of 1–2% (k=1).
During the discussion of VIS/NIR data, there was a lengthy conversation of the SIM degradation correc-tion, based on the assumption that both SIM channels have the same degradation rate as a function of expo-sure time. In contrast, SUSIM had several channels, en-abling it to more precisely measure degradation rates as a function of exposure time relative to a set of onboard calibration lamps. There was general agreement that it would have been better if SIM had been designed with more channels, enabling it to check this assumption—and in fact the next generation SIM, being built for the Total and Spectral Solar Irradiance Sensor (TSIS) mis-sion, will have a third channel. SORCE SIM clearly has superior measurement precision than any other NUV-VIS-NIR instrument for wavelengths greater than 300 nm, 1 PICARD is not an acronym, but rather named after the French astronomer Jean Picard (1620–1682) who achieved the first accurate measurements of the solar diameter.
Figure 2. Solar variability in the MUV spectral range as currently reported by the two SORCE spectrometers. For comparison, the variability predicted by the Naval Research Laboratory’s Solar Spectral Irradiance (NRLS-SI) model [Lean, 2000; Lean et al., 2005] is shown as cyan. The variability is estimated by calculating the ratio of the average irradiance in each 1-nm bin for the month of May 2004 and the average value for the month of November 2007. Image credit: Marty Snow

The Earth Observer July - August 2012 Volume 24, Issue 4 19
mee
ting/
wor
ksho
p su
mm
arie
s but uncertainties for its long-term trend could be larger than the solar cycle variation. This will be studied dur-ing the rising phase of Solar Cycle 24, with the reversal of irradiance trends—see Figures 3 and 4.
On the second day of the workshop NIST experts led the discussions and reviewed laboratory studies char-acterizing material damage and analysis of degradation mechanisms for spaceflight missions. They offered an independent perspective on root causes of degradation in SSI instruments, beginning with the assumption that the degradation rate is dependent on exposure time, materials, pressure, and temperature. The greatest deg-radation is caused by photons with wavelengths shorter than 200 nm, but degradation mechanisms can still be effective at longer UV wavelengths.
Uwe Arp [NIST] addressed capabilities of the NIST Synchrotron Ultraviolet Radiation Facility (SURF III) for the calibration of SSI throughout the UV, VIS,
and IR spectral ranges. Shannon Hill [NIST] dis-cussed issues related to the degradation of optical ma-terials with exposure to intense vacuum UV (VUV) radiation; Ping Shaw [NIST] then focused on detec-tor degradation, sharing new results on silicon (Si) photodiode degradation in the UV that he has been studying at SURF. Shaw concluded that some Si pho-todiodes are more stable than others, and that most degradation is caused by photons with wavelengths shorter than 400 nm, and is related to surface degra-dation effects. His research also shows that over a pe-riod of months photodiodes can recover about half of their sensitivity loss after exposure, and a degradation function needs to have both fast and slow decay com-ponents as related to exposure rate.
Allan Smith [NIST] discussed the calibration capa-bilities of NIST’s Spectral Irradiance and Radiance Responsivity Calibrations using Uniform Sources (SIRCUS) facility for SSI instruments in the VIS to
Figure 3. Time series comparing observations at 300 nm for the two SORCE instruments (SOL-STICE and SIM) that measure SSI with UARS SUSIM. The NRLSSI curve shows results from a model with inputs based on past observations is plotted for comparison. In each case, the time series was normalized to be unity in May 2004. Based on observations from the previous solar cycle, the vari-ability shown by the NRLSSI model is what was expected by many scientists for the current solar cycle. The trend shown by the SOLSTICE dataset is consistent with the NRLSSI model at this wave-length given the estimated uncertainty in the SOL-STICE degradation correction (see text). Estimated uncertainty in the SIM degradation correction from the intercomparison of its two channels is ±0.3% (k=1). The trend shown by the SIM dataset is well in excess of the variability predicted by the NRLSSI model at this wavelength. Image credit: Marty Snow
Figure 4. Time series comparing observations at 393 nm for SORCE SIM and UARS SUSIM. This wavelength includes the variability in singly ionized calcium data. As in Figure 3, the datasets are nor-malized to May 2004. Image credit: Marty Snow

The Earth Observer July - August 2012 Volume 24, Issue 4 20m
eetin
g/w
orks
hop
sum
mar
ies IR range. Joannie Chin [NIST] concluded the NIST
segment by discussing NIST’s capabilities in measur-ing polymer-based degradation. She explained that al-though all materials degrade, ground-based (in-atmo-sphere) degradation of materials may not be directly applicable for space (in-vacuum) degradation effects. Erik Richard [LASP/CU] concluded the session by sharing his radiation testing experience for the TSIS SIM instrument.
NASA contamination experts David Hughes and Therese Errigo [both from GSFC] shared their knowl-edge of degradation and contamination effects, offered suggestions on how spaceflight instruments might be designed for reduced degradation, and discussed how scientists might better understand contamination. Op-tions included having vents towards the anti-Sun side and/or extending beyond any radiator plate, provid-ing a means to warm up optics and detectors during flight, flying a cold trap/cold plate near sensitive optics, and flying a thermoelectric quartz crystal microbalance (TQCM) to monitor contamination deposition rate in real-time during flight.
Attendees compared the SSI observations from all in-struments presented at the workshop at all applicable wavelengths. Each instrument had its own unique chal-lenges regarding calibration and degradation; key in-strument degradation trend challenges are listed here:
• Degradation trends are complicated because there are many variables that must be accounted for (e.g., multiple drivers, multiple parameters, differ-ent time scales).
• Most instrument calibration channels have differ-ent trend relationships with exposure time that are different from their daily channels.
• Laboratory measurements indicate that photodi-odes can have significant recovery—up to 50%—after being exposed to intense levels of UV radia-tion if they are kept unexposed for a period of time after the UV exposure.
• Carbon deposition degradation rate has many de-pendences (e.g., pressure, temperature, contamina-tion materials), so the same optical elements can have different trends. Both elapsed time and expo-sure time are potentially important, due to the re-covery phenomenon described earlier.
• Solar spectral changes at different points in a solar cycle can enhance degradation (i.e., one minute of solar-cycle maximum exposure is not the same as one minute of solar-cycle minimum exposure).
The workshop concluded with a discussion of action items required to move forward on this complicated is-sue. These included:
• Improving SOLSTICE, SIM, and PREMOS tem-perature corrections;
• making SORCE SIM 2003 data available for SUSIM comparisons;
• applying SUSIM reference channel data results as comparison data for the SBUV instruments onboard the National Oceanic and Atmospheric Admin-istration’s Polar-orbiting Environmental Satellites (NOAA-16 and NOAA-17);
• studying degradation models for each instrument in more detail; albeit, owing to the unique nature of each instrument, developing common functions that can be shared with others will likely be difficult;
• studying contamination degradation as a func-tion of exposure time to the EUV and X-ray wave-lengths that damage the optics;
• exploring how continuous versus intermittent ex-posure (i.e., occasional use) affect degradation rate including a possible in-flight experiment for SIM and laboratory measurements of SIM-like optics and SUSIM-like lamps;
• initiating a comparative study of SORCE and ISS SOLSPEC irradiance on specific days since the start of the SOLSPEC record in 2007;
• comparing SORCE and VIRGO/PREMOS pho-tometers in more detail;
• studying validation of TSIS SIM laboratory cali-bration with a NIST 0.1% uncertainty lamp (or other source); and
• planning a second SSI Variations Workshop.
This fall there will be a small one-day follow-up SSI Validation Workshop to continue the discussions from the first workshop, to revisit the progress on the action items, and to compare instrument datasets.
References
Lean, J., Geophysical Research Letters, 27, 16, 2425, 2000. Lean, J., G. Rottman, J. Harder, and G. Kopp, Solar Physics, 230, 27, 2005. Solanki, S. K. and Y. C. Unruh, Astronomy and Astrophysics, 329, 747, 1998.
The Earth Observer July - August 2012 Volume 24, Issue 4 21
mee
ting/
wor
ksho
p su
mm
arie
sHDF and HDF-EOS WorkshopDaniel J. Marinelli, NASA’s Goddard Space Flight Center, [email protected]
The fifteenth HDF and HDF-EOS1 workshop took place April 17-19, 2012, in Riverdale, MD. Sixty peo-ple representing a variety of interests attended, includ-ing users, tool developers, and data producers. This year’s theme was Embracing New Missions: Integrating Data Across Generations. The full agenda with presenta-tions and posters for all three days can be found at hd-feos.org/workshops/ws15/workshop_fifteen.php.
After a welcome by Dan Marinelli [NASA’s Goddard Space Flight Center (GSFC)—Earth Science Data and Information System (ESDIS) Project], Barbara Jones [The HDF Group (THG)] provided a hands-on exer-cise as an introduction to HDF5 data and program-ming models. The rest of the first day of the workshop was dedicated to tutorial sessions.
Elena Pourmal [THG] led a tutorial that addressed HDF features for working with complex data, thereby to achieve better input/output performance and ef-ficient storage. Peter Cao and Dan Kahn [both from THG] then followed with a primer on HDF5 utili-ties and a demonstration of tools using Python and the h5py module, giving some real-world examples.
There was a hands-on collaborative/consultation exer-cise that took place just before lunch. After the break, Ebrahim “Abe” Taaheri [Raytheon Intelligence and Information Systems] provided demonstrations of the current HDF-EOS tool, called HEG, that converts HDF-EOS formatted data to the GeoTIFF public do-main metadata standard, and the HDF-EOS “plug-in”2 for the HDFView browser. HEG is a versatile tool that provides subsetting, resampling, swath-to-grid conver-sion, and more3.
This was followed by a tutorial by John Evans [Math-Works], who demonstrated how the latest release of MATLAB supports HDF5, netCDF4, and Open
1 HDF stands for hierarchical data format, a file format de-signed for storing and organizing large amounts of data. A version of HDF called HDF-EOS has been developed and has become the standard file format for all data produced by the Earth Observing System of satellites—and is now being extended for use with Suomi NPP/Joint Polar Satellite Sys-tem data.2 Information on the plug-in can be found at newsroom.gsfc.nasa.gov/sdptoolkit/HDFView/HDFView_hd-feos_plugin.html.3 Information on the HEG tool can be found at newsroom.gsfc.nasa.gov/sdptoolkit/HEG/HEGHome.html.4 NetCDF stands for network common data form.
Data Access Protocol (OPeNDAP5). Then, Kent Yang [THG] provided details of THG’s experience with making Suomi National Polar-orbiting Partnership (Suomi NPP) and HDF-EOS5 data products accessible by netCDF through an augmentation of the original HDF5 files. Joe Lee [THG] presented Tools to Improve the Usability of NASA HDF Data, and went into the specific tools that have been built to allow HDF data to be accessed through tools built for other formats, such as netCDF.
The second day of the workshop opened with remarks by Dan Marinelli, who addressed NASA’s Earth Ob-serving Satellite Data and Information System (EOS-DIS) status and developments. This was followed by a presentation by Ted Habermann [National Oceanic and Atmospheric Administration’s National Geophysi-cal Data Center (NOAA NGDC)] that was the high-light of the second day of the workshop. During his presentation, titled Granules Are Forever, Habermann described much of what the Earth sciences community has been going through in past decades with respect to progress in the areas of data and metadata—namely the movement toward hierarchical representations of both. He stressed that it is important for producers and consumers to make use of the parallels in data and metadata representations to enable efficient data dis-covery and transformation to useful information and, subsequently, to advancing the state of knowledge in several areas. His takeaway point was that progress most effectively derives from focused energy at the community level rather than from individuals work-ing alone, because developments that are commu-nity driven are mutually supportive and cumulative, whereas individual contributions are not always uni-versally accepted, nor usually as robust. More impor-tant, what is being produced now will be in place for years to come and could potentially support members of the community who have not yet been born. All of this means that clear communication of our data/infor-mation/knowledge/wisdom to future generations is vi-tally important to allow future users to view our Earth science enterprise as more than a hodgepodge of data and systems.
After the presentation, Dan Marinelli summarized the 2011 EOSDIS User Survey; Mike Folk [THG] de-scribed HDF Project status and plans; and Abe Taaheri presented on the current status of HDF-EOS mainte-nance, developments, and tools.
5 OPeNDAP is a common data transport protocol used by Earth scientists.

The Earth Observer July - August 2012 Volume 24, Issue 4 22m
eetin
g/w
orks
hop
sum
mar
ies In the afternoon, the group heard presentations from
Siri Jodha Khalsa [National Snow and Ice Data Center (NSIDC)], James Johnson [Goddard Earth Sciences Data and Information Services Center (GES DISC)], Jeffrey Lee [NASA’s Goddard Space Flight Center (GSFC)/Stinger Ghaffarian Techologies, Inc.], Benja-min White [Raytheon], and Yuanzheng Shao [George Mason University (GMU)]. Khalsa gave an overview of NSIDC’s support of HDF data products with rec-ommendations for future products. Johnson shared his experiences supporting several Making Earth Science Data Records for Use in Research Environments (MEa-SUREs) projects at the GES DISC and the challenge of having disparate communities following a common format. Lee discussed his goal of designing the Ice, Clouds, and Land Elevation Satellite-2 (ICESat-2) stan-dard data products so that they will foster interoperabil-ity between ICESat and ICEat-2, and with other pres-ent and future Earth science missions. White described the NASA ISO 19115 implementation Wiki that is hosted at earthdata.nasa.gov, to facilitate an exchange of ideas regarding metadata represented under the stan-dard. Shao described GMU’s efforts in serving swath and grid HDF-EOS data via the Open Geospatial Con-sortium’s (OGC) Web Coverage Service.
After a break, there were a variety of talks by members of THG, including: Peter Cao, who reported on HDF tools updates; Joe Lee and Kent Yang, who gave an HDF OPeNDAP project update; and Gerd Heber who artfully rolled several talks into one and covered a vari-ety of topics including HDF5/XML, RESTful HDF56, Windows PowerShell extension for HDF5, and the rela-tionship between databases and HDF5.
The afternoon concluded with presentations from Leesa Brieger [Renaissance Computing Institute/Uni-versity of North Carolina, Chapel Hill (RENSI)] and Benjamin Hodel [Caterpillar]. Brieger discussed the current state of the integrated Rule-Oriented Data System. HDF5 was integrated in 2008 and now the RENSI team is working on integrating netCDF. Hodel described the benefits Caterpillar has accrued using HDF5 for compressing and storing data that are gener-ated in testing their machinery.
The presentations that took place on the last day of the workshop were dedicated to applications and demon-strations. Nawajish Noman [Environmental Systems Research Institute (ESRI)] described the current status of HDF and netCDF data support in ArcGIS. Mark Piper [Exelis Visual Information Systems] demon-
6 REST stands for Representational State Transfer, a style of software architecture for distributed systems (e.g., the Web) that has emerged over the past few years as the predominant Web service design model due to its simpler style. When a language, such as HDF5, conforms to REST constraints, it is generally referred to as being “RESTful.”
strated how Interactive Data Language (IDL) is being used to work with data from the Suomi NPP Visible Infrared Imager Radiometer Suite (VIIRS). Ted Haber-mann presented details of his activities exploring ways to exploit the similarities in the use of hierarchical rep-resentations in both HDF and ISO metadata repre-sentations. Dayong Shen [GMU’s Center for Spatial Information Science and Systems] described GMU’s approach to providing Normalized Difference Vegeta-tion Index (NDVI) data using the Web Mapping Ser-vice and the Web Coverage Service to provide on-de-mand visualization and acquisition of these data.
The remainder of the final day’s presentations consisted of a report on the status of THG support of the Suomi NPP/Joint Polar Satellite System, and an update to the HDF4 Mapping Project.
The next HDF/EOS Workshop is planned for fall 2013; the Program Committee will announce the location sometime in April 2013. We encourage interested par-ties to serve on the program committee, whose mem-bers may be contacted at the email addresses listed in the box, below.
HDF/EOS Program Committee
Dan Marinelli, GSFC, [email protected] Carol Boquist, GSFC, [email protected] Alfreda Hall, GSFC, [email protected] Michael Folk, THG, [email protected] Elena Pourmal, THG, [email protected] Kent Yang, THG, [email protected] Ebrahim Taaheri, Raytheon, [email protected] Daniel Kahn, SSAI, [email protected] John Evans, MathWorks, [email protected]

The Earth Observer July - August 2012 Volume 24, Issue 4 23
mee
ting/
wor
ksho
p su
mm
arie
sMODIS Science Team MeetingTassia Owen, NASA’s Goddard Space Flight Center/Sigma Space, [email protected]
Introduction
Members of the Moderate Resolution Imaging Spectrora-diometer (MODIS) Science Team gathered at the Silver Spring Civic Building in Silver Spring, MD from May 7-9, 2012. The meeting included a two-and-a-half day ple-nary meeting, discipline breakout sessions, and a final half-day-long calibration workshop. The meeting presentations are available at modis.gsfc.nasa.gov/sci_team/meetings.
Plenary Meetings
Michael King [University of Colorado—MODIS Sci-ence Team Leader] opened the meeting by welcoming the participants to the new meeting location. He noted that the tenth anniversary of the launch of Aqua—which hosts a MODIS instrument—was May 4, 2012.
Michael Freilich [NASA Headquarters (HQ)—Earth Science Division Director] followed with a broad discus-sion of current and future Earth science activities at NASA. He gave a brief overview of the NASA organi-zational chart, making particular note of recent changes and vacancies. Currently, there are 16 Earth science re-search missions; most are already past their design life-time. This aging notwithstanding, capabilities are still largely intact, and recommendations are that all 16 mis-sions continue. Last year, two Earth-observing satel-lites were launched: the Suomi National Polar-orbiting Partnership (Suomi NPP), in October, and Aquarius, in June. NASA has responded favorably and aggressively to the National Research Council’s 2007 Decadal Survey, embracing its overall recommendations and its findings. Future satellite missions include the Landsat Data Con-tinuity Mission (LDCM) and the Orbiting Carbon Ob-servatory-2 (OCO-2). Venture-class missions will play an important role in future research, including all three “strands” of this approach—suborbital and airborne in-vestigations; small, complete missions; and spaceborne instruments on missions of opportunity.
Paula Bontempi [HQ—MODIS Program Scientist] ad-dressed the use of data and derived products from two of the Earth Observing System (EOS) satellites—Terra and Aqua—and their sensors. She noted that the 2009 Research Opportunities in Space and Earth Science (ROSES) will be used to guide ROSES 2013. As Terra and Aqua continue to mature, less emphasis will be placed upon algorithm refinement and more on mul-tisensor product development, accompanied by active use of data and derived products in scientific research, modeling, synthesis, and diagnostic analysis to answer Earth science questions.
Jack Xiong [NASA’s Goddard Space Flight Center (GSFC)—MODIS Project Scientist] summarized the MODIS publication metrics, showing that MODIS data have to-date contributed to 5119 scientific publica-tions since Terra launch in 1999, with over 43,000 cita-tions. He then provided an update on instrument status for MODIS on both Terra and Aqua. Over the lifetime of the instruments, the short wavelength visible imag-ing system bands have shown increasing degradation, and a few near-infrared bands have shown gain increases. Changes in shortwave infrared responses have been very small, while medium-wavelength and long-wavelength infrared performance has been stable, with less than a 2% change over the duration of the missions. Overall, the signal-to-noise ratio performance remains satisfactory.
Edward Masouka [GSFC] spoke about reprocessing and product distribution, Collection 61, and future initia-tives, noting that over 250 million product files will likely be distributed in 2012. Currently, there is no way to track individual users; to enable such tracking in the fu-ture, users may be asked to register. Masouka discussed different test systems and lessons learned from Collec-tion 6 processing, including creating separate strings for each discipline to avoid delays in testing. The future, Collection 7 will be defined with input from the science team, and documentation for long-term archives will be improved, using common Web-based services.
Jim Gleason [GSFC—Suomi NPP Project Scientist] present-ed an overview of the Suomi NPP instruments and science. Currently, data are flowing to the National Environmental Satellite, Data, and Information Service (NESDIS) and Air Force Weather Agency (AFWA) centrals, and the Compre-hensive Large Array-data Stewardship System (CLASS) ar-chive. He discussed the five instruments onboard the Suomi NPP spacecraft: the Advanced Technology Microwave Sounder (ATMS), the Cross-track Infrared Sounder (CrIS), the Clouds and the Earth’s Radiant Energy System (CE-RES), Ozone Mapping and Profiler Suite (OMPS), and the Visible Infrared Imager Radiometer Suite (VIIRS). The CE-RES, an EOS-era instrument, is working well. Gleason also discussed an anomaly caused by a deposit of tungsten oxide on the mirrors of the VIIRS instrument, which occurred during the manufacturing process—and has the largest impact on the near-infrared channels. The deposit essentially makes one day of actual ultraviolet expo-sure equivalent to an expected six-and-a-half-day exposure, causing rapidly increasing degradation; the science team is working to compensate for the anomaly. Overall, however, the spacecraft and instruments are operating well.
1 As of this writing, Collection 6 is the most recent round of reprocessed MODIS data.

The Earth Observer July - August 2012 Volume 24, Issue 4 24m
eetin
g/w
orks
hop
sum
mar
ies Dorothy Hall [GSFC] discussed how she used MODIS
Ice-Surface Temperature (IST) data to produce a Climate Date Record (CDR) for the Greenland ice sheet. Chang-es in the duration of ice cover on the Greenland ice sheet are taking place, with mass loss of the Greenland ice sheet being recorded at depths below approximately 2 km (~1.2 mi). MODIS data show a consistent pattern of ice-sheet warming and concomitant increases in melt extent. IST can help validate models, and can be used to im-prove the accuracy of ice-sheet mass balance estimates.
Michael King discussed the spatial and temporal dis-tribution of clouds observed by MODIS on the Terra and Aqua satellites. He noted that cloud fraction—the amount of the sky covered by clouds—is nearly the same during nighttime and daytime. Further, the total cloud fraction is nearly the same using data from MODIS on Terra and Aqua; however, MODIS Terra data show more cloud cover over oceans, while MODIS Aqua data show more cloud cover over land. Cloud-top properties show higher clouds over land than over oceans; the cold-est cloud tops are found over Antarctica; and the highest cloud tops are found over the tropics. For the first time, it is possible to separate the occurrence of clouds com-posed of liquid water from those composed of ice; opti-cal properties (cloud optical thickness and effective par-ticle size) have been derived for both phases separately.
Watson Gregg [GSFC] discussed using MODIS data for ocean biology modeling and assimilation, which im-proves models and data representation.
Luigi Boschetti [University of Maryland] discussed how the MODIS Rapid Response System (“Rapidfire”) and burned area analysis are an operational success story. He reinforced how Rapidfire is helping society better to pre-pare for forest fires and to evaluate and assess fire damage.
Eric Wilcox [Desert Research Institute] discussed how observations from MODIS and other spaceborne instru-ments are being used to understand aerosol effects on the environment. He emphasized the association between dust outbreaks over the tropical Atlantic Ocean and a northward shift in precipitation. Aerosols in the atmo-sphere continue to be studied using remote sensing.
Zia Ahmed [GSFC] described advances in correcting ocean color products using MODIS data. Eighty new models were developed to process MODIS data to help generate more-accurate ocean-color information.
Forest Hall [GSFC/University of Maryland Baltimore County] discussed assimilating photosynthesis data derived from the next generation of remote sensing in-struments to create and enhance vegetation models. These models are important for predicting and charac-terizing the effects of carbon, energy, and water cycles on vegetation.
Leigh Munchak [GSFC] reflected on the use of the MODIS instruments to monitor globally distributed aerosols. Munchak and his colleagues are looking closely at the relationships between volcanology, chemistry, and aerosols, as well as other factors. The intent of their research was to collect data for the CDR, but much of their research has been used to describe air quality. They are using both Terra and Aqua MODIS sensors, which are aging and delivering some conflicting data measure-ments, increasing the importance of new data from the Suomi NPP VIIRS in continuing their research.
Discipline Summary Reports
Next, the ocean discipline group presented work de-signed to improve ocean color and sea surface tempera-ture records—important data records that require both duration and continuity.
Bryan Franz [GSFC] discussed approaches used to im-prove ocean-color data for generating CDRs. Loss of the Medium Resolution Imaging Spectrometer (MERIS) and other instruments on the European Space Agency’s now-defunct Envisat is making calibration difficult. Multimission ocean-color reprocessing is being consid-ered to correct for MODIS sensor issues and anomalies. To address this, MODIS data were cross-calibrated with Sea-viewing Wide Field-of-view Sensor (SeaWiFS) data. This cross-calibration is becoming more important as lunar and solar calibration trends for MODIS on Aqua become more erratic, resulting in large trending er-rors. Both MODIS sensors are beyond their design life; maintaining quality is an ongoing challenge.
Steve Running [University of Montana] summarized the MODIS land (MODland) breakout team’s meet-ing. The team concluded that Collection 6 reprocess-ing will show any detected changes in land cover for 2001, 2003, 2005, and 2007; and that MODland al-gorithms should be prioritized for VIIRS continuity. The team encouraged NASA to begin planning a strat-egy for post-MODIS data continuity, focusing more on datasets, and less on missions.
Steve Platnick [GSFC] presented the discipline sum-mary report for the atmosphere breakout team. The group discussed atmospheric data, analysis, and valida-tion investigations, focusing on the latest results and ice cloud radiative models. They also discussed the status of the Collection 6 algorithms, which are currently in various stages of testing; the team hoped that reprocess-ing using Collection 6 will be completed by December. Currently, the MODIS Characterization Support Team has no dedicated team to maintain calibration. Platnick noted that in the current environment, sustaining the viability of climate and Earth science data records is ex-tremely challenging.
The Earth Observer July - August 2012 Volume 24, Issue 4 25
mee
ting/
wor
ksho
p su
mm
arie
sSuomi NPP Science Team MeetingTassia Owen, NASA’s Goddard Space Flight Center/Sigma Space, [email protected]
Introduction
Members of the Suomi National Polar-orbiting Partner-ship (Suomi NPP) Science Team gathered at the Green-belt Marriott in Greenbelt, MD, from May 10-11, 2012. The two-day meeting included plenary sessions and discipline group breakout sessions. This meeting followed the Moderate Resolution Imaging Spectrora-diometer (MODIS) Science Team Meeting, held earlier in the week in Silver Spring, MD1.
Plenary Sessions
Jim Gleason [NASA’s Goddard Space Flight Cen-ter (GSFC)—Suomi NPP Project Scientist] opened the meeting and welcomed the participants. He gave a brief overview of the format and agenda of the meeting, and then introduced the first plenary speaker, Diane Wick-land [NASA Headquarters (HQ)—Suomi NPP Pro-gram Scientist].
Wickland discussed the Suomi NPP Science Team road-map generated by HQ. The National Polar-orbiting Op-erational Environmental Satellite System (NPOESS)2 Preparatory Project (NPP) was launched in October 2011. NPP was renamed to the Suomi NPP in January 2012 to honor Verner E. Suomi, the father of satellite meteorology. The two main goals of the mission are to provide continuity with the measurements made by the Earth Observing System (EOS) satellites; and to pro-vide risk reduction for the JPSS. Wickland stressed the roles for and responsibilities of NASA and the National Oceanic and Atmospheric Administration (NOAA), which are jointly responsible for the JPSS. NASA is primarily responsible for the launch, and activities for 18 months thereafter; NOAA will be responsible for long-term operational aspects. NASA’s long-term roles and responsibilities will be determined once the Suomi NPP science teams’ evaluations, product recom-mendations, and follow-on interactions with JPSS and NOAA are completed.
Glen Iona [NOAA—Suomi NPP Chief Engineer] dis-cussed the mission status and spacecraft operations. He began by saying that all of the instruments were op-erating at nominal status. The Visible Infrared Imager Radiometer Suite (VIIRS), a scanning radiometer, did encounter a couple of minor anomalies, both of which are believed to be related to radiation effects—because the anomalies occur after the spacecraft passes through 1 See page 23 of this issue to read a summary of the MODIS Science Team Meeting.2 The NPOESS was restructured in 2010, and is now known as the Joint Polar Satellite System (JPSS).
the South Atlantic Anomaly (SAA). The degradation of VIIRS was caused by an error in the manufacturing process when tungsten oxide inappropriately coated the telescope’s mirror surfaces. Teams are working to understand and predict the future effects of this anom-alous coating.
Jim Gleason reported that data currently are flowing to the National Environmental Satellite, Data, and Infor-mation Service (NESDIS) and the Air Force Weather Agency (AFWA) centrals, and the Comprehensive Large Array-data Stewardship System (CLASS) archive. He discussed the five instruments onboard the Suomi NPP spacecraft: the Advanced Technology Microwave Sound-er (ATMS), the Cross-track Infrared Sounder (CrIS), the Clouds and Earth’s Radiant Energy System (CERES), the Ozone Mapping and Profiler Suite (OMPS), and VIIRS. He noted that the Suomi NPP spacecraft has completed maneuvers for ATMS, CERES, and VIIRS. CERES, an EOS-era instrument, is working well. He further dis-cussed the VIIRS telescope mirror anomaly referred to above, and emphasized that the science team is working to understand this anomaly and correct for it to ensure operational viability, long term. Overall, the spacecraft and instruments are operating well.
Heather Kilkoyne [NOAA—JPSS Data Projects and Algorithms Manager] spoke about Suomi NPP ground system status. She focused on efforts to update the al-gorithms, and whether or not to keep them current or when and how to decide that they may no longer be useful.
Fuzhong Weng [NOAA—National Environmental Sat-ellite, Data, and Information Service/Satellite Applications and Research (NESDIS/STAR)] presented the Suomi NPP Sensor Data Record (SDR) status. The SDR team supports all phases of the Suomi NPP instrument cali-bration, and develops innovative techniques for on-orbit calibration. Uses of Suomi NPP mission-specific data in calibration/validation (cal/val) and STAR Integrated Calibration/Validation System (ICVS)-Long-term Mon-itoring—which provides real-time instrument telem-etry—have been improved for Suomi NPP sensors. Fu-ture work will focus on fixing SDR processing bugs.
Ivan Csizar [NOAA—NESDIS/STAR] discussed the status of the Suomi NPP Environmental Data Records (EDRs). He stated that JPSS EDR teams are perform-ing post-launch and post-activation algorithm testing, development, and product validation. Algorithm up-dates are expected for a number of products.

The Earth Observer July - August 2012 Volume 24, Issue 4 26m
eetin
g/w
orks
hop
sum
mar
ies Mitch Goldberg [NOAA—JPSS Program Scientist, Act-
ing] presented NOAA JPSS plans for Suomi NPP and cal/val. He stated that the foundation for determining measurement uncertainty is SI traceable benchmarks3. Currently, JPSS is supporting the Cryogenic Frost point Hygrometer (CFH) radiosondes, the Marine Optical Buoy (MOBY) in-water radiometer, and an airborne campaign for cross-calibrating Suomi NPP instruments with a National Institute of Standards (NIST)-traceable aircraft instrument.
Michael Freilich [HQ—Director of Earth Sciences Di-vision] followed with a broad discussion of current and future Earth science activities at NASA. He gave a brief overview of the NASA organizational chart, making particular note of recent changes and vacancies. Cur-rently, there are 16 Earth science research missions; most are already past their design lifetime. This aging notwithstanding, capabilities are still largely intact, and recommendations are that all 16 missions continue. Last year two Earth-observing satellites were launched: the Suomi NPP, in October, and Aquarius, in June. NASA has responded favorably and aggressively to the National Research Council’s 2007 Decadal Survey, em-bracing its overall recommendations and its findings. Future satellite missions include the Landsat Data Con-tinuity Mission (LDCM) and the Orbiting Carbon Ob-servatory-2 (OCO-2). Venture-class missions will play an important role in future research, including all three “strands” of this approach—suborbital and airborne in-vestigations; small, complete missions; and spaceborne instruments on missions of opportunity.
Status Reports
The group heard status reports from a representative from each subdiscipline group prior to the individual breakout group meetings. The first to present was Ivan Csiszar, who described the short-interim status report for land. He summarized the SDR and EDR prod-uct evaluations, followed by discussing relevant issues, challenges, and concerns. He then discussed the suit-ability of the current Land Surface Temperature (LST) EDR to provide MODIS continuity, and further de-scribed the products and the need to update algorithms regularly to ensure currency. Csiszar then discussed MODIS continuity and gaps, and how the need for MODIS science product continuity is essential to pro-moting valid science and calibration. He concluded by stating that the land team coordinates internally by way of regular teleconferences, reporting, and ongoing cooperation with NOAA.
Kevin Turpie [GSFC—Ocean Color Science Principal Investigator] presented the status report for the ocean
3 SI stands for Système International d’Unités, an interna-tional system of standard measurement units.
discipline group. He summarized the interim ques-tions and EDR evaluation report. Ocean color has pub-lished numerous papers that could be used to meet the requirements of the EDR report. Diane Wickland and Jim Gleason emphasized that the group could repack-age the material Turpie described into a cohesive report, and suggested that having peer-reviewed papers within the report will further the assessment of the new science by the larger community. Turpie went on to discuss the validation data collection process, which should include the comparison of derived satellite products to in situ data. Fulfilling this last requirement could be more chal-lenging, since NASA has only a small collection of ocean color data and NOAA’s validation program is similarly limited in scope. He concluded by summarizing the cruises that are currently gathering in situ data, along with other ocean color accomplishments.
Steve Platnick [GSFC—EOS Senior Project Scientist] gave a brief overview of the status of the atmosphere discipline group, stating that the group is making prog-ress; a longer, more-detailed presentation will be pro-vided as part of the discipline group’s summary presen-tation, later in this report.
Richard McPeters [GSFC—Ozone Mapping Profiler Suite (OMPS) Principal Investigator] spoke on behalf of the ozone discipline group. He began by summariz-ing the scope of evaluating the OMPS, which includes the nadir mapper, the nadir profiler, and the limb pro-filer. McPeters then discussed the process of evaluation whereby the Interface Data Processing System (IDPS) products are compared with heritage products. The OMPS limb profiles will be compared with the Aura-based Microwave Limb Sounder (MLS) ozone profiles, Cloud-Aerosol Lidar and Infrared Pathfinder Satellite Observations (CALIPSO) aerosol data, derived radianc-es, and NASA-generated algorithms. McPeters talked about the evaluation schedule and how the nadir map-per activity is complete, with final evaluation set for April. The nadir and limb profilers are slated for initial evaluation in August and November, respectively. Cur-rently, the focus is on evaluation for the total column and nadir profiler sensors. The OMPS team continues to recommend improvements, and will begin analysis of performance and diagnostic data.
Bill Blackwell [Massachusetts Institute of Technology Lincoln Laboratory] spoke on behalf of the Sounder discipline group. He discussed the responsibilities of the group, including research-grade evaluation, validation, optimization, cal/val support, and preparatory work to-ward generating new data products. He also discussed improvements and alternative products, near-term ac-tivities, and action schedules. Blackwell ended by dis-cussing the process for SDR/EDR evaluation and sum-marizing the evaluation results.

The Earth Observer July - August 2012 Volume 24, Issue 4 27
mee
ting/
wor
ksho
p su
mm
arie
sBreakout Session Summaries
Peter Minnett [University of Miami] summarized the ocean breakout group session. He spoke first about sea surface temperature (SST) measurement and compari-sons with data obtained from other instruments. VIIRS is an important instrument for SST measurements, and is more accurate than data from the network of drifting buoys currently in operation. To improve this buoy sit-uation, a new generation of drifters is being developed and deployed. Minnett covered current and future work where uncertainties will be established and their causes understood, and that accuracies of SSTs will be im-proved through algorithm refinement. The group will also validate skin SSTs and use radiative transfer simula-tions. Marine Atmospheric Emitted Radiance Interfer-ometers (M-AERIs) have been put on cruise liners, and the team is corroborating with these data international shipboard radiometer data. He concluded by stating that the group is working to generate SST climate data records that are consistent and accurate.
Kevin Turpie summarized the ocean color breakout group’s sessions and provided an update on the ocean color sensor, which is very sensitive to radiometric qual-ity. Stray light, electronics, mirror degradation, signal-to-noise ratio, and out-of-band response are being monitored, but the current focus is on calibration. He spoke about the evaluation-processing plan, which fa-cilitates the production of heritage and new data prod-ucts. With assistance from the Algorithm Development Library at the University of Wisconsin-Madison, the team is processing raw data records to the SDR level. Turpie discussed processing the EDR to Level-3 and other products. The interim report is expected in late summer 2012.
Ivan Csiszar gave the land breakout group’s summa-ry. He reviewed individual products for the suitability of the current EDRs to provide MODIS continuity, and discussed the changes likely to be proposed to the EDRs. Csiszar discussed data system needs and recom-mendations made to NASA management in this area. He went over changes to be proposed to the EDRs with specific reference to the VIIRS Vegetative Index EDR. With regard to the VIIRS albedo product, two algo-rithms have been implemented, and both are working through noise issues. The group recommended that the look-up table for water be corrected. Csiszar covered the product status and expected updates for the Ac-
tive Fires product. The Surface Type product has been providing continuity for the International Geosphere-Biosphere Programme (IGBP) classification, but some changes in refinement and updating of training data algorithms are needed. Csiszar summarized the bias around ice temperature, for both Ice Surface Tempera-ture (IST) and Sea Ice characterization, and noted that there is continuity with the MODIS snow products. Last, he discussed the data-system processing schedule in the near and long terms.
Steve Platnick spoke on behalf of the aerosol/cloud dis-cipline team, which is working to evaluate their EDRs. There are two components needed from the data record to evaluate Interface Data Processing Segment (IDPS) products: instrument differences and algorithm differ-ences. He talked about the IDPS Cloud EDR evalua-tion approaches, and discussed additional concerns and recommendations for filling the IDPS gaps (including not using Level-3 products), and recommendations re-garding the MODIS heritage products and other prod-ucts of interest. Platnick addressed the data gaps in cal/val activities, and made recommendations to NASA management, including maintaining algorithm conti-nuity and climate record stewardship to achieve both data record continuity and to provide a more-definitive means for IDPS to evaluate many products.
Richard McPeters provided the ozone discipline group’s summary. He highlighted the continuation of the EOS data records and the OMPS total column and profiler. The public release of Product Evaluation and Algorithm Test Elements (PEATE) ozone result is scheduled for November 2012 and the report, by April 2013. He also discussed the Optical Centroid Cloud Pressure, and suggested options to replace current infra-red-based cloud pressures in the IDPS. McPeters con-cluded by summarizing the tropospheric ozone results, and how OMPS is needed to extend the record of tro-pospheric ozone data derived using the cloud-slicing technique that extends all the way back to 1979.
Bill Blackwell briefly presented the Sounder discipline group summary. He discussed progress, including assess-ments of ATMS scan dependence using radiometric re-siduals. He ended with an EDR evaluation assessment.
The day concluded with a business meeting that dis-cussed team organization, schedule refinement, and the next steps for the science team.

The Earth Observer July - August 2012 Volume 24, Issue 4 28m
eetin
g/w
orks
hop
sum
mar
ies CERES Science Team Meeting Summary
Jim Closs, NASA’s Langley Research Center/Science Systems and Applications, Inc., [email protected]
The spring 2012 Clouds and the Earth’s Radiant En-ergy System (CERES) Science Team meeting was held at the City Center at Oyster Point Marriott in Newport News, VA, May 1-3, 2012. Norman Loeb [NASA’s Langley Research Center/Science Systems and Applica-tions, Inc. (LaRC/SSAI)—CERES Principal Investiga-tor] hosted the meeting.
The major objectives of the meeting were to review the status of the CERES instruments and data products including:
• Status reports on NASA Earth science activities in general, and the Earth Observing System (EOS) in particular—to provide “context” for CERES;
• updates on the current CERES instruments—Flight Models (FM) 1–5—and plans for the future FM 61 ;
• updates on CERES Terra and Aqua shortwave (SW)/longwave (LW)/TOTAL channel calibration;
• a status report on CERES Edition 4 cloud algo-rithm development and validation;
• a status report on CERES Edition 4 Angular Di-rectional Model (ADM) development;
• a report on the development of a Surface Energy Balance and Filled (EBAF) data product;
• an update on CERES Edition 3 merged Terra+Aqua+Geo SYN1deg2 gridded top-of-atmo-sphere (TOA) and surface fluxes;
• an update from the data management team on the Terra/Aqua/NPP platforms;
• an update from Atmospheric Sciences Data Center (ASDC); and
• a report on CERES Education and Public Out-reach (EPO) efforts.
1 The CERES Prototype Flight Model (PFM) flew on the Tropical Rainfall Measuring Mission (TRMM) and is no lon-ger operational. FM 1 and 2 are on Terra, FM 3 and 4 are on Aqua, and FM 5 flies on Suomi NPP; all of these are still functioning. FM 6 is planned for deployment aboard the first JPSS mission, scheduled to launch in 2016.2 Geo SYN1deg is a standard CERES data product. Learn more at ceres.larc.nasa.gov/science_information.php?page=GEO.
In addition to CERES-specific science reports by Science Team members covering these topics, Lisan Yu [Woods Hole Oceanographic Institute], and Joao Teixeira [NASA/Jet Propulsion Laboratory (JPL)] gave invited presentations; see page 29.
Norman Loeb presented an overview and reported on the status of CERES and how the mission fits into the broader context of NASA, including EOS, the 2011 Earth Science Senior Review, NASA’s Program for Cli-mate Model Diagnosis and Intercomparison (PCMDI) effort. He discussed CERES in more detail in terms of the on-orbit Suomi National Polar-orbiting Partner-ship (Suomi NPP) and the planned Joint Polar Satellite System (JPSS), summarizing the project’s structure and data products. In addition, he revisited the CERES or-ganization and Working Group leads, and gave an up-date on the NASA Earth science budget. He presented the status of Cloudsat’s battery anomaly and plans for re-entry into the A-Train3, saying that because of spacecraft battery issues, CloudSat will no longer be able to conduct nighttime operations. Loeb concluded with a status report on the Visible–Infrared Imager Ra-diometer Suite (VIIRS) on Suomi NPP. He referred to VIIRS Sensor Data Record (SDR) maturity and repro-cessing, and instrument responsivity degradation4. The SDR team is making plans to mitigate the effects of degradation via more-frequent uploading of calibration lookup tables.
Susan Thomas [LaRC/SSAI] presented a report on the status of CERES FM 1–5, after which Kory Priestley [LaRC] gave an overview and update of the CERES In-strument Working Group activities, and CERES FM 6 and follow-on instrument status. Priestley reviewed the Instrument Working Group structure and staffing, then focused on FM 6 status and plans, saying that CERES FM 6 is the most highly characterized CERES instru-ment to date, and that it is currently completing ra-diometric characterization at the Northrop Grumman facility in Redondo Beach, CA. A system acceptance review is scheduled for June 2012; launch on JPSS-1 is currently scheduled for November 2016.
3 In May 2012, CloudSat executed the last of several maneu-vers to position it back in the A-Train, approximately 100 seconds behind the Cloud–Aerosol Lidar Infrared Pathfinder Satellite Observations (CALIPSO) spacecraft. Prior to the anomaly CloudSat had been 30 seconds ahead of CALIPSO in the formation. Read more in the editorial of the 2012 May–June issue of The Earth Observer [Volume 24, Issue 3, p. 2].4 The degradation of selected VIIRS channels was described in the editorial of the 2012 March–April issue of The Earth Ob-server [Volume 24, Issue 2, p. 2].

The Earth Observer July - August 2012 Volume 24, Issue 4 29
mee
ting/
wor
ksho
p su
mm
arie
sThe next series of presentations provided updates on various CERES subsystem activities.
• Patrick Minnis [LaRC] gave an update on the CERES Edition 4 cloud algorithm.
• Sunny Sun-Mack [LaRC/SSAI] presented the cur-rent status of Suomi NPP VIIRS for CERES.
• Wenying Su [LaRC] reported on the next genera-tion CERES ADM.
• Dave Kratz [LaRC] gave a comparison of the beta Surface-Only Flux Algorithm (SOFA) Edition 4 and Edition 3 results.
• Seiji Kato [LaRC] gave a Surface and Atmosphere Radiation Budget (SARB) Working Group update.
• David Doelling [LaRC] reported on Time Inter-polation and Spatial Averaging (TISA), followed by a live demo of the new CERES Ordering Tool.
• Rabi Palikonda [LaRC/SSAI] reported on hourly GEO for Clouds.
• Paul Stackhouse [LaRC] gave an update on CERES Fast Longwave and Shortwave Radiative Fluxes (FLASHFLUX)5.
• Jonathan Gleason [LaRC] reported on the activi-ties of the CERES Data Management Team.
• John Kusterer [LaRC] gave an update on the Atmospheric Science Data Center (ASDC).
• On behalf of Lin Chambers [LaRC], Dan Oos-tra [LaRC/SSAI] presented an update on CERES EPO activities.
5 FLASHFLUX was established to meet the science communi-ty’s requirement for global near-real-time surface and top-of-at-mosphere radiative fluxes. Learn more at flashflux.larc.nasa.gov.
Day two began with breakout working group sessions, including the Angular Modeling Working Group, led by Wenying Su; the Surface to Top-of-Atmosphere Fluxes Working Group, led by Seiji Kato; and the Cloud Working Group, led by Patrick Minnis.
A pair of invited presentations highlighting exciting new science results followed.
Lisan Yu [Woods Hole Oceanographic Institution] gave a talk titled Toward a Balanced Net Heat Flux at the Ocean Surface. Yu reviewed heat exchange at the ocean surface, and defined the value of net heat flux (Qnet) as the sum of downward and upward components of SW and LW radiation. She noted that net downward SW ra-diation is biased (i.e., overestimated) at buoy locations, and that the mean downward LW bias is small. She commented that the majority of the buoys are located in the tropics, and the number of LW sensors is too limit-ed. Yu plans a future study on regional heat budget anal-ysis that connects to ocean temperature observations.
Joao Teixeira [JPL] presented a talk on Boundary Layer Cloud Transitions and Cloud-Climate Feedback. Teixera de-scribed recent results on the global characterization of the subtropical cloud transition to illustrate the essential proper-ties of the transition but also the need for a comprehensive understanding of the transition properties. He reviewed types of models and theories that address the interactions between the small-scale turbulence and cloud physics, and large-scale climate processes. Finally, he showed simple mod-els of the essential climatological aspects of the transition.
Following the invited presentations, there were a se-ries of co-investigator reports with updates on new data products and science results; see the Table, below, which also lists some of the presentations that already have been described.
Table: CERES co-investigator reports
Topic Speaker Institution
FM 1–5 Instrument Status Susan Thomas LaRC/SSAI
Update on CERES Edition 4 Cloud Algorithm Pat Minnis LaRC
Current Status of NPP VIIRS for CERES Sunny Sun-Mack LaRC/SSAI
Update on the Next Generation CERES ADMs Wenying Su LaRC
Surface and Atmosphere Radiation Budget (SARB) Working Group Update
Seiji Kato LaRC
Time-Space Averaging Update David Doelling LaRC
Hourly GEO Clouds for TISA Rabindra Palikonda LaRC/SSAI
CERES Fast Longwave and Shortwave Radiative Fluxes (FLASHFLUX) Update
Paul Stackhouse LaRC

The Earth Observer July - August 2012 Volume 24, Issue 4 30m
eetin
g/w
orks
hop
sum
mar
ies
Topic Speaker Institution
CERES Data Management Team (DMT) Update Jonathan Gleason LaRC
Atmospheric Sciences Data Center (ASDC) Update John Kusterer LaRC
CERES Education and Outreach Update Dan Oostra LaRC/SSAI
Comparison of TOA and Surface Radiation between Multiscale Modeling Framework Simulation and CERES EBAF
Kuan-man Xu LaRC
Assessing Cloud Radiative Effect in CMIP5 Models Using CERES EBAF data
Hailan Wang LaRC/SSAI
Comparisons of CERES and ERA Interim TOA Radiative Fluxes
Takmeng Wong LaRC
A Comparison of the Cloud Feedbacks Derived from CERES and from MODIS
Andrew Dessler Texas A&M University
Cloud Radiative Response to Intensification of Hadley Circulation
Norman Loeb LaRC
The Change of Radiative Cooling and its Role in the Weakening of Tropical Circulation
Xianglei Huang University of Michigan
Investigation of Regional CF Differences and their Impact on TOA Radiation Budgets through an Integrative Analysis of CERES, MODIS, CloudSat/CALIPSO, and NASA GISS AR5 results
Xao Dong University of North Dakota
Evaluation of “Direct” Estimation of Surface Solar Net Flux with CERES data
Istvan Laszlo NOAA/University of Maryland, College Park
Climate Monitoring with Earth Radiation Budget Measurements
Steven Dewitte Royal Meteorological Institute of Belgium
An Update on CERES Longwave Angular Distribution Models
Zachary Eitzen LaRC/SSAI
CERES Derived Narrowband Fluxes for Correcting 3D Radiative Effects in MODIS Aerosol Retrievals Near Clouds
Gouyong Wen University of Maryland, College Park
Comparisons of Monthly Mean OLR Between HIRS, CERES EBAF/SSF/SYN Ed2.6(r), ISCCP-FD, ERA-Interim, CFSR, and Merra Reanalyses
Hai Tien Lee University of Maryland, College Park
Global All-Sky Direct Radiative Forcing of Anthropogenic Aerosols From Combined Satellite Observations and GOCART Simulations
Wenying Su LaRC
Special Operations of CERES for Comparison with ScaRaB 3 Radiances
Lou Smith LaRC/SSAI
The Influence of Diurnal Cycle on Monthly OLR Variability in the Tropics
Patrick Taylor LaRC
Relationship of Regional Radiation Anomalies with Environmental Conditions
Bing Lin LaRC
Initial Result of CERES-like ERBE Data Processing Alok Shrestha LaRC/SSAI

The Earth Observer July - August 2012 Volume 24, Issue 4 31
mee
ting/
wor
ksho
p su
mm
arie
s
Norman Loeb led a final wrap-up of the various break-out meetings held during the meeting. A list of action
items that arose from that discussion are included in the box below.
Action Items from the Spring 2012 CERES Science Team Meeting
Instrument Working Group Complete work on modifying FM 3 Clouds beginning of mission spectral response function, and compar-isons with the Scanner for Radition Budget (ScaRaB)6 for the fall CERES Science Team Meeting.
Clouds Working Group Determine reason for differences between runs of Clouds Edition 4 on different platforms, and monitor VIIRS status and assess impacts of degradation in VIIRS responsivity.
Angular Distribution Model (ADM) and Top-of-Atmosphere ADM Fluxes Working Group Continue Edition 4 ADM development and assessment of Edition 4 Clouds from ADM perspective, and adopt and refine validation tests (e.g., multiangle consistency, direct integration).
SOFA Working Group Make Edition 4 improvements in line with Clouds Edition 4, and comparisons with SARB fluxes and Woods Hole Oceanographic Institute (WHOI) ocean buoy data.
SARB Working Group Add EBAF-SFC to Observations for Model Incomparison Studies (Obs4MIPS) archive, and perform com-parisons with WHOI ocean buoy data.
TISA Working Group Update lite products and EBAF Edition 2.6r (sub-release) through end of 2011, submit update of EBAF to Obs4MIP archive, and deliver CERES fluxbycloudtype code.
Data Management Working Group Continue partial automation effort in time to speed up Edition 4 SSF processing, and incorporate other subsystems into partial-automation system.
Subsetter Group Add FLASHFLUX Level 3 subsetting/visualization/ordering, and provide anomaly maps for any given variable.
Students’ Cloud Observations On-Line (S’COOL) Provide some analysis of 100,000 student-generated cloud observations.
6 ScaRaB is a collaborative Earth Radiation Budget (ERB) project supported by France, Russia, and Germany, intended to provide a continuation of the ERB Experiment scanner mission.
Full presentations are available on the CERES web site at science.larc.nasa.gov/ceres. The next CERES Science Team Meeting will be hosted by the Geophysics Fluid Dynamics Laboratory, October 22–26, 2012 in Princeton, NJ.
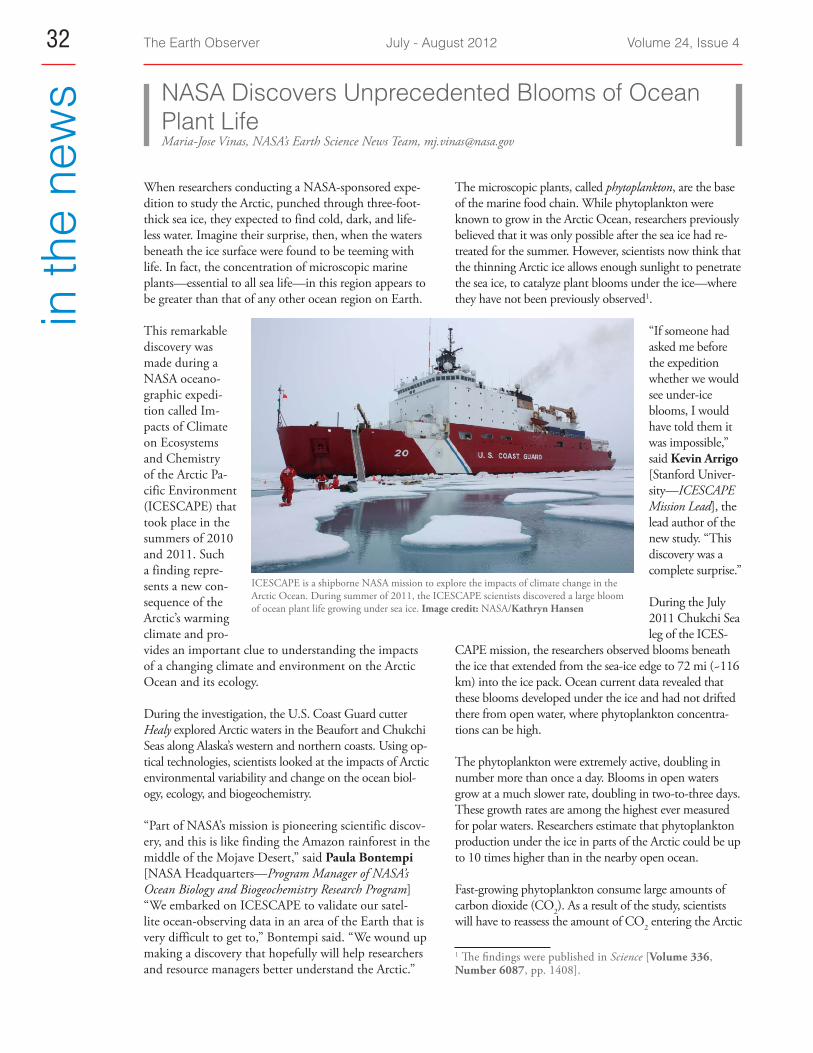
The Earth Observer July - August 2012 Volume 24, Issue 4 32in
the
new
s NASA Discovers Unprecedented Blooms of Ocean Plant LifeMaria-Jose Vinas, NASA’s Earth Science News Team, [email protected]
When researchers conducting a NASA-sponsored expe-dition to study the Arctic, punched through three-foot-thick sea ice, they expected to find cold, dark, and life-less water. Imagine their surprise, then, when the waters beneath the ice surface were found to be teeming with life. In fact, the concentration of microscopic marine plants—essential to all sea life—in this region appears to be greater than that of any other ocean region on Earth.
This remarkable discovery was made during a NASA oceano-graphic expedi-tion called Im-pacts of Climate on Ecosystems and Chemistry of the Arctic Pa-cific Environment (ICESCAPE) that took place in the summers of 2010 and 2011. Such a finding repre-sents a new con-sequence of the Arctic’s warming climate and pro-vides an important clue to understanding the impacts of a changing climate and environment on the Arctic Ocean and its ecology.
During the investigation, the U.S. Coast Guard cutter Healy explored Arctic waters in the Beaufort and Chukchi Seas along Alaska’s western and northern coasts. Using op-tical technologies, scientists looked at the impacts of Arctic environmental variability and change on the ocean biol-ogy, ecology, and biogeochemistry.
“Part of NASA’s mission is pioneering scientific discov-ery, and this is like finding the Amazon rainforest in the middle of the Mojave Desert,” said Paula Bontempi [NASA Headquarters—Program Manager of NASA’s Ocean Biology and Biogeochemistry Research Program] “We embarked on ICESCAPE to validate our satel-lite ocean-observing data in an area of the Earth that is very difficult to get to,” Bontempi said. “We wound up making a discovery that hopefully will help researchers and resource managers better understand the Arctic.”
The microscopic plants, called phytoplankton, are the base of the marine food chain. While phytoplankton were known to grow in the Arctic Ocean, researchers previously believed that it was only possible after the sea ice had re-treated for the summer. However, scientists now think that the thinning Arctic ice allows enough sunlight to penetrate the sea ice, to catalyze plant blooms under the ice—where they have not been previously observed1.
“If someone had asked me before the expedition whether we would see under-ice blooms, I would have told them it was impossible,” said Kevin Arrigo [Stanford Univer-sity—ICESCAPE Mission Lead], the lead author of the new study. “This discovery was a complete surprise.”
During the July 2011 Chukchi Sea leg of the ICES-
CAPE mission, the researchers observed blooms beneath the ice that extended from the sea-ice edge to 72 mi (~116 km) into the ice pack. Ocean current data revealed that these blooms developed under the ice and had not drifted there from open water, where phytoplankton concentra-tions can be high.
The phytoplankton were extremely active, doubling in number more than once a day. Blooms in open waters grow at a much slower rate, doubling in two-to-three days. These growth rates are among the highest ever measured for polar waters. Researchers estimate that phytoplankton production under the ice in parts of the Arctic could be up to 10 times higher than in the nearby open ocean.
Fast-growing phytoplankton consume large amounts of carbon dioxide (CO2). As a result of the study, scientists will have to reassess the amount of CO2 entering the Arctic
1 The findings were published in Science [Volume 336, Number 6087, pp. 1408].
ICESCAPE is a shipborne NASA mission to explore the impacts of climate change in the Arctic Ocean. During summer of 2011, the ICESCAPE scientists discovered a large bloom of ocean plant life growing under sea ice. Image credit: NASA/Kathryn Hansen

The Earth Observer July - August 2012 Volume 24, Issue 4 33
in th
e ne
ws
Ocean through biological activity if the under-ice blooms turn out to be common.
“At this point we don’t know whether these rich phyto-plankton blooms have been happening in the Arctic for a long time and we just haven’t observed them before,” Arrigo said. “These blooms could become more wide-spread in the future, however, if the Arctic sea ice cover continues to thin.”
In recent decades younger and thinner ice has replaced much of the Arctic’s older and thicker ice. This young ice is almost flat and the ponds that form when snow cover melts in the summer, cover a larger areal extent than those on rugged older ice. These extensive but shallow melt ponds act as windows to the ocean, letting large amounts of sunlight pass through the ice to reach the water below, said geophysicist Donald Perovich [U.S. Army Cold Re-gions and Engineering Laboratory], who studied the opti-cal properties of the ice during the ICESCAPE expedition.
“When we looked under the ice, it was like a photographic negative. Beneath the bare-ice areas that reflect a lot of sunlight, it was dark. Under the melt ponds, it was very bright,” Perovich said. He is currently a visiting professor at Dartmouth College’s Thayer School of Engineering.
The discovery of these previously unknown under-ice blooms also has implications for several components of the broader Arctic ecosystem, including migratory species such as whales and birds. Because phytoplankton are eaten by small ocean animals, which are eaten by larger fish and ocean animals, a change in the timeline of the blooms can cause disruptions for larger animals that feed either on phytoplankton or on the creatures that eat these microor-ganisms. “It could make it harder and harder for migratory species to time their life cycles to be in the Arctic when
the bloom is at its peak,” Kevin Arrigo said. “If their food supply is coming earlier, they might be missing the boat.”
Paula Bontempi believes the discovery also may have ma-jor implications for the global carbon cycle and the ocean’s energy balance. “The discovery certainly indicates we need to revise our understanding of the ecology of the Arctic and the region’s role in the Earth system,” Bontempi said.
A video describing the mission and new discovery can be found at svs.gsfc.nasa.gov/vis/a010000/a010900/a010907.
On July 6, 2011, ICESCAPE scientists lowered optical instruments through a hole at the bottom of a melt pond, to study the waters un-derneath the ice. Image credit: NASA/Kathryn Hansen
On July 10, 2011, Don Perovich, [Cold Regions Research and Engi-neering Laboratory], maneuvered through melt ponds collecting opti-cal data along the way to get a sense of the amount of sunlight reflect-ed from sea ice and melt ponds in the Chukchi Sea. Image credit: NASA/Kathryn Hansen
On July 10, 2011, Jens Ehn [Scripps Institution of Oceanography] [left], and Christie Wood [Clark University] [right], scooped water from melt ponds on sea ice in the Chukchi Sea. The water was later analyzed in the Healy’s onboard science lab. Image credit: NASA/Kathryn Hansen

The Earth Observer July - August 2012 Volume 24, Issue 4 34in
the
new
s NASA Mission Sending Unmanned Aircraft Over Hurricanes This YearRob Gutro, NASA’s Goddard Space Flight Center, [email protected]
Beginning this summer and over the next several years, NASA will be sending unmanned aircraft, dubbed “severe storm sentinels,” above stormy skies. Several NASA centers are joining federal and university part-ners in the Hurricane and Severe Storm Sen-tinel (HS3) airborne mission, which is targeted to investigate the processes that underlie hurricane formation and changes in their intensity in the Atlantic Ocean basin.
NASA’s unmanned sen-tinels are autonomously flown. The Global Hawks are well suited for hurricane investi-gations because they can over-fly hurricanes at altitudes greater than 60,000 ft (~18 km), with flight durations of up to 28 hours—something piloted air-craft would find nearly impos-sible to do. These unique aircraft were used successfully in the agency’s 2010 Genesis and Rapid Intensification Pro-cesses (GRIP) hurricane mission and the Global Hawk Pacific (GloPac) environmental science mission. The HS3 mission will operate during portions of the Atlan-tic hurricane seasons, which runs from June 1–June 30. Specifically, the 2012 mission will run from late August through early October.
“Hurricane intensity can be very hard to predict because of an insufficient understanding of how clouds and wind patterns within a storm interact with the storm’s environment. HS3 seeks to improve our under-standing of these processes by taking advantage of the surveillance capabilities of the Global Hawk, along with measurements from the onboard suite of advanced instruments,” said research meteorologist Scott Braun [NASA’s Goddard Space Flight Center (GSFC)—HS3 Principal Investigator].
HS3 will use two Global Hawk aircraft and six different instruments this summer, flying from a base of opera-tions at NASA’s Wallops Flight Facility (WFF).
“One aircraft will sample the environment of storms, while the other will measure eyewall and rainband winds and precipitation,” Braun said. HS3 will examine the large-scale environment in which tropical storms
form and move through, and how that envi-ronment affects their inner workings.
HS3 will address the controver-sial role of the hot, dry, and
dusty Saharan Air Layer in tropical storm formation and intensification; past studies have suggested that the Saharan Air Layer can both favor or suppress intensification, depending on local con-ditions. In addition, HS3
will examine the extent to which deep convection
in the inner-core region of storms is a key driver of inten-
sity change, or perhaps just a response to storms encountering
favorable sources of energy.
The instruments to be mounted in the Global Hawk aircraft that will examine the environment of the storms include the Scanning High-resolution Interferometer Sounder (S-HIS), the Advanced Vertical Atmospheric Profiling System (AVAPS; also known as dropsondes), and the Cloud Physics Lidar (CPL). Another compo-nent, the Tropospheric Wind Lidar Technology Experi-ment (TWiLiTE) Doppler wind lidar, will likely fly during the 2013 mission.
Another set of instruments also will fly on the Global Hawk, focusing on the inner region of the storms. Those instruments include the High-Altitude Imaging Wind and Rain Airborne Profiler (HIWRAP) conically scanning Doppler radar, the Hurricane Imaging Radi-ometer (HIRAD) multifrequency interferometric radi-ometer, and the High-Altitude Monolithic Microwave Integrated Circuit Sounding Radiometer (HAMSR) microwave sounder. Most of these instruments repre-sent advanced technology developed by NASA; in some cases, they are precursors to future satellite sensors.

The Earth Observer July - August 2012 Volume 24, Issue 4 35
in th
e ne
ws
“HS3 marks the first time that NASA’s Global Hawks will deploy away from Dryden Flight Research Center (DFRC) for a mission, potentially marking the beginning of an era in which they are operated regularly from WFF,” said atmospheric scientist Paul Newman [GSFC—HS3 Deputy Principal Investigator]. The aircraft will deploy to WFF from their home base at NASA’s Dryden Flight Research Center (DFRC), which is located at Edwards Air Force Base. NASA’s Science Mission Directorate is establishing a Global Hawk operations center for sci-ence operations from WFF. “With the Global Hawks at Dryden in California, the WFF will become the ‘Global Hawk-Eastern’ science center,” Newman said.
From rockets studying the upper atmosphere to unmanned aircraft flying over hurricanes, WFF is fast becoming a busy place for science. WFF is one of sev-eral NASA centers involved with the HS3 mission: The Earth Science Projects Office (ESPO) at NASA’s Ames Research Center manages the project. Further, in addi-tion to DFRC and WFF, other participants include GSFC, NASA’s Marshall Space Flight Center, and the Jet Propulsion Laboratory.
To learn more about the HS3 mission, visit: www.nasa.gov/HS3
NASA’s Global Hawk soars aloft from Edwards Air Force Base. The NASA Global Hawk is well suited for hurricane investigations. Image credit: NASA/Tony Landis
This visible-light image of Tropical Depression Beryl was captured using the Moderate Resolution Imaging Spectroradiometer (MODIS) instrument on NASA’s Terra satellite on May 28, 2012, at 12:05 p.m. EDT, when Beryl was centered over northern Florida. Image credit: NASA MODIS Rapid Response Team

The Earth Observer July - August 2012 Volume 24, Issue 4 36 SORCE/TIM Views the 2012 Transit of Venus
Greg Kopp, University of Colorado, Boulder, Laboratory for Atmospheric and Space Physics, [email protected] Ward, NASA’s Goddard Space Flight Center/Wyle Information Systems, [email protected]
On June 5-6, 2012, scientists got a rare opportunity to view a transit of Venus. Unfortunately if you missed this one, you will be waiting a long time: The next transit of Venus will not occur until December 11, 2117.
A transit takes place whenever a celestial body (e.g., planet) moves in front of another celestial body (e.g., a star). For example, from our vantage point on Earth, a transit occurs when either of the inner planets (i.e., Mercury or Venus) moves directly between the Sun and Earth1. Owing to its more rapid rotation around the Sun, transits of Mercury are more common, occurring approximately 13 times per century; transits of Venus, on the other hand, are among the rarest predictable celes-tial movements, taking place in a pattern that generally repeats every 243 years. Transits of Venus occur in pairs, eight years apart, and each pair is separated by a gap of more than a century.
The Total Irradiance Monitor (TIM) on the Solar Radi-ation and Climate Experiment (SORCE) is designed to detect very small fluctuations in the Sun’s spatially inte-grated radiant output, needed for monitoring long-term
1 An observer on Mars, could view periodic transits of Earth.
solar variability. This includes small variations caused by normal solar fluctuations [on the order of 50 parts per million (ppm) or 0.005% of the total amount] as well as larger ones caused by sunspots and faculae (~1000 ppm). With this extremely high level of sensi-tivity, TIM was easily able to observe the reduction in solar irradiance that occurred as Venus moved in front of the Sun.2 2
The transit of Venus is unmistakable in the plotted TIM measurements (black dots) and is in excellent agreement with predictions (gray curve) based on the positions of SORCE, Venus, and the Sun. The inci-dent sunlight decreased by 1000 ppm during the tran-sit—making it comparable to the reduction in energy caused by a medium sized sunspot. The plotted TIM’s total solar irradiance data show a decrease from the Sun’s current normal value of 1361.25 W/m2 down to 1359.85 W/m2 at the center of the 6 hr, 37 min tran-sit. The decreasing brightness nearer transit center is
2 Adapted from: Kopp, Greg, “Total Irradiance Observa-tions of the Venus Transit.” SORCE News Source, Mar–June 2012, p. 3. lasp.colorado.edu/sorce/news/sns/2012/SORCE%20News%202012_03_06.pdf

The Earth Observer July - August 2012 Volume 24, Issue 4 37
due to the center of the solar disk being brighter than the edges—meaning Venus blocks out more light when nearer the center. This solar limb darkening effect was included in the predicted light curve in the plot. The aforementioned small fluctuations in solar brightness on short time scales from solar convection and oscilla-tions can be seen in measurements before, during, and after the transit. Gaps in the data are from times when the SORCE spacecraft was in the Earth’s shadow and could not view the Sun.
As alluded to earlier, scientists are using transits to dis-cover planets orbiting distant stars, but the detective work is difficult. When viewed from the relatively close proximity of Earth, the transit of Venus caused a 1000 ppm decrease in solar irradiance. If that same transit were to be observed from another star system, the de-
crease would be ~80 ppm—i.e., several orders of mag-nitude smaller—making it harder to detect. Further-more, the already weak signal might also be obscured by normal stellar fluctuations that can cause continual variations of ~50 ppm that would need to be “filtered” out to confirm the presence of a previously unknown planet. This gives some appreciation for the difficulties that astrophysics missions such as the Kepler Observa-tory must overcome as they search for evidence of oth-er Earth-like planets in our galaxy.
The Venus transit plot shown on page 36 is taken from spot.colorado.edu/~koppg/TSI. This site also contains ad-ditional details about the transits of Mercury and Venus that SORCE/TIM has observed.
Farewell to An Unsung Hero of The Earth Observer Each issue of The Earth Observer is the result of a collaborative effort by a team of professionals. Our edito-rial team works with the authors to meticulously review all of the content. A top-notch graphic designer turns it all into the polished final product you hold in your hand. Most of the work happens quietly, behind the scenes, and yet it is vitally important to maintaining the high quality of each issue that our readers have come to expect.
For 17 years, John T. “Tim” Suttles has been one of those dedicated team members, serving as a Techni-cal Editor for The Earth Observer since 1995; however, we regret to inform you that the July–August 2012 issue will be his last.
Tim brought expertise from a career that spanned more that 53 years in aerospace and Earth science research. That tenure included 36 years of NASA experience, during which Tim worked as a NASA researcher and research program manager. For much of his career he was a senior scientist and principal investigator for NASA Earth radiation studies at the Langley Research Center. He has been supervisor and research leader of NASA teams investigating atmo-spheric radiation and clouds, ocean and atmospheric pollution transport, and satellite data analysis. He authored or co-authored over 80 research publica-tions. In September 1994, Tim retired from NASA Headquarters where he was Program Manager for NASA’s Earth Radiation Sciences in the office of Mission to Planet Earth. From 1995–2001, he worked for several Washington, DC area aerospace companies while serving as Senior Science Advisor to NASA’s Earth Observing System Project Science Office (EOSPSO). Since June 2001 he has worked on various NASA contracts in a part-time capacity as a science advisor to the EOSPSO.
The Earth Observer wishes to thank Tim for his years of service to our publication and wish him well in all his future endeavors. Best wishes, Tim, your contributions will be missed!

The Earth Observer July - August 2012 Volume 24, Issue 4 38N
ASA
ear
th s
cien
ce in
the
new
sNASA Earth Science in the NewsPatrick Lynch, NASA’s Earth Science News Team, [email protected]
Texas Wind Farms’ Impact On Climate Causes Stir, May 1; USA Today. A study linking Texas wind farms to higher surface temperatures led to dramatic media headlines about wind farms causing climate change. Yet its lead author did not say that, nor does earlier re-search. The study, published in Nature Climate Change, used data from the Moderate Resolution Imaging Spectroradiometer (MODIS) to analyze land surface temperatures near a few large wind farms in Texas from 2003–2011. It found a nighttime warming effect over the farms of up to 0.72 °C (~1.3 °F) per decade. Re-searchers attribute the warming to turbines acting like fans to pull warmer air from the atmosphere to the ground. “The warming effect reported in this study is local and is small compared to the strong background year-to-year land surface temperature changes,” said lead author Liming Zhou [State University of New York-Albany].
Plant Experiments Underestimate Climate Change Effects, May 2; Science News. Plants leafed four times earlier and flowered eight times earlier in observational studies than in controlled warming studies, accord-ing to a new paper in Nature. Warming experiments showed advances in flowering or leafing time of less than 1 day to 1.6 days per degree rise. But in the ob-servational studies, the plants advanced 5-to-6 days per degree. “We were surprised at how different the obser-vations and the experiments really were,” says co-author and climatologist Benjamin Cook [NASA Goddard In-stitute for Space Studies]. Cook helped compile a mas-sive new archive of observational phenology studies for the paper.
NASA to Cooperate in Virginia Bird Study, June 7; United Press International. NASA is joining with The Nature Conservancy in a study of global rainfall and its effects on migratory bird habitats on the Eastern Shore of Virginia. The conservancy is providing access to NASA at the Virginia Coast Reserve near Oyster, VA, to place weather radar, rain gauges, and other in-struments that will support NASA’s Global Precipita-tion Measurement (GPM) mission, which is scheduled for launch in 2014. In return, NASA will support mi-
gratory bird studies by The Nature Conservancy using the weather radar. Its ground-based radar in Virginia offers a unique surveillance opportunity for improved bird identification and observation, Conservancy of-ficials said.
*NASA Discovery Reveals “Rainforest” Of Plant Life Beneath Arctic Sea Ice, June 7; Space.com. The appar-ently barren ice of the Arctic can host huge bright green blooms of microscopic plantlike organisms, called phy-toplankton, underneath it—all hidden from satellites—suggesting that the Arctic Ocean is far more productive than previously thought. In July 2011, scientists with the NASA-sponsored Impacts of Climate on Ecosys-tems and Chemistry of the Arctic Pacific Environment (ICESCAPE) expedition discovered a massive under-ice bloom that extended for more than 72 mi (~116 km) into the ice pack on the Chukchi Sea continental shelf. They think that the thinning sea ice is allowing more sunlight to penetrate the Arctic ice cap in summer. Based on their findings, productivity in the area may be 10 times higher than current estimates of productiv-ity that are based solely on open-water measurements of Arctic phytoplankton. The study was published recently in Science.
White Marble View Over Arctic: Big Pic, June 20; Discovery News. A newly released image (see page 39) from NASA shows off our home planet from an unfa-miliar angle: Unlike the more-common views, of our iconic blue marble, this image, snapped by a satellite that orbits with repeated views of the Arctic, is arrayed in frosty white. The Suomi National Polar-orbiting Partnership (Suomi NPP) satellite, which was launched on October, 28, 2011, circled the Earth 15 times to capture the visual data used for the stunning picture. Although the bright swirl of Arctic ice dominates the top of the globe, looking a bit farther south and toward the left side of the frame, one can see the green of Eng-land and Ireland peeking between clouds. But it’s the vast, dry reaches of Asia, Saudi Arabia, and the Sahara that dominate the rest of the image.

The Earth Observer July - August 2012 Volume 24, Issue 4 39
NA
SA e
arth
sci
ence
in th
e ne
wsWarm Snap Turned Antarctica Green Around the
Edges, June 20; National Geographic News. An unex-pectedly warm period about 15 million years ago tem-porarily thawed Antarctica, turning the continent green around its edges, a new study published in Nature Geo-science says. Antarctica developed its ice sheets about 34 million years ago, but during the more recent warm pe-riod, the interior landscape would have resembled tun-dra found in parts of modern-day Chile and New Zea-land, and the coasts would have been lined with beech trees and a type of conifer. The surprising evidence comes from “abundant” remains of leaf waxes in sedi-ment cores taken from deep beneath Antarctica’s Ross Ice Shelf. Based upon a model originally developed to analyze hydrogen isotope ratios in atmospheric water vapor using data from NASA’s Aura spacecraft, co-au-
thor Jung-Eun Lee [NASA Jet Propulsion Laboratory] created experiments to find out just how much warmer and wetter the climate may have been. The peak of this Antarctic greening occurred during the middle Miocene period, between 16.4 and 15.7 million years ago.
*See news story in this issue for more details.
Interested in getting your research out to the general pub-lic, educators, and the scientific community? Please contact Patrick Lynch on NASA’s Earth Science News Team at [email protected] and let him know of your up-coming journal articles, new satellite images, or conference presentations that you think the average person would be interested in learning about.
White Marble
Fifteen orbits of the recently launched Suomi NPP satellite provided the Visible Infrared Imager Radiometer Suite (VIIRS) instrument enough time (and longitude) to gather the pixels for this synthesized view of Earth showing the Arctic, Europe, and Asia. Image credit: NASA/GSFC/Suomi NPP

The Earth Observer July - August 2012 Volume 24, Issue 4 40ed
ucat
ion
and
publ
ic o
utre
ach
upda
te NASA Science Mission Directorate – Science Education and Public Outreach UpdateTheresa Schwerin, Institute of Global Environment and Society, [email protected] Woroner, Institute of Global Environment and Society, [email protected]
BLiSS Sim – New iPad App
The Bioregenerative Life Support System Simulator (BLiSS Sim) is a free science education iPad app de-veloped by the Center for Educational Technologies at Wheeling Jesuit University in Wheeling, WV. With help from activities associated with NASA’s Bioregen-erative Life Support System research, players engage in the challenges of supporting humans in space or ex-treme environments on Earth. Players learn how four plant types can be grown and harvested to supply hu-man oxygen, water, and food needs. For more informa-tion and to download the app, visit: bliss-sim.cet.edu.
T-Shirt-to-Bag Activity from Climate Kids
Turn an old t-shirt into a handy reusable bag! With the leafy Climate Kids website banner ironed onto the front and the Climate Kids Leaps and Flutters game ironed onto the back, your bag will double as entertainment at the beach or the pool. After the iron-ons are done, the rest of the project is very easy, with no sewing re-quired. For instructions and transfer art, visit: climate.nasa.gov/kids/games/tshirt/index.cfm.
2012 Gregory G. Leptoukh Online Giovanni Workshop for Scientists, High School, and Undergrad Educators
September 2012
In September 2012 the NASA Goddard Earth Science Data and Information Services Center (GES DISC) will host an online workshop focused on the use of the pio-neering data visualization and analysis tool, Giovanni. (The workshop is dedicated to the memory of Giovanni’s creator, Gregory G. Leptoukh) The online workshop
will be organized around four main themes: Earth sys-tem research using Giovanni; Giovanni applications (e.g., air quality, disaster management, environmen-tal monitoring); planned and desired augmentation of Giovanni; and educational use of Giovanni. The work-shop will primarily consist of online author-led presen-tations, coupled with real-time discussions about these presentations. Presentations and chat logs will be avail-able online for review for those not able to participate in live sessions. To indicate interest, please email James Acker at [email protected], or visit: 1.usa.gov/M9Hyi7 for more information.
Climate Change Problem-based Learning (PBL) Modules Available for Classroom Pilot Testing—Middle and High School
The Exploring the Environment – Global Climate Change (ETE-GCC) project announces that five mod-ules are ready for pilot testing: Global Temperatures, Ice Caps and Sea Levels, Human Health, Volcanoes, and Drought. These new modules present an updated theoretical approach to problem-based learning (PBL) that focuses on scientific inquiry, use of satellite im-agery, and incorporating teaching strategies recom-mended in the Next Generation Science Standards. ETE-GCC welcomes insights and recommendations from middle and high school teachers who are willing to pilot-test these problem-based learning activities. Pre-service teachers are also welcome to participate in the process.
If you would like to participate in the pilot program, please sign up by sending an email to [email protected], or by requesting access to the site by selecting “LOGIN/REQUEST ACCESS” on the left, under “Global Tem-perature” at ete.cet.edu/gcc.

The Earth Observer July - August 2012 Volume 24, Issue 4 41
scie
nce
cale
ndar
sEOS Science Calendar
September 17–21, 2012 GRACE Science Team Meeting, Potsdam, Germany. URL: tinyurl.com/6wxfjpw
September 18–19, 2012 SORCE Science Team Meeting, Annapolis, MD. URL: lasp.colorado.edu/sorce/news/meetings.htm
October 1–3, 2012 Aura Science Team Meeting, Pasadena, CA. URL: mls.jpl.nasa.gov/aura2012/index.php
October 16–18, 2012 HyspIRI Workshop, Pasadena CA. URL: hyspiri.jpl.nasa.gov/events/2012-hyspiri-workshop
October 22–26, 2012 CERES Science Team Meeting, Princeton, NJ. URL: ceres.larc.nasa.gov/ceres_meetings.php
Global Change Calendar
August 25–September 1, 2012 XXII Congress of the International Society of Photo-grammetry and Remote Sensing, Melbourne, Australia. URL: www.isprs2012.org
September 11–14, 2012 ForestSAT 2012, Oregon State University, Corvallis, OR. URL: www.forestsat2012.com
October 6–12, 2012 Land-Cover and Land-Use Change Dynamics and its Impacts in South Asia, Dehradun, India. URL: lcluc.umd.edu/meetings.php?mid=40
November 5–9, 2012 PORSEC-2012: Water and Carbon Cycles, Kochi, In-dia. URL: www.porsec2012.incois.gov.in
December 3–7, 2012 American Geophysical Union Fall Meeting, San Fran-cisco, CA. URL: www.agu.org/meetings

Code 610 National Aeronautics and Space Administration
Goddard Space Flight Center Greenbelt, MD 20771
PRSRT STD Postage and Fees Paid National Aeronautics and Space Administration Permit 396
Official Business Penalty for Private Use: $300
(affix mailing label here)
eos.nasa.govThe Earth Observer
The Earth Observer is published by the EOS Project Science Office, Code 610, NASA Goddard Space Flight Center, Green-belt, Maryland 20771, telephone (301) 614-5561, FAX (301) 614-6530, and is available in color on the World Wide Web at eospso.gsfc.nasa.gov/eos_homepage/for_scientists/earth_observer.php. Black and white hard copies can be obtained by writing to the above address.
Articles, contributions to the meeting calendar, and suggestions are welcomed. Contributions to the calendars should contain loca-tion, person to contact, telephone number, and e-mail address. Newsletter content is due on the weekday closest to the 15th of the month preceding the publication—e.g., December 15 for the January–February issue ; February 15 for March–April, and so on.
To subscribe to The Earth Observer, or to change your mailing address, please call Cindy Trapp at (301) 614-5559, or send a message to [email protected], or write to the address above. If you would like to stop receiving a hard copy and be no-tified via email when future issues of The Earth Observer are available for download as a PDF, please send an email with the sub-ject “Go Green” to [email protected]. Your name and email address will then be added to an electronic distribution list and you will receive a bi-monthly email indicating that the next issue is available for download. If you change your mind, the email notification will provide an option for returning to the printed version.
The Earth Observer Staff
Executive Editor: Alan Ward ([email protected])
Assistant/Technical Editors: Heather Hyre ([email protected]) Mitchell Hobish ([email protected])
Technical Editors: Tim Suttles ([email protected]) Ernest Hilsenrath ([email protected])
Design, Production: Deborah McLean ([email protected])
Printed on Recycled Paper NP-2012-7-311-GSFC