texray application hand book ver1.02
TRANSCRIPT

8/6/2019 TexRay Application Hand Book Ver1.02
http://slidepdf.com/reader/full/texray-application-hand-book-ver102 1/22
TEXRAY
Over View
TexRay The product work as a tool, towards applying the scientific approach in e
ngineering, maintenance and
production Vs profit, analyzing the textile industry. It provides the customer with easy to apply tools, and information
systems to achieve miracles in textile engineering.
Many of our customer buy the product initially with the purpose of power savingrelated applications, later they explain
us this is an innovative tool to textile not just only for power saving but alsofor the results it yields. Power analyzing
applications are very easy and efficient in Texray and saves lot of time and money.
The development of the Texray begins with the purpose of providing it as a tester for maintenance and engineering
analysis, just like an Evenness Tester that is for Quality improvement.
Even in the Quality, current trends are in online quality monitoring. Online monitoring is getting more important as
offline monitoring samples just cannot control quality beyond certain extent, or
we can take action after that is happened.With
present possible technologies, quality control providers are starting with the online monitoring provisions.
With the input of online trend, Kalki takes challenge to provide a product withall advanced requirements required to
use the tool more easily with online on every machine. This makes Texray a toolwith 100 % online monitoring for the
maintenance and engineering
Since Texray is a online monitoring product, it is already collecting productionand stop information (for the purpose of
generating the maintenance and power graph) at a very high accuracy than the conventional production monitoring
products. Kalki added up the production and stop monitoring a part of the Texray. Fortunately, Texray production
reports becomes one to one match with machinery manufacturers results, which sofor not possible with conventional
monitoring.
Since one of most consumed energy in textile next to Electrical energy is compre
8/6/2019 TexRay Application Hand Book Ver1.02
http://slidepdf.com/reader/full/texray-application-hand-book-ver102 2/22
ssed air and it is most wasted than theelectrical power, we include the compressed air monitoring to every machines butas an option only. Customer candecide to which machines more importance should be given. Towards the best pay back performance Kalkirecommends use of compressed air monitoring to machines that are consuming 25 CFM or more( MJS, MVS, Auto
winders, Texturizing machines Etc), so that it yields the maximum result of ourproduct to the customer.
TEXTILE UNDER A SINGLE MONITORING ENVIRONMENTEven for just production monitoringtheconventional production monitoring providers give several products for several machines. But Texray is a singleproduct for all departments from Blow room to finishing process (including looms, Knitting, MVS, texturizingetc). This is to eliminate the different reports and different computers for monitoring and integration.
What Texray can do for textile ?
We simply tell to our early customers that, amount same as evenness tester was done in quality
When the results becomes reality, customers give us many applications where theycan use this tool to improve, andimprovise the profitability of the system. Those feed backs are beyond our expectations, and it makes us more confident inpromoting Kalkis Texray, the real tool to effectively control the textile, and makes it one stop solution for all problems
Many customers use this tool to achieve the profit oriented productivity, instea
d of just being a production basedmanufacturing.
We just want to give more technical details of measuring and outputs from the kalki before going in detail inthe Application.

8/6/2019 TexRay Application Hand Book Ver1.02
http://slidepdf.com/reader/full/texray-application-hand-book-ver102 3/22
TEXRAY ARCHITECTURE:
8/6/2019 TexRay Application Hand Book Ver1.02
http://slidepdf.com/reader/full/texray-application-hand-book-ver102 4/22
As shown in figure 1 Texray contains 5 technical layers in the system :
Sensors and Sensor Less interface systems.
Dual core 5 function embedded CPU card.
PLC based data storage towards the effective data storage to with stand the power failures.
Windows based server programs with multithreading enabled core server programsfor trouble freeinterfacing and working Developed with Advanced mainframe Programs which are back bone of ourstructure.
Windows based client (kalki online) a very new concept for textile with advancedfeatures.
KNOWING MORE ON TECHNICAL LAYERS:
SENSORS:
As shown in the figure two, we have three kinds sensors adaptation in technicalmodule.
1 Physical sensor interface (applicable for current sensors , voltage interface, Flow sensor )for Power andCompressed air monitoring.
2 Sensor less interface for interfacing the machines production and stop sensorswithout installing anadditional sensor for the same purpose. This is first of its kind for any automation industry with Kalkis advancedtechnology.
3 Analog sensor interface for measuring the temperature, vibration, air pressureetc for the machine doctorfunction. (Maximum 8 analog output sensors per machine of any combination permitted).
DUALCORECPU:
This is an specially designed microchip, with twin processors inside the single

8/6/2019 TexRay Application Hand Book Ver1.02
http://slidepdf.com/reader/full/texray-application-hand-book-ver102 5/22
chip. Which does 5 functions.
1 Power Scope at the highest quality of 8000 scan / per sine wave, and power consumption at very highaccuracy of 0.01 W ( conventional Class 1 meters at 1 % accuracy or we can say 10 W / 1KW). When technicallydifferentiate the Conventional energy consumption power meter and kalki power gr
aph generator, Kalkis powermonitoring is doing the functions of the Power scope( Like a LOAD MANAGER) but the Energy consumptionmeters does the function of mechanical watt meters digitally.
2 Air Energy scope it is very similar to the Power graph , but it is interfacedto the flow sensor instead of acurrent transformer.
1. Production Measuring and calculating the production parameters and storing the data to PLC
1. Stop Classify the stop data reason wise with duration and averaging data. With eliminationlimitation convention stop monitoring systems. Standard 4 stop interface or 8 stop interface.
1. Machine doctor which receives the signals from 8 analog sensors and perform the actions which are
tailor made.
PLC BASED DATA INTERFACE:
PLC is to perform the data hub function with additional control functions if required. Each 24 machines will beindividually connected to a single PLC, Each PLC will be Serially connected to the Server .
8/6/2019 TexRay Application Hand Book Ver1.02
http://slidepdf.com/reader/full/texray-application-hand-book-ver102 6/22
SERVER:
It is a software layer, which have the capacity to share the multi core CPU features effectively. Since the softwaredeveloped with Main frame languages advanced than the conventional monitoring software, allows the customer
use the server for other application even when server working. Customer can operate the server to get reports or datamanipulation at the same time of communication of jobs.
KALKI ONLINE :
It is an client interface system for kalki products for all industries includingtextile, Since Texray is also anproduct inside kalki online client interface module.
With the new concept of single client software for all kalki products, it aims towards eliminating N number of
systems and easy operation of view or edit the complete reports and data in single system environment.
With a Jewel for LAN based environment, Single login with multiple rights to individual users wise programmableon multiple products. User wise language selection option enables all levels ofuser can use the system withoutlanguage barrier.
Provide the customer with the option to change the menu and field names in entrymenu or in reports for their easywords.Editable formulas to formulate the reports to the customer or country standards.
Web interface due to the advance in technology of information communication, kalki is the first to provide the webscoreboard to current performance of the machines on web, when and where it is required. (In future available only onexecutive version of kalki online)
SMS Short message alert system with easy to use NOKIA phone interface module will help the customer use this richfeature at just less than 6 USD a month expenses. (In future available only executive version of kalki online)
Auto email system The regular numerical reports or malfunction graphical reportscan be sent by email, to enable theuser to get the reports immediately, without waste of time and paper. (In futureavailable only on executive version ofkalki online)
8/6/2019 TexRay Application Hand Book Ver1.02
http://slidepdf.com/reader/full/texray-application-hand-book-ver102 7/22
OUT PUT FROM THE TEXRAY
1. GRAPHICAL OVER NUMERICAL
Power Texray reports either a production/energy report or stop analysis reportsas shown in figures are embedded withgraphical support. For every variable parameter columns customer can click and select the graphs of between machinesor for particular machine in long term.
This graphical future is to reduce the customer data analyzing time to locate the deviations in few seconds. Which willreduce the requirement of additional excel converters and report formation, however customer can save the data from anyreport to excel.
Click and send email future on reports with remarks or message more like an standard email future with attachedreports. This is part of the standard system.
8/6/2019 TexRay Application Hand Book Ver1.02
http://slidepdf.com/reader/full/texray-application-hand-book-ver102 8/22
TEXRAY DIAGRAM:
The important part of the Texray is the Texray diagram, which is the basic output from the system which will help
the customer to use this as a tool.
It provides curve of energy (electrical and air) versus the speed of the machinewith production based (like copcontent or bobbing content). The Texray Diagram first of its kind eliminates most manual operation required tostudy the machine.
Since it provides the graph for production in every machine in a minute interval, it makes the Texray an fullyonline tool which will help the customer to locate the cost saving point eitherof power or maintenance
malfunctions etc.
Additional graph on the Texray with formula (programmable), which may be a simple UKG graph or a production costcurve at the different speed and different production conditions. This will directly help the low technical financialmanagement peoples to assess the profit oriented productivity.

8/6/2019 TexRay Application Hand Book Ver1.02
http://slidepdf.com/reader/full/texray-application-hand-book-ver102 9/22
TEXRAY DIAGRAM FOR OE DIVISION :
TEXRAY GRAPH FOR OE DIVISION:
8/6/2019 TexRay Application Hand Book Ver1.02
http://slidepdf.com/reader/full/texray-application-hand-book-ver102 10/22
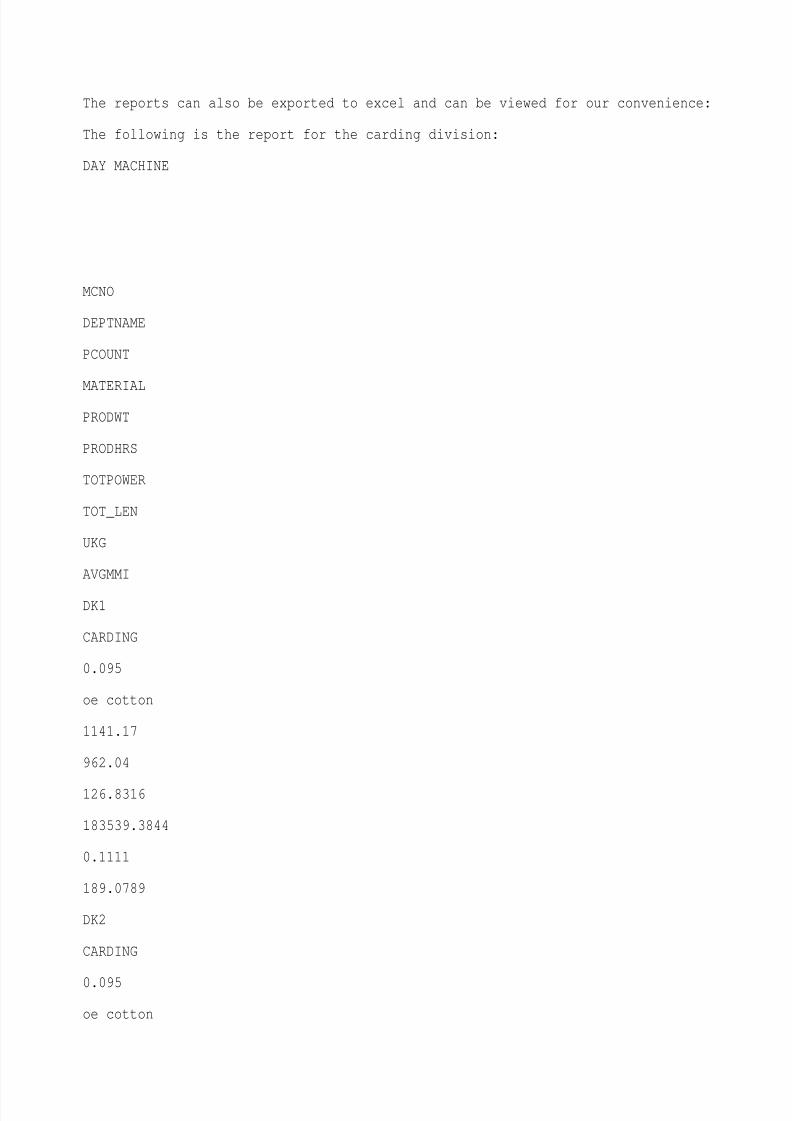
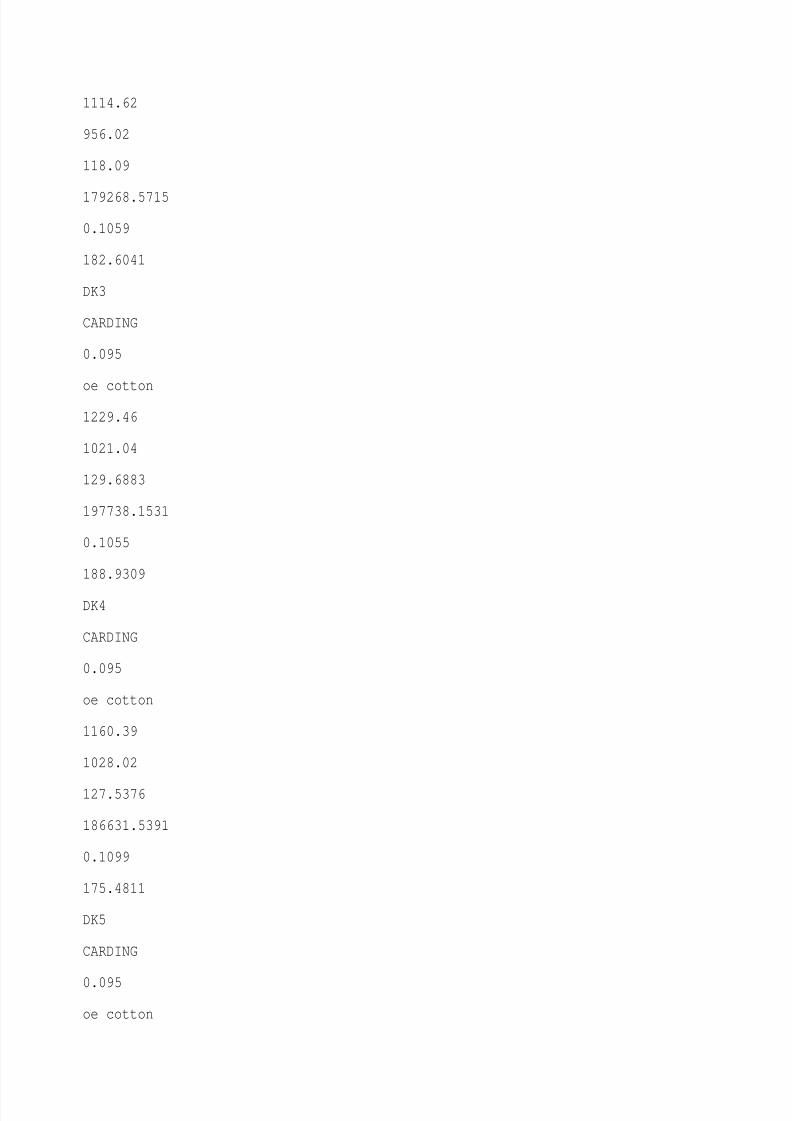
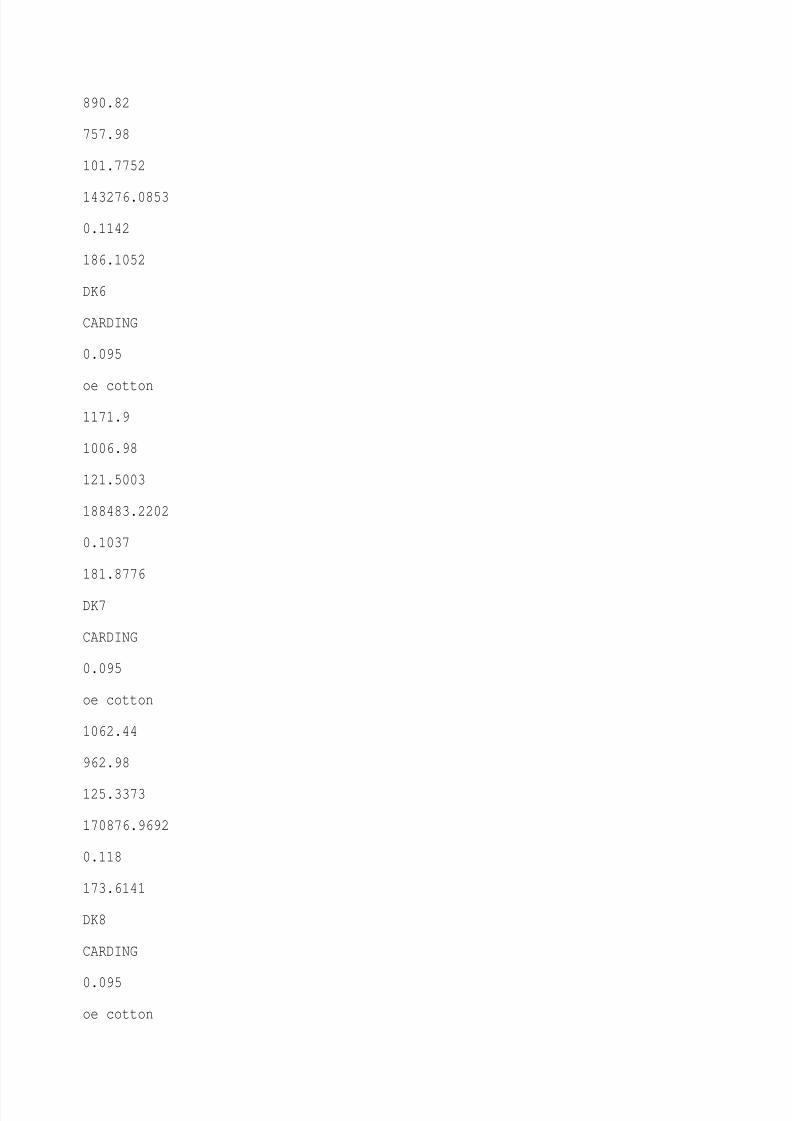
The reports can also be exported to excel and can be viewed for our convenience: The following is the report for the carding division:
DAY MACHINE
MCNO
DEPTNAME
PCOUNT
MATERIAL
PRODWT
PRODHRS
TOTPOWER
TOT_LEN
UKG
AVGMMI
DK1
CARDING
0.095
oe cotton
1141.17
962.04
126.8316
183539.3844
0.1111
189.0789
DK2
CARDING
0.095
oe cotton
8/6/2019 TexRay Application Hand Book Ver1.02
http://slidepdf.com/reader/full/texray-application-hand-book-ver102 11/22
1114.62
956.02
118.09
179268.5715
0.1059
182.6041
DK3
CARDING
0.095
oe cotton
1229.46
1021.04
129.6883
197738.1531
0.1055
188.9309
DK4
CARDING
0.095
oe cotton
1160.39
1028.02
127.5376
186631.5391
0.1099
175.4811
DK5
CARDING
0.095
oe cotton
8/6/2019 TexRay Application Hand Book Ver1.02
http://slidepdf.com/reader/full/texray-application-hand-book-ver102 12/22
890.82
757.98
101.7752
143276.0853
0.1142
186.1052
DK6
CARDING
0.095
oe cotton
1171.9
1006.98
121.5003
188483.2202
0.1037
181.8776
DK7
CARDING
0.095
oe cotton
1062.44
962.98
125.3373
170876.9692
0.118
173.6141
DK8
CARDING
0.095
oe cotton

8/6/2019 TexRay Application Hand Book Ver1.02
http://slidepdf.com/reader/full/texray-application-hand-book-ver102 13/22
941.01
859
121.7211
151346.8035
0.1294
164.6024
DK
8/6/2019 TexRay Application Hand Book Ver1.02
http://slidepdf.com/reader/full/texray-application-hand-book-ver102 14/22
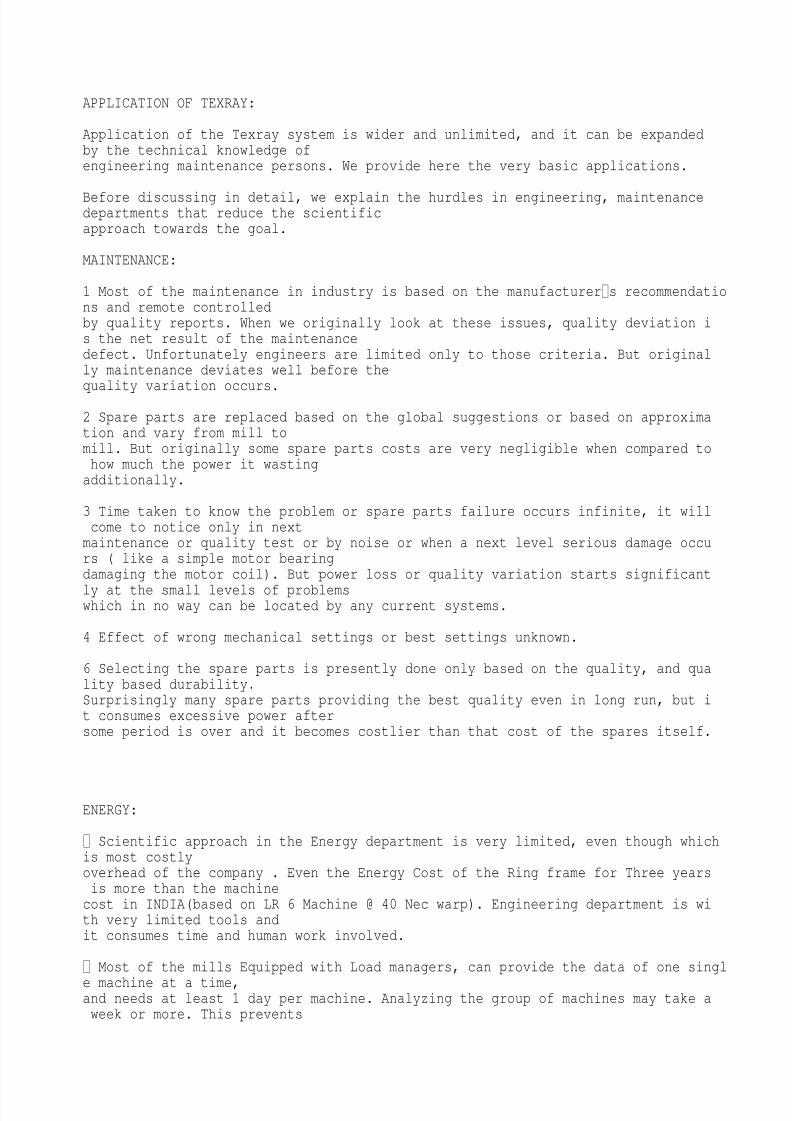
APPLICATION OF TEXRAY:
Application of the Texray system is wider and unlimited, and it can be expandedby the technical knowledge ofengineering maintenance persons. We provide here the very basic applications.
Before discussing in detail, we explain the hurdles in engineering, maintenancedepartments that reduce the scientificapproach towards the goal.
MAINTENANCE:
1 Most of the maintenance in industry is based on the manufacturers recommendations and remote controlledby quality reports. When we originally look at these issues, quality deviation is the net result of the maintenancedefect. Unfortunately engineers are limited only to those criteria. But originally maintenance deviates well before the
quality variation occurs.
2 Spare parts are replaced based on the global suggestions or based on approximation and vary from mill tomill. But originally some spare parts costs are very negligible when compared tohow much the power it wastingadditionally.
3 Time taken to know the problem or spare parts failure occurs infinite, it willcome to notice only in nextmaintenance or quality test or by noise or when a next level serious damage occurs ( like a simple motor bearingdamaging the motor coil). But power loss or quality variation starts significant
ly at the small levels of problemswhich in no way can be located by any current systems.
4 Effect of wrong mechanical settings or best settings unknown.
6 Selecting the spare parts is presently done only based on the quality, and quality based durability.Surprisingly many spare parts providing the best quality even in long run, but it consumes excessive power aftersome period is over and it becomes costlier than that cost of the spares itself.
ENERGY:
Scientific approach in the Energy department is very limited, even though whichis most costlyoverhead of the company . Even the Energy Cost of the Ring frame for Three yearsis more than the machinecost in INDIA(based on LR 6 Machine @ 40 Nec warp). Engineering department is with very limited tools andit consumes time and human work involved.
Most of the mills Equipped with Load managers, can provide the data of one singl
e machine at a time,and needs at least 1 day per machine. Analyzing the group of machines may take aweek or more. This prevents
8/6/2019 TexRay Application Hand Book Ver1.02
http://slidepdf.com/reader/full/texray-application-hand-book-ver102 15/22
the engineering department to locate the fine variations of below 3 to 5 % .
Most engineering departments studies needs a long meeting with the maintenance productiondepartment to convince, and many attempts failed since the data is not long termand limited. So manyproduction and department variation occurred during study. Which is very normal
to reject many studies whichhave suspicions and floating data
Current tools require experienced man power, or the several peoples work together to study the singlemachine. Basic Electrical and computer intelligence is a must for use these tools. Which limits continuesstudies.
5 Most of the assessment of maintenance or maintenance team performance is by the human data. But it ismisleading in many occasions.
8/6/2019 TexRay Application Hand Book Ver1.02
http://slidepdf.com/reader/full/texray-application-hand-book-ver102 16/22
It is very difficult to reconfirm the action, since only long term data can saythe reality, it isabsolutely difficult to assess the performance after action.
REMEDY FOR LIMITATIONS:
2 The Data and graph will be available in memory, permits even the backward analyzing.
3 Data readily available in graph form, which enables the user can directly, usethe data and needs to performaction only.
4 Automatic alerts on advanced communication networks like SMS, WEB provides thecomplete controls ofpresent possible.
5 Advanced graphical tools on every numerical data, requires seconds to make the
graphical forms of anydata to analyze anything in long term.
APPLICATION OF TEX RAY:
POWER COMPARISON AND OPTIMIZATION:
In reality there will be at least 2 to 5 % variation between the machines to machine even though they are from the samemanufacturer and running the same material and count. These variations are the results of spare parts or defective parts
or defective settings.
Such small variations can be identified when these machines data analyzed in long term, surprisingly even 2 %variation costing 7000 units per annum in 1000 spindle ring frame.
In practical elimination of such variation not much difficult, but in most of the experiences locating the problem afterconfident study was very little.
Many cases customer run the machines with higher doff content, which means the higher production, lower the manpower cost and lower joints at winding.
Yes there is a saving on the above, but when we analyze what we lose on power isalmost 4 times the cost thewhat saving achieved in the earlier method.
It becomes possible and required to optimize the production content for different counts and on differentmachines where the more saving and better profit is possible.
Cost of manufacturing with critical spare parts like spindle and ring versus life time :
Practically. Life of the spare parts like Ring is decided based on the quality and running performance in terms of
8/6/2019 TexRay Application Hand Book Ver1.02
http://slidepdf.com/reader/full/texray-application-hand-book-ver102 17/22
yarn breaks.
When see with Texray so many miraculous things identified. Even at the same quality and same productionperformance, Excessive power cost of those longer life parts is more than that part cost with in a year.
It shows the every spare parts life must be decided based on the Power also, since effect on power is occurring wellbefore on quality and production.
This is one of surprise information comes out from the textile industry after installing the Texray system, whichmakes tremendous changes in Ring Changing and selling markets.
1 Texray provides most advanced Graph which carry the speed versus production, power and production
cost curve for every machine and for every production minutes.
POWER VERSUS PRODUCTION CONTENT OPTIMIZATION.

8/6/2019 TexRay Application Hand Book Ver1.02
http://slidepdf.com/reader/full/texray-application-hand-book-ver102 18/22
MAINTENANCE DURATION:
Many cases found improving the maintenance routines, giving more saving on powerwhich is much higher than the totalmaintenance cost with immediate effect. But when we see in long term more benefits on failure of parts, and more
consistent in quality occurs.
With this scientific approach, customer achieves cost savings with improved performance , this kind innovations aremost required for current textile industry.
PROFIT VERSUS PRODUCTION:
Many companies say in past, before the Texray and power crisis, higher production means higher profit. That may betrue to some extent, but when we look at very closely there is scope to optimizethe speed pattern based on profit.
Most of Texray users now reduced the higher machine speed to optimize machine speed for different count, sincethe power curve rising abnormally beyond certain speeds and eating up the profit.
With lively analyze of the machine and immediate reports and customer can optimize with in two doffs of what they want.
Even the market condition or selling margin of yarn involves in running speed ofthe machine, since the powerconsumption is very high at very high speed which some time consumes portion ofthe profits
MAINTENANCE CONTROL ROOM:
When Texray starts working in the textile industry , The engineering and the maintenance departments are surprised tosee the results it produced and work round the clock to eliminate all the problems, since they could able to see the totalabnormalities in the mills, like power loss points, improper settings, maintenance variations.
This takes several months for the team to bring the mill to uniform, which produces the engineering departments withhuge saving and knowledge. This makes most of our customer places creation of MCR chaired by Engineering andmaintenance Professionals.
1.Shows effect of Spare parts worn out like a bearing ,and in next day reports enable them to take quicker action,which saves power and side effects.
1 Any improper setting after the maintenance or production setting visible.
2 Even Small yarn choking in main motors can be viewed from the power graph.
3 Feed back of maintenance and break down actions available in next day reports.
4 Assessing sample trial spare parts in a day results in selecting spare parts i
8/6/2019 TexRay Application Hand Book Ver1.02
http://slidepdf.com/reader/full/texray-application-hand-book-ver102 19/22
n scientific way.
5 Saves the critical parts failure with the immediate information even by SMS when the abnormalities occurs.
6 Continuous improvements on machines possible, which is responsible for consistent quality at the very effective
cost control.
7 Assists the financial department or cost controllers with yarn costing and realization.
With Texray customer can optimize the maintenance in terms duration and durability versus the cost of themaintenance and man power cost.
Regular inspection of Texray diagram and Power reports become routine jobs to them, which provides them thefollowing information.

8/6/2019 TexRay Application Hand Book Ver1.02
http://slidepdf.com/reader/full/texray-application-hand-book-ver102 20/22
COMPRESSOR CONTROLS INSIDE THE TEXRAY:
By using the results customer can optimize the compressor performance in following ways.
1 Analyzing the installation conditions, whether the direction and location is f
it for proper efficiency.
2 Comparing the compressors for efficiency in the system.
3 Analyzing the maintenance and maintenance effect, to fix the required schedule.
4 Spare parts durability and selecting the right one.
5 Selecting Right compressor based on long term cost saving.
GENERAL PRODUCTION AND STOP MONITORING SYSTEM:
Excellent reports and data interface system eliminates the requirements of any manual operation needed inproduction data collection and feeding system.
With the all the applications , Texray does More accurate production and stop monitoring with help highlyadvanced measuring and data capturing technology. Which provides the customer with the ready to useproduction data system with one to one match with the hang meters.

8/6/2019 TexRay Application Hand Book Ver1.02
http://slidepdf.com/reader/full/texray-application-hand-book-ver102 21/22
Compressor will be treat the Texray as part of the machinery, and it provide the
valuable information of production ofair versus power in time graph continuously. It also measures climatic conditions on the machines.

8/6/2019 TexRay Application Hand Book Ver1.02
http://slidepdf.com/reader/full/texray-application-hand-book-ver102 22/22