texas students succeed - teach plus
TRANSCRIPT

TEXAS STUDENTS SUCCEED:
Ensuring Equity and Achievement in the Lone Star State
ESSATEACHPLUS.ORG

+++++++++++++++ AUTHORS +++++++++++++++
Teach Plus Texas Teacher Advisory Board
Teach Plus Texas
Madonna Ramp, Doctoral Resident, Teach Plus Texas/Harvard Graduate School of Education
Lindsay Sobel, Senior Executive Director, Teach Plus Texas
Ali AshleyStefan BerthelsenAngela BurkeMelissa CurranPlácido Gómez
Taylor HawkinsAmy HestilowArielle HollanderJoLisa HooverBrittany Hughes
Mireya JimenezLaura LaywellKristian LendermanMary MaloneCrischelle I. Navalta
José Manuel RodríguezElizabeth ShaferShontoria Walker
Teach Plus Texas would like to acknowledge the 2016-2017 Teach Plus Texas Teacher Advisory Board, who conducted the focus groups, determined recommendations, and authored this
report.

1 +
+++++++++++++++ INTRODUCTION +++++++++++++++ With the passage of the Every Student Succeeds Act (ESSA), the Texas Education Agency (TEA) is seeking to set ambitious, yet achievable goals for Texas schools. In the winter and spring of 2017, members of the Teach Plus Texas Teacher Advisory Board collected feedback to offer suggestions to TEA as it sets goals on key outcome indicators such as graduation rates and student achievement data. By setting these goals, the state will be able to present a vision for providing an equitable education to Texas students.
The 18 members of the Teach Plus Texas Teacher Advisory Board are teachers from across Texas. We teach in a wide variety of traditional district and public charter schools and are invested in how state education policy affects our classrooms and our students. Our perspective as current teachers in K-12 Texas public schools is needed as our state works to address the implementation of the new law.
With this purpose in mind, we worked with TEA to design a set of questions that would inform Texas’ ESSA implementation plan and its strategic plan. We then conducted 24 focus groups, securing responses from 148 diverse fellow teachers with a variety of educational experiences from across the state including Amarillo, Arlington, Austin, Cedar Park, Dallas, Donna, Houston, Leander, San Antonio, and Weslaco. The teachers and the schools they teach in represented a variety of demographics and educational settings. In these focus groups, we informed teachers about ESSA and facilitated discussions about how to reach these goals. The teachers offered their own recommendations about the law’s implementation.
The quantitative and qualitative data collected from teachers in our focus groups gave us a sense of how educators across Texas feel about the state of our classrooms and how we should move forward. Asking teachers about their views on key issues in education is a necessary first step to both figuring out what the challenges are and ensuring that any implementation plan will have their buy in.
In this brief, we present recommendations on the state’s ESSA implementation plan and strategic plan, followed by findings from the focus groups and our experience that support them and illustrate how they will work in classrooms across the state.
++ GRADUATION RATES AND POST-SECONDARY READINESS ++
Recommendation: The goal for Texas’ graduation rate should be based upon a three-tiered approach that builds up to the goal of 95 percent by 2030. With this approach, 92 percent of students should be expected to graduate in four years, 95 percent in five years, and 96 percent in six years.

+ 2
When asked what the goal for the graduation rate should be by the year 2030, the most common answer teachers gave was 95 percent.1 Achieving this goal would require Texas schools to increase the graduation rate by seven points over the current rate of 88 percent.2
However, some teachers noted that because we currently only focus on four-year graduation rates, our school systems have no
incentive to continue to support students to graduate after the four-year mark.3 A three-tiered goal tracking for four-, five-, and six-year graduation rates could have a profound effect on the support students receive. Students who need extra time would receive extra support to strive for a high school diploma.
Many teachers gave an idealistic, yet reasonable, explanation; they want to shoot for 100 percent, but also set realistic goals for 2030.4 One teacher said: “In goal-setting, we want to make sure that the goal is attainable as well as challenging.”
Teachers had similar attitudes about the goals for students meeting the Advanced level, College Readiness level, and Satisfactory level in test scores—30 percent, 60 percent, and 90
percent respectively. The majority of teachers from our focus groups believe 30 percent, 60 percent, and 90 percent are not too high nor too low.5
Too Low 6%
Too High 36%
Unsure 7%
About Right 51%
Question: “For students meeting advanced, is 30 percent too high, about right, or too low?”
Too Low 27%
Too High 17%Unsure 4%
About Right 52%
Question: “For students meeting the college rediness level, is 60 percent too high, about right, or too low?”
Recommendation: Thirty percent of students should achieve the Advanced level, 60 percent should achieve the College Readiness level, and 90 percent should achieve the Satisfactory level on state assessments.
95%Graduation rate goal for 2030

3 +
Participants emphasized that it is vital to consider the unintended consequences for using punishments or sanctions as a part of the incentive structure for increasing graduation rates.6 If the state focuses too much on punishment, schools are then tempted to artificially increase their graduation rates on paper with grade inflation and other means that lower the effective standard for graduation.
Incentivising schools to lower their standard for graduation only gives an illusion of improving schools. Instead, we should incentivize
schools to be honest in their reporting and to remain faithful to the highest standard for graduation that makes receiving a diploma an accomplishment. For this reason, the state should adopt a philosophy of offering support, not punishments or sanctions, to schools that are not up to standards when it comes to graduation. Support should include investing in school structures and programs that specifically target students who are at high risks of not completing. Some examples of what these structures and programs can look like are outlined below.
One early intervention program, focusing on an at-risk population, is San Antonio ISD’s (SAISD) Master Teacher program. It is being piloted in the 2016-2017 school year, and will be implemented district-wide for the 2017-2018 school year. The Master Teacher program is a data-driven program partnering
exemplary educators with elementary students who have had to repeat a grade or are over-age according to their grade level. One goal of the focused instruction is to accelerate students’ academic progress in school to the age-appropriate grade level. Data shows that students who are over-age
EARLY INTERVENTION. A sustainable effort to increase the graduation rate requires that we identify and intervene when students are falling behind in school, including middle, elementary, and Pre-K.
Recommendation: To achieve these goals, the state should increase the use of carrots (supportive measures) to struggling schools and decrease emphasis on sticks (punitive measures).
Too Low 7%
Too High 36%
Unsure 7%
About Right 51%
Question: “For students meeting the satisfactory level, is 90 percent too high, about right, or too low?”

+ 4
even one year have a significantly decreased graduation rate. The theory of change for this program is that if students are caught up to their peers of the same age, they will be more successful academically and experience less social stigma and fewer social problems. SAISD’s Master Teacher program hopes to increase the district’s long-term graduation rate by focusing on early interventions in elementary schools for an at-risk population.
For middle and high schools, we recommend that schools use Early Warning Indicator (EWI)
systems to identify students who show signs of dropping out. The widely-used ABC system of indicators7 (A is for attendance, B is for behavior — often measured by classroom referrals — and C is for course grades) has been shown to predict if a student will drop out of school. For middle and high schools that need immediate help in decreasing their dropout rates, the state can invest in getting these schools real-time data systems, and in training school staff in how to use it to identify students according to the ABC system and intervene appropriately.
When thinking about a plan for improvement for campuses, teachers reflected on three key themes. Teachers reported increased need for
community involvement, teacher voice, and mentorships across schools.8
Parents and guardians have a significant impact on a student’s performance and a huge stake in the growth of a campus. Families should be involved in the creation of strategic goals, the review of academic progress, and the support of special populations. This can be measured in the following ways:
+ Number of parent-teacher meetings + Survey data from parents+ PTA enrollment+ Parent events and attendance+ Site-based committees
INCREASED FAMILY AND COMMUNITY ENGAGEMENT. Many of the teachers who participated in focus groups noted the need to get the community engaged in the education of our students. Students who perform best in school are often those with parents who are engaged in school and all aspects of their child’s education. Therefore, we should provide training to struggling schools to support students’ families. Engagement can take many forms such as regularly communicating with the teacher, and communicating with the parent about important events. According to one teacher, “If the vision for the student’s future by the home and the school are not the same, a student could feel torn.” If there were a team of staff members allocated to specifically focus on the connection between the home environment and the school environment, the alignment of the action steps for the student’s future might be stronger.
COMMUNITY INVOLVEMENT: As teachers, we know that schools won’t turn around themselves and we need support from communities in order to change systems that are broken. Community involvement falls into two categories: families and public partnerships.
+++++++++++++++ SCHOOL IMPROVEMENT +++++++++++++++
Recommendation: In order to ensure appropriate stakeholder involvement in school improvement, the state should require districts to focus on community involvement, teacher voice, and mentorships across schools.

5 +
Community partnerships advance student outcomes by providing additional support or services to schools for areas of high need. “Community” as defined in this context includes representatives from across sectors of the surrounding area, such as business representatives, advocacy groups, and leaders from underrepresented groups. The focus group respondents identified the following community resources as pertinent to school performance:
+ Social services and mental health support. A large number of teachers mentioned the need for both mental health and social services support. Teaching isn’t just about what happens
in the classroom, but also the social and emotional needs of our students.
+ Culturally-responsive interventions. The history and needs of a school are best known by the students, staff, and surrounding community. Thus, we recommend that any consultant groups be either based in the community or evaluated and selected by school and community members.
+ Effective, research-based partnerships. Universities can be an influential community partner to grow the skills and knowledge of teachers as well as to provide opportunities for students and families.
+ Vertical team support. Many times improvement plans only focus on STAAR-tested grades, which fall in the upper elementary and secondary grades. Studies have shown that developing foundational skills in early years is critical for students to be successful as they move into testing grades. Improvement plans should include support for earlier grades including lower elementary and early childhood to ensure that students are supported throughout their schooling experience, not just in the upper grades.
+ Multiple measures. Academic accountability is important, but achievement is best shown through multiple measures over long durations of time. Thus, we recommend including other measures beyond STAAR scores to ensure that every student, no matter their English proficiency status, can show growth that is measurable and appropriate.
+ Innovation. Schools need the freedom to try new ways to solve the same problems that have confronted high-need schools.
TEACHER VOICE: The second piece of feedback integral to school improvement is the inclusion of teacher voice. Although administration is often the key decision-maker on campus, teachers are the ones who enact the plan with students. The following were the important ideas that teachers identified:
Recommendation: After three years of targeted support, TEA should move a school from Targeted Support to Comprehensive Support.
The most common response among focus group respondents was that three years is enough time to move from targeted to comprehensive support, but responses ranged from two to six years.9
3yrs To trigger move to comprehensive support

+ 6
Teachers believe every child deserves equal access to a quality education regardless of his/her background or socioeconomic status. Teachers recognize this requires measuring and comparing student progress. At the same time, the teachers we spoke with recognized a tension: test scores are imperfect measures of the full curriculum taught in schools, yet they are the only measure of academic
achievement currently available to the state. Further, they recognize that test scores do not assess the full curriculum and cannot be complete measures of the educational experience. As a result, we have the following recommendations when it comes to the ESSA requirements for district equity plans and the state’s equity plan.
TEA must communicate to stakeholders that STAAR score growth is simply a proxy the state is using to provide support while encouraging the collection of informal data around additional indicators, such as student engagement. TEA should use district equity plans as labs to find best practices for identifying and measuring equity. As districts enact their equity plans, the state could consider adopting an additional standardized measure for equity that has been used successfully by a district or districts.
Recommendation: The Texas Education Agency should use growth in STAAR scores as a measure to assess equitable access to effective teaching — while seeking an additional measure.11
+++++++++++++++ EQUITY +++++++++++++++
StronglySupport 25%
Neither support nor oppose 6%
Strongly Oppose 11%
Unsure 3%
Somewhat Support 42%
Question: “To what degree do you support or oppose the idea of using student growth as a proxy for teaching effectiveness for purposes of the STATE Equity Plan?”
Somewhat Oppose 14%
A need also exists to differentiate time frame in elementary, middle, and high schools.10 Many teachers felt that it takes at least three years to turn around a school because schools need two years to build a strong foundation and the third year to be held accountable for the change.
As the improvement continues, there should be benchmarks that measure how students are meeting growth markers throughout their school’s targeted support. With these benchmarks, schools should receive increased support — not repercussions — if they do not meet the standards. These benchmarks should
also hold schools accountable for serving special populations.
Many teachers who participated in focus groups spoke about a quick implementation of new programs that fail because the focus changes before any teacher can become proficient with the new programs. Teachers and school leaders need time to build systems and structures and then learn, implement, and assess new skills and strategies. Lastly, during the time frame, TEA should hold standards consistent so that schools can accurately show growth across time, especially with continuously-enrolled students.

7 +
About 66 percent of teacher respondents said they strongly or somewhat support the state of Texas using student growth on tests alone to measure equitable access to effective teaching practices. Roughly one in four respondents had at least some hesitation around student growth measured by STAAR exams, with 8 percent of participants unsure or undecided. However, few respondents listed tangible solutions to measuring equity that wouldn’t add additional testing, which is already a considerable source of frustration for teachers and their students.
Teachers’ focus group responses demonstrate their hesitance about using test scores because of the many grades and subjects not measured by STAAR Reading and Math scores.12 Wrote one respondent, “STAAR data should be used to measure data across the state given that it is the only test is that is given to all students. HOWEVER, I don’t think STAAR is the best form of assessment. I recommend going towards to a more growth-measured (norm-referenced) test like the national test MAP, rather than a proficiency test like
STAAR. STAAR is also not modified sufficiently for SPED.”
One idea was to use formative measures throughout the year and sampling of populations rather than all students at the end of the year. If additional data-gathering methods were included informally, the state could account for some of the student differences, while not overloading teachers and students with high-stakes testing. An example of such a method is the use of The National Assessment of Educational Progress (NAEP) or The Programme for International Student Assessment (PISA). These tests wouldn’t carry the same weight or administrative burden of high-stakes testing like STAAR. The state could test random samples of students at various points throughout the year. Scores would simply be used for data gathering purposes, and the number of example problems provided would be limited to prevent schools from preparing for the exams.
Recommendation: To supplement grades 3-to-11 test score data, Texas should make available — but not require — research-based primary grade assessments for literacy such as OWL, DRA-2, or Fountas and Pinnell to measure literacy growth from the beginning of the year to the end of the year.
We recommend supplementing the student growth data for STAAR with a performance-based literacy measure so that teachers have the most data available to them to ensure the most is being made of early education years. These tests should not be formalized. Instead, teachers can certify themselves as raters
through an online training system and submit the data informally to the best of their ability just as they do with TELPAS. Then the state would have at least some measure of equity for the untested grades while not making the testing too strenuous for children, educators, or administrators.
Recommendation: TEA should make available — but not require — third-party testing systems that can more accurately measure student growth, such as CBM or MAP testing.

+ 8
Recommendation: The state should supplement student growth data with a campus special education evaluation at the end of the year to document the progress their students have made towards IEP goals, rather than include them in test score growth data if their IEP doesn’t prescribe taking it.
Recommendation: TEA should announce adjustment periods for measuring growth when STAAR changes.
Teachers want to measure growth. However, they see STAAR as an imperfect measure. Statistically speaking, a student may grow from a second to a fourth-grade math level — but if they are in the fifth grade taking the fifth-grade Math STAAR test, this growth will not be accounted for because STAAR tests only fifth-grade standards.
To supplement this deficiency, TEA should make available a test designed to measure growth that teachers can use to track it. This data could then be available to TEA. Providing tools to better measure growth will both provide TEA with more informal data as well as help educators sharpen their practice.13
Educators want to include special education students in measures of equity, but we don’t want to hold them accountable via the same measures if their IEP deems it inappropriate. These students need to show growth, but they need to do so according to their goals. According to one teacher, “The percentage of
high needs students with a class, even with effective teaching, may not show as much growth.”
This would also help make the data surrounding student STAAR growth data more clear if an IEP showed the student ought to be assessed by some other measure.
It is difficult to get an accurate picture of growth when growth measures continuously change. For example, the shifts in STAAR test length and the Math TEKS changed how the tests measured growth. There is a possibility
that the standards for reading may change sometime soon, too. One respondent wrote, “The growth measures need to be consistent, and the subject being assessed needs to be in all of the grades that are being taught.”
Recommendation: TEA should set a goal of 2030 for eliminating equity gaps for low-income students using the statewide student growth measure with two- or three-year interim-goals to progress-monitor.
TEA should use preliminary data from the statewide growth measure to set target goals and interim goals, and to allocate support and resources to meet the identified needs. We don’t want to wait for 2030 for high-need students to have access to an equitable education. They need it now. We should focus on small sub-goals as we work towards the 2030 goal.
Focus group participants offered many suggestions on how to get there.14 Once these goals are set, TEA should make grant money available to districts and areas of districts for state-identified best practices to incentivize these best practices. Best practices could include attracting more high-performing teachers to high-need schools, building in more community support
9 +
Recommendation: Districts’ equity plans should be tailored to their districts and their needs as they select their teacher evaluation system and student engagement system.
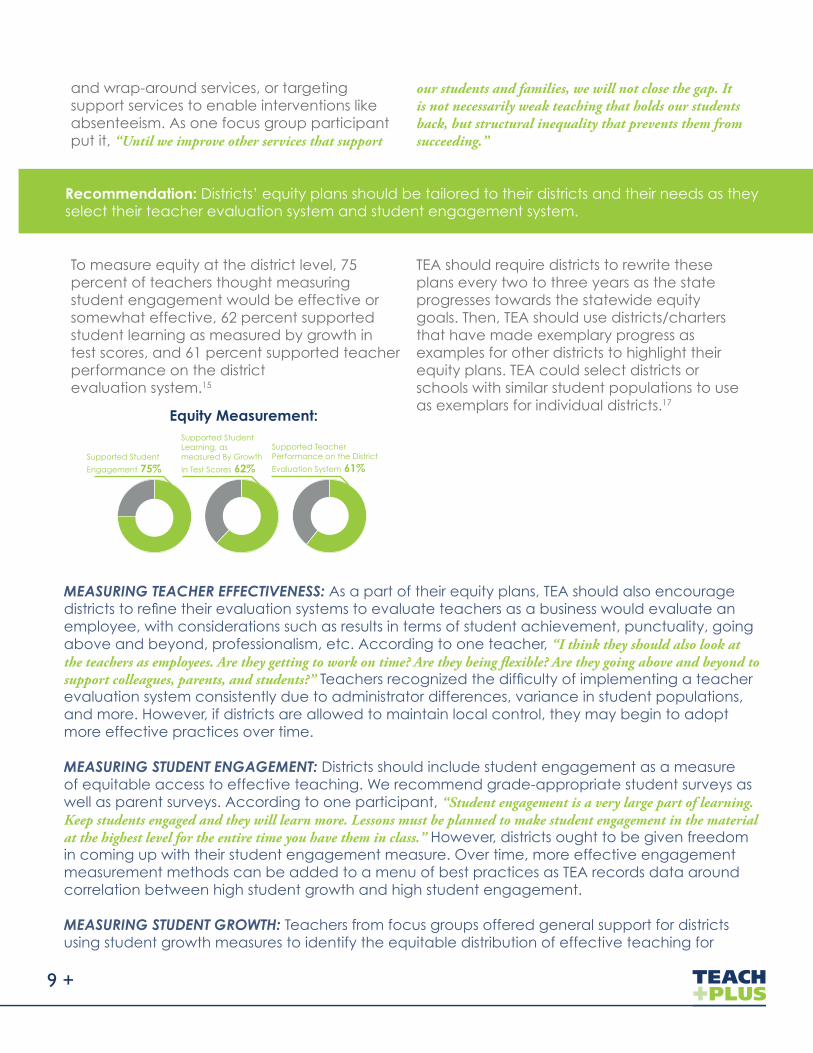
To measure equity at the district level, 75 percent of teachers thought measuring student engagement would be effective or somewhat effective, 62 percent supported student learning as measured by growth in test scores, and 61 percent supported teacher performance on the district evaluation system.15
TEA should require districts to rewrite these plans every two to three years as the state progresses towards the statewide equity goals. Then, TEA should use districts/charters that have made exemplary progress as examples for other districts to highlight their equity plans. TEA could select districts or schools with similar student populations to use as exemplars for individual districts.17
Supported Student
Engagement 75%
Supported Student Learning, as measured By Growth
In Test Scores 62%
Supported Teacher Performance on the District
Evaluation System 61%
Equity Measurement:
and wrap-around services, or targeting support services to enable interventions like absenteeism. As one focus group participant put it, “Until we improve other services that support
our students and families, we will not close the gap. It is not necessarily weak teaching that holds our students back, but structural inequality that prevents them from succeeding.”
MEASURING TEACHER EFFECTIVENESS: As a part of their equity plans, TEA should also encourage districts to refine their evaluation systems to evaluate teachers as a business would evaluate an employee, with considerations such as results in terms of student achievement, punctuality, going above and beyond, professionalism, etc. According to one teacher, “I think they should also look at the teachers as employees. Are they getting to work on time? Are they being flexible? Are they going above and beyond to support colleagues, parents, and students?” Teachers recognized the difficulty of implementing a teacher evaluation system consistently due to administrator differences, variance in student populations, and more. However, if districts are allowed to maintain local control, they may begin to adopt more effective practices over time.
MEASURING STUDENT ENGAGEMENT: Districts should include student engagement as a measure of equitable access to effective teaching. We recommend grade-appropriate student surveys as well as parent surveys. According to one participant, “Student engagement is a very large part of learning. Keep students engaged and they will learn more. Lessons must be planned to make student engagement in the material at the highest level for the entire time you have them in class.” However, districts ought to be given freedom in coming up with their student engagement measure. Over time, more effective engagement measurement methods can be added to a menu of best practices as TEA records data around correlation between high student growth and high student engagement.
MEASURING STUDENT GROWTH: Teachers from focus groups offered general support for districts using student growth measures to identify the equitable distribution of effective teaching for

+ 10
their equity plans. Districts should use the same state-wide growth measure based on STAAR. This will help the state cross-compare districts as a whole in their progress towards the equity goal. According to one teacher, “I think the most important parts of measuring effectiveness is teacher performance and student performance. I think both require substantial data to show if students are learning or not. I think the student engagement measure is very subjective.” Other method options include discipline data and teacher retention rate.
Other district-chosen methods of measuring equity may include: 16
DISCIPLINE DATA: While we recognize the challenges of implementing effective goal-setting on student discipline systems, we believe that struggling schools may need help implementing strong systems to create a culture that promotes academics. One teacher reflected, “It’s really important to look at the behavior within the school. What systems are put into place to make sure students who struggle within the classroom don’t lash out? What resources are given within districts?”
TEACHER-RETENTION RATE: Teachers improve incrementally over time. Unfortunately, low-income schools often have the least experienced teachers. Experience alone is not an indicator of teacher effectiveness, but chronic teacher turnover is demonstrably bad for students. Students and their achievement suffer when new teachers are are continuously cycled through to replace other new teachers who did not stay in the school very long.
++++++++++++++ CONCLUSION ++++++++++++++
Teachers care about equity for their students. Our sense of urgency about ensuring growth for ALL our students is often the motivating factor behind the work teachers do. As part of our goal of reaching all students, teachers are aware of the gaps between students when it comes to several categories
that come with additional obstacles to achieving success. Therefore, determining how to ensure access to effective teaching and to opportunity is paramount to the work that we do as teachers.
We heard this resoundingly during our focus groups.
The ESSA plan should include accountability for teachers, community, and family partnerships. The plan needs sufficient flexibility to promote a variety of approaches for different communities because we know that each student is unique. Our state ESSA plan must reflect that members of communities in cities, the suburbs, and rural areas across the Lone Star State are invested in improving our schools
for our future.
We must set bold goals to ensure an equitable education for Texas students. To achieve those goals, we must emphasize carrots over sticks, and support over punishment. TEA ought to emphasize its
equity measure, its equity goals, and district equity plans as an opportunity to work together to find and identify best practices for unique communities. Then, TEA ought to work as the intermediary
to make these best practices widely available, incentivizing their usage to target areas of need. If teachers see how TEA is responsive to needs, equity is that much more achievable for our students.
And we all want that.

13 +
+++++++++++++++ ENDNOTES +++++++++++++++
1 Question: “What should Texas set for our long-term graduation rate goal in 2030?” (n = 105) The top five numerical responses were “95%” (31.4 percent), “90%” (13.3 percent), “100%” (10.5 percent), “92%” (9.5 percent), “94%” (6.7 percent). 2 Texas Education Agency (2016). Secondary School Completion and Dropouts in Texas Public Schools 2014-15. Retrieved from: http://tea.texas.gov/acctres/dropcomp_index.html#reports.3 Question: “Please share how you arrived at your answer.” (n = 102)4 Question: “What other ideas do you have for achieving this goal?” (n = 93)5 Question: “For students meeting advanced, is 30% too high, about right, or too low? (n = 121) Responses “Too high” (35.5 percent), “About right” (51.2 percent), “Too low” (5.8 percent), “Unsure” (7.4 percent). Question: “For students meeting the college readiness level, is 60% too high, about right, or too low?” (n = 122) Responses “Too high” (17.2 percent), “About right” (51.6 percent), “Too low” (27.0 percent), “Unsure” (4.1 percent). Question: “For students meeting the satisfactory level, is 90% too high, about right, or too low?” (n = 120) Responses “Too high” (35.8 percent), “About right” (50.8 percent), “Too low” (6.7 percent), “Unsure” (6.7 percent). Results may not sum to 100 percent due to rounding.6 Question: “Please explain your answers, or share your ideas and suggestions.” (n = 96)7 For an overview of the ABC system, please see The Use of Early Warning Indicator and Intervention Systems to Build a Grad Nation: files.eric.ed.gov/fulltext/ED526421.pdf. 8 Question: “When considering a plan or process for supporting a school that needs improvement, what are important elements, steps, stakeholders, or processes that should be taken into consideration?” (n = 115)9 Question: “How many consecutive years of targeted support should trigger a move to comprehensive support?” (n = 110) The top five numerical responses were “3 years” (36.4 percent), “4 years” (24.5 percent), “2 years” (13.6 percent), “5 years” (10.0 percent), “2.5 years” (6.4 percent). The median value was used for responses that were expressed as a range.10 Question: “Please share how you chose your answer, and any other ideas that you have on achieving this goal.” (n = 99)11 Question: “To what degree do you support or oppose the idea of using student growth data as a proxy for teaching effectiveness for purposes of the STATE Equity Plan?” (n = 118) Responses: “Strongly support” (24.6 percent), “Somewhat support” (41.5 percent), “Neither support nor oppose” (5.9 percent), “Somewhat oppose” (14.4 percent), “Strongly oppose” (11.0 percent), “Unsure” (2.5 percent). 12 Question: “Recognizing that it is difficult to set long-term goals such as this, what are your suggestions for the year that TEA should set as a goal for districts to have eliminated equity gaps in the state?” (n = 99)13 For two examples of assessments that measure growth, please see Curriculum-based Measurement (CBM): http://www.jimwrightonline.com/pdfdocs/cbaManual.pdf or Measures of of Academic Progress (MAP): https://www.nwea.org/assessments/map/. 14 Question: “Recognizing that it is difficult to set long-term goals such as this, what are your suggestions for the year that TEA should set as a goal for districts to have eliminated equity gaps in the state?” (n = 99)15 Question: “Please rate how effective you think each of these factors is (as a part of a package of measures) in determining whether the highest-need students have access to strong teaching practices for the DISTRICT Equity Plans:” “Teacher performance on the district evaluation system” Responses (n = 119) “Very effective” (15.1 percent),

+ 14
“Somewhat effective” (46.2 percent), “Neutral” (17.6 percent), “Somewhat ineffective” (15.1 percent), “Very ineffective” (4.2 percent), “Unsure” (1.7 percent); “Student learning, as measured by growth in test scores” Responses (n = 119) “Very effective” (20.2 percent), “Somewhat effective” (42.0 percent), “Neutral” (15.1 percent), “Somewhat ineffective” (10.9 percent), “Very ineffective” (11.8 percent), “Unsure” (0 percent); “Student engagement” Responses (n = 118) “Very effective” (37.3 percent), “Somewhat effective” (38.1 percent), “Neutral” (11.0 percent), “Somewhat ineffective” (8.5 percent), “Very ineffective” (5.1 percent), “Unsure” (0 percent).16 Question: “Taking into account the usefulness of the data, as well as how efficient/inefficient it would be to collect it, please share any additional measures you think districts should collect to inform their Equity Plans. What other thoughts do you have?” (n = 88). 17 Question: “Please explain why you gave the answer you chose. If you oppose using student growth data, what data do you propose that the state use for this plan?” (n = 92)