template for electronic submission to acs journals · synchrotron saxs/waxs beamline at a...
TRANSCRIPT

S1
Harnessing Ester Bond Chemistry for Protein Ligation and Nanomaterial Assembly
and Disassembly†
P. G. Young,ab Y. Yosaatmadja,a P. W. Harris,ab I. K. H. Leung,c E. N. Bakerab and C. J. Squire*ab
a School of Biological Sciences, The University of Auckland, Private Bag 92019, Auckland, New Zealand.b Maurice Wilkins Centre for Molecular Biodiscovery, c/o The University of Auckland, Private Bag 92019,
Auckland, New Zealand.c School of Chemical Sciences, The University of Auckland, Private Bag 92019, Auckland, New Zealand.
†P.G.Y. and Y.Y. contributed equally to this work.
* Corresponding author: E-mail: [email protected]; Tel.: (+64) 9-923-8806
SUPPORTING INFORMATION
Table of Contents:
1. Materials and Methods
2. Figure S1: One-dimensional 1H nuclear magnetic resonance spectroscopic (NMR) analysis of
Cpe0147 and variants
3. Figure S2: ESI-MS analysis of bond formation between truncated protein (Cpe0147439-587) and
peptide (Cpe0147565-587).
4. Figure S3: SDS-PAGE analysis of the effect of buffer, pH, and molecular crowding agents on
ester bond formation
5. Figure S4: SDS-PAGE buffer screen at neutral pH in the presence of glycerol and CaCl2
6. Figure S5: SDS-PAGE analysis of the stability of Cpe0147 domain-2 in urea at alkaline pH.
7. Figure S6: Trypsin digest coupled with mass spectrometry
8. Figure S7: SDS-PAGE analysis of Cpe0147-T450S439-587 stability over a pH range
9. Figure S8: 1D 1H NMR end point analysis of the diagnostic methyl region of Cpe-T450S 439-587
10. Figure S9: 1D 1H NMR time course analysis of the diagnostic methyl region of Cpe-T450S 439-587
11. Figure S10: SDS-PAGE analysis of repeated Cpe0147-T450S439-587 ester bond formation and
hydrolysis cycles
12. Figure S11: Small angle X-ray scattering analysis of MBPcpeGFP
13. Table S1: Oligonucleotides
14. Table S2: Small Angle X-ray scattering parameters and statistics
15. References
Electronic Supplementary Material (ESI) for ChemComm.This journal is © The Royal Society of Chemistry 2017

S2
1. Materials and Methods:
Bacterial strains, plasmid and oligonucleotides. E. coli strain DH5α was used for all DNA manipulation and the BL21 (λDE3) (Stratagene) strain was used for protein expression. Cultures were grown at 37°C in 2xYT medium supplemented with ampicillin (100 μg/ml). All oligonucleotides primers used in this study are listed in Table S1.
Cloning C2 Cpe0147 constructs. DNA encoding the Cpe0147 amino acid sequence 439-563 (for full sequence see Uniprot entry B1R775) was PCR amplified from the C2 construct previously reported in Kwon et al. 2014,1 using primers PYC2NtermFwd and PYC2NtermRev. Amplified PCR fragments were digested with EcoRI and KasI restriction endonucleases, and cloned into the expression vector pMBP-ProExHta (Invitrogen). pMBP-ProExHta, previously reported in Ting et al. 2015,2 was generated by inserting the maltose binding protein (MBP) gene between the His6-tag and the rTEV (recombinant Tobacco Etch Virus protease) cleavage site of pProExHta. The resulting vector, pMBP-Cpe0147439-563, produces an N-terminal His6-tagged MBP fusion protein followed by an rTEV cleavage site and the Cpe0147439-563 truncated protein domain.
A second construct that lacks the cleavable rTEV recognition sequence was created by sub-cloning Cpe0147439-563 into the vector pMBP3, previously described in Ting et al. 2015.2 The resulting vector, pMBP3L-Cpe0147439-563, produces an N-terminal His6-tagged MBP fusion protein followed by an -AGA- three residue linker and the Cpe0147439-563 truncated protein domain.
A third, self-polymerising construct, was produced by the PCR amplification of Cpe0147 amino acid sequence 416-563 from the C2 construct using primers Fwdcomp1 and PYC2NtermRev. Amplified PCR fragments were digested with EcoRI and KasI restriction endonucleases, and were cloned into the expression vector pMBP-ProExHta to create the construct pMBP-Cpe0147416-563Poly.
A construct comprising enhanced green fluorescent protein (eGFP) engineered with an N-terminal peptide tag derived from residues 565-587 of Cpe0147, was produced as follows. Customized, complementary 76 bp synthetic oligonucleotides (CtermpeptF2 and CtermpeptR2; Integrated DNA Technologies) encoding residues 565-587 of Cpe0147 were annealed by applying a temperature gradient from 100°C to 20°C. The annealed product contained single-strand overhangs complementary to KasI and NcoI restriction endonuclease sites, and was inserted at the N-terminus of eGFP in the construct SP-GFP (Ting et al, 20152) between KasI and NcoI sites to create the construct pC2pept-GFP. This construct contains an N-terminal His6-tag sequence followed by an rTEV cleavage site and the Cpe0147565-587 peptide sequence fused to eGFP. All constructs were sequence verified at the DNA sequencing facility, School of Biological Sciences, University of Auckland.
Site-Directed Mutagenesis of Cpe0147. A T450S variant of pMBP3L-Cpe0147439-563 was made by inverse PCR site-directed mutagenesis using the phosphorylated primers PYC2T13SFwd and PYC2T13SRev with pMBP3L-Cpe0147439-563 as the template. Briefly, a high-fidelity DNA polymerase (iProof, Bio-Rad) was used for the PCR amplification of the pMBP3L-Cpe0147439-563 plasmid to produce a linearized PCR product with the desired mutation at the 5’ end of the sense primer. The methylated parental template without the T450S mutation was then removed from the non-methylated linear PCR product by DpnI digestion. Finally, the PCR product was re-circularized by intramolecular ligation. The resulting plasmid pMBP3L-Cpe0147-T450S439-563 was transformed into

S3
E. coli DH5α cells, amplified, extracted and purified for sequence verification. A fully intact domain Cpe0147-T450S439-587 was also engineered.
Protein expression and purification. The E. coli BL21 (λDE3) cells harboring recombinant expression constructs were grown in 2xYT medium supplemented with ampicillin (100 μg/ml) at 37°C in an orbital shaker (@180 rpm) to an optical density of OD600 = 0.5 - 0.6. Protein expression was induced by the addition of isopropyl β-D-1-thiogalactopyranoside (IPTG) to a final concentration of 0.3 mM and cultures were left to incubate for an additional 16 h at 18°C. Cells were pelleted at 4000 g at 4°C for 20 minutes, snap-frozen, and stored at -20°C.
Recombinant protein was purified from frozen cells, which were thawed and resuspended in lysis buffer [50 mM HEPES pH 7.0, 300 mM NaCl, 5% (v/v) glycerol, 10 mM imidazole] with the addition of Complete EDTA-free Protease Inhibitor Cocktail tablets (Roche) and lysed using a cell disruptor at 18,000 psi (Constant Systems). The insoluble protein fraction was removed by centrifugation (55,000 g at 4°C for 30 minutes) and the soluble recombinant protein fraction loaded onto a 5 ml Protino NiNTA column (Macherey-Nagel) for purification by immobilized metal affinity chromatography (IMAC). Recombinant protein was washed with Wash Buffer [50 mM HEPES pH 7, 300 mM NaCl, 20 mM imidazole] and eluted in a linear gradient with Elution Buffer (Wash Buffer with 500 mM imidazole). For constructs with removable His- or His/MBP affinity tags, fractions from IMAC containing recombinant protein were dialyzed overnight against a >100 x volume of dialysis buffer [20 mM HEPES pH7, 100 mM NaCl, 1 mM beta-mercaptoethanol] and the His6-tag or His-MBP concomitantly removed using recombinant TEV protease at a 1:50 molar ratio of rTEV to recombinant protein. Undigested protein and rTEV protease were removed by a second round of IMAC. Proteins with cleaved His-MBP tags were subjected to an additional purification by passage through an amylose resin (NEB) to remove contaminating cleaved MBP protein. Purified protein was concentrated and subjected to size-exclusion chromatography (SEC) on a Superdex 200 10/300 column (GE Healthcare) equilibrated with 10 mM HEPES pH7 and 100 mM NaCl. SEC-purified protein was concentrated to ~20 mg/ml and flash cooling in liquid nitrogen for subsequent storage at -80 °C.
Peptide Synthesis. A synthetic peptide comprising Cpe0147 residues 565-587, was prepared using the Fmoc/tBu solid phase methodology on a Tribute (Tucson, Az) automated synthesizer on a 0.1 mmol scale using appropriately functionalized aminomethyl polystyrene resin. Briefly, the N-Fmoc group was removed with 20% piperidine in DMF (v/v) for 2 x 5 mins and the incoming Fmoc amino acid (0.5 mmol) was coupled with HATU (0.45 mmol) and DIPEA (1 mmol) in DMF for 20 mins. The peptide was released from the resin with 95% TFA, 2.5% TIPS and 2.5% water (v/v/v) for 3 h, precipitated with ether and recovered by centrifugation. Crude peptide was purified by reverse phase HPLC using an appropriate gradient based on its analytical profile and the mass confirmed by LC-MS.
Mass spectrometry. Protein masses for Cpe0147439-563-Cpe0147565-587 products were confirmed by LC-MS using an Agilent 1120 Compact LC system with a Hewlett Packard Series 1100 MSD mass spectrometer using ESI in the positive mode. LC-MS was performed using a Zorbax SB-300 C3 (5μm; 3.0 x 150 mm) column (Agilent) and a linear gradient of 5% to 65% B over 21 mins (~3% B per minute) at a flow rate of 0.3 ml/min. The solvent system used was A (0.1% formic acid in H2O) and B (0.1% formic acid in acetonitrile). Date was acquired in the m/z range of 400-2000 and the m/z values were deconvoluted to yield the monoisotopic mass. All other mass spectrometry experiments were performed by the Mass Spectrometry Centre, The University of Auckland, Auckland, New Zealand, using an LC-MS/MS, Q-Star XL Quadrupole-Time-of-Flight system.

S4
Ester bond ligation reactions. Initial protein purification of Cpe0147439-563 was performed in a TRIS.HCl pH 8.0 buffering system. The initial experiments exploring the effect on pH and buffering systems contained residual TRIS.HCl (~2-5 mM) and NaCl (5 mM) from the diluted protein. For subsequent experiments protein was purified with a HEPES buffering system. Reactions for determining ester bond formation were performed with a protein concentration of 10 μM. Concentrated protein stored at -80°C was thawed and diluted ~20 fold to 10 μM in the reaction buffer while the concentration of the other components was varied. All reactions were incubated at 20°C unless otherwise stated. For time course experiments, samples were collected from a larger volume in the reaction tube and were stopped by adding SDS loading buffer and heating at 99°C for ~3 min.
NMR spectroscopy. NMR experiments were conducted using a Bruker 500 MHz instrument equipped with a BBFO probe. Conventional 5 mm NMR tubes (Norell) were used. Samples typically contained 90% H2O and 10% D2O. Unless otherwise stated, all experiments were conducted at 300 K. Standard 1H proton pulse sequence was used and water suppression was achieved by the excitation sculpting method with a 2 ms Squa100.1000 pulse. The pulse tip-angle calibration using the single-pulse nutation method (Bruker pulsecal routine)3 was undertaken for each sample.
Small-angle X-ray scattering. Samples for small angle X-ray scattering were buffer exchanged into 10 mM HEPES pH 7.0, 100 mM NaCl with size exclusion chromatography (SEC). Data were collected at the Australian Synchrotron SAXS/WAXS beamline at a wavelength of 1.03 Å with a camera length of 1.6 m covering a momentum transfer range of 0.006 < q < 0.6 Å−1 (q = 4πsin(θ)/λ). Data were collected by SEC-SAXS and images were processed using scatterBrain4 and PRIMUS5. SAXS data were further analyzed using programs in the ASTAS package including ab initio modeling produced in GASBOR and DAMMIF and with consensus models generated with DAMAVER.5
Small angle X-ray scattering of the ligated MBPcpeGFP assembly was undertaken to determine a low-resolution envelope of the structure. Data were collected every 2 seconds by SEC-SAXS from 25 μl of 12 mg/ml protein injected onto a Superdex S200 increase 5/150 GL column (GE Healthcare Life Sciences). Images representing the central peak of the SEC elution profile (images 120-130) were used for analysis, as shown in the scattering curve (Fig. S11A). The buffer subtracted scattering curve along with the Guinier plot (inset) is shown in Figure S11B. SAX scattering parameters and statistics are shown in Table S2.
S5
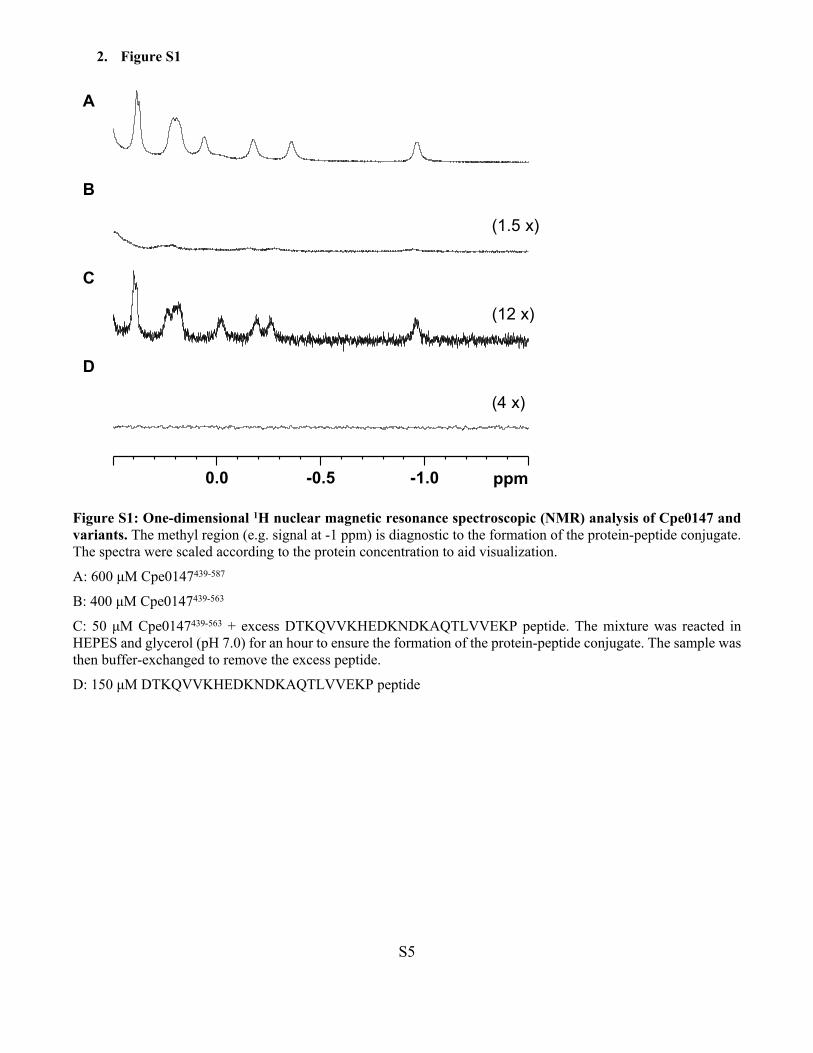
2. Figure S1
-1.0-0.50.0 ppm
A
B
C
D
(12 x)
(1.5 x)
(4 x)
Figure S1: One-dimensional 1H nuclear magnetic resonance spectroscopic (NMR) analysis of Cpe0147 and variants. The methyl region (e.g. signal at -1 ppm) is diagnostic to the formation of the protein-peptide conjugate. The spectra were scaled according to the protein concentration to aid visualization.
A: 600 μM Cpe0147439-587
B: 400 μM Cpe0147439-563
C: 50 μM Cpe0147439-563 + excess DTKQVVKHEDKNDKAQTLVVEKP peptide. The mixture was reacted in HEPES and glycerol (pH 7.0) for an hour to ensure the formation of the protein-peptide conjugate. The sample was then buffer-exchanged to remove the excess peptide.
D: 150 μM DTKQVVKHEDKNDKAQTLVVEKP peptide

S6
3. Figure S2
Figure S2: ESI-MS analysis of bond formation between truncated protein (Cpe0147439-587) and peptide (Cpe0147565-587). A calculation of mass is included as an insert and gives an average mass of 17129.2 Da which is a good match to the calculated mass of 17131.6 Da).

S7
4. Figure S3
Protein
Protein + Peptide
C 1 2 3 4 765 8
Figure S3: SDS-PAGE analysis of the effect of buffer, pH, and molecular crowding agents on ester bond formation. Cpe0147439-563 was mixed with peptide (Cpe0147565-587) comprising the last β-strand of the protein domain, and incubated for 180 min in a selection of buffer molecules (50 mM), and molecular crowding agents.
SDS-PAGE gel legend:
Lane C; Control Cpe0147439-563 without peptide.
Lane 1; Cpe0147439-563 + peptide in sodium acetate buffer, pH 5.0.
Lane 2; Cpe0147439-563 + peptide in sodium phosphate buffer, pH 6.0.
Lane 3; Cpe0147439-563 + peptide in MOPS buffer, pH 7.1.
Lane 4; Cpe0147439-563 + peptide in TRIS.HCl buffer, pH 8.0.
Lane 5; Cpe0147439-563 + peptide in borate buffer pH 8.8.
Lane 6; Cpe0147439-563 + peptide in glycerol (10% v/v).
Lane 7; Cpe0147439-563 + peptide in sucrose (200 mM).
Lane 8; Cpe0147439-563 + peptide in PEG 1k (10%).

S8
5. Figure S4
Protein
Protein + Peptide
C 1 2 3 4
Figure S4: SDS-PAGE buffer screen at neutral pH in the presence of glycerol and CaCl2. Cpe0147439-563 was mixed with peptide (Cpe0147565-587) comprising the last β-strand of the protein domain, and incubated for 15 min in a selection of buffer molecules (50 mM), with a constant concentration of 20% (v/v) glycerol and 100 μM calcium chloride.
SDS-PAGE gel legend:
Lane C; Control Cpe0147439-563 without peptide.
Lane 1; Cpe0147439-563 + peptide in Bis-Tris propane buffer, pH 6.8.
Lane 2; Cpe0147439-563 + peptide in HEPES buffer, pH 7.0.
Lane 3; Cpe0147439-563 + peptide in sodium phosphate buffer, pH 6.8.
Lane 4; Cpe0147439-563 + peptide in MOPS buffer, pH 7.1.

S9
6. Figure S5.
0 0.05 0.10 0.20 0.50 4.02.01.0 6.0
Urea (M)
Protein with bond
Hydrolysed bond
Figure S5: SDS-PAGE analysis of the stability of Cpe0147 domain-2 in urea at alkaline pH. The intact domain Cpe0147439-587 was incubated in increasing concentrations of urea in a TRIS.HCl, pH 9.0 buffer for 24 h. The wild type Cpe0147 domains with an intramolecular ester bond migrate further through an SDS-PAGE gel than the same protein that lacks an ester bond. The Cpe439-587 construct is very stable to hydrolysis even in 50 mM TRIS.Cl pH 9.0, 6 M urea, with only a very small proportion where the ester bond is hydrolyzed as evident by the appearance of a faint higher mass band.

S10
7. Figure S6.
Figure S6: Trypsin digest coupled with mass spectrometry. The spectra shows peaks corresponding to m/z fragments of the cross-linked complex and confirm the presence of the expected serine-glutamine side chain cross-link.

S11
8. Figure S7.
Protein with bond
Hydrolysed bond
1 2 3 4 765 8
Figure S7: SDS-PAGE analysis of Cpe0147-T450S439-587 stability over a pH range. Cpe0147-T450S439-587 (250 μM concentration) was incubated for 20 h in various systems to analyze the effect of pH on ester bond stability or hydrolysis. The ester bond between Ser450 and Gln580 is stable at a pH below 7, and hydrolyses above pH 7.
SDS-PAGE gel legend:
Lane 1; Cpe0147-T450S439-587 in MES buffer, pH 5.5.
Lane 2; Cpe0147-T450S439-587 in MES buffer, pH 6.0.
Lane 3; Cpe0147-T450S439-587 in MES buffer, pH 6.5.
Lane 4; Cpe0147-T450S439-587 in HEPES buffer, pH 7.0.
Lane 5; Cpe0147-T450S439-587 in HEPES buffer, pH 7.5.
Lane 6; Cpe0147-T450S439-587 in TRIS.HCl buffer, pH 8.0.
Lane 7; Cpe0147-T450S439-587 in TRIS.HCl buffer, pH 8.5.
Lane 8; Cpe0147-T450S439-587 in TRIS.HCl buffer, pH 9.0.

S12
9. Figure S8.
-1.0-0.50.0 ppm
MES buffer, pH 5.5
MES buffer, pH 6.0
MES buffer, pH 6.5
HEPES buffer, pH 7.0
HEPES buffer, pH 7.5
Tris buffer, pH 8.0
Tris buffer, pH 8.5
Tris buffer, pH 9.0
Tris buffer, pH 9.0(2 days)
Figure S8: 1D 1H NMR end point analysis of the diagnostic methyl region of Cpe0147-T450S439-587 (250 μM concentration). The samples were incubated for 20 h (unless otherwise stated) in various systems to analyze the effect of pH on ester bond stability or hydrolysis. Signals at the methyl region (e.g. signal at -1 ppm) are indicative for the formation of the protein-peptide conjugate.

S13
10. Figure S9.
-1.0-0.50.0 ppm
~7 min 30 sec
~28 min
~49 min
~70 min
~91 min
~112 min
~133 min
~154 min
~175 min
Figure S9: 1D 1H NMR time course analysis of the diagnostic methyl region of Cpe0147-T450S439-587 (250 μM concentration) showing the formation and stability of the T450S variant.

S14
11. Figure S10.
Figure S10: SDS-PAGE analysis of repeated Cpe0147-T450S439-587 ester bond formation and hydrolysis cycles. A single sample of Cpe0147-T450S439-587 protein was cycled between buffers that either promote ester bond formation (50 mM MES pH 5.5, 0.1 mM calcium chloride and 20% (v/v) glycerol) or induce ester bond hydrolysis (50 mM TRIS.HCl pH 9.0). The same protein sample (original sample purified from E. coli in Lane 2) was cycled between the two buffers three times. Because of the slower hydrolysis step the sample was dialyzed for 24 h at each step to insure maximal reaction. Ester bond formation is also shown for the Cpe0147-Q580E439-587 protein. When purified from E. coli this variant protein contains ~40% bond formed species (Lane 9) but is converted to ~80% bond formed after incubation in the MES buffer system for a period of 4 hr (Lane 10).
SDS-PAGE gel legend:
Lane 1; Cpe0147439-587 in TRIS.HCl pH 7.0, bond formed, as purified from E. coli.
Lane 2; Cpe0147-T450S439-587 in TRIS.HCl pH 7.0, as purified from E. coli.
Lane 3; Cpe0147-T450S439-587 in MES buffer system, bond formation round 1.
Lane 4; Cpe0147-T450S439-587 in TRIS.HCl buffer system, bond hydrolysis round 1.
Lane 5; Cpe0147-T450S439-587 in MES buffer system, bond formation round 2.
Lane 6; Cpe0147-T450S439-587 in TRIS.HCl buffer system, bond hydrolysis round 2.
Lane 7; Cpe0147-T450S439-587 in MES buffer system, bond formation round 3.
Lane 8; Cpe0147-T450S439-587 in TRIS.HCl buffer system, bond hydrolysis round 3.
Lane 9; Cpe0147-Q580E439-587 in TRIS.HCl pH 7.0, as purified from E. coli.
Lane 10; Cpe0147-Q580E439-587 protein from Lane 9 incubated in the MES buffer system for 4 hr.
Protein with bond
Hydrolysed bond
1 2 3 4 765 81 2 3 4 5 6 7 8 9 10

S15
12. Figure S11.
Figure S11: Small angle X-ray scattering analysis of MBPcpeGFP. A. SEC-SAXS elution profile of the MBPcpeGFP construct measured by small angle X-ray scattering intensity. Dashed lines represent the scattering data that was averaged to produce the scattering plot (shown in B). B. SAXS data plotted against scattering angle (log(I) vs q [Å-1]; open circles, averaged and solvent-subtracted). Inset: Guinier plot of low angle data showing linearity (ln(I*C) vs q2 [Å-2].

S16

S17
13. Table S1: Oligonucleotides
Oligo name Sequence
PYC2NtermFwd AAA GGC GCC AAT CTG CCT GAA GTG AAA GAT GG
PYC2NtermRev TTT GAA TTC TCA GTT GTA ATC TTT ATC CGT ATC GAT
Fwdcomp1 AAA GGC GCC GAT ACC AAA CAG GTG GTG AAA C
PYC2T13SFwd ℗-AGC ACC GTT ATT GCA GAT GGC G
PYC2T13CRev ℗-ACG CAG TGT ACC ATC TTT CAC
CtermpeptF2 ℗-GCG CCG ACA CAA AAC AGG TTG TCA AAC ATG AGG ACA AAA ACG ACA
AAG CAC AGA CAC TGG TGG TTG AAA AAC CGA C
CtermpeptR2 ℗-CAT GGT CGG TTT TTC AAC CAC CAG TGT CTG TGC TTT GTC GTT TTT GTC
CTC ATG TTT GAC AAC CTG TTT TGT GTC G
℗ = 5’ Phosphate

S18
14. Table S2: Small Angle X-ray scattering parameters and statistics
Data collection parametersBeamlinea AS SAX/WAXWavelength (Å) 1.03320Detector 1M Pilatus detectorCamera length (mm) 1575SEC column S200 increase 5/150 GLq range (Å-1) 0.006 - 0.6Sample capillary flow rate (ml/min) 0.5Exposure time/ images (s) 2Number of images used 10Sample concentration (mg/ml) 12Sample volume (μl) 25Temperature (K) 283Structural parametersI(0) (cm-1) (from P(r)) 0.05Rg (Å) (from P(r)) 47.2I(0) (cm-1) (from Guinier) 0.05Rg (Å) (from Guinier) 45.4Dmax (Å) 176.7Porod volume estimate (Å3) 134714MW calc from sequence (kDa) 84.7MW calc from Porod volume (kDa) 84.2SoftwarePrimary data collection
Data processing scatterBrain
Rigid body modelling SASREF
Computation of model intensities CRYSOL
ScatterBrainData processing ScatterBrainData analysis Primus, ATSAS
a Full details of the beamline specifications are available at the Australian Synchrotronwebsite.

S19
15. References:
(1) H. Kwon, C. J. Squire, P. G. Young and E. N. Baker, P Natl Acad Sci USA, 2014, 111, 1367.
(2) Y. T. Ting, G. Batot, E. N. Baker and P. G. Young, Acta crystallographica. Section F, 2015, 71, 61.
(3) P. S. C. Wu, and G. J. Otting, Magn. Reson., 2005, 176, 115.
(4) N. M. Kirby, S. T. Mudie, A. M. Hawley, D. J. Cookson, H. D. T. Mertens, N. Cowieson and V. J.
Samardzic-Boban, Appl. Cryst., 2013, 46, 1670.
(5) M. V. Petoukhov, D. Franke, A. V. Shkumatov, G. Tria, A. G. Kikhney, M. Gajda, C. Gorba, H. D. Mertens,
P. V. Konarev and D. I. J. Svergun, Appl Crystallogr., 2012, 45, 342.