temperature measurements in the lower thermosphere utilizing the raids near infrared spectrometer...
TRANSCRIPT

Temperature Measurements in the Lower Thermosphere Utilizing the RAIDS Near Infrared Spectrometer
Physical Sciences Laboratories
May 19, 2010
A. B. Christensen1, J. H. Hecht1, R. L. Bishop1,S. A. Budzien2, A. W. Stephan2, P. R. Straus1, Z. Van Epps2
1The Aerospace Corporation, Space Science and Applications Laboratory2Naval Research Laboratory, Space Science Division
Work supported by The Aerospace Corporation's Independent Research and Development Program.

2
ABSTRACT
•Specification of the temperature in the lower thermosphere (90 – 200 km) is a major objective of the RAIDS experiment on ISS.
•Near Infrared Spectrometer(750 – 900 nm) and 3 photometers: OI(6300), OI(7774), and O2Atm(0-0) 765nm observe dayside and nightside limb airglow.
•Temperature derived from O2Atm(0-0 and 1-1) spectral band shape is consistent with models and SABER observations.
•Brightness of the dayside 0-0 and 1-1 bands consistent with MSIS and AURIC models.

O2 Energy Level DiagramAtmospheric System Circled
3

4
RAIDS Remote Atmospheric and Ionospheric Detection System
• RAIDS comprises 7 instruments
On a mechanically scanned
platform with 1 staring FUV
instrument.
• The near infra-red photomultiplier tubes reside in a separate radiatively cooled
detector box.
• cooled housing to approximately
• -20 C.
•1 – 630.0 Phot•2 – 777.4 Phot•3 - NIR Spectrometer (700– 900)•4 - NUV Spectrometer (295 -400•5 - FUV Spectrograph (130 – 170)•6 - MUV Spectrometer (190 – 320)•7 - 765.0 Phot•8 - EUV Spectrograph (55 – 111)`
12
34
56
7
8
Courtesy of NASA

Geometry RAIDS Limb Viewing Geometry
504/19/23 5
75 km
750 km
16.5º Scan
6 km Resolution
Field of View 0.1º x 2.1º
3000 km
Courtesy of NASA

1/8m Ebert-Fastie Spectrometer
6
NIR instrument incorporates a fiber optic feed to a cooled (-20 C) photomultiplier tube

NIRS SPECTRA
Top Panel:
LOS T0-0 = 462 ±21K
LOS T1-1 = 621 ±69 K
Altitude = 128 km
Bottom Panel:
T0-0 = 288 ± 3 K
T1-1 = 306 ± 15 K
Altitude = 116 km
• The shape of the O2 atm bands change with temperature
7

Spectral Synthesis of NIRS data
• Temperatures of the O2 Atm (0-0, 1-1) bands and the radiance of other features in the spectrum were obtained using a multiple regression approach.
• Features in the Synthetic Spectrum model
– O2 Atm 0-0– O2 Atm 1-1– N2 1st Positive– N2+ Meinel– OI 777.4– OI 844.6– OII 732.0-3.0
8

Processed Temp Data March 24, 2010
9

RAIDS O2Atm (0-0) Temperatures vs.Model MSIS for F10.7 = 70, Tinf = 777 K
10
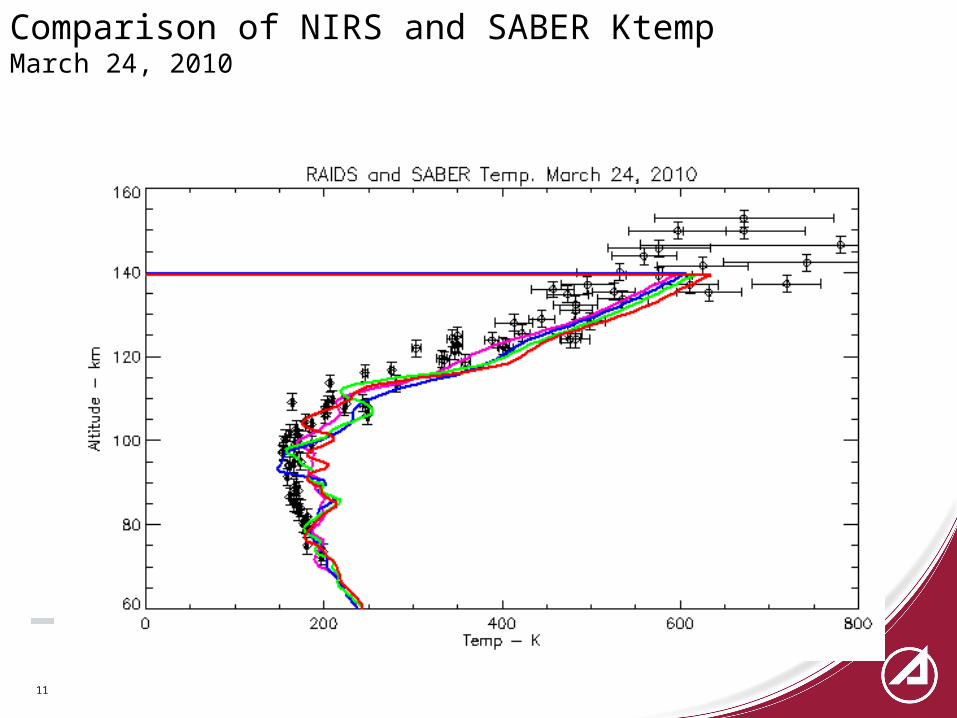
Comparison of NIRS and SABER KtempMarch 24, 2010
11

12
NIRS Temp00 – MSIS Model March 24, 2010

13
Comparison NIRS and SABER March 24 DaysideNIRS corrected NIRS temp00 – MSIS modelSABER Ktemp scan to scan differences

O2(1Σ) Photo Chemistry in the Thermosphere
14
PRODUCTION:O(1D) + O2 O2(1Σ) + O(3P) Energy TransferO2 + hν O2(1Σ) Solar Res. Scatt.
LOSS:O2(1Σ) + N2 , O, O2 O2 + N2 , O , O2 Quenching
O2(1Σ) O2 + hν Spon. Rad.

Modeled O2 (1Σ) v’=0 and v’=1 Density and Emission Profiles
15

Model and Dayside 0-0 and 1-1 Limb Brightness
16

CONCLUSIONS
•Instruments on the RAIDS experiment are alive and well. Dayside photometer observations are complicated by foreground
scattered light from the ISS.
•Temperature of the O2 atm (0-0 and 1-1) bands have been derived from the near infra-red (NIRS) data.
•Temperatures are in general agreement with models and measurements at the lower altitude range of the NIRS data
•The altitude profiles of the O2 (0-0 and 1-1) bands are in good agreement with the model. Hence, an additional high altitude source may not be required as previously postulated.
•Large scan to scan differences are suggestive of TIMED/SABER kinetic temperature measurements in lower thermosphere
17

Nightside Photometer Data
18
Red = OI 6300 (counts in 0.1 s * 0.1 + 50)Black = OI7774 (counts in 0.1s) Green = RAIDS scan angle (increasing angle is looking at lower altitudes)

Nightside OI7774 and OI 6300 versus Platform Scan angle
• Estimated radiance of OI7774 ~ 200R slant view
VanRhijn factor ~ 20
Nadir brightness ~ 10 R
• If this is an ionospheric signature of radiative recombination, the peak F –region electron Density ~ 1 e6 /cm3
19

20
RAIDS Installation on ISS
•RAIDS being attached to the porch
of the Japanese module04/19/23 20
RAIDS
Courtesy of NASA
Courtesy of NASA

March 24, 2010 O2(1Σ) 0-0 Temp. and 0-0 and 1-1 Brightness in Rayleighs
21