teleprompter robert johansson speech slide 1 --- · pdf filesecretary perdue and welcome you...
TRANSCRIPT
1 | P a g e
TELEPROMPTER_ Robert Johansson speech SLIDE 1 --- INTRO I would like to echo Deputy Secretary Censky and Secretary Perdue and welcome you all again to this year’s 94th annual Agricultural Outlook Forum. Our theme this year is “roots of prosperity”. This annual forum provides an important opportunity for all of us at USDA to discuss some of the upcoming challenges and opportunities we see on the horizon. Secretary Perdue talked about tax and regulatory reform, infrastructure investment, and efficient and effective farm policies Our key speakers later this morning will also talk about the current year facing industry, states, and nations. And tomorrow morning, we will hear from Deputy Secretary Censky, Under Secretary(s) McKinney, Ibach, and Hazlett who will describe the coming year for trade, regulations, and rural development. For the US, we know that producers have many questions looking to the 2018 crop year. The new Farm Bill? How will the BBA change programs? How quickly will disaster relief reach producers? What will happen with trade?
2 | P a g e
SLIDE 2 --- Farmers’ sentiment
I want to begin by looking at several recent surveys regarding sentiment about economic well-being over the next 6 to 12 months the Purdue/CME Ag Economy Barometer the University of Michigan index of consumers, the National Assoc of Home Builders housing index, the Federal Reserve Agcredit survey of bankers, and the Creighton University Mainstreet economy survey, plotted with the price received for a bushel of corn.
These compare sentiment from February 2017 to February 2018 From this viewpoint consumer, business, home builder, and banking indices all indicate similar feelings of optimism regarding the future economy compared to sentiments surveyed last year However, farmers seem more reflective --- tracking more closely to the price of corn since this time last year
3 | P a g e
SLIDE 3 --- Real Prices Farm income has stabilized, but is projected to fall. Why is that? Falling net farm income is largely the result of falling commodity prices, productivity is outpacing population growth and food demand. That has resulted in falling real food prices for the past half century. For example, Since 1960, soybean production has increased more
than 1,000 percent, while real soybean prices have fallen by 47 percent. AND
Corn production has grown by more than 400 percent and prices have fallen by more than 60 percent.
4 | P a g e
SLIDE 4 --- Real net farm income falling Today’s ag economy is also different from when Congress debated the last farm bill, when farm income was reaching historic levels, peaking in 2013 at more than $120 billion. Today, many producers are in a different situation. Net farm income looks likely to remain more than 50 percent in real terms below its 2013 peak for a third year in a row. Looking forward net farm income is expected to remain flat over the next ten years and when accounting for inflation, to fall in real terms. The most recent update to this outlook for 2018, released two weeks ago by ERS, shows the expectation for 2018 to be even lower, with a fall in net farm income in 2018 to $59.5 billion.
5 | P a g e
SLIDE 5 --- What might improve the outlook? Cheaper food benefits the global population, but pressures income for farmers. What might change that? First, improved global economic growth would draw more households into the middle-class boosting overall food demand. Similarly, trading agreements can open up new markets to US producers, which would also boost demand for US products. Second, weather conditions will affect global production and push up or draw down prices. For example, dryness in Argentina has pulled down the soybean crop, whereas beneficial rains in Brazil—seen in the map —have pushed up estimates. Also, farm policies in some countries could affect prices, such as China’s attempts to reduce artificially inflated commodity stocks. Lastly, the new farm bill will likely look to remedy some of those gaps, with that process already begun with the recently passed Bipartisan Budget Act (BBA) of 2018.
6 | P a g e
SLIDE 6 --- IMF growth forecasts more optimistic
Prospects look good for increasing demand. The IMF raised its 2017-19 growth forecasts sharply in January, showing marked growth in the last year and continuing stable over the next few years that should help boost demand. The aggregate purchasing power for the globe has essentially expanded $325 billion compared to our estimates back in December.
7 | P a g e
SLIDE 7 --- Income growth will drive increased global demand Much of the growth in global demand will be in developing countries that are projected to see a significant increase in the number of middle-class households As middle income households increase in emerging markets and developing countries, we expect demand for U.S. products, especially livestock and dairy products and the grains and oilseeds that make up livestock feed, and processed products, to increase. The number of middle-class households in China will nearly double, approaching 370 million households by the year 2026. The number of middle-class households in India is expected to nearly triple by 2026.
8 | P a g e
SLIDE 8 --- Dollar depreciating so far in 2018 versus customer currencies Stronger growth overseas means increased stability in other economies, which will make them more attractive as targets for investment. For countries that buy US agricultural goods, we see more stability in 2017 and 2018, with the dollar falling so far this year against those currencies The dollar gained in 2017 against the Japanese yen (hurt as Japan had sluggish growth), Mexican peso (hit by rising inflation and concerns
over NAFTA negotiations), and China yuan (suffering from capital controls and
slowing growth early in the year). The Canadian dollar appreciated as petroleum prices
rose. The Taiwan dollar and Korean won gained with good
investment and faster than expected trade growth.
9 | P a g e
SLIDE 9 --- Down versus most competitor currencies too For countries that compete with the US for export markets, we saw more stability in 2016, and appreciation against the U.S. dollar in 2017 and 2018 The exception being Argentina. Argentina’s peso still suffers from high inflation and an uncertain policy environment, The ruble owes its appreciation in 2017 and so far in 2018 to a bounce in oil prices. Brazil’s economy benefits from improved fiscal policy, lower inflation, and higher raw material prices. A more stable government has helped boost the real so far in 2018, but the October 2018 general election may introduce some variability this summer.
10 | P a g e
SLIDE 10 --- That should help maintain ag exports As mentioned, increasing agricultural trade remains a key component of future growth in the agricultural economy In general, improved global economic conditions and slight weakening of the U.S. dollar resulted in a $10.9 billion increase in fiscal year (FY) 2017 exports compared to FY 2016. FY 2018 exports are projected near FY 2017 levels, at $139.5 billion, and the agricultural trade surplus is forecast to narrow slightly to $21 billion from $21.3 billion
11 | P a g e
SLIDE 11 --- FTA’s account for large share FTA partners account for nearly 45% of U.S. agricultural exports --- including Canada and Mexico, but also including South Korea, Colombia and other Latin American countries --- have become increasingly important for U.S. agricultural exports U.S. agriculture exports continue to be dominated by China and our NAFTA partners Canada and Mexico. U.S. exports to China are projected at $21.6 billion, Please tune in tomorrow morning for U/Sec McKinney’s discussion on upcoming trade items.
12 | P a g e
SLIDE 12 --- U.S. crop forecast Let’s turn to the major factors influencing the market for crops in 2018 and look at prospective area and prices In tomorrow’s commodity outlook sessions, our analysts will offer a more detailed look at USDA’s projected balance sheets for the 2018/19 marketing year, providing an update to earlier estimates in the 10-year baseline projections.
13 | P a g e
SLIDE 13 --- Global ending stocks First production has outpaced consumption for many grains and oilseeds over the last four years, recovering in part from the large drawdown in stocks following the 2012 U.S. drought Global rice and wheat stocks relative to use are approaching highs not seen since the early 2000’s Soybeans and corn stocks to use are also up relative to the lows seen 8 years ago.
14 | P a g e
SLIDE 14 --- Some prices expected to edge up The combination of rising stocks and continuing large global production have limited upside potential for prices; however, we do expect increase in demand relative to production in the upcoming year. Wheat prices are expected to rise modestly to $4.70 per bushel, up 2 percent from last year, in part as last year’s drought in the Northern Plains and current dry conditions across much of the winter wheat areas have supported prices despite large U.S. and global stocks. Soybean prices, forecast at $9.25 a bushel, are expected to be down fractionally next year, as large U.S. stocks hold prices in check. Cotton prices rose slightly in 2017/18 even as producers in the U.S. and around the world expanded area. Cotton prices in 2018/19 are projected at 63 cents per pound, a decline of 9 percent. The all-rice price is forecast to fall less than 5 percent to $11.90 per hundredweight, down from last year’s price which had been supported by sharply lower U.S. area. Driven by record yields in 2017, corn prices ended the year down at $3.30. Looking forward, we expect a small rebound in prices and a return to trend yields.
15 | P a g e
SLIDE 15 --- Corn prices rise Of course, we know there are multiple factors that could affect those prices over the coming years. Longer-term projections used for budgetary purposes often indicate relatively flat prices over the next 10 years
16 | P a g e
SLIDE 16 --- Prices +/- will depend However, we know that there can be shocks, from drought to global GDP changes, which influence where those prices will end up in any given year. For example, if we look more closely at our corn price estimates for the year 2020, we see a potential lower bound price of $2.02 per bushel and an upper bound price of $5.56 per bushel Low corn price for example, coincides with higher ending corn stocks, along with yield outcomes far beyond what we currently have for the expected national average. Higher price outcomes, conversely, reflect scenarios with low yields, low ending stocks, and high prices for feed substitutes, such as soymeal.
17 | P a g e
SLIDE 17 --- …and by other countries farm We also know that those prices, and ending stocks, will be influenced by our ability to trade. For example, China’s corn support and TRQ administration policies led to higher import demand for other feeds, such as DDGS and sorghum. In late 2014 China began temporarily rejecting US
DDGS due to presence of unapproved biotech Late 2015, China began probing US DDGs for
subsidies Jan 2017, China imposed AD/CVDs on U.S. DDGs
That had the effect of increasing the prices of those feeds higher than the price of corn when China’s demand was strong (and opposite when China imposed trade restrictions).
18 | P a g e
SLIDE 18 --- … but farmers plant Producers of course will base their planting decisions not on prices alone, but on relative prices When producers look to spring planting, we have seen the soybean-to-corn price ratio roughly where it was at this point in 2017 running at nearly 2.6, a year in which was saw more than 6 million additional acres of soybeans planted. However, with acreage of corn and soybeans nearly equal in 2017, is there room for further soybean expansion at the expense of corn? Or do agronomic and rotational issues limit the ability for soybean area to overtake corn by a significant degree?
19 | P a g e
SLIDE 19 --- Corn and bean area at parity, With commodity prices flat to rising slightly from last year we expect acreage to respond similarly. For corn and soybeans, current price expectations and rotational constraints again push the combined area to 180 million acres, evenly split between the two crops. We expect that the continued expansion of trade in soybeans will continue to put pressure on corn but more likely other crop area in the future. Our latest long-term baseline suggests soybean area will match or exceed corn area for much of the next decade supported by import demand from China. Wheat area is expected to reverse a 4-year trend and expand. While winter wheat seedings for 2018 were essentially flat, current price strength in spring wheat suggests we could get some expanded area in the Northern Plains. Cotton area is expected to expand by over 5 percent, as the last two years have seen favorable prices for cotton. Rice area is also expected to expand, up from 2017. In summary, with commodity prices flat to rising and input prices, from nitrogen to land rents flat to falling, we expect a slight expansion in the aggregate 8-crop area.

20 | P a g e
SLIDE 20 --- Who’s buying now? I think it is worth noting that the dominance of China in the soybean market will not only continue but grow in importance over the next decade. While we see more subtle changes for coarse grains and wheat, and a much more diversified set of destinations, for soybeans the story continues to hinge on China. China now accounts for 65 percent of the total trade in soybeans. North Africa and Middle East currently account for 20 to 30 percent of the trade in coarse grains and wheat.
21 | P a g e
SLIDE 21 --- Who will be buying And those trends are likely to continue with continued growth in soybean sales to China and grain sales to Africa and the Middle East
22 | P a g e
SLIDE 22 --- U.S. export share of global trade flattens Trade will remain a critical factor, as the decline in U.S. trade share of the last several years is expected to slow. With our aggregate farm area remains largely constrained, production gains will be driven by increasing yields which can vary year to year. With rapid expansion of domestic ethanol production, our trade share in several commodities has fallen. For soybeans, continued area growth in South America will erode our trade share and will be affected as well by the need to supply growing domestic crush demand.
23 | P a g e
SLIDE 23 --- Outlook for Livestock and Dairy The outlook for livestock and dairy is for continued record total meat and dairy production.
24 | P a g e
SLIDE 24 --- Meat and milk production to be record high With low and stable feed costs over the past few years and projected going forward, the outlook for livestock and dairy is for another year of record total meat and dairy production We project that total meat and poultry production will hit nearly 104 billion pounds in 2018, as production of beef, pork, and broilers all increase. Milk production is also projected to be at a record 218.7 billion pounds in 2018 with a modest herd expansion and stronger growth in milk per cow. The rate of growth in pork production in the near term will largely reflect demand for slaughter hogs due to increases in slaughter capacity. Broiler production is also expected to rise, though less rapidly than pork or beef, as solid returns maintain the steady growth of the sector.
25 | P a g e
SLIDE 25 --- Beef production is projected to rise Beef production is expected to grow rapidly in the near term, then slow, reflecting a long run balanced growth between supplies and demand Current projections for domestic beef supply exceed those of previous years. The near term rapid growth reflects the rebuilding of herds after an extended period of drought covering portions of important cow-calf regions
26 | P a g e
SLIDE 26 --- U.S. Drought Monitor However, while supplies of cattle have increased recently, There has also been a worsening of pasture and forage conditions across the plains which remain a concern affecting both the timing of cattle placement in feedlots and potentially breeding decisions in the coming months. Looking at the drought monitor comparing this year to 2013, we see that conditions are still a ways off from the extremes seen 4 years ago.
27 | P a g e
SLIDE 27 --- Livestock, poultry, and milk prices That expansion in meat production for 2018 is expected to depress prices continuing the decline from the highs we saw in 2014. Fed steer prices are forecast to fall to $119.25 per cwt, down about 2 percent as domestic demand limits losses on larger supplies. Hog prices are expected to decline to $48 per hundredweight, down nearly 5 percent from last year, Milk prices continue to come under pressure with the all-milk price expected to fall 9 percent this year, driven lower by product prices. All major product categories are expected lower year over year. Butter and cheese prices show some decline while prices for more export oriented products like NDM and whey will reflect continued large international supplies. With relatively flat feed prices and a decline in milk prices, margins are under greater pressure this year.
28 | P a g e
SLIDE 28 --- Export volumes rise over time Foreign markets have become increasingly important for beef, pork, and poultry and are expected to grow over time. Those markets will also be important in 2018 to limit price declines on expanding meat supplies. With pork exports rising by 18% over next 10 years and poultry rising by 14% For dairy products, long-term growth in milk production will reflect flattening of the herd size along with continued gains in milk per cow. Exports are expected to continue to expand this year and into the future. With exports on a fat basis rising by 13% and skim-solids basis by 25% over the next 10 years.
29 | P a g e
SLIDE 29 --- Status of the Farm Economy Turning to the farm economy, we expect Farm incomes to remain flat, but the horizon may hold some reasons for optimism. As mentioned by the Secretary, regulatory reform, tax reform, the potential for improved trade agreements, and investments in rural infrastructure will improve the outlook for farm operations. Similarly, we expect to see details of what a new farm bill might include later this year. Those are not reflected in this snapshot of the current farm economy
30 | P a g e
SLIDE 30 --- Working capital falling While farm income is expected to remain flat, the debt-to-asset ratio for U.S. farms continues to be relatively low, held down by steadily increasing asset values which reflect, in part, continuing firm land values Though the debt-to-asset ratio has been slowly rising, from 11 percent in 2012 to a forecast 13 percent in 2018, the current debt-to-asset ratio remains far below the peak of 22 percent in 1985. Without a dramatic increase in debt or loss in farmland value, the debt-to-asset ratio is unlikely to near that level. The more dramatic story is the decline in working capital, which has fallen by more than 65% since 2012.
31 | P a g e
SLIDE 31 --- Debt-to-asset ratios vary by sector And while the overall national debt-to-asset ratio remains low, when we disaggregate that by commodity specialization, we can see that some producers are more vulnerable to continued low commodity prices. About 1-in-3 poultry farm businesses and 1-in-5 cotton farm businesses are highly or very highly leveraged, indicating a debt-to-asset ratio greater than 40%. For these farms, low commodity prices pose a greater threat.
32 | P a g e
SLIDE 32 --- Borrowing continuing to rise While rising debt-to-asset levels are a growing concern for some producers, let me return to the falling level of working capital Falling working capital indicates that producer resources are being stretched, leading to greater dependence on borrowing. Producers have reduced input costs where possible in recent years and increased income by selling inventory, but expectations are for increases in costs, as interest rates, fuel costs, and wages rise. We can see that current levels of real debt are approaching the record levels from the early 1980s, more than $400 billion, with real estate debt in 2018 expected to exceed the record $218 billion set in 1981.
33 | P a g e
SLIDE 33 --- Debt-to-assets remain low, but While low interest rates have limited the burden of that debt for producers, interest payments as a share of net farm income have been increasing more steeply than the debt-to-asset ratio Still, at the current 26 percent of net farm income, interest payments remain well below the 60 percent share seen in the mid-1980s. Moreover, we are seeing significant restructuring of loans. Commercial banks are also reporting strong loan demand, but loan maturity periods are being extended, reflecting increasing constraints on producer ability to repay.
34 | P a g e
SLIDE 34 --- The share of non-performing loans is rising If we look at the share of non-performing loans, those on which payments are no longer being made, we see another troubling trend starting in 2015 While still low, more borrowers are finding it hard to maintain payments on both operating and real-estate loans shown here as upticks on the red and blue lines.
35 | P a g e
SLIDE 35 --- Farm bankruptcy remains low Despite the increase in debt levels and the rise in non-performing loans, we still do not see anything like the farm bankruptcies associated with the 1980s crisis In 1987, 23 out of every 10,000 farms declared bankruptcy. Although the bankruptcy rate has risen in the last couple years to 2.4 bankruptcies per every 10,000 farms, Bankruptcies were over 10 times more likely 30 years ago and remain below the most recent peak of the last decade.
36 | P a g e
SLIDE 36 --- Farm programs and changes Farm programs working with mixed results. As mentioned earlier we expect Congress to start proposing new farm bill legislation. They will be looking at how the 2014 farm programs have operated and at current economic conditions, as well as at limits required to balance budgets. The farm programs put in place in 2014 to assist farmers facing difficult economic conditions have been providing assistance to producers as farm incomes have declined, but the changes made in some programs have meant that not all producers have experienced the same level of support, particularly cotton and dairy.
37 | P a g e
SLIDE 37 --- Crop insurance increasing in importance Taking a step back, the role of different types of policies has evolved over time, We’ve seen a movement from programs that controlled how much and what producers could plant to an array of programs leaving producers the chance to make decisions based on market signals and their own risk management preferences As part of that shift, crop insurance has become increasingly important, Today, average annual premium subsidies over the last 10 years have been $5.7 billion, contributing more than a third of the average $15 billion per year in commodity, crop insurance, and conservation assistance.
38 | P a g e
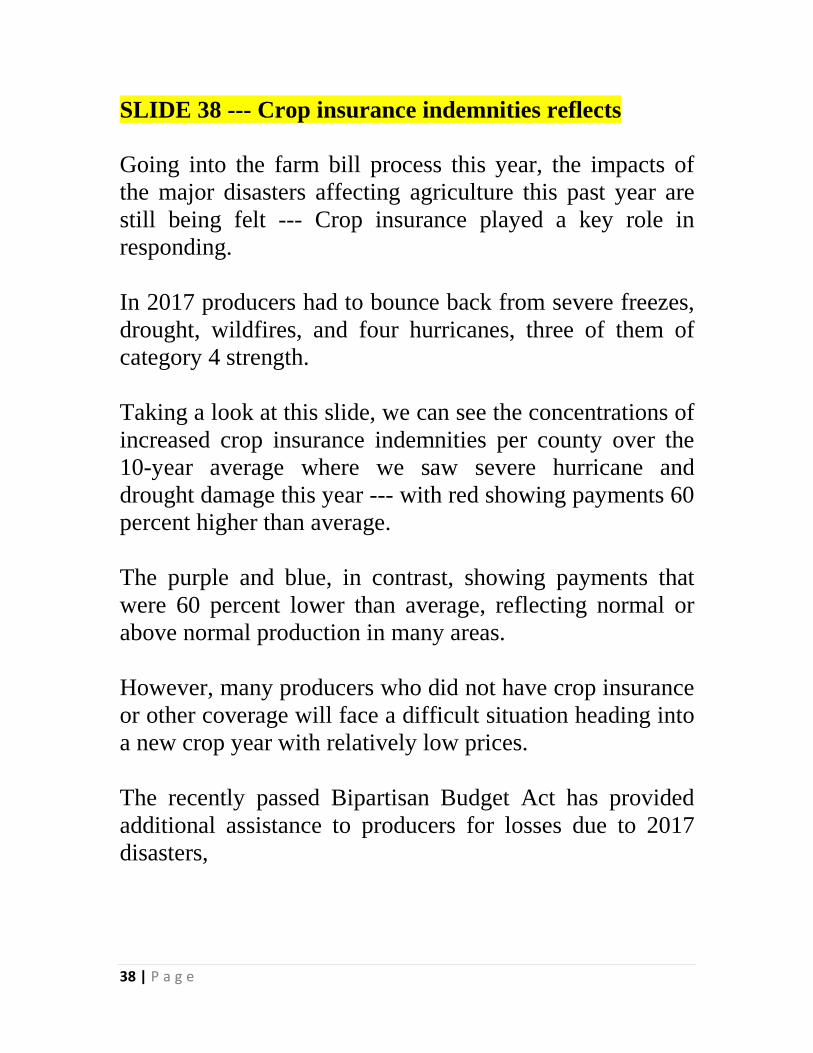
SLIDE 38 --- Crop insurance indemnities reflects Going into the farm bill process this year, the impacts of the major disasters affecting agriculture this past year are still being felt --- Crop insurance played a key role in responding. In 2017 producers had to bounce back from severe freezes, drought, wildfires, and four hurricanes, three of them of category 4 strength. Taking a look at this slide, we can see the concentrations of increased crop insurance indemnities per county over the 10-year average where we saw severe hurricane and drought damage this year --- with red showing payments 60 percent higher than average. The purple and blue, in contrast, showing payments that were 60 percent lower than average, reflecting normal or above normal production in many areas. However, many producers who did not have crop insurance or other coverage will face a difficult situation heading into a new crop year with relatively low prices. The recently passed Bipartisan Budget Act has provided additional assistance to producers for losses due to 2017 disasters,
39 | P a g e
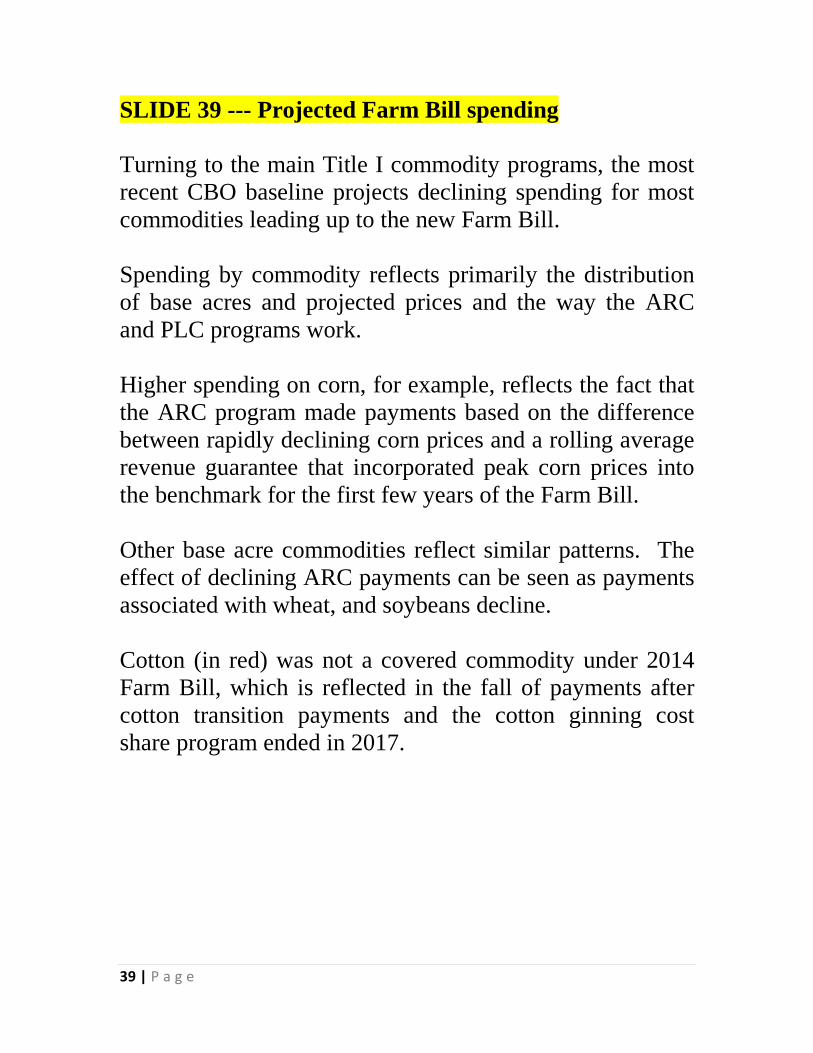
SLIDE 39 --- Projected Farm Bill spending Turning to the main Title I commodity programs, the most recent CBO baseline projects declining spending for most commodities leading up to the new Farm Bill. Spending by commodity reflects primarily the distribution of base acres and projected prices and the way the ARC and PLC programs work. Higher spending on corn, for example, reflects the fact that the ARC program made payments based on the difference between rapidly declining corn prices and a rolling average revenue guarantee that incorporated peak corn prices into the benchmark for the first few years of the Farm Bill. Other base acre commodities reflect similar patterns. The effect of declining ARC payments can be seen as payments associated with wheat, and soybeans decline. Cotton (in red) was not a covered commodity under 2014 Farm Bill, which is reflected in the fall of payments after cotton transition payments and the cotton ginning cost share program ended in 2017.
40 | P a g e
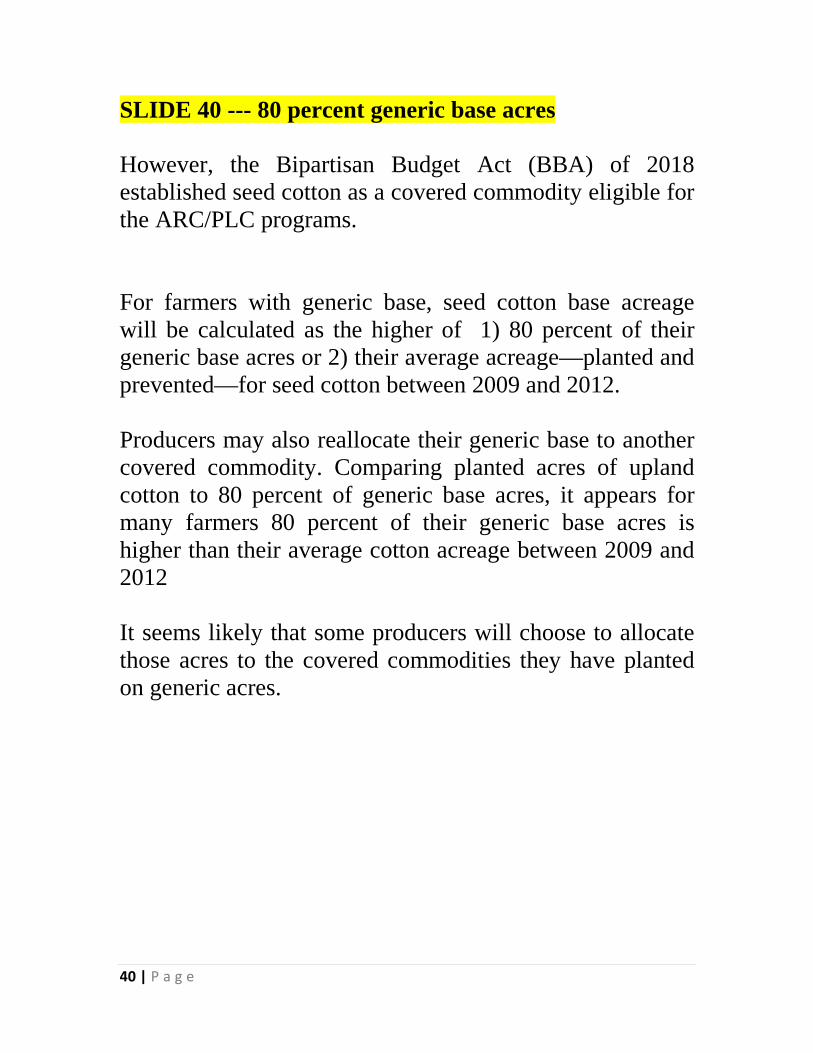
SLIDE 40 --- 80 percent generic base acres However, the Bipartisan Budget Act (BBA) of 2018 established seed cotton as a covered commodity eligible for the ARC/PLC programs. For farmers with generic base, seed cotton base acreage will be calculated as the higher of 1) 80 percent of their generic base acres or 2) their average acreage—planted and prevented—for seed cotton between 2009 and 2012. Producers may also reallocate their generic base to another covered commodity. Comparing planted acres of upland cotton to 80 percent of generic base acres, it appears for many farmers 80 percent of their generic base acres is higher than their average cotton acreage between 2009 and 2012 It seems likely that some producers will choose to allocate those acres to the covered commodities they have planted on generic acres.
41 | P a g e
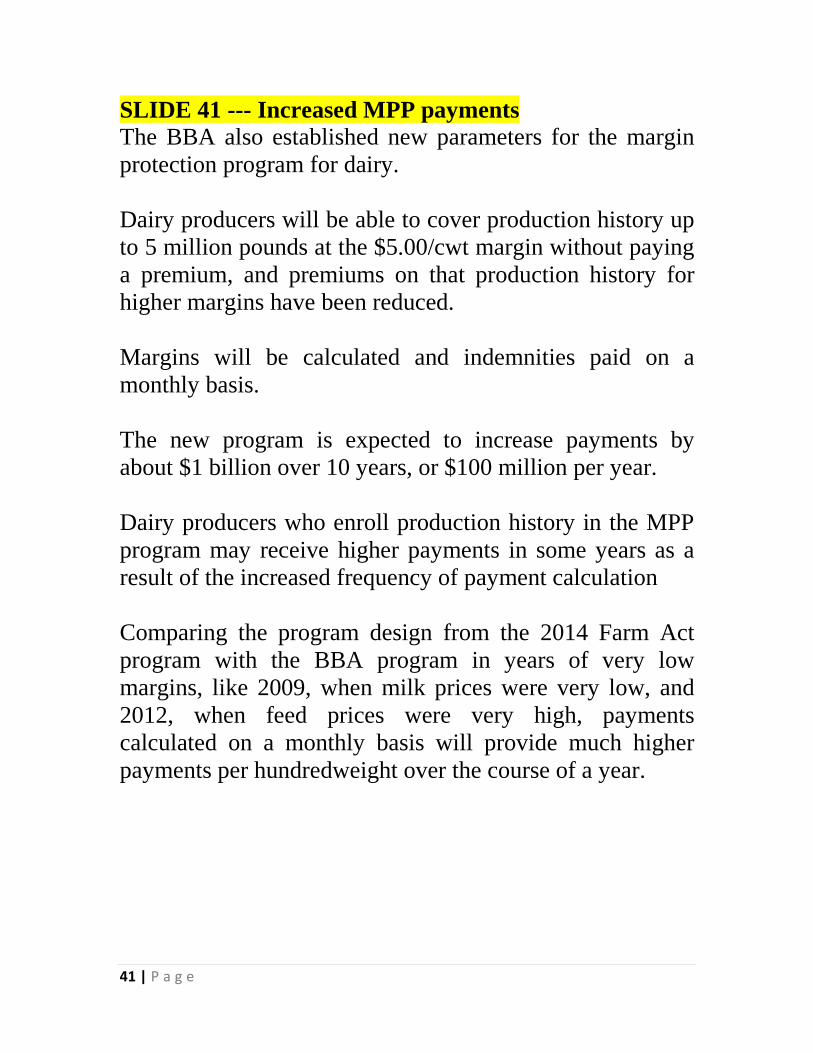
SLIDE 41 --- Increased MPP payments The BBA also established new parameters for the margin protection program for dairy. Dairy producers will be able to cover production history up to 5 million pounds at the $5.00/cwt margin without paying a premium, and premiums on that production history for higher margins have been reduced. Margins will be calculated and indemnities paid on a monthly basis. The new program is expected to increase payments by about $1 billion over 10 years, or $100 million per year. Dairy producers who enroll production history in the MPP program may receive higher payments in some years as a result of the increased frequency of payment calculation Comparing the program design from the 2014 Farm Act program with the BBA program in years of very low margins, like 2009, when milk prices were very low, and 2012, when feed prices were very high, payments calculated on a monthly basis will provide much higher payments per hundredweight over the course of a year.
42 | P a g e
SLIDE 42 --- Conclusions There are a lot of factors that could shift farm income higher or lower than our current forecast. Prices may be higher due to growing global economic growth driving demand for agricultural commodities. Farm programs as adjusted by the Bipartisan Budget Act or the upcoming farm bill may be better designed to meet producers’ needs under stressful conditions. New Administration initiatives for tax reform, regulatory reform, and infrastructure are all expected to boost economic activity in rural America. However, we also expect agricultural productivity to continue to increase, which should keep supply ahead of demand on average going forward. South America continues to expand production of oilseeds and corn. Russia and Ukraine have been rapidly expanding production of wheat, corn, and other grains. Much of that increase in production is being exported, keeping prices competitive for most commodities. As a result, long-run expectations are for net farm income in the US to fall in real terms. FORWARD TEXT
43 | P a g e
Continued Slide 42 We continue to look to trade as a critical outlet for growing U.S. production that can sustain farm incomes boosted by a falling dollar an improved global economic growth. We forecast wheat and corn prices to be higher next year, and soybeans to remain steady, With continuing strength in export demand for soybeans, however, we expect soybean acreage to reach parity with corn in 2018. Meat and milk production are forecast to reach record highs of 104 and 219 million pounds, and we expect export volumes to continue to increase for both. The agricultural sector still faces economic stress, debt is increasing as working capital continues to fall.
44 | P a g e
Slide 43 --- Thank You Farm programs have offered support to many producers weathering these economic challenges, as well as the natural disasters that hit farm country this year. The crop insurance program has proved its value once again by providing timely indemnity payments following disaster losses, and the Bipartisan Budget Act will extend farm safety net assistance to cotton and dairy producers and offer additional assistance to producers coping with disaster losses. That underlines my last slide: 2017 U.S. Census of Agriculture is underway, we have received 28 percent of responses via Internet and 69 percent via Mail. It provides critical information on the U.S. farm sector for all of us and helps craft more effective and efficient farm programs. Thank you again.