technical report crwr 263 characterization of …
TRANSCRIPT
Technical Report
CRWR 263
CHARACTERIZATION OF HIGHWAY RUNOFF IN THEAUSTIN, TEXAS AREA
by
MICHAEL E. BARRETT, M.S.,Project Manager
and
JOSEPH F. MALINA, JR., P.E.Principal Investigator
and
RANDALL J. CHARBENEAU, P.E.GEORGE H. WARD, Ph.D.Co-Principal Investigators
October 1995
CENTER FOR RESEARCH IN WATER RESOURCESBureau of Engineering Research •• The University of Texas at Austin
J.J. Pickle Research Campus •• Austin, Texas 78712

ii
ACKNOWLEDGMENTS
This research was funded by the Texas Department of Transportation under grant
number 7-1943, "Water Quantity and Quality Impacts Assessments of Highway
Construction in Austin, Texas."
iii
TABLE OF CONTENTS
ACKNOWLEDGMENTS......................................................................................... ii
TABLE OF CONTENTS .......................................................................................... iii
LIST OF FIGURES .................................................................................................. iv
LIST OF TABLES .................................................................................................... v
1. INTRODUCTION ............................................................................................... 1
2. MATERIALS AND METHODS ........................................................................ 2
2.1 Site Descriptions........................................................................................... 22.1.1 MoPac at West 35th Street................................................................ 22.1.2 MoPac at Convict Hill Road .............................................................. 32.1.3 MoPac at Walnut Creek .................................................................... 3
2.2 Climatic Conditions....................................................................................... 4
2.3 Water Quantity Measurements ...................................................................... 52.3.1 Flow Measurement at West 35th Street ............................................. 62.3.2 Flow Measurement at Convict Hill Road ........................................... 72.3.3 Flow Measurement at Walnut Creek.................................................. 8
2.4 Water Quality Sampling ................................................................................ 9
2.5 Chemical Analyses ........................................................................................ 10
3. RESULTS ............................................................................................................ 12
3.1 Water Quality of Highway Runoff ................................................................. 12
3.2 Estimate of Annual Pollutant Loads .............................................................. 14
3.3 Effect of Drainage System Type.................................................................... 16
3.4 Pollutant Washoff Patterns............................................................................ 17
4. SUMMARY AND CONCLUSIONS................................................................... 20
BIBLIOGRAPHY ..................................................................................................... 21
APPENDIX................................................................................................................ 24
iv
LIST OF FIGURES
Figure Title Page
2.1 Photograph of MoPac at West 35th Street .................................................... 2
2.2 Photograph of MoPac at Convict Hill Road................................................... 3
2.3 Photograph of MoPac at Walnut Creek ......................................................... 4
2.4 Runoff Coefficient for MoPac and West 35th Street ...................................... 6
2.5 Runoff Coefficient for MoPac at Convict Hill Road....................................... 7
2.6 Runoff Coefficient for MoPac and Walnut Creek........................................... 8
3.1 Washoff of TSS at 35th Street, 10/29/93....................................................... 18
3.3 TSS Washoff Pattern at Convict Hill Road Site ............................................. 18

v
LIST OF TABLES
Table Title Page
2.1 Summary of Characteristics of Three Highway Runoff Sampling Sites........... 5
2.2 Runoff Coefficients ....................................................................................... 9
2.3 Detection Limits at CRWR Laboratory ......................................................... 11
3.1 Constituents in Highway Runoff.................................................................... 12
3.2 Comparison of High Traffic Site Concentrations ........................................... 13
3.3 Comparison of Low Traffic Site Concentrations............................................ 14
3.4 Estimated Annual Pollutant Loadings ............................................................ 15
3.5 Removal Efficiency of a Grassy Swale........................................................... 16
1
1. INTRODUCTION
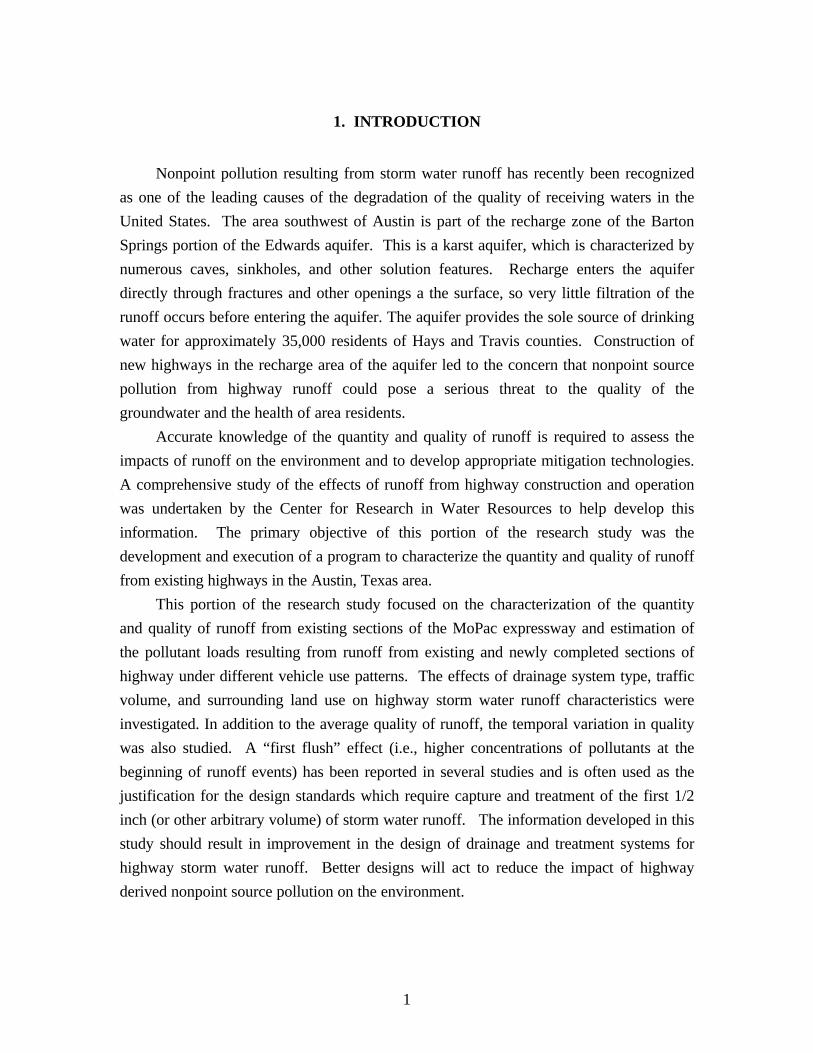
Nonpoint pollution resulting from storm water runoff has recently been recognized
as one of the leading causes of the degradation of the quality of receiving waters in the
United States. The area southwest of Austin is part of the recharge zone of the Barton
Springs portion of the Edwards aquifer. This is a karst aquifer, which is characterized by
numerous caves, sinkholes, and other solution features. Recharge enters the aquifer
directly through fractures and other openings a the surface, so very little filtration of the
runoff occurs before entering the aquifer. The aquifer provides the sole source of drinking
water for approximately 35,000 residents of Hays and Travis counties. Construction of
new highways in the recharge area of the aquifer led to the concern that nonpoint source
pollution from highway runoff could pose a serious threat to the quality of the
groundwater and the health of area residents.
Accurate knowledge of the quantity and quality of runoff is required to assess the
impacts of runoff on the environment and to develop appropriate mitigation technologies.
A comprehensive study of the effects of runoff from highway construction and operation
was undertaken by the Center for Research in Water Resources to help develop this
information. The primary objective of this portion of the research study was the
development and execution of a program to characterize the quantity and quality of runoff
from existing highways in the Austin, Texas area.
This portion of the research study focused on the characterization of the quantity
and quality of runoff from existing sections of the MoPac expressway and estimation of
the pollutant loads resulting from runoff from existing and newly completed sections of
highway under different vehicle use patterns. The effects of drainage system type, traffic
volume, and surrounding land use on highway storm water runoff characteristics were
investigated. In addition to the average quality of runoff, the temporal variation in quality
was also studied. A “first flush” effect (i.e., higher concentrations of pollutants at the
beginning of runoff events) has been reported in several studies and is often used as the
justification for the design standards which require capture and treatment of the first 1/2
inch (or other arbitrary volume) of storm water runoff. The information developed in this
study should result in improvement in the design of drainage and treatment systems for
highway storm water runoff. Better designs will act to reduce the impact of highway
derived nonpoint source pollution on the environment.

2
2. MATERIALS AND METHODS
2.1 Site Descriptions
Three sites along the MoPac Expressway in the Austin, Texas area were selected
for monitoring runoff from highways. The locations were identified as MoPac at West
35th Street, MoPac at Convict Hill Road and MoPac at Walnut Creek. The sites differed
in daily traffic flow, surrounding land use, and drainage area. Accessibility for runoff
sampling also was a consideration in site selection. Runoff samples were collected during
the time period of September 1993 though May 1995. The physical characteristics of the
sites are discussed below.
2.1.1 MoPac at West 35th Street
MoPac at West 35th Street is a high traffic site located in central Austin (Figure
2.1). The land use of the area is mixed residential and commercial. Samples were
collected from a storm drain inlet located along the gutter of a curbed section of the three
southbound lanes. The catchment covers an area of 5,341 m2 which is 100% asphalt.
The average daily volume of traffic at this site was approximately 60,000 vehicles per
day, ranging from a maximum of 6,000 vehicles per hour to a minimum of about 100
vehicles per hour. Induction coils installed in each lane of traffic recorded traffic counts
during each rainfall event.
Figure 2.1 Photograph of MoPac at West 35th Street
3
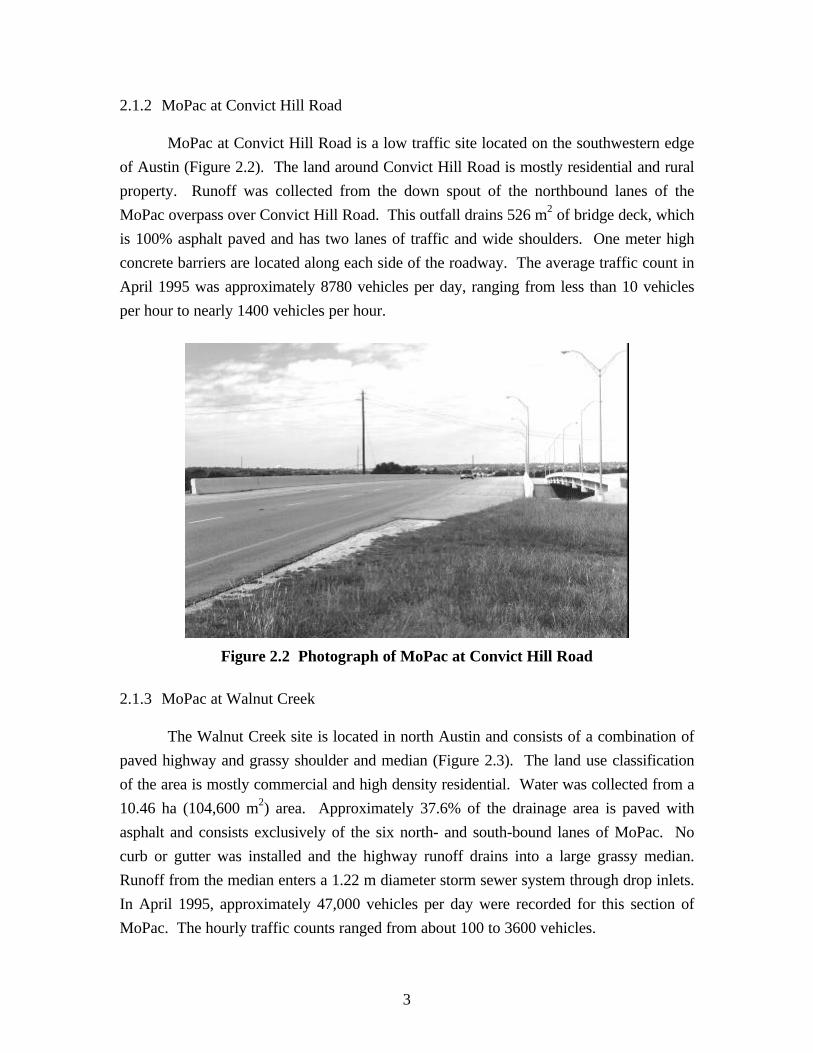
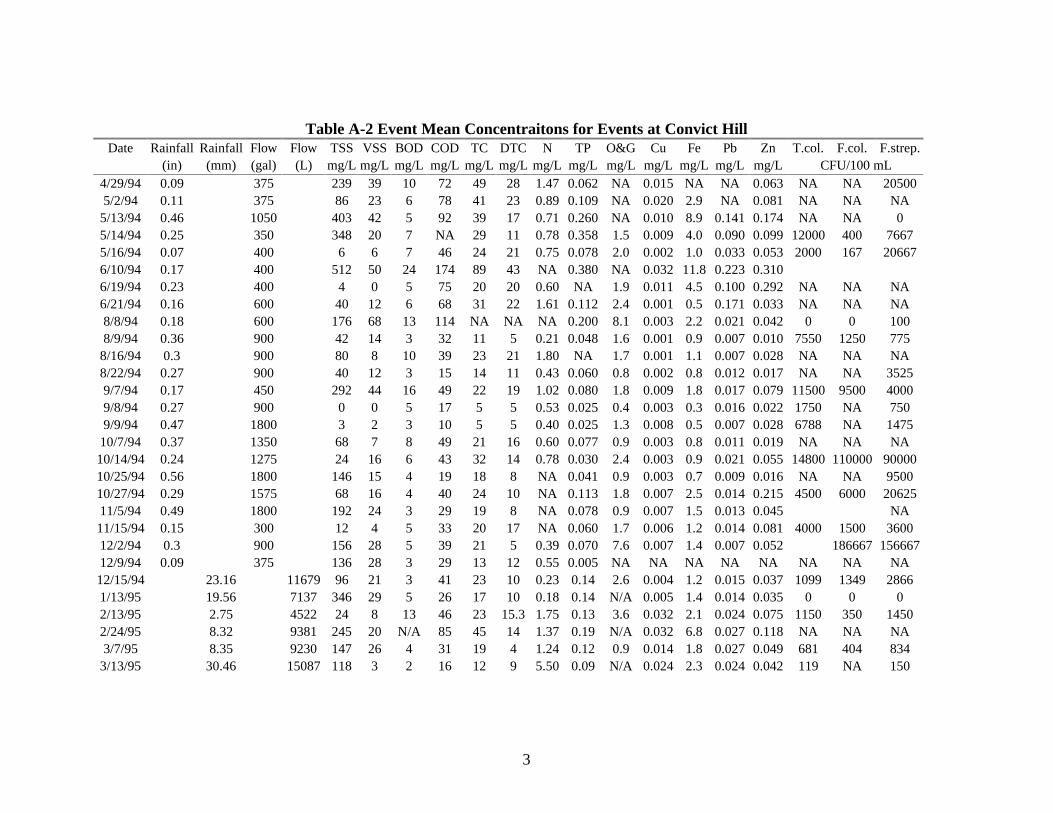
2.1.2 MoPac at Convict Hill Road
MoPac at Convict Hill Road is a low traffic site located on the southwestern edge
of Austin (Figure 2.2). The land around Convict Hill Road is mostly residential and rural
property. Runoff was collected from the down spout of the northbound lanes of the
MoPac overpass over Convict Hill Road. This outfall drains 526 m2 of bridge deck, which
is 100% asphalt paved and has two lanes of traffic and wide shoulders. One meter high
concrete barriers are located along each side of the roadway. The average traffic count in
April 1995 was approximately 8780 vehicles per day, ranging from less than 10 vehicles
per hour to nearly 1400 vehicles per hour.
Figure 2.2 Photograph of MoPac at Convict Hill Road
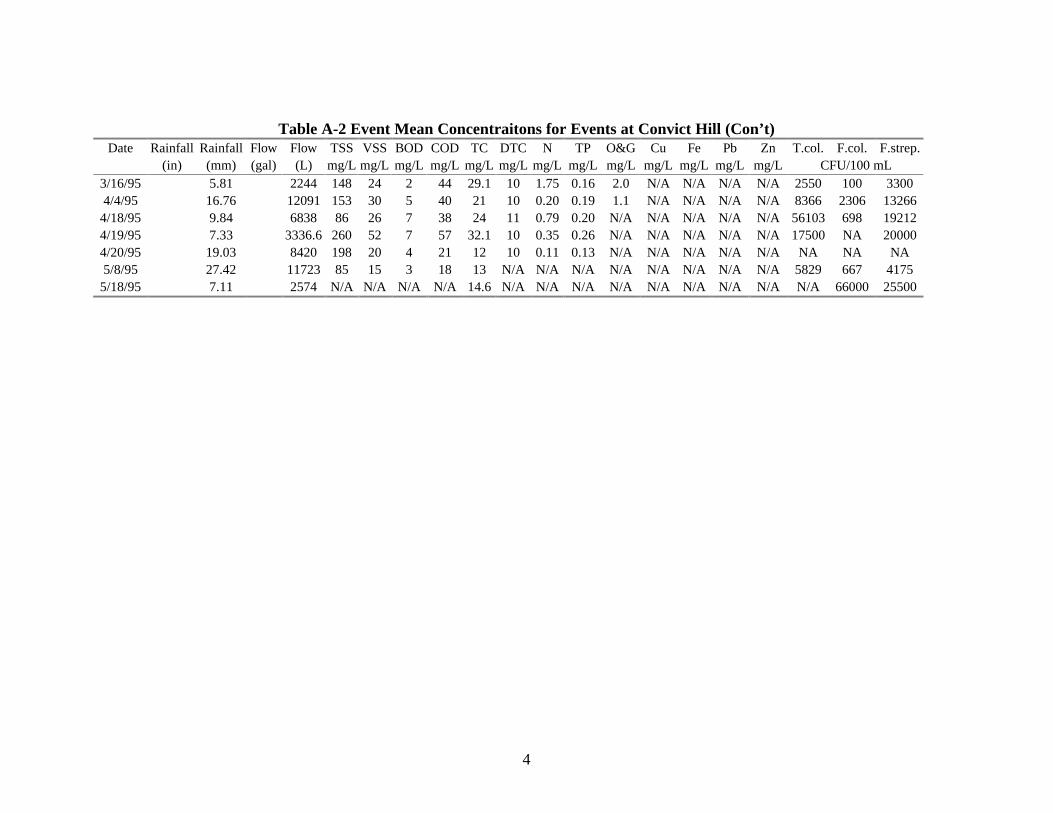
2.1.3 MoPac at Walnut Creek
The Walnut Creek site is located in north Austin and consists of a combination of
paved highway and grassy shoulder and median (Figure 2.3). The land use classification
of the area is mostly commercial and high density residential. Water was collected from a
10.46 ha (104,600 m2) area. Approximately 37.6% of the drainage area is paved with
asphalt and consists exclusively of the six north- and south-bound lanes of MoPac. No
curb or gutter was installed and the highway runoff drains into a large grassy median.
Runoff from the median enters a 1.22 m diameter storm sewer system through drop inlets.
In April 1995, approximately 47,000 vehicles per day were recorded for this section of
MoPac. The hourly traffic counts ranged from about 100 to 3600 vehicles.

4
Figure 2.3 Photograph of MoPac at Walnut Creek
A summary of the physical characteristics of the three sites is presented in Table
2.1. Drainage area and average daily traffic also are included in this table. The traffic
count at the low traffic volume site (Convict Hill Road) was only 20 percent of the traffic
count at the site which had the highest traffic volume (35th Street). The size of the
catchment at Convict Hill Road was only 10 percent of the highway surface drained at
35th Street. The traffic mix, and prevailing weather conditions were similar at all sites.
2.2 Climatic Conditions
The National Weather Service data indicate that annual rainfall in Austin, Texas is
82.6 cm; however, during the 12 month period July 1993 - July 1994, the total rainfall was
only 44.4 cm. The National Weather Service data indicate that average storm event is 1.4
cm at storm intensities of about 0.18 cm/hr and storm duration of 11.8 hrs. However,
storm characteristics vary greatly. Coefficients of variations associated with the data
reported for average rainfalls were 1.63 for total volume of rainfall, 1.47 for rainfall
intensity, and 1.9 for storm duration.
The National Weather Service data indicate that the wettest seasons occurred
during the Spring and Fall. Dry conditions prevailed in the summer months. The rainfall
intensity of events that occurred during the late fall and winter months was usually light

5
and occurred over long duration (several hours to over a day). Rainfall events that
occurred during the early fall and spring months ranged from drizzle to heavy down pours.
Midsummer rainfall events are rare in Austin and tend to be heavy downpours resulting
from electrical storms. Dry conditions were prevalent in Austin from June to August of
1994 with less than 0.25 mm of rain at any of the three sites for a period of 40 days.
Table 2.1 Summary of Characteristics of Three Highway Runoff Sampling Sites
Convict Hill Road Walnut Creek West 35th Street
Drainage area 526 m2 104,600 m2 5,341 m2
Pavement 100% asphalt 37% asphalt 100 % asphalt
Lanes of Traffic 2 (3.66 m) 6 (3.66 m each) 3 (3.66 m)
Shoulders 2.44 m and 6.71 m 2.4 m 2.4 m and 3.3 m
Curb/Guardrail 1 m retainer none 15 cm curb
Average Daily Traffic 8,780 47,240 58,150
Speed Limit 88 km/hr 88 km/hr 88 km/hr
Land Use rural/residential commercial/ highdensity residential
commercial/residential
2.3 Water Quantity Measurements
Automatic flow measuring and sampling systems were installed and operated at
three (3) sites: MoPac at West 35th Street, MoPac at Convict Hill Road, and MoPac at
Walnut Creek. The monitoring system installed at MoPac at 35th Street was in operation
from October 1993 through July 1995, and the units at the other two sites were in
operation April 1994 through July 1995. Water levels at each site were measured using
bubble flow meters (ISCO 3230). The water levels were converted into a flow rate based
on rating curves developed for each site. The information recorded at the automatic
sampling station included rainfall volume, runoff flow rate, and the sampling times. These
data were downloaded from the flow meters to a laptop computer, and were converted to
text format and exported to Microsoft Excel.
Each sampling station included a 12 volt battery to power the flow meter, sampler,
and recorder. A solar panel (Solarex Megamodule MSX60) recharged the battery. The

6
flow meter, sampler, and battery were housed in a large steel enclosure. A rain gauge
(ISCO 674) also was placed at each site to measure rainfall. Because of the relatively
small size of each of the contributing watersheds, a single gauge at each site was
determined to be sufficient for accurately measuring rainfall volume and intensity.
2.3.1 Flow Measurement at West 35th Street
Water level was read from a bubbler tube located at the bottom of the curbing
system before the water entered the catchment inlet. A rating curve was developed for
this location by discharging water from a fire hydrant approximately 100 meters upstream
of the level measuring location. The water was discharged at metered flow rates to
construct the rating curve. The water elevation recorded at different flow rates by the
flow meter allowed the development of an accurate relationship between water level and
flow rate. The flow meter was active at this site for more than one year. Monitoring flow
rates of numerous storms produced an average runoff coefficient of about 0.90 which is
consistent with values commonly reported in the literature for 100% impervious surfaces.
The runoff coefficient calculations are shown in Figure 2.4.
y = 0.8464x - 958.49
R2 = 0.9799
0
20000
40000
60000
80000
100000
120000
0 20000 40000 60000 80000 100000 120000 140000
Rainfall Volume, liters
Ru
no
ff V
olu
me,
lite
rs
Figure 2.4 Runoff Coefficient for MoPac and West 35th Street
7
2.3.2 Flow Measurement at Convict Hill Road
Runoff discharge at the Convict Hill Road site was measured using a weir installed
on a collection box at the base of a 6-inch diameter down spout. The weir was a
compound weir, consisting of three sections: a bottom section which was 20.32 cm high
with 30 degree throat, a middle portion which was 4.83 cm high with a 90 degree cross
section and a top section which was a rectangular weir which had 5.33 cm sides. Depth of
water in the collection box was measured and the discharge was calculated from a rating
curve for each section.
Q = 137.7H2. 5 (30 degree)
Q = 372.9H2. 5 (90 degree)
where: Q = flow rate (L/s), andH = head (m).
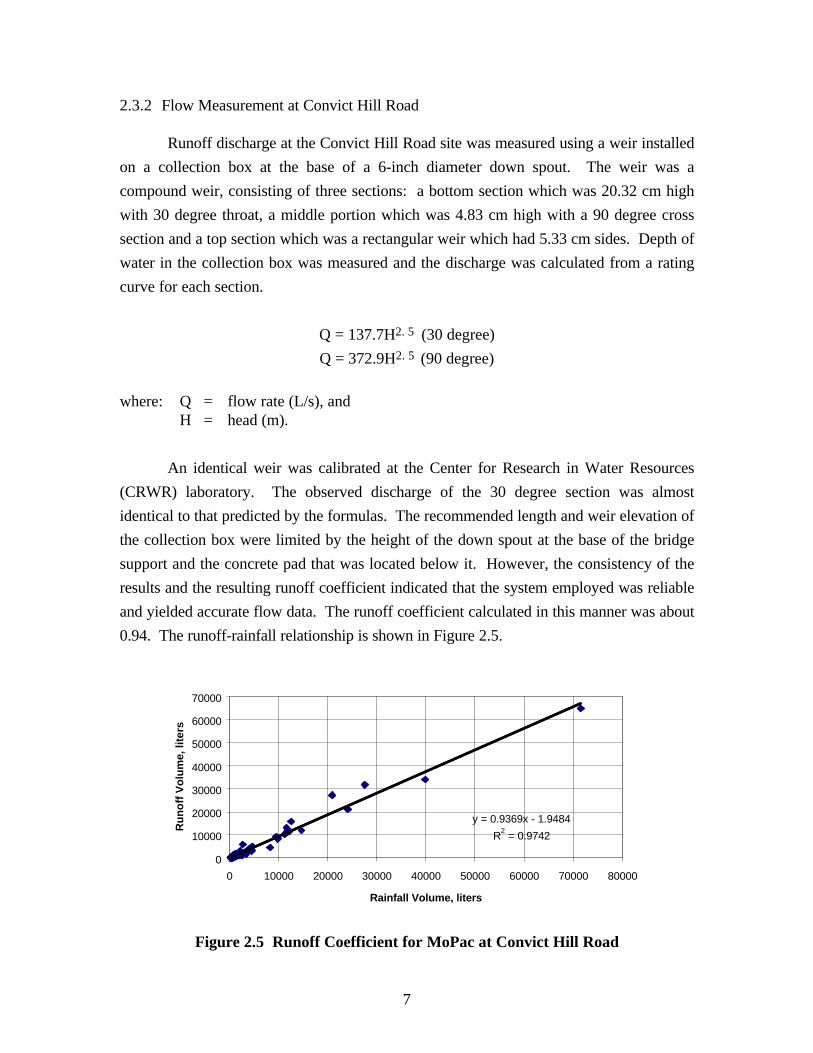
An identical weir was calibrated at the Center for Research in Water Resources
(CRWR) laboratory. The observed discharge of the 30 degree section was almost
identical to that predicted by the formulas. The recommended length and weir elevation of
the collection box were limited by the height of the down spout at the base of the bridge
support and the concrete pad that was located below it. However, the consistency of the
results and the resulting runoff coefficient indicated that the system employed was reliable
and yielded accurate flow data. The runoff coefficient calculated in this manner was about
0.94. The runoff-rainfall relationship is shown in Figure 2.5.
y = 0.9369x - 1.9484
R2 = 0.9742
0
10000
20000
30000
40000
50000
60000
70000
0 10000 20000 30000 40000 50000 60000 70000 80000
Rainfall Volume, liters
Ru
no
ff V
olu
me,
lite
rs
Figure 2.5 Runoff Coefficient for MoPac at Convict Hill Road
8
2.3.3 Flow Measurement at Walnut Creek
Samples were collected by an automatic sampler from the 1.22 m diameter outfall
of the system prior to the discharge entering Walnut Creek. Flow in the storm sewer
system at Walnut Creek was calculated using the Manning formula for pipe flow. The
slope of the pipe (S), the roughness coefficient (n), the diameter of the pipe (D), and the
depth of water in the pipe (d), were used to calculate the flow rate using:
Qn
AR S=1000 2 3 1 2/ /
where: Q = flow rate (L/s),
A = cross-sectional area of flow (m2),
R = hydraulic radius (m),
S = pipe slope, and
n = the roughness coefficient of the pipe (n = 0.013).
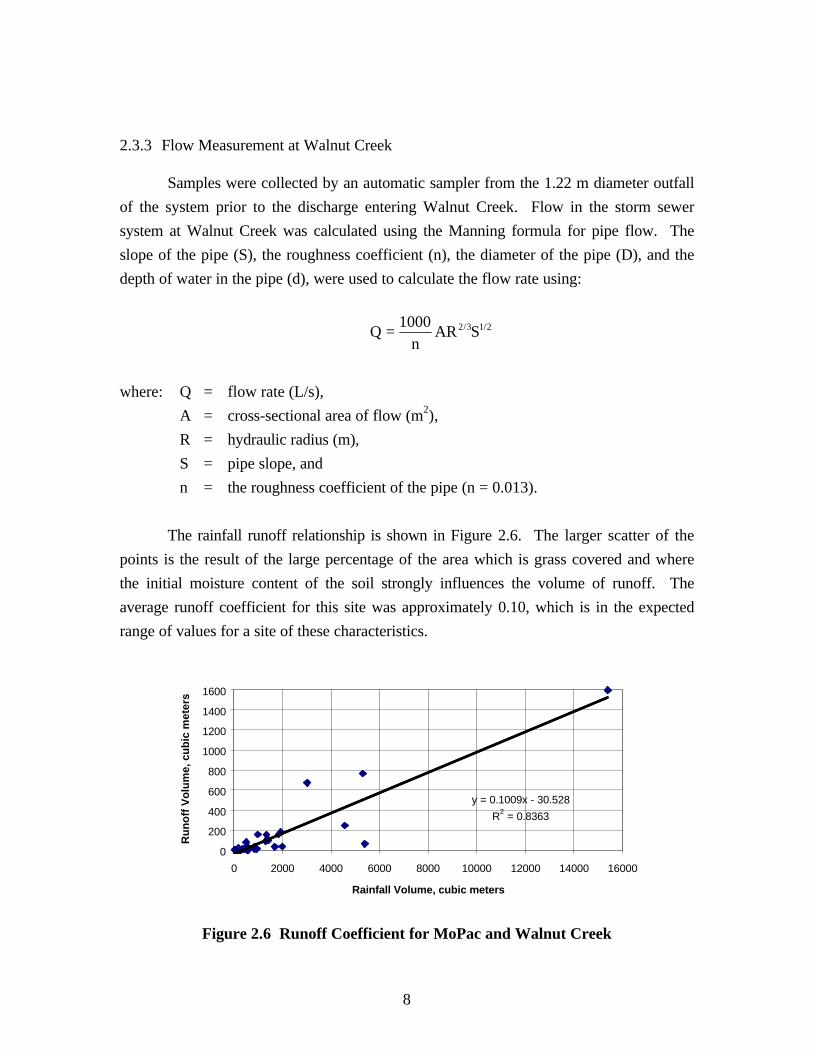
The rainfall runoff relationship is shown in Figure 2.6. The larger scatter of the
points is the result of the large percentage of the area which is grass covered and where
the initial moisture content of the soil strongly influences the volume of runoff. The
average runoff coefficient for this site was approximately 0.10, which is in the expected
range of values for a site of these characteristics.
y = 0.1009x - 30.528
R2 = 0.8363
0
200
400
600
800
1000
1200
1400
1600
0 2000 4000 6000 8000 10000 12000 14000 16000
Rainfall Volume, cubic meters
Ru
no
ff V
olu
me,
cu
bic
met
ers
Figure 2.6 Runoff Coefficient for MoPac and Walnut Creek
9
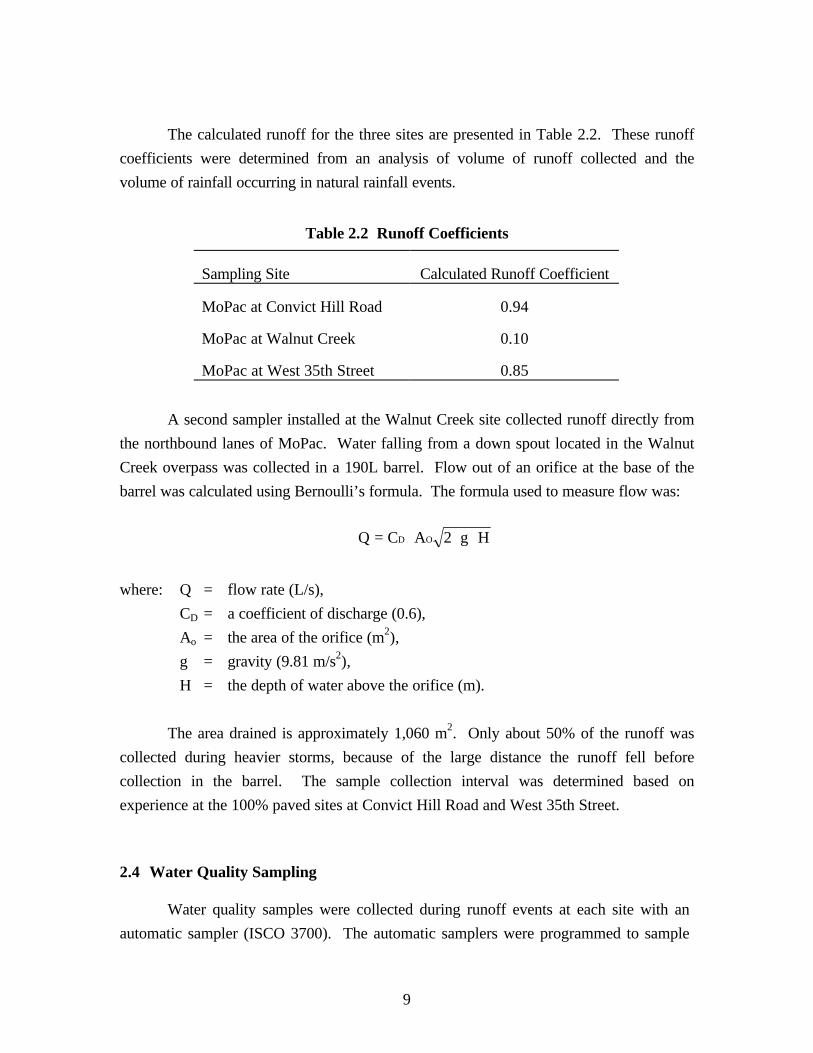
The calculated runoff for the three sites are presented in Table 2.2. These runoff
coefficients were determined from an analysis of volume of runoff collected and the
volume of rainfall occurring in natural rainfall events.
Table 2.2 Runoff Coefficients
Sampling Site Calculated Runoff Coefficient
MoPac at Convict Hill Road 0.94
MoPac at Walnut Creek 0.10
MoPac at West 35th Street 0.85
A second sampler installed at the Walnut Creek site collected runoff directly from
the northbound lanes of MoPac. Water falling from a down spout located in the Walnut
Creek overpass was collected in a 190L barrel. Flow out of an orifice at the base of the
barrel was calculated using Bernoulli’s formula. The formula used to measure flow was:
Q = ⋅ ⋅ ⋅C A g HD O 2
where: Q = flow rate (L/s),
CD = a coefficient of discharge (0.6),
Ao = the area of the orifice (m2),
g = gravity (9.81 m/s2),
H = the depth of water above the orifice (m).
The area drained is approximately 1,060 m2. Only about 50% of the runoff was
collected during heavier storms, because of the large distance the runoff fell before
collection in the barrel. The sample collection interval was determined based on
experience at the 100% paved sites at Convict Hill Road and West 35th Street.
2.4 Water Quality Sampling
Water quality samples were collected during runoff events at each site with an
automatic sampler (ISCO 3700). The automatic samplers were programmed to sample
10
based on the volume of runoff flowing past the sampling point or based on time after
runoff initiated the sampling program. At Walnut Creek and Convict Hill Road the
sampler was programmed to draw samples at set volumes of flow. At the 35th Street
site, the sampler was initially programmed to collect samples on a timed basis, but was
later converted to collect flow weighted composite samples. The sampler was initiated by
the flow meter when the water level at the collection site exceeded a predetermined value.
Samples were collected and analyzed according to the methodology specified by the U.S.
Environmental Protection Agency (EPA).
Initially, the samplers were configured to collect samples in twenty-four 350 mL
bottles. Therefore either six samples in four bottles each, or four samples in six bottles
each were composited on a flow weighted basis. Later, four 3.8 L glass bottles were
installed in the automatic samplers to facilitate the collection of larger volumes of samples
for analysis. The samplers were programmed to collect four flow weighted composite
samples representing different portions of the runoff so that pollutant concentrations as a
function of runoff volume could be investigated. Flow intervals were changed to reflect
weather patterns at different times of the year.
2.5 Chemical Analyses
During rainfall events the runoff flow rates were measured and samples were
collected automatically. Water quality parameters analyzed in the laboratory for all runoff
samples included: turbidity, total and volatile suspended solids (TSS and VSS), 5-Day
Biochemical Oxygen Demand (BOD5), Chemical Oxygen Demand (COD), Total Organic
Carbon (TOC), oil and grease (O&G), nutrients (nitrate and total phosphorus), heavy
metals (iron, lead, cadmium, nickel, zinc, and copper), and bacteria (total coliform, fecal
coliform, and fecal streptococcus). Analyses were performed at The Center for Research
in Water Resources in Austin, Texas. Results of all analyses performed as part of this
study are reported in the Appendix.
The detection limits for the analytical procedures (analyses and instrumentation)
used to determine constituents in the rainfall and runoff samples are summarized in Table
2.3. The detection limit was used in calculating EMCs for concentrations of constituents
which were present in the runoff samples at concentrations below the detection limit.
Therefore, the EMC of a constituent which is present below the detection limit will be
reported as being greater than the actual concentration in the sample.

11
Table 2.3 Detection Limits at CRWR Laboratory
Analytical Procedure Detection Limit(mg/L)
TSS 4VSS 4BOD 2COD 5Total Carbon 10.0Dissolved Total Carbon 10.0Nitrate 0.10Total Phosphorus 0.005-0.05Oil and Grease 1.0Copper 0.002-0.006Chromium 0.0023-0.007Cadmium 0.0013-0.004Nickel 0.005-0.015IronLead 0.0014-0.042Zinc 0.0007-0.005

12
3. RESULTS
3.1 Water Quality of Highway Runoff
Summary water quality characteristics for runoff samples are presented as median
event mean concentrations (EMC) in Table 3.1. The concentrations measured in flow
weighted composite samples at were used to calculate the EMC. The EMC’s for each
constituent were derived from the average value of the constituent for each of the runoff
events monitored and for which a sufficient volume of runoff was generated to complete
the chemical analyses. Median EMCs for the rainfall which could be sampled (i.e.
sufficient accumulation to yield the volume required for analyses) also are included in
Table 3.1. The volume of rainfall collected usually was insufficient to allow complete
chemical characterization.
Table 3.1 Constituents in Highway Runoff
Parameter 35th Street Convict Hill Rd. Walnut Creek RainfallMedian Mean Median Mean Median Mean Median
Total Coliform (CFU/100ml) 13000 48000 4200 7900 189000 145000 0Fecal Coliform (CFU/100ml) 5800 13000 1000 22000 102000 116000 0Fecal Streptococcus (CFU/100ml) 12000 16000 3800 17000 78000 89000 0pH 7.15 6.94 5.61 6.14 6.51 7.16TSS (mg/L) 131 202 118 142 19 27 0VSS (mg/L) 36 41 20 22 7 7 0BOD5 (mg/L) 12.2 16.5 5.0 6.3 3.5 4.1 NDa
COD (mg/L) 126 149 40 48 35 33 6Total Carbon (mg/L) 47 58 21 24 16 18 NDDissolved Tot. Carbon (mg/L) 25 31 11 14 13 15 NDNO3-N (mg/L) 1.03 1.25 0.73 0.96 0.28 0.36 0.52Total Phosphorus (mg/L) 0.33 0.42 0.11 0.13 0.10 0.10 0.05Oil & Grease(mg/L) 4.1 6.5 1.7 2.2 0.5 0.5 NDCu (mg/L) 0.034 0.038 0.007 0.010 0.008 0.007 0.003Fe (mg/L) 2.606 3.537 1.401 2.437 0.361 0.442 0.079Pb (mg/L) 0.050 0.099 0.016 0.041 0.007 0.009 NDZn (mg/L) 0.208 0.237 0.050 0.077 0.022 0.019 0.019a) ND = not detected
Nickel and cadmium were rarely present at concentrations above detection limits;
therefore they are not shown in Table 3.1. Many of the constituents found in runoff are
present in measurable quantities in the rainfall itself. The impact of constituents in rainfall
on the quality of highway runoff is limited to nutrients and some metals.

13
Median EMCs for the runoff at the high traffic sites compare well with the data
summarized by Driscoll (1990a, b, and c) for various locations throughout the United
States with the exception of lead and zinc. Table 3.2 shows the comparison between the
median concentrations measured at 35th Street with the median value reported by Driscoll
et al. (1990a) for all sites with average daily traffic greater than 30,000 vehicles per day.
The concentrations are extremely similar except for lead which is much lower at 35th
Street. The elimination of lead in gasoline is probably responsible for this difference.
Table 3.2 Comparison of High Traffic Site Concentrations
Parameter MoPac at 35th Street(mg/L)
Driscoll et al. (1990a)(mg/L)
TSS 131 142
VSS 36 39
COD 126 114
NO2+NO3 1.03a 0.76
Copper 0.034 0.054
Lead 0.050 0.400
Zinc 0.208 0.329
a) NO3 only
Table 3.3 contains a comparison with the median EMC at Convict Hill Road with
the median value reported by Driscoll et al. (1990a) for all sites with an average daily
traffic of less than 30,000 vehicles per day. Concentrations at Convict Hill Road were
lower for metals and COD, but were much higher for suspended solids. Three factors may
have contributed to the higher solids concentrations. Urban development was occurring
near this site during the monitoring period. The increased construction traffic may have
contributed more solids than a normal vehicle mix might. In addition, the concrete barrier
lining the roadway may retain more solids on the road surface, which would then be
mobilized during storms. In contrast to most low traffic, rural highways, the catchment
sampled had an impervious cover of 100% so that the runoff did not flow across any
grassy areas which might have reduced solids concentrations.

14
Table 3.3 Comparison of Low Traffic Site Concentrations
Parameter MoPac at Convict Hill Rd.(mg/L)
Driscoll et al. (1990a)(mg/L)
TSS 118 41
VSS 20 12
COD 40 49
NO2+NO3 0.73a 0.46
Copper 0.007 0.022
Lead 0.016 0.080
Zinc 0.050 0.080
a) NO3 only
The event mean concentrations reported for the site having the high traffic density
are higher for all water quality parameters than the observed EMC's for the other sites.
However, the event mean concentrations observed at the site with medium traffic density
are lower than those observed for the other two sites, including the low traffic site. This
phenomenon may be explained by the fact that the runoff from the highway at the high
traffic and low traffic sites is directly from the pavement into a catch basin where the
samples are collected. However, the highway runoff at the medium traffic density site
passes over approximately 60 m of grassy area (swale) before entering the storm drain
pipe from which samples are collected. The lower concentrations of the various water
quality parameters at this site may reflect removal by the grassy swale. The effects of the
grassy swale on the water quality at this site is reported in Section 3.3.
3.2 Estimate of Annual Pollutant Loads
The product of the volume of runoff from a section of highway, over a given
period of time, and the concentration of a specific constituent yields the pollutant load
contributed by the highway. For many types of water bodies, the pollutant load is a more
important indicator of potential water quality impacts than is EMC. Annual constituent
loads for the three highway sites were calculated based on the “simple method” described
by Schueler (1987).

15
LP CF R
Cvi=
( )( )( )
.( )
20 4
where: L = Annual pollutant load (kg/ha)
P = Annual precipitation (825 mm/yr)
CF = Correction factor that adjusts for storms where no runoff occurs (0.9)
Rv = Average runoff coefficient
Ci = Event mean concentration (mg/L)
Estimated annual loadings (grams per square meter of pavement) are presented in
Table 3.4. The loads for each site were normalized by watershed area to facilitate a
comparison between the three sites.
Table 3.4 Estimated Annual Pollutant Loadings
Pollutant 35th Street(kg/ha)
Convict Hill Rd.(kg/ha)
Walnut Creek(kg/ha)
TSS 229 145 3.3VSS 46 23 0.8BOD5 18.7 6.5 0.5COD 169 49 4.0Total Carbon 66 25 2.2Dissolved Tot. Carbon 35 14 1.8NO3-N 1.42 0.98 0.04Total Phosphorus 0.48 0.13 0.01Oil & Grease 7.36 2.25 0.06Cu 0.043 0.010 0.001Fe 4.008 2.497 0.053Pb 0.112 0.042 0.001Zn 0.269 0.079 0.002
All estimated loadings at Walnut Creek are far less than those at the other two
sites. This is the result of the initial low concentrations of constituents in the runoff at
Walnut Creek combined with the low runoff coefficient caused by the grassy swale.
Differences between expected loads at 35th Street and Convict Hill Road are primarily the
result of differences in the EMC’s for the constituents.
16
3.3 Effect of Drainage System Type
Grassy swales are vegetated ditches which have gentle slopes and cover large areas
of land. Swales have been shown in studies to effectively remove many constituents from
highway runoff. The swales promote settling of suspended solids and infiltration of the
runoff into the soil. A curb and gutter system, which tends to concentrate and transport
constituents in highway runoff, also is eliminated by a grassy swale (Schueler, 1991).
Factors reported to affect the removal efficiency include type of grass, grass density, blade
size, blade shape, flexibility and texture (Umeda, 1988). Channel dimensions and swale
area affect removal efficiencies and the amount of infiltration that occurs.
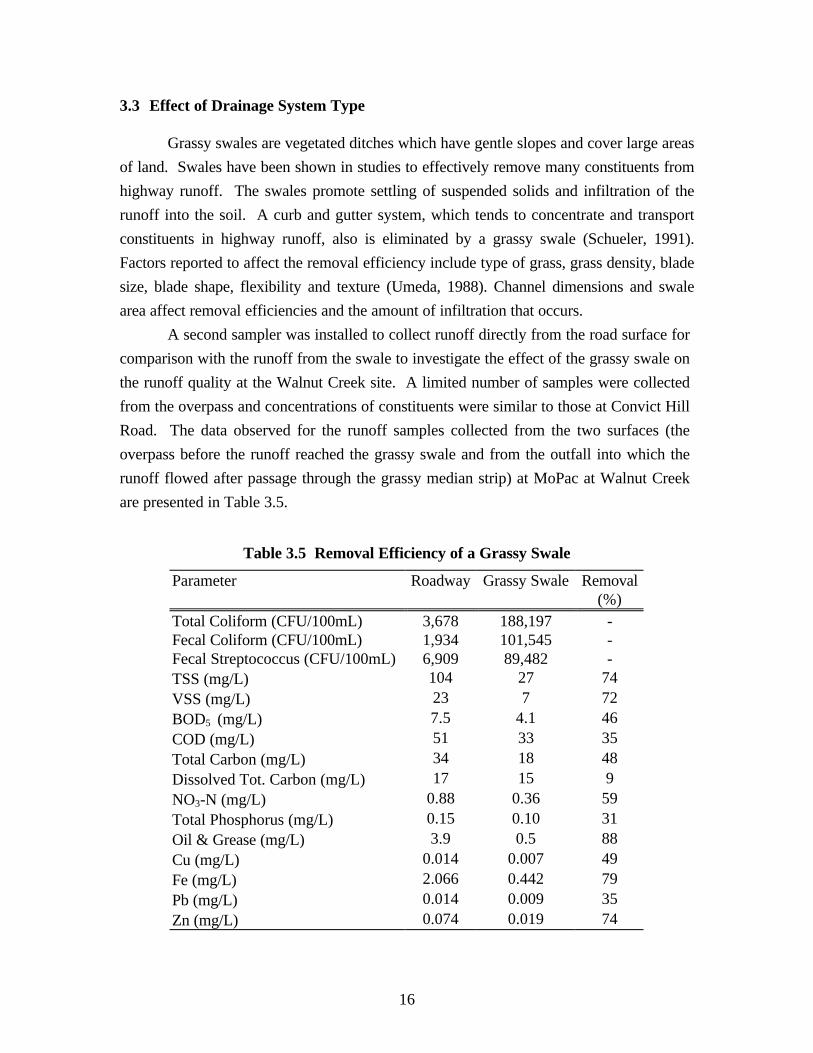
A second sampler was installed to collect runoff directly from the road surface for
comparison with the runoff from the swale to investigate the effect of the grassy swale on
the runoff quality at the Walnut Creek site. A limited number of samples were collected
from the overpass and concentrations of constituents were similar to those at Convict Hill
Road. The data observed for the runoff samples collected from the two surfaces (the
overpass before the runoff reached the grassy swale and from the outfall into which the
runoff flowed after passage through the grassy median strip) at MoPac at Walnut Creek
are presented in Table 3.5.
Table 3.5 Removal Efficiency of a Grassy Swale
Parameter Roadway Grassy Swale Removal(%)
Total Coliform (CFU/100mL) 3,678 188,197 -Fecal Coliform (CFU/100mL) 1,934 101,545 -Fecal Streptococcus (CFU/100mL) 6,909 89,482 -TSS (mg/L) 104 27 74VSS (mg/L) 23 7 72BOD5 (mg/L) 7.5 4.1 46COD (mg/L) 51 33 35Total Carbon (mg/L) 34 18 48Dissolved Tot. Carbon (mg/L) 17 15 9NO3-N (mg/L) 0.88 0.36 59Total Phosphorus (mg/L) 0.15 0.10 31Oil & Grease (mg/L) 3.9 0.5 88Cu (mg/L) 0.014 0.007 49Fe (mg/L) 2.066 0.442 79Pb (mg/L) 0.014 0.009 35Zn (mg/L) 0.074 0.019 74
17
Significant pollutant removal occurs for all constituents except bacteria and
dissolved total carbon. These reductions in concentration are similar to that reported by
other studies. Schueler et al. (1991) reported that well-designed, well-maintained grassed
swales may remove up to 70% of TSS, 30% of total phosphorus, 25% of total nitrogen,
and 50-90% of various trace metals. Little et al. (1982) found removal efficiencies of 67-
93% of oil and grease, and TSS and VSS reductions of at least 65%.
The use of a grassy swale as a runoff control device raises some concerns. The
bacterial counts found in samples of runoff from the swale were much higher than at the
other sites. The concentrations also show that more bacteria are in the samples from the
outfall than in the runoff of the roadway. Apparently, the soil of the swale or the storm
sewer act as a source of bacteria. It is unlikely, given the setting, that the high levels of
fecal coliform and fecal streptococcus are of human origin or that they are indicative of
significant human health risk.
3.4 Pollutant Washoff Patterns
Concentrations of pollutants in runoff are often higher at the beginning of a runoff
event, a phenomenon commonly referred to as the “first flush.” Many storm water
treatment systems are designed to capture the initial runoff from storm events to remove
and treat the runoff with the highest concentrations of pollutants. It is thought by many
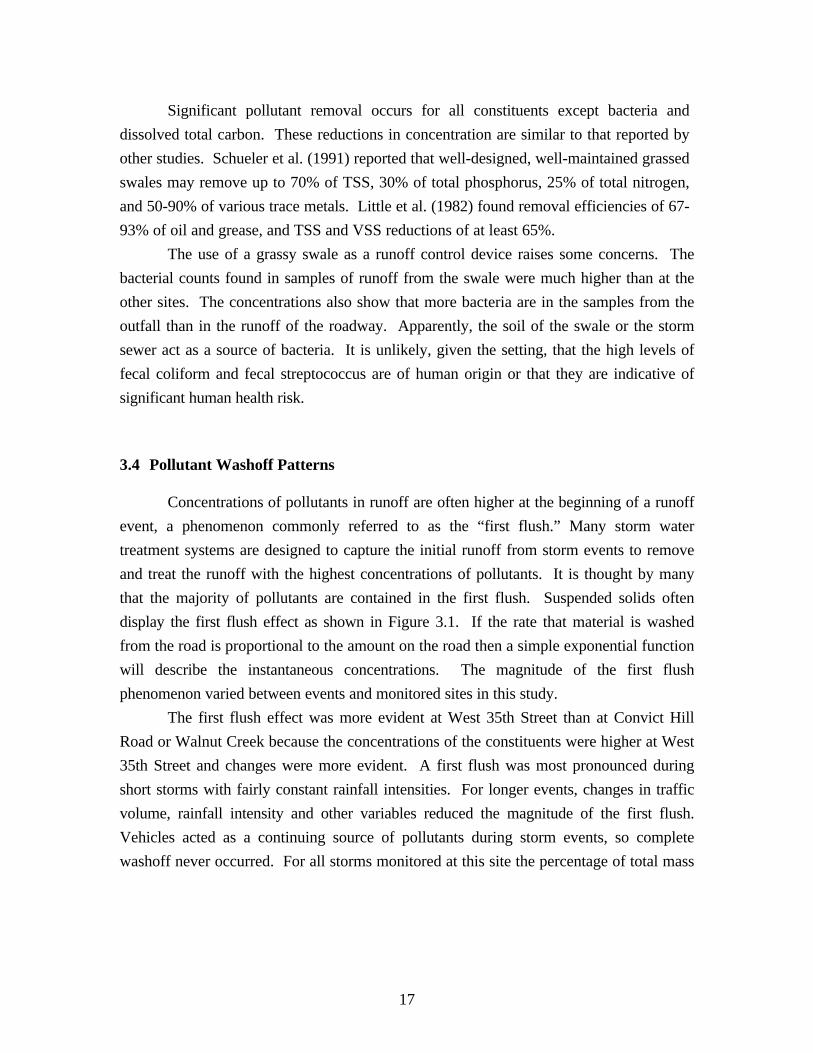
that the majority of pollutants are contained in the first flush. Suspended solids often
display the first flush effect as shown in Figure 3.1. If the rate that material is washed
from the road is proportional to the amount on the road then a simple exponential function
will describe the instantaneous concentrations. The magnitude of the first flush
phenomenon varied between events and monitored sites in this study.
The first flush effect was more evident at West 35th Street than at Convict Hill
Road or Walnut Creek because the concentrations of the constituents were higher at West
35th Street and changes were more evident. A first flush was most pronounced during
short storms with fairly constant rainfall intensities. For longer events, changes in traffic
volume, rainfall intensity and other variables reduced the magnitude of the first flush.
Vehicles acted as a continuing source of pollutants during storm events, so complete
washoff never occurred. For all storms monitored at this site the percentage of total mass

18
y = 371.99e-6E-05x
R2 = 0.8688
1
10
100
1000
0 5000 10000 15000 20000 25000 30000
Cumulative Flow (L)
Co
nce
ntr
atio
n (
mg
/L)
Figure 3.1 Washoff of TSS at 35th Street, 10/29/93
discharged at any point in the storm was only slightly higher than the percentage of the
total runoff volume at that point. A more detailed description of the first flush effect at
35th Street is contained in CRWR Technical Report #264 (Irish et al, 1995).
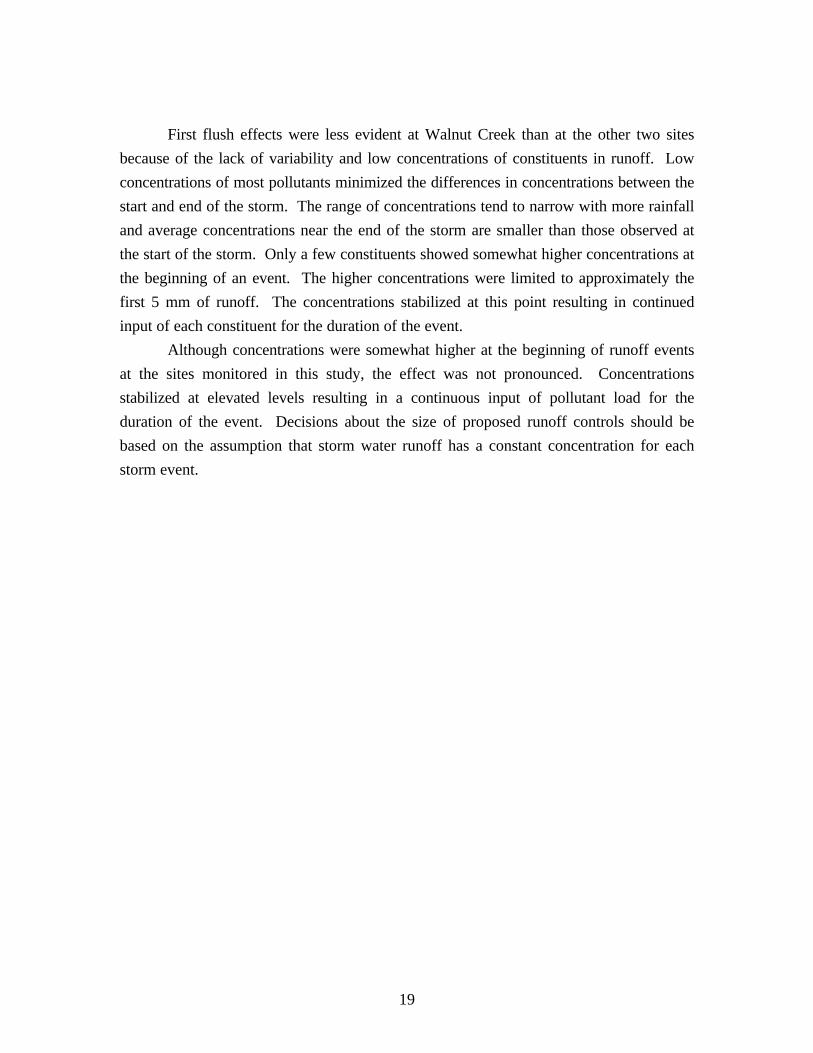
At Convict Hill Road most sample collection was limited to the first 12.1 mm of
runoff, because of the requirements of the NPDES permit and the rainfall characteristics in
the Austin area. This limited the evaluation of the first flush characteristics at this site.
Higher concentrations were recorded during approximately the first 3 mm of runoff for
most constituents; however, the concentrations quickly became approximately constant for
the duration of the sampling period. The typical pattern is shown in Figure 3.2 for TSS.
Since the concentration of TSS stabilizes at approximately 100 mg/L, significant loading
continues for the duration of the sampling period.
0100200300
400500600700800
9001000
0 2 4 6 8 10 12 14
Runoff (mm)
TSS
Con
cent
ratio
n, m
g/L
Figure 3.2 TSS Washoff Pattern at Convict Hill Road Site
19
First flush effects were less evident at Walnut Creek than at the other two sites
because of the lack of variability and low concentrations of constituents in runoff. Low
concentrations of most pollutants minimized the differences in concentrations between the
start and end of the storm. The range of concentrations tend to narrow with more rainfall
and average concentrations near the end of the storm are smaller than those observed at
the start of the storm. Only a few constituents showed somewhat higher concentrations at
the beginning of an event. The higher concentrations were limited to approximately the
first 5 mm of runoff. The concentrations stabilized at this point resulting in continued
input of each constituent for the duration of the event.
Although concentrations were somewhat higher at the beginning of runoff events
at the sites monitored in this study, the effect was not pronounced. Concentrations
stabilized at elevated levels resulting in a continuous input of pollutant load for the
duration of the event. Decisions about the size of proposed runoff controls should be
based on the assumption that storm water runoff has a constant concentration for each
storm event.
20
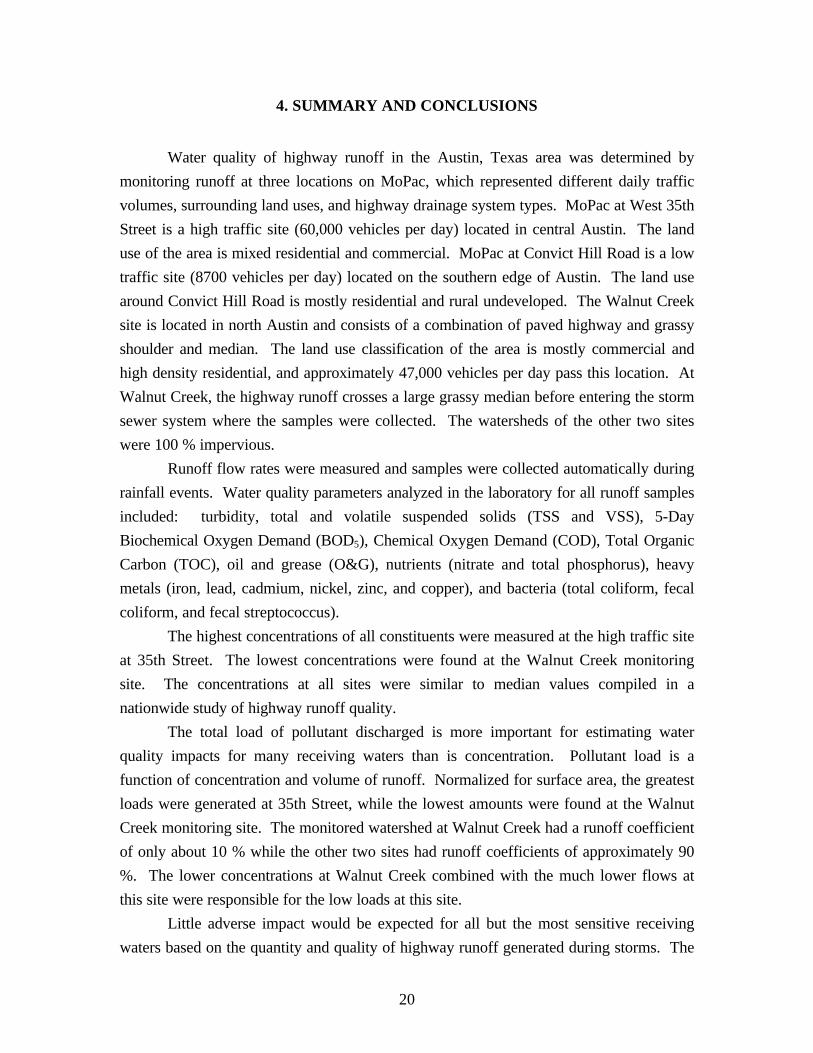
4. SUMMARY AND CONCLUSIONS
Water quality of highway runoff in the Austin, Texas area was determined by
monitoring runoff at three locations on MoPac, which represented different daily traffic
volumes, surrounding land uses, and highway drainage system types. MoPac at West 35th
Street is a high traffic site (60,000 vehicles per day) located in central Austin. The land
use of the area is mixed residential and commercial. MoPac at Convict Hill Road is a low
traffic site (8700 vehicles per day) located on the southern edge of Austin. The land use
around Convict Hill Road is mostly residential and rural undeveloped. The Walnut Creek
site is located in north Austin and consists of a combination of paved highway and grassy
shoulder and median. The land use classification of the area is mostly commercial and
high density residential, and approximately 47,000 vehicles per day pass this location. At
Walnut Creek, the highway runoff crosses a large grassy median before entering the storm
sewer system where the samples were collected. The watersheds of the other two sites
were 100 % impervious.
Runoff flow rates were measured and samples were collected automatically during
rainfall events. Water quality parameters analyzed in the laboratory for all runoff samples
included: turbidity, total and volatile suspended solids (TSS and VSS), 5-Day
Biochemical Oxygen Demand (BOD5), Chemical Oxygen Demand (COD), Total Organic
Carbon (TOC), oil and grease (O&G), nutrients (nitrate and total phosphorus), heavy
metals (iron, lead, cadmium, nickel, zinc, and copper), and bacteria (total coliform, fecal
coliform, and fecal streptococcus).
The highest concentrations of all constituents were measured at the high traffic site
at 35th Street. The lowest concentrations were found at the Walnut Creek monitoring
site. The concentrations at all sites were similar to median values compiled in a
nationwide study of highway runoff quality.
The total load of pollutant discharged is more important for estimating water
quality impacts for many receiving waters than is concentration. Pollutant load is a
function of concentration and volume of runoff. Normalized for surface area, the greatest
loads were generated at 35th Street, while the lowest amounts were found at the Walnut
Creek monitoring site. The monitored watershed at Walnut Creek had a runoff coefficient
of only about 10 % while the other two sites had runoff coefficients of approximately 90
%. The lower concentrations at Walnut Creek combined with the much lower flows at
this site were responsible for the low loads at this site.
Little adverse impact would be expected for all but the most sensitive receiving
waters based on the quantity and quality of highway runoff generated during storms. The

21
water quality of highway runoff is generally similar to that reported for urban runoff, and
does not contain appreciably higher concentrations of toxic metals or oil and grease. The
impacts of highway runoff alone, like many other nonpoint sources of pollution generally
are not significant when considered singly, but may result in degradation of water quality
when combined with other sources such as urban runoff.
The effectiveness of grassy swales for treating highway runoff was evaluated by
comparing the runoff at Walnut Creek, before and after passing across a swale. The
grassy swale proved effective for reducing the concentrations of most constituents in
runoff. The low runoff coefficient due to infiltration of runoff into the swale produced a
large reduction (90%) in pollutant load discharged. This reduction of runoff volume
effectively reduces the impact of constituents whose concentrations are not reduced by the
swale. Large increases in bacteria counts occurred in either the swale or the storm sewer
system; however, they probably do not indicate the presence of a significant human health
threat. The use of a grassy swale precludes the installation of hazardous material traps
designed to catch spills of gasoline or other chemicals during traffic accidents.
A first flush effect (i.e., higher pollutant concentrations at the beginning of an
event) was very evident during selected events, but was generally limited to a small
volume. When all monitored events were considered, the overall effect was small or
negligible. The concentrations appeared to be affected by changes in traffic volume,
rainfall intensity, and other factors. In addition, vehicles provided a continuous input of
pollutants to the road surface and runoff for the duration of runoff events. In considering
the potential effectiveness of storm water treatment systems, constant concentrations for
individual storm events should be assumed.
BIBLIOGRAPHY
Driscoll, E.D., Shelley, P.E., and Strecker, E.W., 1990a, Pollutant Loadings and Impacts
from Highway Stormwater Runoff, Vol. I: Design Procedure, Technical Report No.
FHWA-RD-88-07, prepared for the Federal Highway Administration, Washington, D.C.
Driscoll, E.D., Shelley, P.E., and Strecker, E.W., 1990b, Pollutant Loadings and Impacts
from Highway Stormwater Runoff, Vol. II: Analytical Investigation and Research Report,
Technical Report No. FHWA-RD-88-008, prepared for the Federal Highway
Administration, Washington, D.C.

22
Driscoll, E.D., Shelley, P.E., and Strecker, E.W., 1990c, Pollutant Loadings and Impacts
from Highway Stormwater Runoff, Vol. IV: Research Report Data Appendix, Technical
Report No. FHWA-RD-88-009, prepared for the Federal Highway Administration,
Washington, D.C.
Gupta, M.K., Agnew, R.W., and Krobriger, N.P., 1981a, Constituents of Highway
Runoff Vol. I: State of the Art Report, Technical Report FHWA/RD-81/042 prepared
for the Federal Highway Administration, Washington, D.C.
Gupta, M.K., Agnew, R.W., and Kreutzberger, W., 1981b, Constituents of Highway
Runoff Vol. II: Procedural Manual for Monitoring of Highway Runoff, Technical
Report FHWA/RD-81/043, prepared for the Federal Highway Administration,
Washington, D.C.
Gupta, M.K., Agnew, R.W., Gruber, D., and Kreutzberger, W., 1981c, Constituents of
Highway Runoff Vol. IV: Characteristics of Runoff from Operating Highways, Research
Report, FHWA/RD-81/045, a Report prepared for the Federal Highway Administration,
Washington, D.C.
Irish, L.B., Lesso, W.G., Barrett, M.E., Malina, Jr., J.F., Charbeneau, R.J., Ward, G.H.,
1995, An Evaluation of the Factors Affecting the Quality of Highway Runoff in the
Austin, Texas Area, Center for Research in Water Resources, Technical Report No. 264,
University of Texas at Austin, Austin, TX.
Little, L.M., Horner, R.R., and Mar, B.W., 1982, Assessment of Pollutant Loadings and
Concentrations in Highway Stormwater Runoff, WA-RD-39.12.1, Washington State
Department of Transportation, Olympia, WA.
Sartor, J.D. and Boyd, G.B., 1972, Water Pollution Aspects of Street Surface
Contaminants, Technical Report EPA-R2-72-081, prepared for the U.S. EPA, Office of
Research and Monitoring, Environmental Protection Series, Washington D.C.
Schueler, T.R., 1987, Controlling Urban Runoff: A Practical Manual for Planning and
Designing Urban BMPs, Department of Environmental Programs, Metropolitan
Washington Council of Governments, Washington, D.C.
23
Schueler, T.R., Kumble, P.A., and Heraty, M.A., 1991, A Current Assessment of Urban
Best Management Practices, Techniques for Reducing Non-Point Source Pollution in the
Coastal Zone, Review Draft, Anacostia Restoration Team, Department of Environmental
Programs, Metropolitan Washington Council of Governments, Washington, D.C.
Umeda, P.J., 1988, Use of Vegetation to Reduce the Toxicity of Stormwater Runoff,
FHWA/CA/TL-88/06, California Department of Transportation, Sacramento, CA.

24
APPENDIX
1
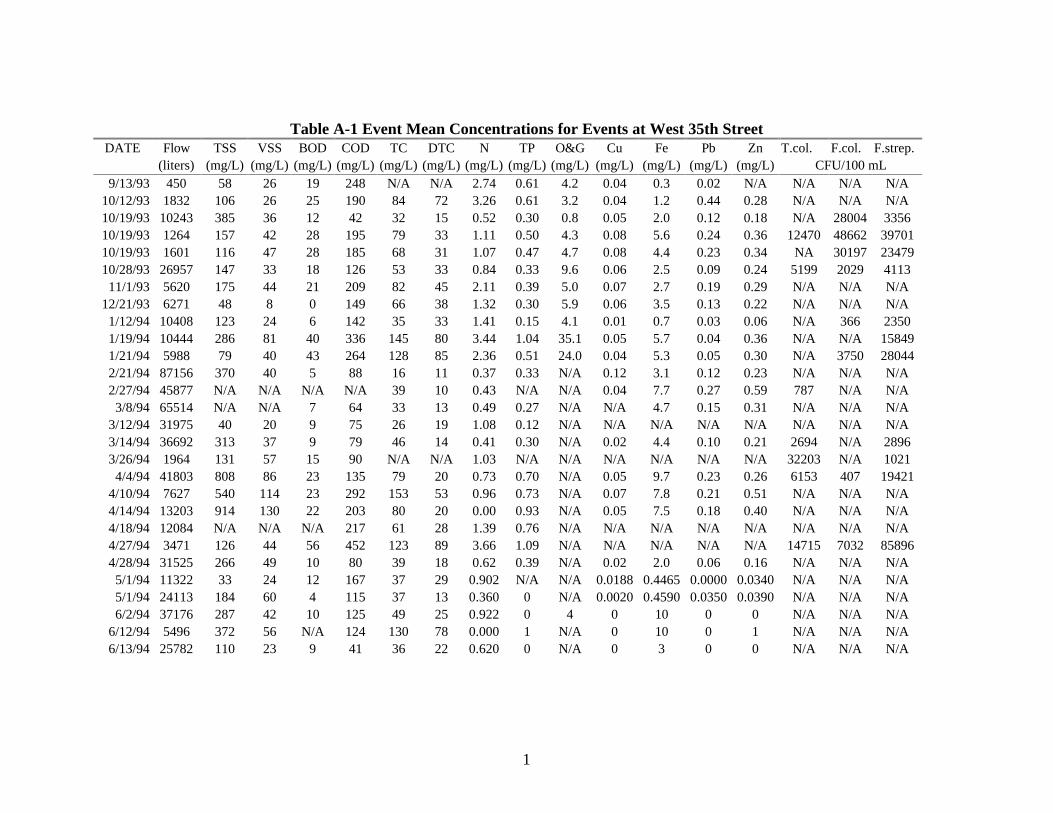
Table A-1 Event Mean Concentrations for Events at West 35th StreetDATE Flow TSS VSS BOD COD TC DTC N TP O&G Cu Fe Pb Zn T.col. F.col. F.strep.
(liters) (mg/L) (mg/L) (mg/L) (mg/L) (mg/L) (mg/L) (mg/L) (mg/L) (mg/L) (mg/L) (mg/L) (mg/L) (mg/L) CFU/100 mL9/13/93 450 58 26 19 248 N/A N/A 2.74 0.61 4.2 0.04 0.3 0.02 N/A N/A N/A N/A
10/12/93 1832 106 26 25 190 84 72 3.26 0.61 3.2 0.04 1.2 0.44 0.28 N/A N/A N/A10/19/93 10243 385 36 12 42 32 15 0.52 0.30 0.8 0.05 2.0 0.12 0.18 N/A 28004 335610/19/93 1264 157 42 28 195 79 33 1.11 0.50 4.3 0.08 5.6 0.24 0.36 12470 48662 3970110/19/93 1601 116 47 28 185 68 31 1.07 0.47 4.7 0.08 4.4 0.23 0.34 NA 30197 2347910/28/93 26957 147 33 18 126 53 33 0.84 0.33 9.6 0.06 2.5 0.09 0.24 5199 2029 411311/1/93 5620 175 44 21 209 82 45 2.11 0.39 5.0 0.07 2.7 0.19 0.29 N/A N/A N/A
12/21/93 6271 48 8 0 149 66 38 1.32 0.30 5.9 0.06 3.5 0.13 0.22 N/A N/A N/A1/12/94 10408 123 24 6 142 35 33 1.41 0.15 4.1 0.01 0.7 0.03 0.06 N/A 366 23501/19/94 10444 286 81 40 336 145 80 3.44 1.04 35.1 0.05 5.7 0.04 0.36 N/A N/A 158491/21/94 5988 79 40 43 264 128 85 2.36 0.51 24.0 0.04 5.3 0.05 0.30 N/A 3750 280442/21/94 87156 370 40 5 88 16 11 0.37 0.33 N/A 0.12 3.1 0.12 0.23 N/A N/A N/A2/27/94 45877 N/A N/A N/A N/A 39 10 0.43 N/A N/A 0.04 7.7 0.27 0.59 787 N/A N/A
3/8/94 65514 N/A N/A 7 64 33 13 0.49 0.27 N/A N/A 4.7 0.15 0.31 N/A N/A N/A3/12/94 31975 40 20 9 75 26 19 1.08 0.12 N/A N/A N/A N/A N/A N/A N/A N/A3/14/94 36692 313 37 9 79 46 14 0.41 0.30 N/A 0.02 4.4 0.10 0.21 2694 N/A 28963/26/94 1964 131 57 15 90 N/A N/A 1.03 N/A N/A N/A N/A N/A N/A 32203 N/A 1021
4/4/94 41803 808 86 23 135 79 20 0.73 0.70 N/A 0.05 9.7 0.23 0.26 6153 407 194214/10/94 7627 540 114 23 292 153 53 0.96 0.73 N/A 0.07 7.8 0.21 0.51 N/A N/A N/A4/14/94 13203 914 130 22 203 80 20 0.00 0.93 N/A 0.05 7.5 0.18 0.40 N/A N/A N/A4/18/94 12084 N/A N/A N/A 217 61 28 1.39 0.76 N/A N/A N/A N/A N/A N/A N/A N/A4/27/94 3471 126 44 56 452 123 89 3.66 1.09 N/A N/A N/A N/A N/A 14715 7032 858964/28/94 31525 266 49 10 80 39 18 0.62 0.39 N/A 0.02 2.0 0.06 0.16 N/A N/A N/A5/1/94 11322 33 24 12 167 37 29 0.902 N/A N/A 0.0188 0.4465 0.0000 0.0340 N/A N/A N/A5/1/94 24113 184 60 4 115 37 13 0.360 0 N/A 0.0020 0.4590 0.0350 0.0390 N/A N/A N/A6/2/94 37176 287 42 10 125 49 25 0.922 0 4 0 10 0 0 N/A N/A N/A
6/12/94 5496 372 56 N/A 124 130 78 0.000 1 N/A 0 10 0 1 N/A N/A N/A6/13/94 25782 110 23 9 41 36 22 0.620 0 N/A 0 3 0 0 N/A N/A N/A
2
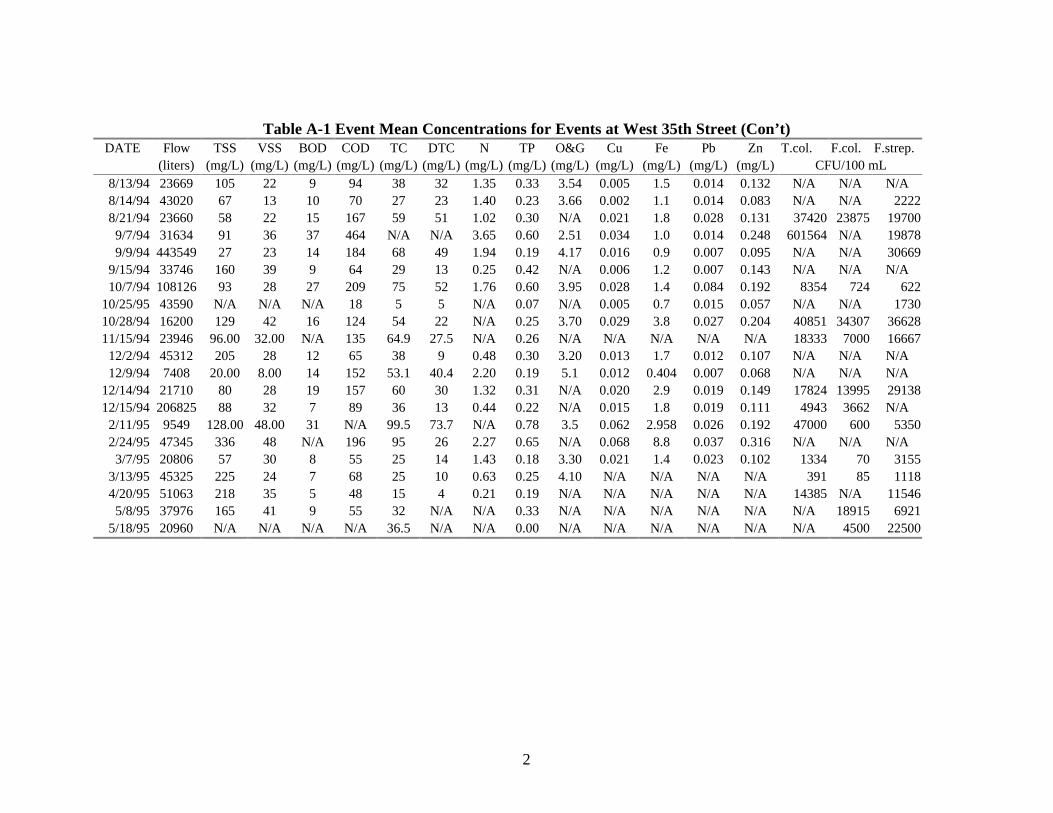
Table A-1 Event Mean Concentrations for Events at West 35th Street (Con’t)DATE Flow TSS VSS BOD COD TC DTC N TP O&G Cu Fe Pb Zn T.col. F.col. F.strep.
(liters) (mg/L) (mg/L) (mg/L) (mg/L) (mg/L) (mg/L) (mg/L) (mg/L) (mg/L) (mg/L) (mg/L) (mg/L) (mg/L) CFU/100 mL8/13/94 23669 105 22 9 94 38 32 1.35 0.33 3.54 0.005 1.5 0.014 0.132 N/A N/A N/A8/14/94 43020 67 13 10 70 27 23 1.40 0.23 3.66 0.002 1.1 0.014 0.083 N/A N/A 22228/21/94 23660 58 22 15 167 59 51 1.02 0.30 N/A 0.021 1.8 0.028 0.131 37420 23875 19700
9/7/94 31634 91 36 37 464 N/A N/A 3.65 0.60 2.51 0.034 1.0 0.014 0.248 601564 N/A 198789/9/94 443549 27 23 14 184 68 49 1.94 0.19 4.17 0.016 0.9 0.007 0.095 N/A N/A 30669
9/15/94 33746 160 39 9 64 29 13 0.25 0.42 N/A 0.006 1.2 0.007 0.143 N/A N/A N/A10/7/94 108126 93 28 27 209 75 52 1.76 0.60 3.95 0.028 1.4 0.084 0.192 8354 724 622
10/25/95 43590 N/A N/A N/A 18 5 5 N/A 0.07 N/A 0.005 0.7 0.015 0.057 N/A N/A 173010/28/94 16200 129 42 16 124 54 22 N/A 0.25 3.70 0.029 3.8 0.027 0.204 40851 34307 3662811/15/94 23946 96.00 32.00 N/A 135 64.9 27.5 N/A 0.26 N/A N/A N/A N/A N/A 18333 7000 16667
12/2/94 45312 205 28 12 65 38 9 0.48 0.30 3.20 0.013 1.7 0.012 0.107 N/A N/A N/A12/9/94 7408 20.00 8.00 14 152 53.1 40.4 2.20 0.19 5.1 0.012 0.404 0.007 0.068 N/A N/A N/A
12/14/94 21710 80 28 19 157 60 30 1.32 0.31 N/A 0.020 2.9 0.019 0.149 17824 13995 2913812/15/94 206825 88 32 7 89 36 13 0.44 0.22 N/A 0.015 1.8 0.019 0.111 4943 3662 N/A2/11/95 9549 128.00 48.00 31 N/A 99.5 73.7 N/A 0.78 3.5 0.062 2.958 0.026 0.192 47000 600 53502/24/95 47345 336 48 N/A 196 95 26 2.27 0.65 N/A 0.068 8.8 0.037 0.316 N/A N/A N/A3/7/95 20806 57 30 8 55 25 14 1.43 0.18 3.30 0.021 1.4 0.023 0.102 1334 70 3155
3/13/95 45325 225 24 7 68 25 10 0.63 0.25 4.10 N/A N/A N/A N/A 391 85 11184/20/95 51063 218 35 5 48 15 4 0.21 0.19 N/A N/A N/A N/A N/A 14385 N/A 115465/8/95 37976 165 41 9 55 32 N/A N/A 0.33 N/A N/A N/A N/A N/A N/A 18915 6921
5/18/95 20960 N/A N/A N/A N/A 36.5 N/A N/A 0.00 N/A N/A N/A N/A N/A N/A 4500 22500
3
Table A-2 Event Mean Concentraitons for Events at Convict HillDate Rainfall Rainfall Flow Flow TSS VSS BOD COD TC DTC N TP O&G Cu Fe Pb Zn T.col. F.col. F.strep.
(in) (mm) (gal) (L) mg/L mg/L mg/L mg/L mg/L mg/L mg/L mg/L mg/L mg/L mg/L mg/L mg/L CFU/100 mL4/29/94 0.09 375 239 39 10 72 49 28 1.47 0.062 NA 0.015 NA NA 0.063 NA NA 205005/2/94 0.11 375 86 23 6 78 41 23 0.89 0.109 NA 0.020 2.9 NA 0.081 NA NA NA
5/13/94 0.46 1050 403 42 5 92 39 17 0.71 0.260 NA 0.010 8.9 0.141 0.174 NA NA 05/14/94 0.25 350 348 20 7 NA 29 11 0.78 0.358 1.5 0.009 4.0 0.090 0.099 12000 400 76675/16/94 0.07 400 6 6 7 46 24 21 0.75 0.078 2.0 0.002 1.0 0.033 0.053 2000 167 206676/10/94 0.17 400 512 50 24 174 89 43 NA 0.380 NA 0.032 11.8 0.223 0.3106/19/94 0.23 400 4 0 5 75 20 20 0.60 NA 1.9 0.011 4.5 0.100 0.292 NA NA NA6/21/94 0.16 600 40 12 6 68 31 22 1.61 0.112 2.4 0.001 0.5 0.171 0.033 NA NA NA8/8/94 0.18 600 176 68 13 114 NA NA NA 0.200 8.1 0.003 2.2 0.021 0.042 0 0 1008/9/94 0.36 900 42 14 3 32 11 5 0.21 0.048 1.6 0.001 0.9 0.007 0.010 7550 1250 775
8/16/94 0.3 900 80 8 10 39 23 21 1.80 NA 1.7 0.001 1.1 0.007 0.028 NA NA NA8/22/94 0.27 900 40 12 3 15 14 11 0.43 0.060 0.8 0.002 0.8 0.012 0.017 NA NA 35259/7/94 0.17 450 292 44 16 49 22 19 1.02 0.080 1.8 0.009 1.8 0.017 0.079 11500 9500 40009/8/94 0.27 900 0 0 5 17 5 5 0.53 0.025 0.4 0.003 0.3 0.016 0.022 1750 NA 7509/9/94 0.47 1800 3 2 3 10 5 5 0.40 0.025 1.3 0.008 0.5 0.007 0.028 6788 NA 1475
10/7/94 0.37 1350 68 7 8 49 21 16 0.60 0.077 0.9 0.003 0.8 0.011 0.019 NA NA NA10/14/94 0.24 1275 24 16 6 43 32 14 0.78 0.030 2.4 0.003 0.9 0.021 0.055 14800 110000 9000010/25/94 0.56 1800 146 15 4 19 18 8 NA 0.041 0.9 0.003 0.7 0.009 0.016 NA NA 950010/27/94 0.29 1575 68 16 4 40 24 10 NA 0.113 1.8 0.007 2.5 0.014 0.215 4500 6000 2062511/5/94 0.49 1800 192 24 3 29 19 8 NA 0.078 0.9 0.007 1.5 0.013 0.045 NA11/15/94 0.15 300 12 4 5 33 20 17 NA 0.060 1.7 0.006 1.2 0.014 0.081 4000 1500 360012/2/94 0.3 900 156 28 5 39 21 5 0.39 0.070 7.6 0.007 1.4 0.007 0.052 186667 15666712/9/94 0.09 375 136 28 3 29 13 12 0.55 0.005 NA NA NA NA NA NA NA NA12/15/94 23.16 11679 96 21 3 41 23 10 0.23 0.14 2.6 0.004 1.2 0.015 0.037 1099 1349 28661/13/95 19.56 7137 346 29 5 26 17 10 0.18 0.14 N/A 0.005 1.4 0.014 0.035 0 0 02/13/95 2.75 4522 24 8 13 46 23 15.3 1.75 0.13 3.6 0.032 2.1 0.024 0.075 1150 350 14502/24/95 8.32 9381 245 20 N/A 85 45 14 1.37 0.19 N/A 0.032 6.8 0.027 0.118 NA NA NA3/7/95 8.35 9230 147 26 4 31 19 4 1.24 0.12 0.9 0.014 1.8 0.027 0.049 681 404 834
3/13/95 30.46 15087 118 3 2 16 12 9 5.50 0.09 N/A 0.024 2.3 0.024 0.042 119 NA 150
4
Table A-2 Event Mean Concentraitons for Events at Convict Hill (Con’t)Date Rainfall Rainfall Flow Flow TSS VSS BOD COD TC DTC N TP O&G Cu Fe Pb Zn T.col. F.col. F.strep.
(in) (mm) (gal) (L) mg/L mg/L mg/L mg/L mg/L mg/L mg/L mg/L mg/L mg/L mg/L mg/L mg/L CFU/100 mL3/16/95 5.81 2244 148 24 2 44 29.1 10 1.75 0.16 2.0 N/A N/A N/A N/A 2550 100 33004/4/95 16.76 12091 153 30 5 40 21 10 0.20 0.19 1.1 N/A N/A N/A N/A 8366 2306 13266
4/18/95 9.84 6838 86 26 7 38 24 11 0.79 0.20 N/A N/A N/A N/A N/A 56103 698 192124/19/95 7.33 3336.6 260 52 7 57 32.1 10 0.35 0.26 N/A N/A N/A N/A N/A 17500 NA 200004/20/95 19.03 8420 198 20 4 21 12 10 0.11 0.13 N/A N/A N/A N/A N/A NA NA NA5/8/95 27.42 11723 85 15 3 18 13 N/A N/A N/A N/A N/A N/A N/A N/A 5829 667 4175
5/18/95 7.11 2574 N/A N/A N/A N/A 14.6 N/A N/A N/A N/A N/A N/A N/A N/A N/A 66000 25500
5
Table A-3 EMC’s at Walnut Creek for Events with Flow Similar to Base Flow (Swale)Date Rainfall Flow TSS VSS BOD COD TC DTC N TP O&G Cu Fe Pb Zn T.col. F.col. F.strep.
(mm) (L) (mg/L) (mg/L) (mg/L) (mg/L) (mg/L) (mg/L) (mg/L) (mg/L) (mg/L) (mg/L) (mg/L) (mg/L) (mg/L) (mg/L) (mg/L) (mg/L)5/16/94 0 0 3 26 42 39 0.54 0.09 1.00 0.019 0.10 0.062 0.027 35000 10000 25000
6/3/94 18 6 4 55 39 38 N/A 0.09 1.30 0.001 0.27 0.062 0.042 na na na8/8/94 136 48 12 124 51 33 3.10 0.38 NA 0.001 1.12 0.007 0.047 tntc tntc 200000
8/15/94 39 12 8 42 41 47 2.45 0.23 0.50 0.001 0.31 0.009 0.004 356667 150000 150008/21/94 32 0 7 47 32 27 0.60 0.12 0.50 0.011 0.98 0.021 0.018 na na na9/8/94 26 4 4 16 10 8 0.52 0.13 0.70 0.005 0.80 0.007 0.032 100375 na na
9/12/94 8 4 1 36 17 13 0.33 NA 0.70 0.001 0.49 0.007 0.008 na na na10/14/94 28 8 4 27 43 38 2.05 0.15 NA 0.004 0.12 0.007 0.013 na na na10/16/94 8 3 4 27 53 51 1.21 0.01 0.70 0.002 0.09 0.007 0.041 na na na11/15/94 4 0 6 28 38 36 N/A 0.11 N/A N/A N/A N/A N/A 133 100 23312/14/94 10 8 3 36 43 42 0.67 0.11 0.80 0.002 0.17 0.014 0.009 20375 12375 108751/13/95 14 1 2 6 46 45 1.24 0.01 1.40 0.007 0.03 0.014 0.009 0 0 03/13/95 15 1 2 18 32 28 1.22 0.09 2.35 0.004 0.17 0.014 0.009 na na na3/16/95 7 1 3 22 38 27 0.81 0.05 2.80 0.006 0.43 0.014 0.007 4417 7133 70004/4/95 61 11 2 14 35 30 0.37 0.04 1.00 0.005 0.24 0.014 0.011 825 163 725
4/20/95 9 3 4 30 39 31 0.53 0.05 N/A N/A N/A N/A N/A 44000 5400 103500
Table A-4 EMC’s at Walnut Creek for Events with Significant Storm Flow (Swale)Date Rainfall Flow TSS VSS BOD COD TC DTC N TP O&G Cu Fe Pb Zn T.col. F.col. F.strep.
(mm) (L) (mg/L) (mg/L) (mg/L) (mg/L) (mg/L) (mg/L) (mg/L) (mg/L) (mg/L) (mg/L) (mg/L) (mg/L) (mg/L) (mg/L) (mg/L) (mg/L)4/29/94 14.46 66284 62 12 5 35 12 13 0.49 0.22 N/A 0.013 0.25 N/A 0.041 na na na4/30/94 4.83 37536 15 4 3 40 24 24 0.45 0.12 N/A 0.013 0.14 N/A 0.024 na na na5/2/94 8.3 41068 19 N/A 3 47 34 30 0.28 0.10 N/A 0.012 0.47 N/A 0.020 na na na
5/28/94 12.43 31004 10 4 3 30 24 25 0.87 0.10 N/A N/A N/A N/A N/A na na na10/7/94 124.91 1473204 8 0 3 20 5 5 0.23 0.11 0.50 0.003 0.71 0.021 0.001 380000 185000 153333
10/18/94 14.99 154861 55 9 5 38 16 10 0.20 0.09 0.89 0.003 1.09 0.007 0.031 144958 116085 79830
5/8/95 44.44 197330 20 10 5 21 9 0 0.00 0.00 0.00 0.000 0.00 0.000 0.000 39634 3552 35283

6
Table A-5 EMC’s at Walnut Creek for Direct Road RunoffDate Rainfall Flow TSS VSS BOD COD TC DTC N TP O&G Cu Fe Pb Zn T.col. F.col. F.strep.
(mm) (L) (mg/L) (mg/L) (mg/L) (mg/L) (mg/L) (mg/L) (mg/L) (mg/L) (mg/L) (mg/L) (mg/L) (mg/L) (mg/L) (mg/L) (mg/L) (mg/L)10/17/94 5.33 757 216 52 5 42 58.3 12.8 0.26 0.17 1.70 0.01 1.67 0.01 0.07 na na na11/5/94 5.33 1514 24 20 3 4 5 5 N/A 0.04 N/A 0.01 0.40 0.01 0.01 na na na11/15/94 5.08 2271 40 12 8 71 35 28 N/A 0.19 2.50 0.01 2.34 N/A 0.10 2500 1363 477512/2/94 5.08 946 100 16 9 56 29.6 14.5 0.35 0.14 4.10 0.01 1.28 0.01 0.06 na na na12/14/94 3.05 2839 42 22 9 84 40 24 1.19 0.17 7.90 N/A N/A N/A N/A 5000 5100 216001/13/95 24 11 4 42 25 17 1.60 0.05 3.0 0.004 0.8 0.017 0.042 625 625 2502/13/95 0.75 307 44 16 22 99 43.4 29.3 N/A 0.16 5.1 0.022 2.1 0.020 0.105 3500 350 5002/24/95 11.39 1909 143 13 N/A 97 47 14 1.60 0.20 5.7 0.037 5.3 0.032 0.147 5793 4886 123813/13/95 32.23 4184 128 7 3 28 17 11 0.34 0.11 2.3 0.025 2.3 0.017 0.045 314 324 5843/16/95 5.3 1705 240 40 9 24 50.8 16.5 1.40 0.22 3.8 0.017 4.0 0.014 0.124 2000 1200 44004/4/95 0.25 618 190 54 8 31 45 15 0.76 0.21 2.9 0.004 0.6 0.004 0.027 9690 1622 10779
4/20/95 9.14 1007 128 24 7 68 33.3 13.6 0.43 0.17 N/A N/A N/A N/A N/A na na na5/8/95 57.58 4595 33 12 3 16 10 N/A N/A N/A N/A N/A N/A N/A N/A na na na