crwr online report 12-02 reducing turbidity of
TRANSCRIPT

CRWR Online Report 12-02
Reducing Turbidity of Construction Site Runoff Via Coagulation with Polyacrylamide and Chitosan
by
David Robert Rounce, B.S.C.E. Desmond F. Lawler, Ph.D. P.E.
Michael E. Barrett, Ph.D., P.E., D.WRE
The University of Texas at Austin August 2012

ii
Acknowledgements
We would like to thank Brad Eck for his assistance organizing the field
monitoring projects and for his help collecting grab samples. Alex Houston was also a
tremendous help in collecting samples. We would also like to acknowledge Ijung Kim
for his assistance with the particle size distributions. Lastly, we would like to thank
TXDOT for funding this work.

iii
Abstract
The U.S. Environmental Protection Agency is in the process of developing a
nationwide standard for turbidity in construction site runoff. It is widely expected that
this standard cannot be met with conventional erosion and sediment control measures;
consequently, innovative practices for managing sediment on construction sites must be
developed. The objective of this research was to develop an understanding of how soil
characteristics and polymer properties affect the amount of turbidity reduction that can be
achieved through flocculation. The polymers used were PAMs, a proprietary product, and
chitosan. The charge density of the PAMs ranged from 0% to 50% and the molecular
weights ranged from 0.2 to 14 Mg/mol. A protocol for creating modified synthetic
stormwater runoff for soil samples was developed and used on soils from seven
construction sites. Particle size distributions were used to compare the modified
synthetic stormwater runoff with grab samples of stormwater from one site and showed
the synthetic runoff was representative of the actual runoff. Flocculation tests were
performed on the synthetic runoffs with PAM and chitosan doses from 0.03 to 10 mg/L.
The non-ionic PAM, proprietary product, and chitosan were found to be the most
effective at reducing the turbidity of all the synthetic runoff below 200 NTU. The high
molecular weight anionic PAMs were effective on only two of the seven synthetic runoff
samples. Hardness tests were performed indicating interparticle bridging to be the
bonding mechanism of the PAM. Electrophoretic mobility tests were performed on two
of the soil suspensions and indicated the bonding mechanism of PAM to be interparticle
bridging, and the bonding mechanism of chitosan to be a combination of charge
neutralization and interparticle bridging. Tests showed as the charge density of the PAM
increased, their effectiveness decreased.

iv
Table of Contents
List of Tables ......................................................................................................... vi
List of Figures ....................................................................................................... vii
Chapter 1: Introduction ...........................................................................................1 1.1 Background ..............................................................................................1 1.2 Objectives ................................................................................................3
Chapter 2: Literature Review ..................................................................................4 2.1 Polyacrylamide ........................................................................................4 2.2 Factors Influencing the Effectiveness of PAM ........................................8 2.3 Factors Influencing the Effectiveness of Chitosan ................................13 2.4 Active and Passive Dosing Systems for PAM .......................................14 2.5 Summary ................................................................................................16
Chapter 3: Materials and Methods: .......................................................................18 3.1 Field Sampling .......................................................................................18 3.2 Particle Size Distribution .......................................................................19 3.3 Soil Samples for Laboratory Tests .........................................................20 3.4 Modified Synthetic Stormwater Runoff .................................................21 3.5 Flocculants .............................................................................................23 3.6 Flocculation Tests ..................................................................................24 3.7 Hardness Tests .......................................................................................25 3.8 Electrophoretic Mobility Tests ..............................................................26
Chapter 4: Results and Discussion: .......................................................................29 4.1 Field Sampling .......................................................................................29 4.2 Modified Synthetic Stormwater Runoff .................................................30 4.3 Flocculation Tests ..................................................................................33 4.4 Hardness Tests .......................................................................................39
v
4.5 Electrophoretic Mobility Tests ..............................................................42
Chapter 5: Conclusions .........................................................................................53 Future Work .............................................. Error! Bookmark not defined.51
Appendices .............................................................................................................56 Appendix A ...................................................................................................56 Appendix B ...................................................................................................58 Appendix C ...................................................................................................61
References ..............................................................................................................64

vi
List of Tables
Table 2.1: Classification of molecular weights of PAM (adopted from Barvenik,
1994). ..................................................................................................6
Table 2.2: Classification of charge densities (CD) of PAM (Barvenik, 1994). ...7
Table 3.1: Selected Properties of Soils used in Laboratory Tests. .....................21
Table 3.2: Molecular weight and charge density of flocculants. .......................24
Table 4.1: Turbidity in Construction Site Runoff from Three Projects. ............30
vii
List of Figures
Figure 2.1: Non-ionic PAM (from Barvenik, 1994). ............................................4
Figure 3.1: Decanter used to remove large particles from soil suspension. ........22
Figure 4.1: Particle Size Distribution Functions of the Modified Synthetic
Stormwater Runoff and the Runoff Sampled from US 183A. ..........31
Figure 4.2: Impact of molecular weight on turbidity reduction for modified synthetic
stormwater runoff WLoop. ...............................................................34
Figure 4.3: Effect of charge density on flocculation for modified synthetic
stormwater runoff WLoop. ...............................................................36
Figure 4.4: Most effective flocculants for modified synthetic stormwater runoff
WLoop. .............................................................................................38
Figure 4.5: Turbidity and Hardness Curves for SF N300 on Modified Synthetic
Stormwater Runoff of Hearne II. ......................................................40
Figure 4.6: Effectiveness of A-110 for all the synthetic runoff tested. ...............41
Figure 4.7: Histogram of Zeta Potential for Particles of 183ANBC Modified
Synthetic Stormwater Runoff. ..........................................................42
Figure 4.8: Average Zeta Potentials with 95% Confidence Limits for 183ANBC
Modified Synthetic Stormwater Runoff. ...........................................43
Figure 4.9: Average Zeta Potentials with 95% Confidence Limits for E. Texas
Modified Synthetic Stormwater Runoff. ...........................................45
Figure A.1: Histogram of Zeta Potential for E. Texas synthetic runoff (no polymer
addition) prior to cleaning the electrophoresis cell. ..........................57
Figure A.2: Histogram of Zeta Potential for E. Texas synthetic runoff (no polymer
addition) after cleaning. ....................................................................57
viii
Figure B.1: Flocculation tests for all synthetic runoff with APS #705. ...............58
Figure B.2: Flocculation tests for all synthetic runoff with SF N300. .................58
Figure B.3: Flocculation tests for all synthetic runoff with LMW SF N300. ......59
Figure B.4: Flocculation tests for all synthetic runoff with Chitosan. .................59
Figure B.5: Flocculation tests for all synthetic runoff with A-150. .....................60
Figure C.1: Flocculation and hardness tests for WLoop synthetic runoff. ..........61
Figure C.2: Flocculation and hardness tests for College Station synthetic runoff.61
Figure C.3: Flocculation and hardness tests for 183ANBC synthetic. ................62
Figure C.4: Flocculation and hardness tests for Hearne II synthetic. ..................62
Figure C.5: Flocculation and hardness tests for 127Lub synthetic runoff. ..........63
1
Chapter 1: Introduction
1.1 BACKGROUND
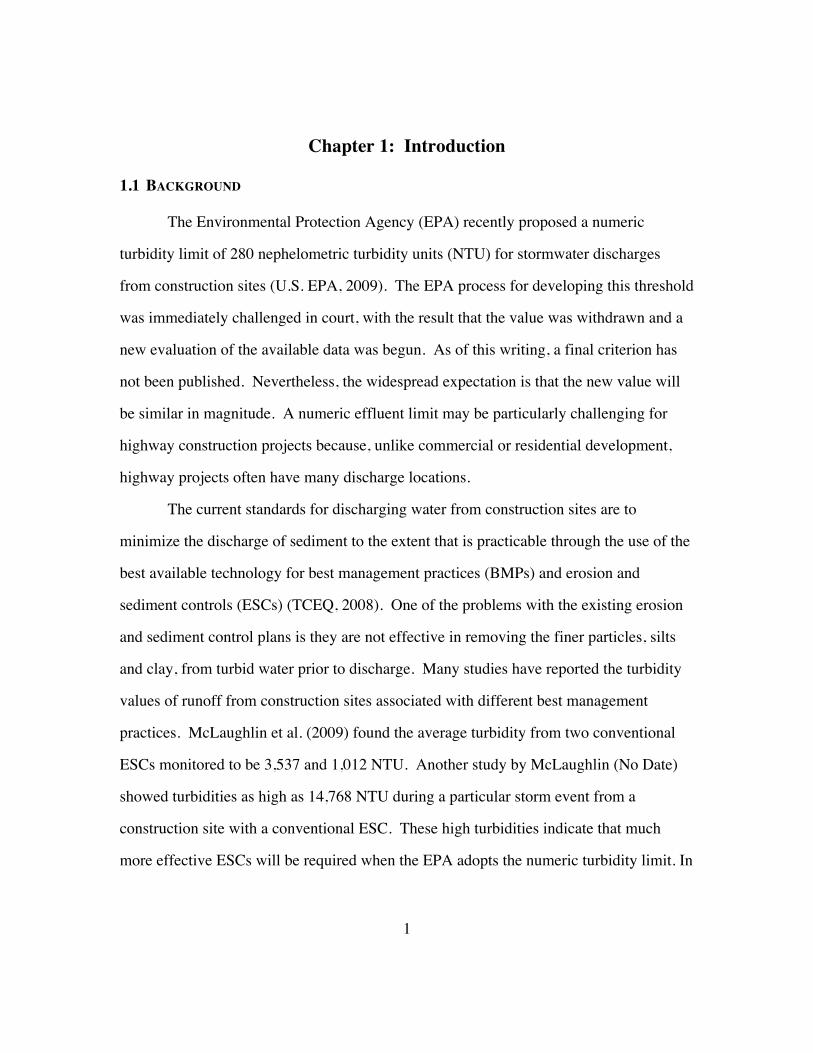
The Environmental Protection Agency (EPA) recently proposed a numeric
turbidity limit of 280 nephelometric turbidity units (NTU) for stormwater discharges
from construction sites (U.S. EPA, 2009). The EPA process for developing this threshold
was immediately challenged in court, with the result that the value was withdrawn and a
new evaluation of the available data was begun. As of this writing, a final criterion has
not been published. Nevertheless, the widespread expectation is that the new value will
be similar in magnitude. A numeric effluent limit may be particularly challenging for
highway construction projects because, unlike commercial or residential development,
highway projects often have many discharge locations.
The current standards for discharging water from construction sites are to
minimize the discharge of sediment to the extent that is practicable through the use of the
best available technology for best management practices (BMPs) and erosion and
sediment controls (ESCs) (TCEQ, 2008). One of the problems with the existing erosion
and sediment control plans is they are not effective in removing the finer particles, silts
and clay, from turbid water prior to discharge. Many studies have reported the turbidity
values of runoff from construction sites associated with different best management
practices. McLaughlin et al. (2009) found the average turbidity from two conventional
ESCs monitored to be 3,537 and 1,012 NTU. Another study by McLaughlin (No Date)
showed turbidities as high as 14,768 NTU during a particular storm event from a
construction site with a conventional ESC. These high turbidities indicate that much
more effective ESCs will be required when the EPA adopts the numeric turbidity limit. In
2
an attempt to meet this anticipated turbidity limit, the EPA has also proposed that the best
available technology be polymer enhanced sedimentation.
One of the polymers used to improve sedimentation is polyacrylamide (PAM).
The use of PAM for enhancing soil stability, increasing infiltration, and reducing erosion
has been studied by scientists since the early 1940s when they started examining the
interactions between clays and different organic polymers (Theng, 1982). PAM was used
as early as the 1950s in solid-liquid separation applications dealing with removing silicate
fines from dissolved uranium ores (Barvenik, 1994). In the 1980s, PAM started to be
used in agriculture as a polymer to enhance soil management. Since then, PAM has been
used in many different manners to reduce erosion and increase infiltration in both furrow
irrigation (Lentz and Sojka, 1994) and sprinkler irrigation (Ben-Hur, 1994). The newest
area being explored, and which has been evolving for the past two decades, is the use of
PAM to reduce erosion on construction sites. Studies have focused on anionic PAM as
the use of cationic PAM is prohibited because it binds to fish gills.
Another polymer that may be utilized in polymer enhanced sedimentation is
chitosan. Chitosan is a biopolymer naturally derived from the deacetylation of chitin,
which is found in crustaceans, arthropods, fungi, and yeasts. Washington State has
recognized chitosan as another polymer that is suitable to be used in conjunction with
sand filters on construction sites. The residual chitosan concentration in the discharge is
required to be less than 0.2 mg/L (WA State Department of Ecology, 2007), because of
toxicity concerns.

3
1.2 OBJECTIVES
The objectives of this research were to determine the typical turbidities of runoff
from highway construction sites in the Austin, Texas area, develop an understanding of
soil and polymer properties that promote flocculation, and test the effectiveness of
utilizing these polymers in the field to improve the performance of conventional ESCs.
Typical turbidities were determined by monitoring stormwater runoff from multiple
construction sites in the Greater Austin area using grab sampling. The evaluation of
polymers in the laboratory focused on determining the particle destabilization
mechanisms responsible for promoting sedimentation and the characteristics of the
polymer that enable flocculation to occur for various soil suspensions. The experiments
tried to emulate field conditions to the best extent possible by creating soil suspensions
that were representative of runoff and flocculation tests with short mixing and settling
times. The polymers reviewed in the study were non-ionic and anionic PAMs, and
chitosan.

4
Chapter 2: Literature Review
2.1 POLYACRYLAMIDE
Polyacrylamide (PAM) are polymers formed by the polymerization of acrylamide
monomers that have the ability to form long chains of different charges and charge
densities, which give PAM many beneficial properties as a soil amendment (Barvenik,
1994). The three properties that characterize the type of PAM are the type of charge,
molecular weight (MW), and charge density.
The type of charge is an important property of PAM and depends upon how the
acrylamide is polymerized. PAM may either be non-ionic, cationic, or anionic. Non-
ionic PAMs (Figure 2.1) have typically been used in wastewater clarification at pulp and
paper mills (Barvenik, 1994).
Figure 2.1: Non-ionic PAM (from Barvenik, 1994).
Cationic PAMs have been used in flocculation of sewage sludge and industrial
waste (Barvenik, 1994). Cationic PAMs bind with the negative charge of the soil
particles, which comes from the mineral’s surface, via electrostatic (columbic)
interactions. This strong bond may lead to the chain of PAM collapsing onto the surface
of the soil structure, which limits the amount of short loops available to promote
flocculation (Theng, 1982). Cationic PAMs have not been used in agriculture and
construction site applications since the polymer binds to fish gills, thereby causing

5
mechanical suffocation (Barvenik, 1994). Therefore, the use of cationic PAM has
primarily been in the wastewater industry.
Anionic PAM, on the other hand, has been widely used in both agriculture and
construction sites. The negatively charged PAM tends to be repelled by the negative
surface of the soil particles. To overcome this tendency, some studies and practices have
used the addition of electrolytes (typically by adding gypsum) to compress the diffuse
double layer and enhance neutralization, thereby increasing the adsorption of the anionic
PAM (Letey, 1994; Shainberg and Levy, 1994). This compression of the diffuse double
layer allows the van der Waals forces to act as the main bonding mechanism (Lawler,
2010).
Anionic PAM may also bond to the negative soil particles through interparticle
bridging. Interparticle bridging is the adsorption of a polymer onto the surface of
multiple particles via hydrogen bonding such that the particles are connected causing the
formation of a floc. In the presence of polyvalent cations (typically Ca2+), the cation may
provide a bridge between the negative charges of the PAM and the particles (Theng,
1982; Letey, 1994; Shainberg and Levy, 1994). Electrophoretic mobility tests on
kaolinite suspensions using anionic PAM have found the zeta potential to be reduced
despite its anionic nature (Patience et al., 2003). The reduction in zeta potential occurs as
a result of the polymer binding to the adsorption sites of the particle, which displaces the
plane of shear that causes a change to the surface charge of the particles. These results
indicate that despite interparticle bridging being the main mechanism of particle
destabilization, the surface charge of the particles is also reduced. Toxicity tests have
also shown that dry anionic PAMs in soil systems have no toxicity to fish (Barvenik,
1994), which makes the use of anionic PAM suitable for agriculture and construction site
practices.

6
The second property used to characterize PAMs is the molecular weight. PAM is
simply a long chain of acrylamide monomers and other functional groups. Therefore,
molecular weight is a function of the length of the chain. Barvenik (1994) classified the
type of PAM based on molecular weight as shown in Table 2.1. The majority of studies
in recent years have focused on the use of high MW anionic PAMs with some studies
comparing the effectiveness of low and medium MW to these high MW PAMs
(McLaughlin and Bartholomew, 2007; Vacher et al., 2003; Mamedov et al., 2009; Green
et al., 2000; Green et al., 2004). One of the properties of PAM that is associated with
molecular weight is the viscosity of the solutions (Barvenik, 1994). PAMs with higher
molecular weights have higher viscosities.
Table 2.1: Classification of molecular weights of PAM (adopted from Barvenik, 1994).
Classification Molecular Weight (g mole-1)
Low MW <105
Medium (moderate) MW 105-106
High MW >106
The last property commonly used to characterize PAMs is the charge density.
The charge density is typically given as a mole percent referring to the proportion of
charged co-monomer. The PAM obtains a charge when the NH2 component of the
acrylamide monomer is substituted for by an anionic charge. Typically, a strong base
(commonly NaOH) is added to a nonionic PAM, which replaces the NH2 component with
an acrylic acid functional group (Barvenik, 1994). The amount of strong base added

7
controls the charge density. Subsequently, the charge density of the PAM is simply the
amount of substitution over the length of the polymer chain. Barvenik (1994) defined the
following ranges of charge densities that have been used to classify the type of PAM
(Table 2.2).
Table 2.2: Classification of charge densities (CD) of PAM (Barvenik, 1994).
Classification Charge Density (mole %)
Low CD <10
Moderate CD 10-30
High CD >30
PAMs are commonly manufactured in three different forms: dry, liquid, and
inverse emulsion. Dry Pam refers to its granular form, which may be dissolved into
water. It is typically applied to the site by hand or by using a spreader similar to those
used in the application of granular fertilizers. Dry PAMs have the advantage of having
lower shipping costs and a longer shelf life compared to inverse emulsion and solution
PAM (Barvenik, 1994). Inverse emulsion refers to aqueous droplets containing the
polymer, which are inverted to release the PAM when mixed with water. It has a lower
viscosity and is more concentrated than solution PAM, which is beneficial for
transportation (Barvenik, 1994). Liquid PAM, commonly referred to as “wet” PAM,
refers to a solution with a known concentration of PAM that is already dissolved. It is
typically sprayed onto the sites using water trucks or applied through irrigation systems.
The benefit of liquid PAM is the PAM is already dissolved and therefore may be applied
8
in a uniform manner to the site. Dry PAM and liquid PAM are the most common forms.
All three forms are manufactured with a variety of molecular weights and charge
densities. A new form of solid PAM, called FlocLogs, has recently been developed by
Applied Polymer Systems. The FlocLog is a proprietary blend of polymers that dissolves
as runoff passes over its surface. Studies have analyzed the FlocLog’s effectiveness in
passive treatment systems (McLaughlin, 2006; Bhardwaj and McLaughlin, 2008;
Bhardwaj et al., 2008). To select the appropriate form of PAM, it is crucial to understand
the differences in effectiveness of each form for the intended use and the advantages and
disadvantages associated with the use of a particular form in the field.
2.2 FACTORS INFLUENCING THE EFFECTIVENESS OF PAM
Several studies have focused on understanding the factors that influence the
effectiveness of PAM. The effectiveness of PAM has been analyzed with respect to
reducing erosion, increasing aggregate stability, increasing infiltration, reducing runoff,
and improving flocculation. These studies have shown that soil texture, multivalent
cations, pH, organic matter, clay mineralogy, and the type and dose of PAM all influence
its effectiveness.
Soil texture has been shown to have a large impact on the effectiveness of PAMs
with respect to infiltration (Green et al., 2000; Vacher et al., 2003; Bhardwaj et al., 2010),
aggregate stability (Green et al., 2004), and flocculation (McLaughlin and Bartholomew,
2007; Bhardwaj and McLaughlin, 2008). The designation of sand, silt, and clay is based
on the various particle size ranges, with sand being all material > 62.5 μm, clay being all
material < 2 μm, and silt being everything in between. McLaughlin and Bartholomew
(2007) found that soils with the greatest turbidity reductions were composed of greater

9
than 14% clay and 22% silt. The study speculated this phenomenon occurs because silt
may improve the flocculation of clays through interparticle bridging, since silt-clay flocs
would settle more readily than clay-clay flocs.
Bhardwaj and McLaughlin (2008) performed flocculation tests on soil samples
that were comprised of “whole-soil” and the “supernatant” of the whole-soil. The whole-
soil comprised 2 g of soil in 100 mL. The supernatant of the whole-soil was prepared by
mixing soil with 4L of water and decanting the supernatant after 5 minutes of settling; the
exact amount of soil varied such that the supernatant had a turbidity >500 NTU.
Flocculation tests revealed that the turbidity reduction on an absolute basis was greater
for the whole-soil suspensions compared to the supernatant. Flocculation tests were then
performed on the supernatant with the addition of 2 g of whole-soil and flocculation was
found to be more effective.
These flocculation tests led Bhardwaj and McLaughlin (2008) to suggest that
some of the finer particles in the supernatant did not react with the PAM and were
therefore more difficult to settle out, while the particles in the whole-soil were reactive
with PAM, thereby allowing flocculation to occur. They hypothesized that flocculation
was effective when the whole-soil was added as a result of flocs forming with the
reactive portion of soil, which then pulled the non-reactive portion out of suspension.
The improvement in flocculation via the addition of whole-soil, i.e., larger particles such
as silt and sand, confirms the initial study by McLaughlin and Bartholomew (2007) in
which the silt content improves the flocculation of finer particles. However, to
understand which types of particles are difficult to settle out, it is important to know the
actual particle size as opposed to the relative fraction of silt and clays, which comprise
particles of various sizes. Furthermore, the study of Bhadwaj and McLaughlin (2008)
compared the laboratory flocculation tests to field flocculation tests and found the field

10
tests were not as effective as the laboratory flocculation tests performed on the whole-
soil. However, the field tests were more effective than the laboratory tests on the
supernatant. The reason for the differences was not accounted for, but may have been a
result of the suspensions in the laboratory tests not being representative of field
conditions, or that flocculation tests were performed under different conditions than those
encountered in the field.
Multivalent cations are widely known to improve flocculation by two
mechanisms. The most common destabilization mechanism associated with the use of
PAM is known as interparticle bridging, which may be aided by the presence of
multivalent cations. Theng (1982) found that polyvalent cations in suspension also act as
bridges between the negative particles and the anionic groups of the polymer. However,
multivalent cations also improve flocculation by increasing the ionic strength of the
suspensions. The increase in ionic strength compresses the diffuse double layer, thereby
promoting flocculation. Laird (1997) isolated the effects of interparticle bridging and
ionic strength by looking at Ca2+ and Na+ systems of equal ionic strengths. The study
found that the Ca-system was more effective than the Na-system, confirming that calcium
acts as a bridge in addition to its role in increasing the ionic strength. Many studies have
verified that this phenomenon between PAM and soils is valid (McLaughlin and
Bartholomew, 2007; Letey, 1994; Lu et al., 2002).
pH is another commonly reported property of soils that has been found to
influence flocculation due to its effect on PAM and the surface of particles. Peng and Di
(1994) found a range of pH where anionic PAM is most effective at flocculating kaolinite
suspensions. The study found an optimum range of pH from 5 to 7 with a dose of anionic
PAM of 5 mg/L. Flocculation was slightly less effective at higher pH values up to 9, but
was ineffective at pH values below 5. The strong pH effect at lower pH is due to the

11
change in surface charge of kaolin edges and may also be a result of PAM losing its
anionic nature and extendibility as multivalent metallic cations absorb onto the
hydrocarbon chain. At high pH, they found that Ca(OH)+ and Ca2+ adsorbed to the kaolin
surfaces, thereby covering up the active functional groups, which inhibited the formation
of hydrogen bonding. Nonionic PAM, on the other hand, is not affected by pH (Peng and
Di, 1994). Most PAM products are made to perform within a specific range of pH.
Therefore, as Peng and Di (1994) showed it is vital to remain in the range of pH where
PAM is effective.
Organic matter has also been known to influence flocculation. Organic matter is
negatively charged and therefore inhibits flocculation of particles by increasing the
repulsive forces in a suspension. Lu et al. (2002) found that decreasing the organic
matter content increased PAM sorption to the soil. The decrease in organic matter
reduced the electrostatic repulsion between the soil particles and the anionic PAM.
Furthermore, there was less competition between the organic matter and PAM for the
active bonding sites on the particles. Fortunately, the sediment associated with common
construction processes contains little organic matter. McLaughlin and Bartholomew
(2007) showed that organic matter content did not affect their flocculation tests, but all of
the subsoils had relatively low organic matter.
Clay mineralogy has been found to greatly influence the effectiveness of
flocculation with PAM. Nasser and James (2006) studied the effect of charge density and
molecular weight on kaolinite suspensions. The interactions between the kaolinite
suspension and PAM are dominated by hydrogen bonds with the aluminol (Al-OH) and
silanol (Si-OH) groups on its basal surfaces. Anionic PAM is repelled by the negatively
charged surfaces of the suspension causing it to form loops and tails. As a result, the
PAM is able to form large open-structured flocs, which promote sedimentation.

12
Laid (1997) analyzed the relationship between mineralogy and flocculation and
found that PAM was most effective with kaolinite suspensions. PAM was less effective
on illite suspensions and the least effective on quartz suspensions. Quartz was the least
effective because it lacks the aluminol (Al-OH) groups on the basal surfaces, which
kaolinite and illite have. The reason behind the greater effectiveness of kaolinite over
illite is not particularly clear, since they both comprise the aluminol basal surfaces.
Therefore, the study hypothesized that the PAM bonds with the siloxane and gibbsitic
basal surfaces of the kaolinite via van der Waals forces resulting in the improved
flocculation.
McLaughlin and Bartholomew (2007) studied soil suspensions as opposed to the
previous studies, which looked at particular clay minerals. The study found flocculation
to be most effective in kaolinite-dominated soils. Subsoils that had significant smectite
or vermiculite content did not flocculate as well as the kaolinite soils.
In the soils where flocculation with anionic PAM was ineffective (i.e., those with
high smectite or vermiculite content) McLaughlin and Bartholomew (2007) used a
polymer from Applied Polymer Systems called APS #705. Flocculation with this
polymer was found to effectively reduce the turbidity; however, the properties of this co-
polymer are unknown. Nasser and James (2006) looked at the effectiveness of different
PAMs with kaolinite suspensions based on the charge density and molecular weight. The
study found that increasing the charge density up to 35% resulted in worse flocculation.
To gain a better understanding of how clay mineralogy affects flocculation, it will be
important to understand why APS #705 is effective when anionic PAM is ineffective, as
this may yield insight into the particle destabilization mechanisms that promote
flocculation of stable soil suspensions.

13
PAM dose has also been shown to influence its effectiveness in promoting
flocculation. Studies have found an optimal dose of PAM at which the greatest
flocculation occurs and above that dosage restabilization may occur. This optimal dosage
has been estimated to be anywhere from 1-10 mg/L for laboratory experiments
(McLaughlin and Bartholomew, 2007; Bhardwaj et al., 2010; Teo et al., 2006). Nasser
and James (2006) analyzed the difference in optimal dose as a function of the polymer.
The study observed that the optimal dose of anionic PAM was lower than that of cationic
PAM. This phenomenon was due to the effectiveness of interparticle bridging as a result
of the extended loops and tails characteristic of anionic PAMs. Field studies have
observed the optimal dose may be higher than those of laboratory studies with one
particular study showing the optimal dose to range from 40-80 mg/L (Tobiason et al.,
2001). Therefore, knowing the dose of PAM used in both laboratory experiments and
field tests, and how the dose from laboratory experiments transfers into field tests will be
crucial.
2.3 FACTORS INFLUENCING THE EFFECTIVENESS OF CHITOSAN
Studies with chitosan have found the clay mineralogy to have a significant impact
on the effectiveness of flocculation with chitosan. Huang and Chen (1996) analyzed the
effectiveness of chitosan on bentonite and kaolinite suspensions at a pH of 4 and 7. They
found that, at pH 4, the dominant mechanism of particle destabilization was charge
neutralization. However, at pH 7, the dominant mechanism of particle destabilization
was interparticle bridging. The change in mechanisms was attributed to the positive
charge on the chitosan surface significantly decreasing as the pH increased. Furthermore,
the study found chitosan to be more effective at reducing the turbidity in bentonite
14
suspensions compared to kaolinite suspensions. In fact, adding bentonite to the kaolinite
suspensions was able to reduce the final turbidity from 15 NTU to 0.6 NTU. Pan et al.
(1999) also worked with mixed suspensions of bentonite, kaolinite, and clay particles and
found the properties of the colloid particles to be very important. Divakaran and Pillai
(2001) studied the flocculation of kaolinite suspensions at pH 7.5 and found chitosan able
to reduce the turbidity below 10 NTU at an optimal dose of 10 mg/L. The initial
turbidities of the suspensions used in all the studies mentioned above were typically
below 200 NTU. Therefore, it is important to evaluate how effective chitosan is at
flocculating more turbid samples of suspensions containing various types of clay
particles.
2.4 ACTIVE AND PASSIVE DOSING SYSTEMS FOR PAM
Both active and passive PAM dosing systems may be used to reduce sediment
discharge from construction sites. An active system utilizes a pumping system to treat a
fixed amount of turbid runoff through the addition of PAM, which is discharged to a
settling basin or through a sand filter prior to exiting the site (McLaughlin and
Zimmerman, 2009). Passive systems use PAM in a solid block, granular form, or
solution form that is allowed to dry after its application. As runoff passes over the
surface of the PAM, the PAM dissolves into the water.
Active treatment systems have been shown to be effective in reducing turbidity.
Bhardwaj et al. (2008) showed that active treatment systems were effective at reducing
turbidity from 250-400 NTU to a final turbidity around 50 NTU. However, it was
difficult to achieve minimum turbidities less than 50 NTU, which they proposed was due

15
to the fine fraction remaining in the water being more difficult to flocculate than the
whole soil.
Bhardwaj and McLaughlin (2008) evaluated the effectiveness of both active and
passive systems in a controlled experiment. The active dosing system was set up by
dissolving granular PAM into water and using a pump to add the proper dose. The
passive dosing system used a solid block, which dissolved PAM into the water as
pumped water flowed over the block. The two PAMs were manufactured by Applied
Polymer Systems and were comprised of the same proprietary mixture, which helped in
the comparison of systems. The turbidities were measured at a variety of locations, but
both systems reduced the turbidity from greater than 300 NTU in the mixing basin (prior
to being pumped into the stilling basin) to less than 50 NTU at the outlet of the stilling
basin. Bhardwaj and McLaughlin (2008) suggested the passive system may be the
preferred approach due to its simplicity and cost in comparison to the active system.
However, they acknowledged not knowing the actual dose of PAM in the water and
maintaining the proper condition of the blocks could be problematic.
McLaughlin (2006) explored the use of PAM blocks in a controlled setting with a
variety of stilling basins. The study found that PAM blocks significantly reduced the
turbidity from 400-600 NTU to below 200 NTU under most conditions. The most
successful conditions were in warm water (> 15˚C) when the PAM block was already
wet. These conditions gave PAM enough time to hydrate and release a significant dose
of PAM into the runoff required to flocculate finer particles.
Other forms of passive treatment include utilizing PAM in conjunction with fiber
check dams and rock dams. In these systems, water flows through the structures and the
PAM dissolves into the stream of water. The use of fiber check dams with PAM was
evaluated on two field sites and found to reduce the average turbidity of storm events to
16
28 NTU and 128 NTU for the two sites respectively (McLaughlin et al., 2009). Another
study performed by McLaughlin and McCaleb (2010) evaluated rock dams, rock wrapped
in an excelsior blanket, and excelsior wattles with and without PAM. The study found
that all of the check dams significantly reduced turbidity when PAM was used in
conjunction with them; and in particular, the excelsior wattles were most effective,
reducing the turbidity below 200 NTU.
2.5 SUMMARY
Polyacrylamide (PAM) is a long-chain polymer that utilizes interparticle bridging
to promote flocculation of particles. PAM may be characterized by its type of charge,
molecular weight, and charge density. Cationic PAMs are prohibited from being used on
construction sites because of toxicity concerns. Therefore, most studies have focused on
high MW anionic PAM. Studies have shown that soil texture, multivalent cations, pH,
organic matter, clay mineralogy, and the type and dose of PAM all influence its
effectiveness. However, no single soil property may be used to determine if PAM will be
effective or not.
Studies have found that reducing turbidity was more difficult to achieve on the
supernatant of a soil suspension compared to a whole soil suspension. It was
hypothesized that the particles in the supernatant are non-reactive with the PAM;
however, evidence to support this claim was not provided. This research sought to
determine the mechanisms of particle destabilization that allow flocculation of the soil
suspensions to occur. A protocol was developed to prepare soil suspensions that are
representative of runoff, i.e., primarily contain smaller particles that are more difficult to
settle out, to develop an understanding of how PAM may be utilized to flocculate the

17
finer particles. Soil suspensions of particular clay mineralogy have shown the clay
mineralogy to greatly influence the effectiveness of PAM. However, few studies have
evaluated the flocculation of suspensions with mixed types of clay mineralogy. This
research sought to develop insight into the properties that promote flocculation on soils
found across Texas.
In addition to PAM, the effectiveness of chitosan to promote flocculation has
focused on homogeneous clay suspensions. It has been shown to be effective, but an
understanding of its ability to promote flocculation in suspensions with mixed types of
clay mineralogy has not been studied. This research sought to develop an understanding
of chitosan’s ability to promote flocculation on Texas soils, as well as determine the
mechanisms of particle destabilization associated with these soil suspensions.

18
Chapter 3: Materials and Methods:
3.1 FIELD SAMPLING
The objective of field sampling was to develop an understanding of typical
turbidity values of runoff from highway construction sites as a function of site and
rainfall characteristics. Runoff samples were collected from three highway construction
projects in the northwest suburbs of Austin, Texas between November 2010 and March
2012. Project 1 was located on the eastbound shoulder of FM 1431 near the crossing
with Spanish Oak Creek. The project added an additional traffic lane and shoulder to an
existing road. Project 2 was located along FM 2769 west of RR 620. The project
converted an existing two-lane rural road into a four-lane road divided by a median.
Project 3 was the extension of US 183A in Cedar Park, Texas. This project constructed a
new controlled access highway.
Runoff samples were collected by manual grab sampling because the dynamic
nature of these construction sites prevented the installation of automatic sampling
equipment. Grab samples were taken during the rain event whenever possible. If the rain
had ended, samples were taken from the sedimentation pond where the runoff was
retained. Grab samples were collected with the bottle facing upstream. Care was taken
to ensure the bottle did not overflow and the sampling site was not disturbed by agitating
particles upstream. The samples were collected in plastic containers and analyzed within
7 days, typically within 48 hours. Samples were taken within the construction site to help
establish influent turbidity levels to potentially new treatment practices. When possible,
samples of runoff leaving the project boundary were also obtained.

19
Runoff sample analysis followed EPA method 180.1 with two modifications. The
method was developed for less turbid samples, i.e., drinking water, groundwater, etc., so
the method refers to a range of turbidity from 0 to 40 NTU. The first modification in the
methodology was to utilize this method with our turbidimeter (described below), which
has a range of 0 to 4,000 NTU. The samples were immediately transported to the Center
for Research in Water Resources (University of Texas, Austin, TX), where they were
analyzed for turbidity or stored in the 4˚C cold room to be analyzed within 7 days. This
was the second modification to the method as the methodology requires the analysis to be
performed within 48 hours. Typically, samples were analyzed within 48 hours, but for
one sampling event, analysis was performed after 48 hours. Therefore, 7 days was
utilized as the time that samples must be analyzed within. Turbidity measurements were
performed using a Hach 2100N Laboratory Turbidimeter (Hach Company, Loveland,
CO). The samples were gently shaken and the bubbles were allowed to dissipate prior to
turbidity measurement.
3.2 PARTICLE SIZE DISTRIBUTION
The objective of analyzing particle size distributions was to compare the soil
suspensions used in the flocculation tests with grab samples of runoff from rain events to
determine if the soil suspensions were representative of actual runoff. The particle size
distributions were determined using a Coulter Counter Multisizer III (Hialeah, FL). The
analysis was performed on grab samples from Project 3 and the soil suspension created
from soil at this construction site. The analysis was performed using three apertures of
30, 100, and 200 μm, allowing measurement of the particles in the (equivalent spherical)
size range of 1 to 40 μm.

20
3.3 SOIL SAMPLES FOR LABORATORY TESTS
Seven soil samples were collected at highway construction sites from across the
state of Texas through collaboration with the University of Texas at Austin, Texas A&M
University, and Texas Tech University. Grab samples of soils were collected from spoil
piles. The spoil piles are representative of the fill material typically used in the
construction of highways and are most vulnerable to being transported in the stormwater
runoff from construction sites. The properties of these seven soil samples were
determined by analysis at Midwest Laboratories, Inc. (Omaha, Nebraska) and are shown
in Table 3.1. As is standard practice in soil analysis, the designation of sand, silt, and
clay is based on the weight percent in various particle size ranges, with sand being all
material > 62.5 μm, clay being all material < 2 μm, and silt being everything in between.
The soils in Table 3.1 are arranged by calcium (Ca) content because multivalent
cations play an important role in the interactions between the PAM and the soil. The Ca
content of the soils varies by a factor of approximately eight. The cation exchange
capacity values correspond well with the Ca content. The Mg content varies among the
soils, but is small in comparison to the Ca content, indicating that Ca is the main
multivalent cation in these soils. The soils are mostly basic except for Hearne I and E.
Texas, which have a very low pH. The particle size distributions (i.e., sand, silt, and clay
content) of these soils vary widely. All of these properties are expected to influence their
mobilization during storms events and their subsequent treatability.

21
Table 3.1: Selected Properties of Soils used in Laboratory Tests.
Sample pH
Ca (mg /
kg)
Mg (mg /
kg)
CECa (meq /
100g)
Organic Matter
(%)
Sand
(%)
Silt
(%)
Clay
(%)
183ANBC 8.2 4618 149 24.9 1.1 28 36 36
College Station 9.3 3956 231 22.2 1.6 38 40 22
W Loop 8.3 3222 434 20.7 0.7 52 28 20
127 Lub 7.8 2066 509 16.6 0.7 58 22 20
Hearne I 4.8 1195 371 17.8 1.5 18 30 52
Hearne II 7.8 569 64 3.5 0.2 86 6 8
E Texas 5.0 621 134 7.4 0.5 60 12 28 a Cation exchange capacity
3.4 MODIFIED SYNTHETIC STORMWATER RUNOFF
A modified synthetic stormwater runoff was created for each soil sample such that
it had a turbidity of 1500 NTU (+/- 300 NTU). The turbidimeter used for synthetic
runoff and jar tests was a Hach Ratio/XR Turbidimeter (Hach Company, Loveland, CO)
and has an upper limit of 2,000 NTU. Therefore, 1500 NTU was selected as a
standardized value, so that a comparison could be made between modified synthetic
runoff of similar initial turbidities. By creating a set of samples with similar turbidity but
from different soil types, the laboratory evaluation could focus on the effects of the soil
characteristics directly and exclude the effects of overall particle (mass) concentration.
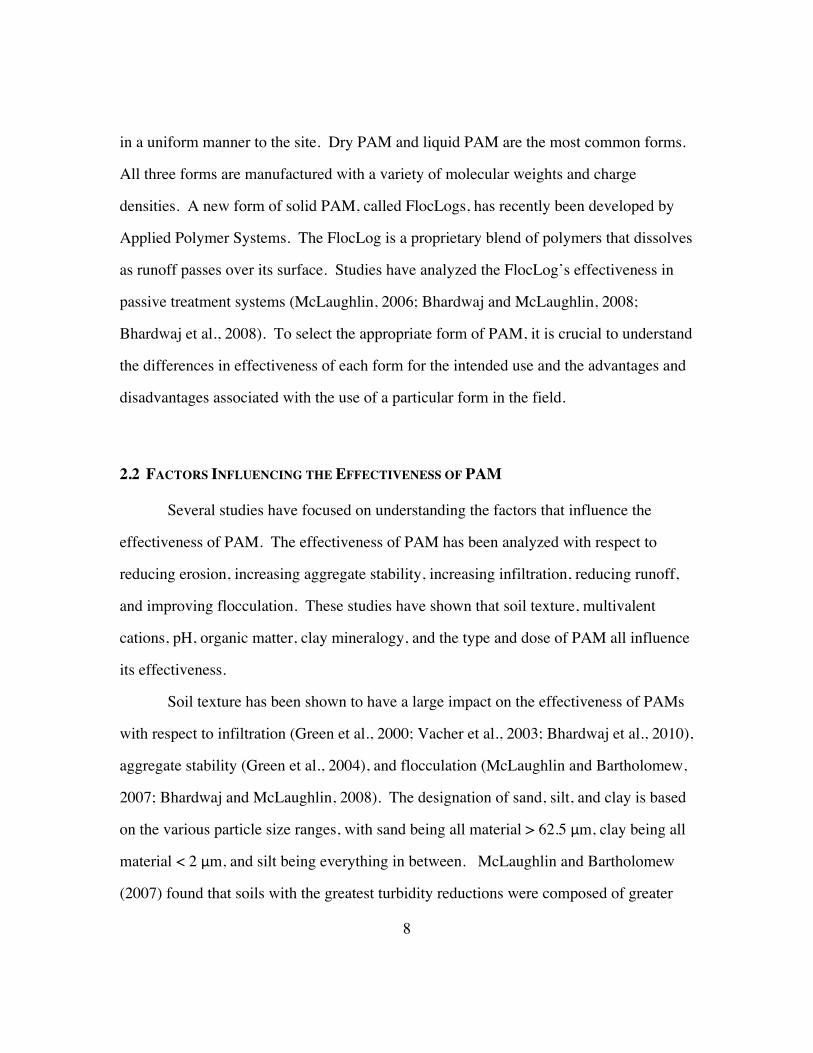
The modified synthetic stormwater runoff was prepared through an iterative
approach. Initially, a six liter soil suspension of 15 g/L was prepared in the decanter
(Figure 3.1). This soil suspension was then rapid mixed mechanically for five minutes.
The suspension was then allowed to settle for 2 minutes and 37 seconds. This time

22
allows large particles that would typically settle out quickly in runoff to settle out of the
modified synthetic stormwater runoff being created. Accounting for Stokes’ Law and the
height of the ports on the decanter, 2 minutes and 37 seconds should allow all particles 25
μm and larger to settle out of the suspension.
A sample of the soil suspension was then taken and measured for turbidity. If the
soil suspension’s turbidity was less than 1,200 NTU, then a known amount of soil was
added to the suspension and the process was iterated. This process was repeated until the
soil suspension’s turbidity fell within the specified range of 1,200 to 1,800 NTU. Once
this target turbidity was obtained, the process was iterated one more time without adding
any soil and after 2 minutes and 37 seconds, the soil suspension was decanted into a large
storage container. This process was repeated at least three times such that over nine liters
of modified synthetic stormwater runoff was created for each soil for use in laboratory
tests.
Figure 3.1: Decanter used to remove large particles from soil suspension.

23
3.5 FLOCCULANTS
Nine flocculant products were used in this study, which covered a range of
molecular weights and charge densities (Table 3.2). The molecular weight of the
polyacrylamides ranged from 0.2 to 14 Mg mol-1, and the charge densities ranged from
neutral to 50% anionic molar charge. Cationic PAM products were not included in this
study due to their toxicity to aquatic life. The PAM products with known properties
included LMW SF N300, SF N300, A110, A130, A150, A110 HMW, Cyanamer (P-21)
(Kemira, CT). A cationic polymer, chitosan, was also included in this study due to its
effectiveness as a positively charged polymer. Furthermore, it has been accepted by
Washington State to be suitable on construction sites as long as the residual concentration
is below 0.2 mg/L (WA State Department of Ecology, 2007). A PAM with unknown
properties was also included in this study: APS #705 (Applied Polymer Systems, GA). It
was included in this study due to its effectiveness on soils that did not flocculate well in
McLaughlin and Bartholomew’s (2007) study. Stock solutions of PAM (0.1 g/L and 10
g/L) were prepared with DI water and stirred for 24 hours at room temperature.

24
Table 3.2: Molecular weight and charge density of flocculants.
PAM Type Molecular Weight (Mg mol-1)
Charge Density (%)
SF N300 15 Neutral LMW SF N300 6 Neutral
A 110 10-12 16 A 130 10-12 33 A 150 10-12 50
A 110 HMW 10-14 16 Cyanamer P-21 0.2 10
Chitosan NA Positive APS #705 NA NA
3.6 FLOCCULATION TESTS
The objective of the flocculation tests was to determine the effectiveness of a
variety of different flocculants and different doses of each flocculant on each of the seven
soils. To create homogeneous samples of the modified synthetic runoff for each
individual jar test, a Dekaport Cone Sample Splitter (Rickly Hydrological Company, OH)
was used. The large collection container was mixed well and the contents were poured
into the top of the splitter. The splitter divided the modified synthetic runoff into 10
Erlenmeyer flasks. From these flasks, 200 mL of modified synthetic runoff were
measured and poured into the jars for testing. The jars were specially constructed from
acrylic, with a square cross-section 5.15 cm per side. Mixing was provided through a
standard jar test apparatus (Phipps and Bird, Richmond, Va) with paddles cut down to a
length of 3.4 cm.
The jar tests comprised a rapid mix, slow mix, and settling period. The tests
performed in this study emulated the conditions that are likely to be encountered in the

25
field as well as possible; these conditions generally mean very short detention times in
any treatment unit. Therefore, the duration of rapid mix, slow mix, and settling period
were much shorter than a typical jar test done for drinking water treatment. Each jar was
rapidly mixed on a magnetic stirrer for one minute to ensure that all of the particles were
suspended prior to the start of the jar test. The initial turbidity was then measured on a
sample. A specific dose of flocculant was then added during the rapid mix (1000 rpm) on
a magnetic stirrer for 15 seconds. The jar was then moved onto the jar test apparatus
where it was slow mixed (60 rpm) for 5 minutes. The slow mix was followed by a 5
minute settling period. After this time, the final turbidity was measured on a sample
taken from the top 2.5 cm of the jar.
A matrix of jar tests was run testing each modified synthetic stormwater runoff
with each type of polymer. For each combination, a series of jar tests was run with
polymer doses of 0.03, 0.1, 0.3, 1.0, 3.0, and 10.0 mg/L to determine the effect that dose
had on the resulting turbidity. These polymer doses were below the reported threshold
concentration for toxicity (Barvenik, 1994). In some circumstances, jar tests were run
with higher doses up to 300 mg/L to determine the dose at which overdosing occurs. A
control with no polymer added was also included for each suspension.
3.7 HARDNESS TESTS
For the flocculation tests performed on the SF N300 series with each modified
synthetic stormwater runoff, the hardness was also measured before and after
flocculation. This procedure was included because it appeared in preliminary
experiments that the calcium content of the soil had a substantial effect on the jar test
results for this flocculant. Measuring the hardness (a lumped measure of the sum of

26
calcium and magnesium) would allow one to see if the calcium was actually participating
in the reaction and being removed along with particles in the jar test. The hardness tests
were performed according to the EDTA titrimetric method in Standard Methods (APHA
et al., 2005).
3.8 ELECTROPHORETIC MOBILITY TESTS
Electrophoretic mobility tests, using the Zetaphoremeter IV (CAD, France), were
performed in conjunction with flocculation tests for the 183ANBC and E. Texas modified
synthetic stormwater runoff samples to determine the effect that each polymer had on the
surface charge of the particles. The Zetaphoremeter IV applies an electric field, which
causes particles to move as a function of their surface charge. The moving particles are
automatically tracked using digital image processing. The Zetaphoremeter IV is then
able to determine the electrophoretic mobility, i.e., the velocity divided by the field
strength. The zeta potential is then calculated from the electrophoretic mobility using the
Smoluchowski equation. The polymers used in these tests were LMW SF N300, SF
N300, A110, A130, A150, APS #705, and chitosan. The optimal dose determined in the
flocculation tests was used for each polymer.
The Zetaphoremeter IV has the ability to determine the electrophoretic mobility
of many particles in a suspension at one time. However, when too many particles are
present in the cell, it becomes difficult for the software to track individual particles.
Furthermore, the particles may collide with one another causing a change in the
electrophoretic mobility of the particles. Particle collisions may be observed in the
sequences of each trial. The sequences are an image showing the trajectories of each
tracked particle. The sequences were analyzed for each trial as a means of quality control
27
to ensure that the particles were properly tracked and did not collide with one another.
Trials with poor sequences, i.e., those where collisions were observed or had trajectories
that deviated from the video, were discarded.
Dilutions were prepared for turbid samples to reduce the number of particles
present in the cell such that collisions would not occur. The water used for the dilutions
was filtered synthetic stormwater. The filtration was done, so that the ionic strength of
the sample would not be changed during the dilutions. A filter of 0.45 μm was used,
which removes all the particles in the synthetic stormwater. Dilutions were performed
such that the number of particles tracked was below 150. In few cases, trials that tracked
slightly more than 150 particles were used if the sequence and histogram were
satisfactory, i.e., no collisions observed and a normal distribution. This procedure was
only done when it was difficult to obtain satisfactory trials with less than 150 particles.
The output of the electrophoretic mobility tests is a histogram of the
electrophoretic mobility of each suspension. The histogram is generally normally
distributed. During the experiments, a distinct peak at a zeta potential of zero was
observed for many trials. The peak of zeros was due to the cell of the zetaphoremeter
being dirty. The particle tracking software would “track” the “dirt” on the cell wall,
which does not move. Therefore, the particle tracking software would count this “dirt”
on the cell wall as a particle with an electrophoretic mobility of zero. This error was
easily recognized in histograms of each trial by a peak at zero. After the cell wall was
cleaned, the peak of zeros was no longer observed (Appendix A).
Prior to cleaning, the peak of zeros was only observed in some trials. Therefore,
in order to use the data prior to cleaning, the histogram of each trial was analyzed to
determine if the trial had a peak of zeros. Those trials that had a peak of zeros were

28
discarded. Trials that had a good sequence, tracked less than 150 particles, and had a
normally distributed histogram were considered good data and used in the results.
A two-sample assuming unequal variances t-Test was performed on the results
from the electrophoretic mobility tests to determine if the distributions were significantly
different from one another as a result of flocculant addition. A P-value of 0.05 was
selected to determine significance.
3.9 X-RAY DIFFRACTION (XRD) TESTS
X-ray Diffraction (XRD) tests were performed to determine the clay mineralogy
of each soil suspension. Samples were prepared utilizing a decantation procedure to
separate the clay fraction from the silt and sand fraction of the soil suspension according
the methods outlined by the U.S. Geological Survey (2001). The decanted sample was
filtered using a 0.45 μm filter. The filter was allowed to air dry for 15 minutes. A small
metal spatula was then used to scrape the sample from the filter. Care was taken to
ensure that the filter was not scraped off along with the samples, which would interfere
with results. The sample was then placed on a glass slide. A few drops of ethanol were
placed on top of the sample and the slide such that the sample would stick to the glass.
The sample was then placed in the Philips Vertical Scanning Theta-2Theta
Diffractometer (Philips Analytical, Netherlands). The sample was scanned from 5 to 45
degrees with a two second dwell time and a 0.04 step size. Analysis of the spectra
resulting from the XRD test was performed using the program Jade (MDI,CA). Moore
and Reynolds (1997) was used as a supplemental reference to identify the clay
mineralogy of the peaks in the spectra.

29
Chapter 4: Results and Discussion:
4.1 FIELD SAMPLING
Severe drought conditions have persisted in central Texas since September 2010,
making stormwater runoff sampling difficult. Over the three project sites, 15 samples
were collected on ten dates during the study period. As shown in Table 4.1, turbidity
levels ranged from 35.5 to > 4,000 NTU. Samples were taken within the limits of
construction. Discharge was not always occurring at the sampling time due to sediment
control practices, dry soil conditions, low rainfall intensities, and timing of sampling
trips.
Management practices used on sampled areas of the construction project included
silt fencing and sedimentation ponds. Due to the limited number of samples, it is difficult
to make conclusions about the effectiveness of particular management practices. The
data shows that the turbidity varies based on rainfall intensity, duration of rainfall,
amount of bare soil, best management practices, and various other factors. The turbidity
observations were consistent with a previous study in the Austin area, which documented
turbidity values ranging from 79 to 2,160 NTU in runoff from highway construction sites
(Barrett et al., 1995). Overall, the data suggests that the runoff from construction sites is
very turbid and existing control practices may have difficulty consistently meeting the
new regulatory threshold.

30
Table 4.1: Turbidity in Construction Site Runoff from Three Projects.
Project 1 Project 2 Project 3
Date Rainfall
(mm) Turbidity
(NTU) Rainfall
(mm) Turbidity
(NTU) Rainfall
(mm) Turbidity
(NTU)
11/2/2010 4.3 2440.0 2.8 420.0 - -
1/15/2011 7.1 35.5 3.6 66.2 - -
1/15/2011 13.2 53.2 6.9 445.0 - -
5/12/2011 17.8 203.0 37.8 >4000 10.7 >4000
5/25/2011 - - - - 7.9 1256
6/22/2011 - - - - 34.8 >4000
10/8/2011 - - - - 6.9 >4000
10/9/2011 - - - - 48.5 >4000
11/8/2011 - - - - 4.8 565.0
11/15/2011 6.9 66.7 - - 6.6 1083.0
4.2 MODIFIED SYNTHETIC STORMWATER RUNOFF
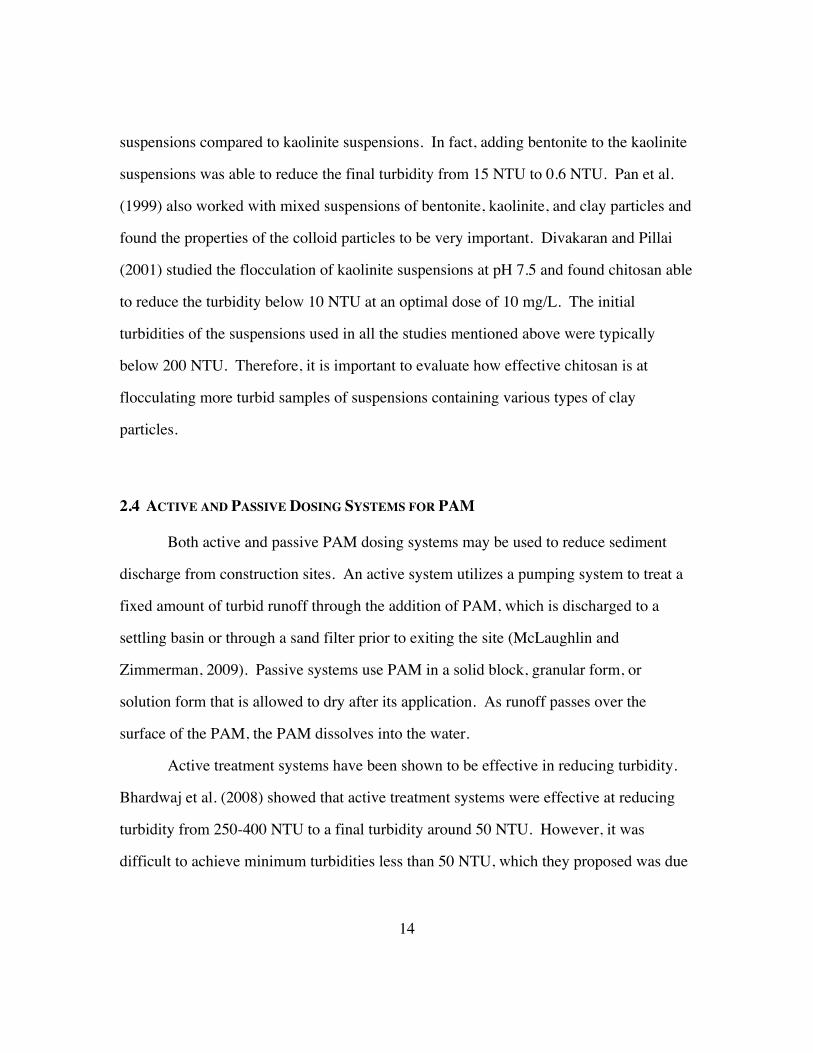
Particle size distributions were measured to determine how well the modified
synthetic stormwater runoff represented the sampled stormwater runoff; the results are
shown as the particle size distribution function in Figure 4.1. The ordinate on this figure
is the logarithm of the normalized number concentration, i.e., the number concentration
in a small increment of size (ΔN) is divided by the size increment (Δdp). The benefit of
this normalization is that measurements made by different instruments (with different
size increments) should be directly comparable. For all three samples, the number
concentration drops dramatically with increasing size.

31
Figure 4.1: Particle Size Distribution Functions of the Modified Synthetic Stormwater Runoff and the Runoff Sampled from US 183A.
The particle size distributions for the two stormwater runoff (grab) samples were
quite similar. The amount of rainfall associated with the grab samples from 5/13/2011
and 6/22/2011 was 0.24 and 1.4 in, respectively. However, this difference in rainfall did
not greatly impact the particle size distributions. At the same time, the two particle size
distribution functions are not identical, and these differences likely reflect some
variations in rainfall intensity along with several other factors.
The modified synthetic stormwater runoff appears to model the sampled
stormwater runoff well for the number concentration of smaller particles. However,
some inconsistency between the synthetic and sampled stormwater runoff is apparent.
The modified synthetic stormwater runoff has a greater number of large particles (dp >
5µm) than the sampled runoff, which means they make up a greater fraction of the total
0
1
2
3
4
5
6
7
8
1.0 10.0
log
(ΔN
/Δd p
)
Particle Diameter (µm)
Grab Sample 6/22/2011
Grab Sample 5/13/2011
Synthetic Stormwater Runoff
2.0 5.0 20.0

32
particles in the modified synthetic stormwater runoff compared to the sampled
stormwater runoff.
The greater number of larger particles in the modified synthetic stormwater runoff
is understandable for two reasons. The decanting step in creating the modified synthetic
stormwater primarily removes particles larger than 25 µm and is quite rapid. Therefore, a
number of large particles (but still smaller than 25 µm) remain in suspension. Hence,
observation of the flocculation tests show that, even when no flocculant is added
(control), the turbidity is still reduced and larger particles settle out. Since the settling
period of 5 minutes is longer than the settling time of 2 minutes 37 seconds in the
decanting step, the settling out of more particles is expected. The other reason that the
sampled stormwater runoff has fewer larger particles is a result of sampling from a
sedimentation pond located on site; it was not possible to sample the runoff prior to
entering the detention pond. The samples were taken during the storm event, but the
amount of time the stormwater runoff was in the detention pond is unknown. Therefore,
it is likely that larger particles of the stormwater runoff would have settled to the bottom
of the sedimentation pond, resulting in fewer large particles being collected in the grab
sample.
Actual stormwater runoff also has the ability to convey more of the smaller
particles. As the runoff moves over the soil, the particles that are easy to suspend are the
smallest particles. The suspension comprising large quantities of small particles is
reflected in the measurement of turbidity, as the turbidity is most influenced by the
smallest particles. For this reason, the turbidities of the sampled stormwater runoff were
over 4,000 NTU for both events for which particle size distributions was determined,
while the synthetic suspension was around 1,400 NTU (Data not shown).

33
4.3 FLOCCULATION TESTS
The flocculation tests were performed to understand the soil characteristics,
polymer characteristics, and doses that promote flocculation. For each modified
synthetic stormwater runoff, turbidity curves as a function of polymer dose added were
generated. Comparison of these curves and the soil characteristics gives insight about the
interactions between the PAM and the particles in the modified synthetic stormwater
runoff.
Interparticle bridging is commonly accepted as the mechanism by which PAM
interacts with soils to destabilize particles. Since particles are negatively charged, they
repel one another. Interparticle bridging may overcome this repulsion if the polymer is
able to span the distance between two particles, thereby forming a floc. The polymer’s
ability to bridge two particles is referred to as its grappling distance and is a function of
its molecular weight. The higher the molecular weight of the polymer, the longer its
grappling distance. Therefore, flocculants with higher molecular weights are expected to
be more effective at promoting flocculation due to their improved ability to bridge
particles.
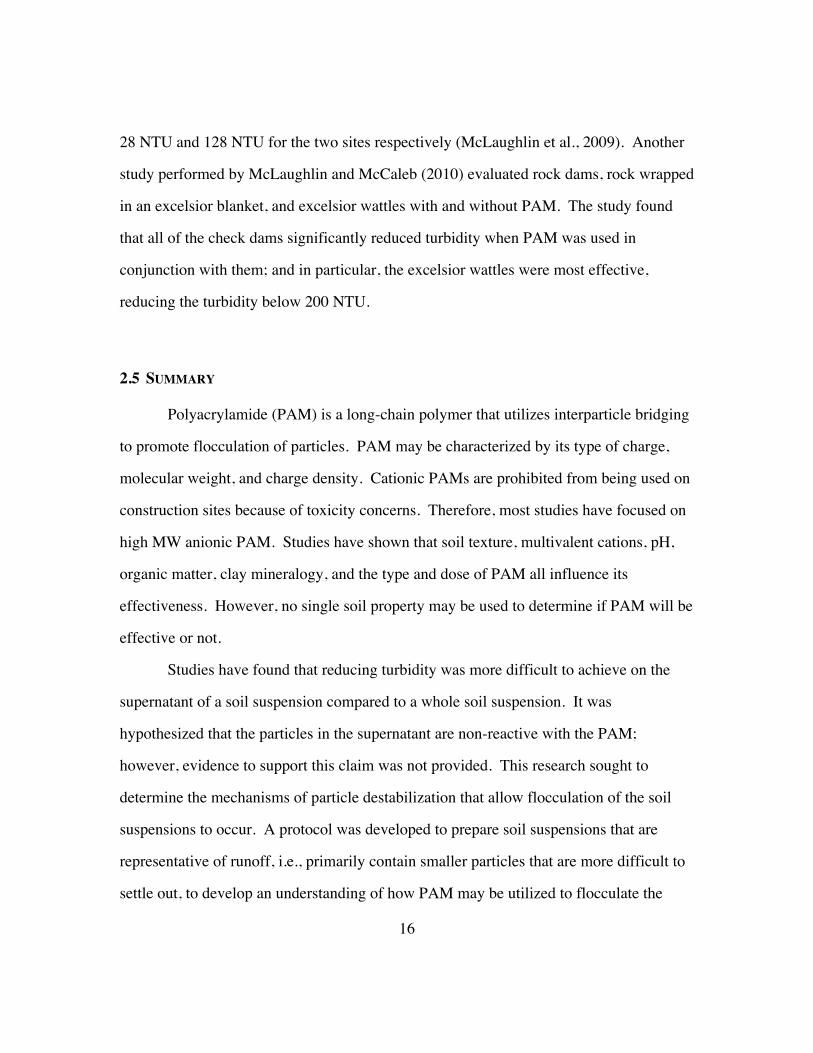
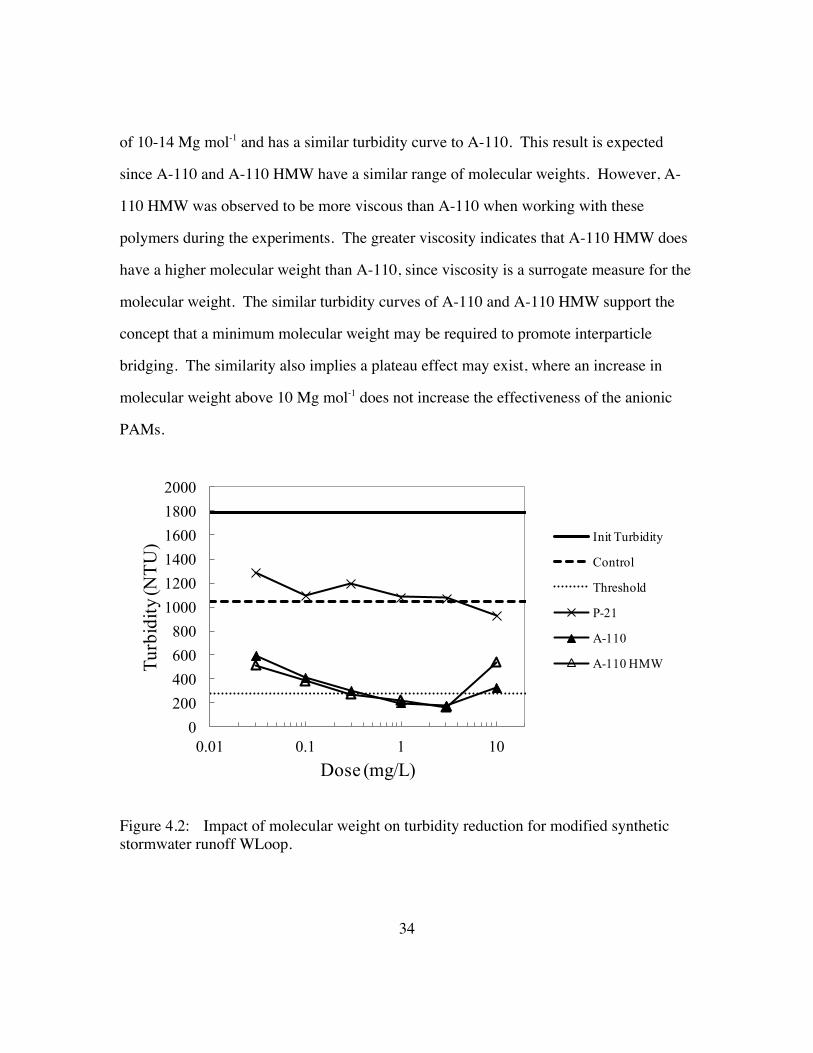
Figure 4.2 shows the turbidity curves for the modified synthetic stormwater runoff
of WLoop for the polymers P-21, A-110, and A-110 HMW. The objective of these tests
was to determine how molecular weight effects turbidity reduction. PAM P-21 is clearly
ineffective at reducing the turbidity. It also had the lowest molecular weight of 0.2 Mg
mol-1 indicating a minimum grappling distance to effectively bridge particles in the
suspension may exist. A-110 had a higher molecular weight of 10-12 Mg mol-1 and was
effective at reducing the turbidity below 280 NTU. A-110 HMW had a molecular weight
34
of 10-14 Mg mol-1 and has a similar turbidity curve to A-110. This result is expected
since A-110 and A-110 HMW have a similar range of molecular weights. However, A-
110 HMW was observed to be more viscous than A-110 when working with these
polymers during the experiments. The greater viscosity indicates that A-110 HMW does
have a higher molecular weight than A-110, since viscosity is a surrogate measure for the
molecular weight. The similar turbidity curves of A-110 and A-110 HMW support the
concept that a minimum molecular weight may be required to promote interparticle
bridging. The similarity also implies a plateau effect may exist, where an increase in
molecular weight above 10 Mg mol-1 does not increase the effectiveness of the anionic
PAMs.
Figure 4.2: Impact of molecular weight on turbidity reduction for modified synthetic stormwater runoff WLoop.
0200400600800
100012001400160018002000
0.01 0.1 1 10
Turb
idity
(NTU
)
Dose (mg/L)
Init Turbidity
Control
Threshold
P-21
A-110
A-110 HMW

35
The effect of charge density on flocculation is shown in Figure 4.3. The non-
ionic PAM, SF N300, is the most effective polymer. A-110, which has a charge density
of 16%, is less effective than the non-ionic PAM, but is more effective than A-150, which
has the highest charge density of 50%. The turbidity curves clearly indicate that as
charge density increased, the effectiveness of PAM decreased. This trend occurred in all
the synthetic runoff samples that were tested. Intuitively, this trend is expected. The
particles are negatively charged; therefore, the addition of an anionic PAM would
increase the negative charge on the particle surfaces, making them more difficult to
flocculate. Flocculation will occur if the grappling distance of the PAM is able to
overcome these repulsive forces. The addition of a non-ionic PAM however, does not
increase the charge of the particles and therefore it would be expected to be the most
effective. Nasser and James (2006) found as the charge density increased, the
effectiveness of the flocculant decreased for kaolinite suspensions. The results of the
flocculation tests with synthetic runoff demonstrate that the same trend observed by
Nasser and James (2006) applies to synthetic runoff.

36
Figure 4.3: Effect of charge density on flocculation for modified synthetic stormwater runoff WLoop.
Furthermore, Figure 4.3 shows a difference between the optimal dose of anionic
PAMs and non-ionic PAM. The optimal dose for SF N300 was 10 mg/L (Appendix B)
compared to the optimal dose for the anionic PAMs of 3 mg/L. The optimal dose for the
anionic PAMs and the non-ionic PAM was found to vary between 1-3 mg/L and 10
mg/L, respectively, for all the synthetic runoff tested (Appendix B). These optimal doses
agree with the results of Nasser and James (2006). Their study observed the optimal dose
for anionic PAMs was lower than those of non-ionic PAMs for kaolinite suspensions.
The lower optimal dose was a result of the anionic PAMs’ ability to form loops and tails
due to its anionic charge, while the non-ionic polymer was not able to form these loops
and tails. Figure 4.3 demonstrates that the optimal dose for anionic PAM is lower than
that of non-ionic PAM for synthetic runoff, which Nasser and James (2006) found with
kaolinite suspensions.
0200400600800
100012001400160018002000
0.01 0.1 1 10
Turb
idity
(NTU
)
Dose (mg/L)
Init Turbidity
Control
Threshold
SF N300
A-110
A-150

37
Figure 4.4 shows the polymers that were most effective in reducing the turbidity
of the synthetic runoff WLoop. The non-ionic PAMs, SF N300 and LMW SF N300,
were able to reduce the turbidity to 20 and 55 NTU, respectively. The molecular weight
of these PAMs was 15 and 6 Mg mol-1, respectively. SF N300, with its higher molecular
weight, was found to be more effective than the LMW SF N300 for all the runoff tested.
This confirms the previous trend found with anionic PAMs, which indicated that higher
molecular weights are more effective to a certain threshold. APS #705 was also effective
at promoting flocculation and reduced the turbidity to 23 NTU at its optimal dose. The
turbidity curve of APS #705 was nearly identical to the curve of SF N300 indicating APS
#705 may have similar charge characteristics to the non-ionic PAM. Furthermore, the
flocs created by APS #705 were similar to all the PAMs in that they were “fluffy”. These
fluffy flocs indicate that interparticle bridging is occurring. The flocs formed by chitosan
were denser. The denser flocs are expected to be observed as the mechanism of particle
destabilization with chitosan is a combination of charge neutralization and interparticle
bridging.

38
Figure 4.4: Most effective flocculants for modified synthetic stormwater runoff WLoop.
The optimal dose of chitosan was 3 mg/L, beyond which restabilization occurred.
The optimal dose associated with chitosan depends on its mechanism of particle
destabilization. Depending on the soil suspension, the dominant mechanism of particle
destabilization may be charge neutralization or interparticle bridging (Patience et al.,
2003). When charge neutralization is the dominant mechanism of particle
destabilization, the optimal dose will be the dose at which the zeta potential is zero. The
cationic polymer will adsorb to the surfaces of the particle, which neutralizes the charge
of the particle until it is zero. Restabilization will occur when the adsorption of chitosan
to the particles causes the particles to have a net positive charge, thereby causing particles
to repel one another. When interparticle bridging is the dominant mechanism of particle
destabilization, overdosing of chitosan will be the same as overdosing with PAM.
Restabilization will occur when the adsorption sites on the particle are saturated by
chitosan to the extent that flocs are prevented from forming. The optimal dose of
0200400600800
100012001400160018002000
0.01 0.1 1 10 100
Turb
idity
(NTU
)
Dose (mg/L)
Init Turbidity
Control
Threshold
SF N300
LMW SF N300
APS #705
Chitosan

39
chitosan was found to range from 1 to 10 mg/L for all the synthetic runoff that was tested
(Appendix B), which indicates the mechanism of particle destabilization may be different
for the various samples of synthetic runoff.
Restabilization of the non-ionic PAMs and APS #705 is a result of overdosing the
synthetic runoff, which is the same restabilization that occurs for chitosan when
interparticle bridging is its mechanism of particle destabilization. The restabilization of
the non-ionic PAMs and APS #705 was observed for all the synthetic runoff tested
beyond the optimal dose of 10 mg/L (Appendix B). The non-ionic PAMs, APS #705,
and chitosan were found to be the most effective at promoting flocculation for all the
synthetic runoff tested. In particular, SF N300, APS #705, and chitosan were able to
reduce the turbidity of the synthetic runoff below 280 NTU for all the synthetic runoff
tested. The LMW SF N300 was able to reduce the turbidity below 280 NTU for all but
one synthetic runoff, E. Texas, and was the lease effective of these four polymers.
4.4 HARDNESS TESTS
Hardness tests were performed in conjunction with jar tests to develop an
understanding of how the concentration of polyvalent cations affects flocculation. Figure
4.5 shows both the turbidity and remaining hardness of the Hearne II modified synthetic
stormwater runoff after flocculation by SF N300. The results show that as the turbidity
was reduced, the hardness was reduced as well. Each of the six modified synthetic
stormwater runoff samples had similar reductions of turbidity and hardness with this
polymer (Appendix C). The corresponding reductions in turbidity and hardness indicate
that interparticle bridging is the mechanism of flocculation and that calcium is

40
participating in the coagulation directly. Whether calcium is adsorbing onto the surfaces
of the particles, complexing with the polymer, or perhaps precipitating is unclear.
Figure 4.5: Turbidity and Hardness Curves for SF N300 on Modified Synthetic Stormwater Runoff of Hearne II.
The role of calcium in particle destabilization suggests that as the calcium content
of the soil suspension increases, the suspension will flocculate more readily. Figure 4.6
shows the turbidity curves associated with A-110 with the corresponding calcium content
in mg/L in parentheses. No clear trend between calcium content and the effectiveness
exists. Therefore, while calcium may participate in flocculation and facilitate
interparticle bridging, it is not crucial for flocculation to be effective. Hydrogen bonding
between the polymers and the particles is the main mechanism by which interparticle
bridging occurs and will occur in the presence or absence of calcium. As a result, the
0
3
6
9
12
15
18
0
200
400
600
800
1000
1200
1400
1600
0.01 0.1 1 10
Har
dnes
s (m
g C
aCO
3/L)
Turb
idity
(NTU
)
Dose (mg/L)
41
calcium content of the soil suspension is not a good parameter to judge whether PAM
will effectively reduce the turbidity.
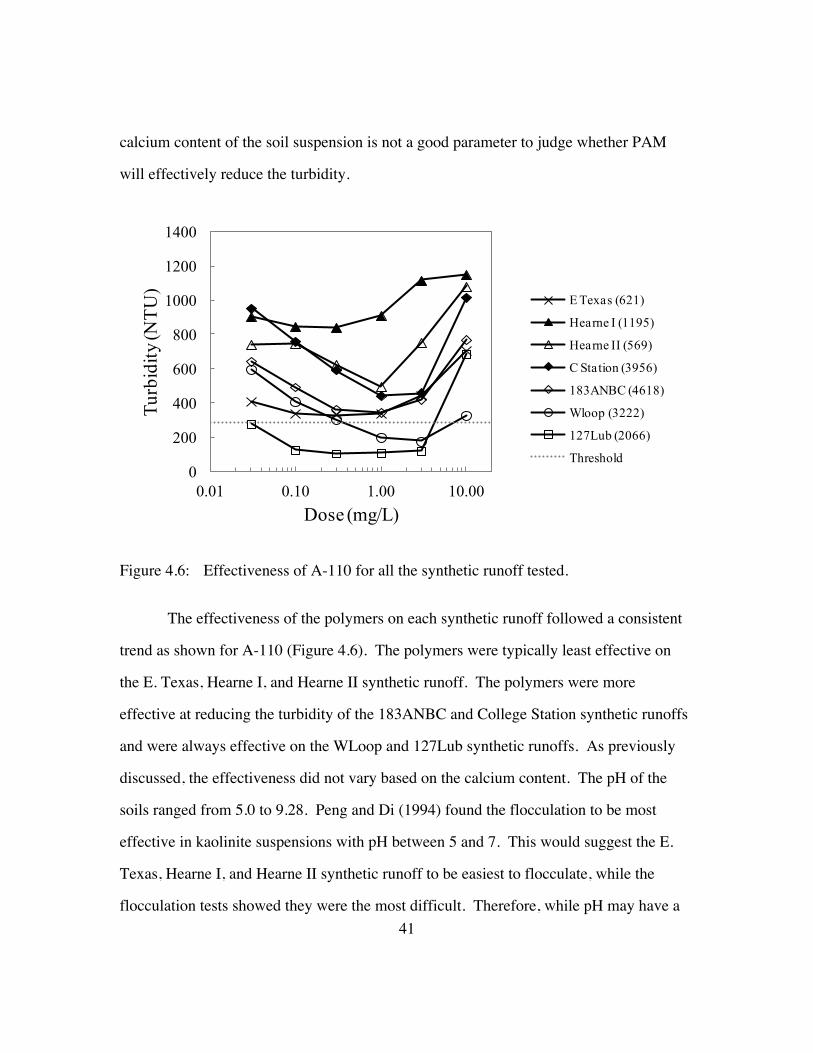
Figure 4.6: Effectiveness of A-110 for all the synthetic runoff tested.
The effectiveness of the polymers on each synthetic runoff followed a consistent
trend as shown for A-110 (Figure 4.6). The polymers were typically least effective on
the E. Texas, Hearne I, and Hearne II synthetic runoff. The polymers were more
effective at reducing the turbidity of the 183ANBC and College Station synthetic runoffs
and were always effective on the WLoop and 127Lub synthetic runoffs. As previously
discussed, the effectiveness did not vary based on the calcium content. The pH of the
soils ranged from 5.0 to 9.28. Peng and Di (1994) found the flocculation to be most
effective in kaolinite suspensions with pH between 5 and 7. This would suggest the E.
Texas, Hearne I, and Hearne II synthetic runoff to be easiest to flocculate, while the
flocculation tests showed they were the most difficult. Therefore, while pH may have a
0
200
400
600
800
1000
1200
1400
0.01 0.10 1.00 10.00
Turb
idity
(NTU
)
Dose (mg/L)
E Texas (621)
Hearne I (1195)
Hearne II (569)
C Station (3956)
183ANBC (4618)
Wloop (3222)
127Lub (2066)
Threshold

42
role in aiding flocculation, it is not a parameter that may be used to judge the
effectiveness of using PAM.
4.5 ELECTROPHORETIC MOBILITY TESTS
Electrophoretic mobility tests were performed in conjunction with jar tests to
determine how the polymers affected the charge of the particles. The output of these tests
is a histogram, which shows the distribution of electrophoretic mobilities for the soil
suspension. Figure 4.7 gives an example of the output of these tests showing the
distribution of zeta potential for the 183ANBC soil suspension without any polymer
addition. The average zeta potential for this suspension was -17.13 mV and had a
standard deviation of 10.15.
Figure 4.7: Histogram of Zeta Potential for Particles of 183ANBC Modified Synthetic Stormwater Runoff.
0
5
10
15
20
25
30
-50
-45
-40
-35
-30
-25
-20
-15
-10 -5 0 5 10
15
20
25
30
35
40
45
50
Perc
enta
ge (%
)
Zeta Potential (mV)

43
The effect that each polymer has on the zeta potential of the 183ANBC synthetic
runoff is shown in Figure 4.8. The first trend that is apparent is as the charge density of
the anionic polymers increase, the zeta potential becomes more negative. As the zeta
potential becomes more negative, the particles become more stable; however,
flocculation may still occur if interparticle bridging is able to destabilize the particles.
The anionic PAMs all have the same molecular weight, which influences grappling
distance, giving them all the same ability to destabilize particles via interparticle
bridging. As a result, as the charge density increases, it is more difficult to destabilize the
particles. The flocculation tests confirmed this trend, as an increase in charge density
resulted in an increase in turbidity as previously discussed.
Figure 4.8: Average Zeta Potentials with 95% Confidence Limits for 183ANBC Modified Synthetic Stormwater Runoff.
Furthermore, Figure 4.8 shows that the non-ionic PAMs did not make the zeta
potential more negative, but actually had average zeta potentials more positive than the
---+---------+---------+---------+------183A (No Flocculant) (-*-)
A-110 (-*--)A-130 (-*--)A-150 (--*-)
LMW SF N300 (--*-)SF N300 (-*-)
APS #705 (*)Chitosan (*)
---+---------+---------+---------+------ -30 -20 -10 0
Zeta Potential (mV)

44
control. The positive increase in zeta potential is a result of the polymer binding to the
particles, thereby causing a shift in the plane of shear, which makes the particles less
stable (Patience et al., 2003; Nasser and James, 2006). APS #705 also slightly increased
the zeta potential in a positive manner similar to the non-ionic PAMs. During the
flocculation tests, it was observed that the turbidity curves for APS #705 was similar to
that of the non-ionic PAMs indicating APS #705 may have charge characteristics similar
to the non-ionic PAMs. The similar electrophoretic mobility tests support this and
indicate that interparticle bridging is the mechanism of particle destabilization. Chitosan
was the only polymer that neutralized the zeta potential of the soil suspension. The
positive increase in zeta potential was expected due to its cationic nature and suggests
that charge neutralization is the mechanism of particle destabilization for the 183ANBC
synthetic runoff.
Electrophoretic mobility tests were also performed on the E. Texas modified
synthetic stormwater runoff, which showed some slightly different trends (Figure 4.9).
The anionic PAMs did not cause as large a change in the zeta potential as with the
183ANBC suspension. The average zeta potential was similar to the control. The non-
ionic PAMs, APS #705, and chitosan all significantly increased the zeta potential in a
positive manner, which was also observed for the 183ANBC suspension. The decrease in
the zeta potential is potentially a result of the polymer binding to the particles causing a
shift in the plane of shear as was described for the non-ionic PAMs on the 183ANBC
suspension. These four flocculants were also the most effective. The results suggest the
main mechanism of particle destabilization for these flocculants was interparticle
bridging, since none of these flocculants neutralized the zeta potential. It is possible that
charge neutralization is occurring in conjunction with interparticle bridging for chitosan;
however, the dominant mechanism of particle destabilization of chitosan for the E. Texas
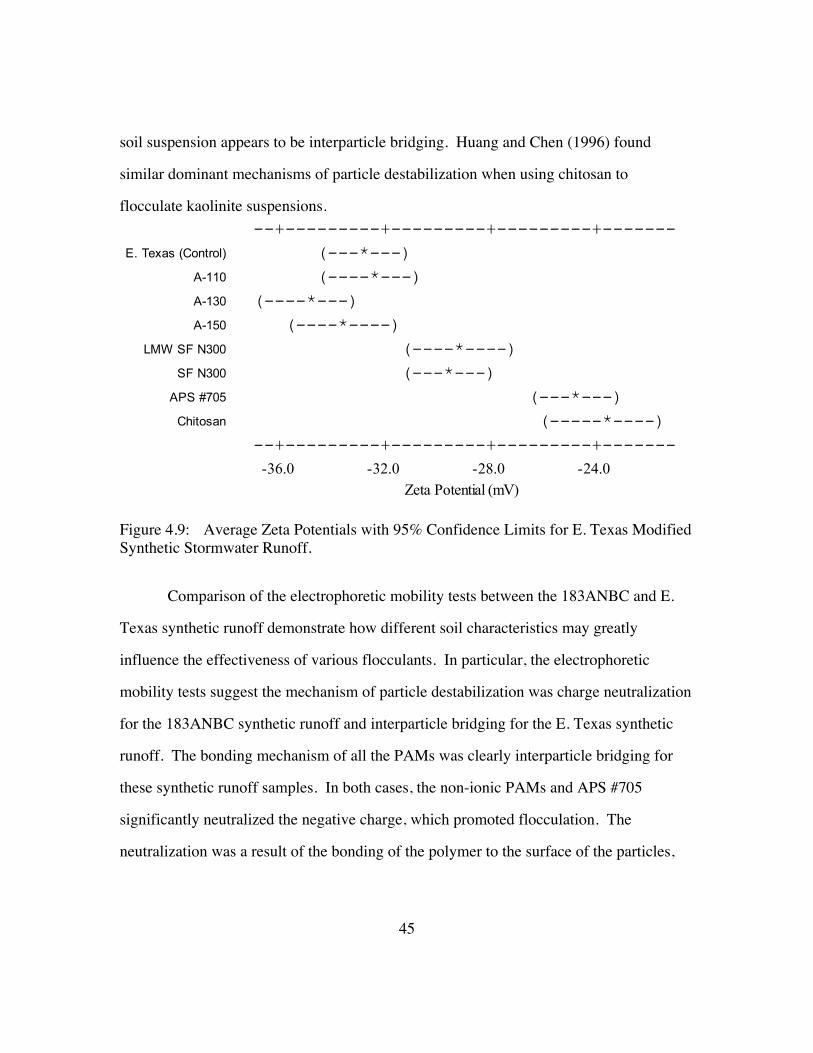
45
soil suspension appears to be interparticle bridging. Huang and Chen (1996) found
similar dominant mechanisms of particle destabilization when using chitosan to
flocculate kaolinite suspensions.
Figure 4.9: Average Zeta Potentials with 95% Confidence Limits for E. Texas Modified Synthetic Stormwater Runoff.
Comparison of the electrophoretic mobility tests between the 183ANBC and E.
Texas synthetic runoff demonstrate how different soil characteristics may greatly
influence the effectiveness of various flocculants. In particular, the electrophoretic
mobility tests suggest the mechanism of particle destabilization was charge neutralization
for the 183ANBC synthetic runoff and interparticle bridging for the E. Texas synthetic
runoff. The bonding mechanism of all the PAMs was clearly interparticle bridging for
these synthetic runoff samples. In both cases, the non-ionic PAMs and APS #705
significantly neutralized the negative charge, which promoted flocculation. The
neutralization was a result of the bonding of the polymer to the surface of the particles,
--+---------+---------+---------+-------E. Texas (Control) (---*---)
A-110 (----*---)A-130 (----*---)A-150 (----*----)
LMW SF N300 (----*----)SF N300 (---*---)
APS #705 (---*---)Chitosan (-----*----)
--+---------+---------+---------+------- -36.0 -32.0 -28.0 -24.0
Zeta Potential (mV)
46
changing the plane of shear such that the negative surface charge of the particles was
reduced.
The anionic PAMs had drastically different results for the synthetic runoff
samples. For the E. Texas synthetic runoff, the anionic PAMs did not change the zeta
potential by more than 2 mV. On the other hand, for the 183ANBC synthetic runoff, the
A-130 and A-150 increased the negative charge of the particles by approximately 12 and
14 mV, respectively. The optimal dose for the anionic PAMs for the E. Texas soil
suspension was only 0.3 mg/L. It is possible that there was a smaller chance of
significantly increasing the negative charge of the particles, since a smaller dose was
added. However, studies on kaolinite suspensions have shown that anionic PAMs may
actually neutralize the negative charge of particles by mechanisms similar to those
affecting the non-ionic PAMs (Patience et al., 2003; Nasser and James, 2006). Therefore,
if interparticle bridging is effectively occurring, the addition of anionic PAMs will not
increase the negative charge of the particles, but actually neutralize the negative charge.
The increase in negative charge of the particles for the 183ANBC is an indication that the
anionic PAMs, A-130 and A-150, were not effective at destabilizing the particles via
interparticle bridging.
Comparison of the final turbidities of both suspensions shows the anionic PAMs
were much more effective at flocculating the E. Texas synthetic runoff compared to the
183ANBC synthetic runoff. The turbidities associated with the E. Texas soil suspension
were 348 and 390 NTU for the A-130 and A-150, respectively; compared to those of the
183ANBC suspension that were 508 and 708 NTU, respectively. The higher turbidities
associated with the 183ANBC synthetic runoff indicate that the anionic PAMs, A-130
and A-150, were less effective at bonding with the particles. Since these PAMs were less
effective at bonding to the particles, it is possible they did not cause a shift in the plane of
47
shear and therefore, were not able to positively affect the zeta potential. The pH of the
synthetic runoff may have influenced the inability of the PAMs to effectively bridge the
particles. The pH values of the E. Texas and 183ANBC synthetic runoff were 6.74 and
8.54, respectively (the difference between the pH of the synthetic runoff and those of the
soil listed in Table 3.1 is due to Midwest Laboratories measuring pH of a 1:1 mixture of
soil to water, while the ratio of soil to water in the synthetic runoff is different). The E.
Texas synthetic runoff falls within the range of 5 to 7, which Peng and Di (1994)
identified as being the optimal range of pH for anionic PAMs to be effective, while the
183ANBC synthetic runoff is outside of this range. However, as previously discussed,
the pH may affect the effectiveness of PAM, but other soil characteristics such as clay
mineralogy may have a greater impact.
4.6 X-RAY DIFFRACTION TESTS
XRD tests were performed to qualitatively determine the clay mineralogy of the
soil suspensions. The output of these tests is a spectra, which shows the reflections or
peaks as a function of 2θ angle. Figure 4.10 gives an example of the output of these tests
showing the spectra for the 183ANBC soil suspension. Based on the d-spacing and the
location of the peaks (the 2θ angle), the peaks in this spectra were identified to be calcite,
quartz, kaolinite, and illite.

48
Figure 4.10: XRD Spectra for 183ANBC Soil Suspension.
For this study, the XRD was used to qualitatively determine the clay mineralogy
of each soil suspension. The 183ANBC had major peaks of calcite, quartz, and kaolinite,
and a minor peak of illite as shown in Table 4.2. Calcite is recognized by the sharp peak
at 29.405 degrees with a d-spacing of 3.035 Å. Quartz is identified by the sharp peak at
26.644 degrees and a d-spacing of 3.343 Å. Kaolinite is determined utilizing its first two
00l’s, which refer to its basal reflections. The (001) peak is found at 12.335 degrees with
a d-spacing of 7.17 Å and the (002) peak is located at 24.858 degrees with a d-spacing of
3.579 Å. These two peaks allow one to identify that kaolinite is present in the sample.
Illite is identified by its (001) peak at 8.831 degrees with a d-spacing of 10.00 Å and its
(002) peak at 17.653 degrees with a d-spacing of 5.02 Å. The peaks for Illite are very

49
weak, but apparent, and therefore Illite is considered to be a minor peak for the
183ANBC soil suspension.
Table 4.2: Major and Minor Clay Mineralogies for each Soil Suspension.
Sample Calcite Quartz Kaolinite Illite 183ANBC MAJOR MAJOR MAJOR Minor
College Station - MAJOR MAJOR - W Loop - MAJOR - MAJOR 127 Lub MAJOR MAJOR - MAJOR Hearne I - MAJOR MAJOR - Hearne II - MAJOR MAJOR - E Texas - MAJOR MAJOR -
Table 4.2 shows the clay mineralogy of the soil suspensions and its dominance
designated as major and minor. All of the soil suspensions had a major peak of quartz,
which is expected. Quartz is highly refractive and therefore the smallest amount of
quartz in a sample will give a major peak. The decantation procedure used theoretically
removes all of the sand, i.e., quartz, but clearly is not perfect, which leads to seeing the
major peak in all of the suspensions. The College Station, Hearne I, Hearne II, and E.
Texas soil suspensions had similar clay mineralogy with a major peak of quartz and a
major peak of kaolinite. Kunze et al. (1954) identified five geological regions of Texas
and identified the mineral composition of a representative soil within this region. The
College Station, Hearne I, Hearne II, and E. Texas soils were all in the forested coastal
plains region, which comprises kaolinite, quartz, chlorite, and illite. This confirms the
results of the XRD analysis. The W Loop and 127 Lub soil suspensions also had similar
clay mineralogy both having a major peak of quartz and a major peak of illite. The 127

50
Lub soil also had a major calcite peak. According to Kunze et al. (1954), these soils were
in the southern high plains geological region, where illite is the clay mineralogy, which
confirms the XRD results. The XRD results for the 183ANBC soil suspension could not
be confirmed by Kunze et al. (1954), since Travis County, the location of the 183ANBC
soil, was not within any of the five geological regions that were investigated.
Soil surveys from the National Resources Conservation Services were used to
examine how the shrink/swell potential of each of these soil suspensions may influence
the effectiveness of the flocculants. All of the soils had a low shrink-swell potential
(Table 4.3) based on their county soil surveys. Robertson County did not have any
information on shrink-swell potential, so the shrink-swell potential from its neighboring
county, Brazos County, was used. According to Kunze et al. (1954), these two counties
are in the same geological region, so the assumption that they have similar shrink-swell
potentials is acceptable. Since all of the soil suspensions had a low shrink-swell
potential, this property did not give any indication on why the effectiveness of flocculants
varied for each soil. However, McLaughlin and Bartholomew (2007) found soils that
comprised a significant percentage of smectite and vermiculite were more difficult to
flocculate than those that were dominated by kaolinite. Smectite and vermiculite are
more expandable clays than kaolinite and illite. Therefore, while the shrink-swell
potential does not give an understanding as to the differences in performance for the
seven samples in this study, it may be a cost-effective and simple method to help
determine if flocculation with polymers is a viable approach in unknown areas.

51
Table 4.3: Selected Properties of Soils used in Laboratory Tests
Sample County Shrink/ Swell
Potential Clay:Silt
Ratio 183ANBC Travis Low 1.00
College Station Brazos Low 0.55 W Loop Lubbock Low 0.71 127 Lub Lubbock Low 0.91 Hearne I Robertson Low* 1.73 Hearne II Robertson Low* 1.33 E Texas Robertson Low* 2.33
*Used Brazos county shrink-swell potential
The clay to silt ratio of each soil was also investigated as a property to determine
the effectiveness of the various soil suspensions as shown in Table 4.3. The polymers
were least effective on flocculating the Hearne I, Hearne II, and E. Texas soil
suspensions, which all had clay:silt ratios greater than 1. The other soil suspensions,
which were easier to flocculate, had clay:silt ratios less than or equal to 1. Therefore, it
appears that the clay to silt ratio may be an effective parameter to determine if the
polymers will be effective at promoting flocculation. McLaughlin and Bartholomew
(2007) found that the percentage of clay and silt in a soil sample was an important
parameter in the effectiveness of flocculation. The study found the soils with the greatest
turbidity reductions comprised greater than 14% clay and 22% silt and speculated this
was a result of silt-clay flocs settling more readily than clay-clay flocs. These
percentages give a clay:silt ratio of 0.64, which agrees with the speculation that soils with
clay:silt ratios less than or equal to 1 will be easier to flocculate. However, if the clay:silt
ratio dictated whether a soil suspension would effectively be flocculated, then the College
Station soil suspension with the lowest clay:silt ratio should be the easiest to flocculate,

52
which is not the case. Therefore, while the clay:silt ratio is a good indicator of how
effective flocculants will be, it does not tell a complete story.
The difference between the W Loop and 127 Lub soil suspensions and the
183ANBC and College Station soil suspensions may be a function of their clay
mineralogy. The W Loop and 127 Lub have a major peak of illite, while the 183ANBC
and College Station soil suspensions have a major peak of kaolinite. These results
indicate that the presence of illite may improve the effectiveness of flocculation with
polymers compared to kaolinite. Laird (1997) found the opposite to be true in a study
that analyzed the effectiveness of PAM on pure suspensions of kaolinite, illite, and
quartz. The study found that PAM was most effective on kaolinite, followed by illite,
and least effective on quartz. However, the reason for the better performance on kaolinite
versus illite was not clearly identified. The difference could potentially be from other
factors such as pH or various other properties that were not evaluated in this study.
53
Chapter 5: Conclusions
The overarching goal of this research was to determine how polymers could be
used to aid sedimentation of stormwater runoff on construction sites. The first objective
was to determine the typical turbidity of construction site runoff to determine if existing
ESCs would be able to meet the EPA’s future threshold. Field monitoring was performed
on three construction sites in the Greater Austin area via grab sampling to determine the
turbidity associated with different sites and ESCs. The monitoring suggested that
existing practices are unlikely to meet the regulatory threshold.
The second objective was to determine the soil properties, polymer properties and
dose of polymer that promote sedimentation. Flocculation, electrophoretic mobility, and
X-ray diffraction tests were performed on a variety of synthetic stormwater runoff
samples to develop this understanding. The tests suggest that flocculation with polymers
for specific soil types may present a viable alternative for improved sediment control
once the soil and polymer properties that control flocculation are understood. To this
end, a method was developed to create a modified synthetic stormwater runoff from soil
samples that may be replicated using soil from any construction site. Particle size
distribution functions were used to compare the synthetic and sampled stormwater runoff
from the same construction. The modified synthetic stormwater runoff comprised a
greater number of larger particles due to the way it was created and the way the grab
samples of actual runoff were taken. However, the particle size distribution functions
were still similar, which make this is a good method to create modified synthetic
stormwater runoff that may be used in flocculation tests and other laboratory
experiments.
54
A variety of polymer properties and soil properties influence the effectiveness of
PAM or chitosan for reducing turbidity in stormwater runoff. The anionic PAMs had an
optimal dose of approximately 1 mg/L, beyond which restabilization occurred. The
flocculation and electrophoretic mobility tests confirmed a previous study on kaolinite
suspensions by Nasser and James (2006) showing that increasing the charge density has a
negative effect on flocculation; that is, it resulted in higher turbidities. Furthermore,
anionic PAMs were only effective in reducing the turbidity of modified synthetic
stormwater runoff below 200 NTU for two different types of soil. No specific soil
parameter was found, which would indicate whether an anionic PAM would be effective
or not. For all the modified synthetic stormwater runoff, the SF N300, APS #705, and
chitosan were effective in reducing the turbidity. The turbidity curves of APS #705 and
the electrophoretic mobility tests indicated that APS #705 may have similar charge
characteristics to the non-ionic PAM, SF N300. Chitosan was also effective at
flocculating all the synthetic runoff. The electrophoretic mobility tests indicate that the
dominant mechanism of particle destabilization for chitosan may be charge neutralization
or interparticle bridging depending on the soil type. Hardness tests were conducted in
conjunction with the flocculation tests using SF N300 to determine the bonding
mechanism between PAM and the particles. A reduction in turbidity was associated with
a reduction in hardness indicating that interparticle bridging was occurring and that
calcium was directly participating in the particle coagulation. The electrophoretic
mobility tests confirmed the hardness tests in indicating that interparticle bridging is the
mechanism of particle destabilization for the non-ionic PAMs. The electrophoretic
mobility tests indicated that interparticle bridging is the mechanism of particle
destabilization for the anionic PAMs as well.

55
X-ray diffraction tests were performed to qualitatively determine the clay
mineralogy of the various soil samples. The samples comprised quartz, calcite, kaolinite,
and illite. Soil surveys (USDA) and a study by Kunze et al. (1954) confirmed the clay
mineralogy of these soils. Soils with a major peak of illite, W Loop and 127Lub, were
the easiest soils to flocculate. The other soils with major peaks of kaolinite were more
difficult to flocculate. The clay:silt ratio was used to develop an understanding as to the
differences in effectiveness of flocculation for the soils that were dominated by kaolinite.
Soils with a clay:silt ratio less than 1 were easier to flocculate than those with a ratio
greater than 1. These results indicate that the combination of clay mineralogy and
clay:silt ratio may be an effective way to predict if polymers will be successful in
promoting flocculation. More research needs to be performed on various soil samples to
support this conclusion due to the small sample size.
A substantial amount of additional work is required before a complete
understanding of the interaction between polymers and soils of various types can be
achieved. The electrophoretic mobility tests appear to be the first of these tests that have
been performed on a soil suspension instead of on pure clay suspensions. The tests give
insight into the bonding mechanisms between the polymers and flocculants that is not
apparent through flocculation tests. Specifically, these tests have found that as the charge
density increases, the effectiveness of the polymer decreases. Furthermore, the non-ionic
PAMs were found to significantly reduce the zeta potential of synthetic runoffs in a
positive manner, i.e., making the particles less stable. These trends were observed in a
study on kaolinite suspensions (Nasser and James, 2006) and demonstrate the same
trends are applicable to mixed soil suspensions.
This research found non-ionic PAMs and chitosan to be the most effective at
promoting sedimentation on all of the synthetic runoff. Therefore, these polymers should

56
be the focus of field studies to determine how polymer-enhanced sedimentation may aid
conventional erosion and sediment controls to meet the future threshold. It will be
important to monitor the residual of these polymers to ensure no harm is caused to the
receiving water bodies. Furthermore, the research suggests that if anionic PAMs are used
instead of the more effective flocculants, it is imperative that flocculation tests be
performed prior to implementation to determine if anionic PAM may be effective as its
effectiveness varied for the synthetic runoff.
Appendices
APPENDIX A
0 5
10 15 20 25
-50.
00
-45.
00
-40.
00
-35.
00
-30.
00
-25.
00
-20.
00
-15.
00
-10.
00
-5.0
0 0.
00
5.00
10
.00
15.0
0 20
.00
25.0
0
Perc
enta
ge (%
)
Zeta Potential (mV)

57
Figure A.1: Histogram of Zeta Potential for E. Texas synthetic runoff (no polymer addition) prior to cleaning the electrophoresis cell.
Figure A.2: Histogram of Zeta Potential for E. Texas synthetic runoff (no polymer addition) after cleaning.
0.00
5.00
10.00
15.00
20.00
-50.
00
-45.
00
-40.
00
-35.
00
-30.
00
-25.
00
-20.
00
-15.
00
-10.
00
-5.0
0 0.
00
5.00
10
.00
15.0
0 20
.00
25.0
0
Perc
enta
ge (%
)
Zeta Potential (mV)

58
APPENDIX B
Figure B.1: Flocculation tests for all synthetic runoff with APS #705.
Figure B.2: Flocculation tests for all synthetic runoff with SF N300.
0
200
400
600
800
1000
1200
1400
1600
0.01 0.1 1 10 100
Turb
idity
(NTU
)
Dose (mg/L)
E Texas
Hearne I
Hearne II
College Station
183ANBC
W Loop
127 Lub
0
200
400
600
800
1000
1200
1400
1600
0.01 0.1 1 10 100
Turb
idity
(NTU
)
Dose (mg/L)
E Texas
Hearne I
Hearne II
C Station
183ANBC
Wloop
127 Lub
Threshold

59
Figure B.3: Flocculation tests for all synthetic runoff with LMW SF N300.
Figure B.4: Flocculation tests for all synthetic runoff with Chitosan.
0
200
400
600
800
1000
1200
0.01 0.1 1 10 100
Turb
idity
(NTU
)
Dose (mg/L)
E Texas
Hearne I
Hearne II
College Station*
183ANBC*
Wloop
127 Lub *Ran out of sample
0
200
400
600
800
1000
1200
1400
1600
0.01 0.1 1 10 100
Turb
idity
(NTU
)
Dose (mg/L)
E Texas
Hearne I
Hearne II*
C Station*
183ANBC*
Wloop
127 Lub * Ran out of sample
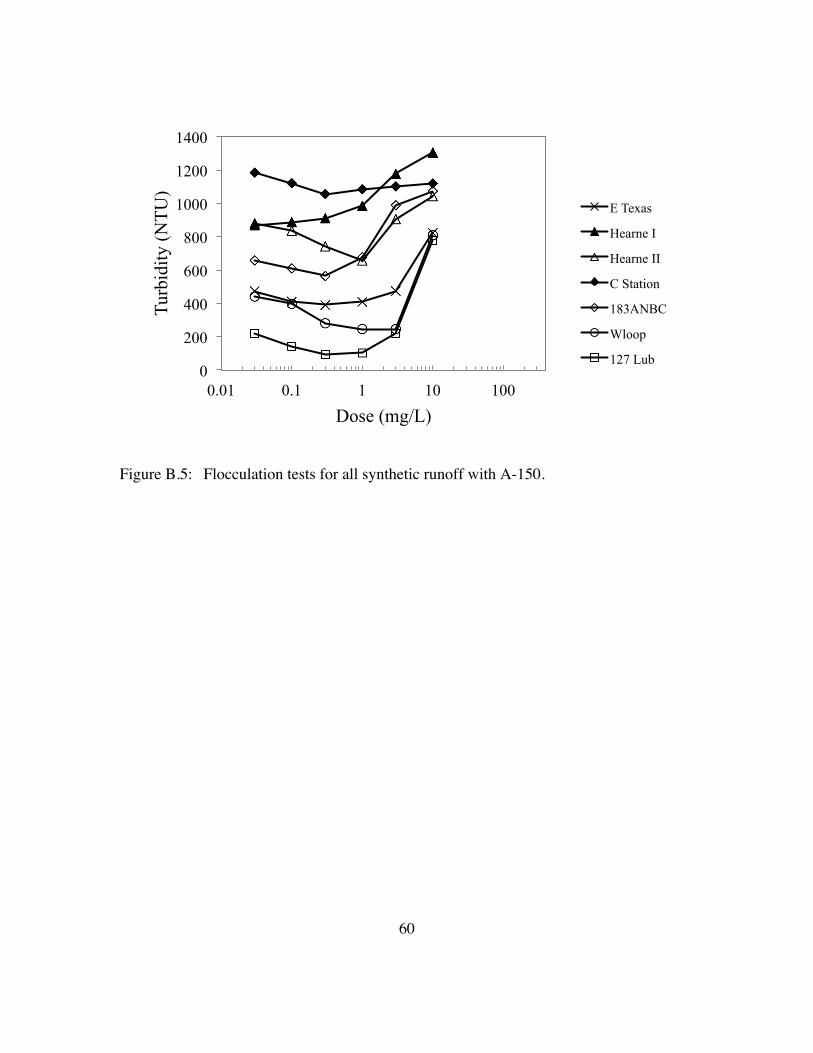
60
Figure B.5: Flocculation tests for all synthetic runoff with A-150.
0
200
400
600
800
1000
1200
1400
0.01 0.1 1 10 100
Turb
idity
(NTU
)
Dose (mg/L)
E Texas
Hearne I
Hearne II
C Station
183ANBC
Wloop
127 Lub

61
APPENDIX C
Figure C.1: Flocculation and hardness tests for WLoop synthetic runoff.
Figure C.2: Flocculation and hardness tests for College Station synthetic runoff.
0
5
10
15
20
25
30
35
0
200
400
600
800
1000
1200
1400
1600
0.01 0.1 1 10
Har
dnes
s (m
g CaC
O3/
L)
Turb
idity
(NTU
)
Dose (mg/L)
0
5
10
15
20
25
30
35
40
45
0
200
400
600
800
1000
1200
1400
1600
0.01 0.1 1 10
Har
dnes
s (m
g CaC
O3/
L)
Turb
idity
(NTU
)
Dose (mg/L)

62
Figure C.3: Flocculation and hardness tests for 183ANBC synthetic.
Figure C.4: Flocculation and hardness tests for Hearne II synthetic.
33
34
35
36
37
38
39
40
41
0
200
400
600
800
1000
1200
1400
1600
0.01 0.1 1 10
Har
dnes
s (m
g CaC
O3/
L)
Turb
idity
(NTU
)
Dose (mg/L)
0.0
0.5
1.0
1.5
2.0
2.5
3.0
3.5
4.0
0
200
400
600
800
1000
1200
1400
1600
0.01 0.1 1 10
Har
dnes
s (m
g CaC
O3/
L)
Turb
idity
(NTU
)
Dose (mg/L)

63
Figure C.5: Flocculation and hardness tests for 127Lub synthetic runoff.
30.0
31.0
32.0
33.0
34.0
35.0
36.0
37.0
0
200
400
600
800
1000
1200
1400
1600
0.01 0.1 1 10
Har
dnes
s (m
g CaC
O3/
L)
Turb
idity
(NTU
)
Dose (mg/L)

64
References
Barrett, M. E., Kearney, J. E., McCoy, Terry, G., and Malina, J. F. (1995). “An Evaluation of the Performance of Temporary Sediment Controls.” Center for Water Resources Technical Report 261, The University of Texas at Austin. http://www.crwr.utexas.edu/reports/pdf/1995/rpt95-6.pdf.
Bhardwaj, A.K. and McLaughlin R.A. (2008). “Simple Polyacrylamide dosing Systems for Turbidity Reduction in Stilling Basins.” Transactions of the American Society of Agricultural and Biological Engineering, 51(5), 1653-1662.
Bhardwaj, A.K., McLaughlin, R.A., and Babcock, D.I. (2008). “Energy Dissipation and Chemical Treatment to Improve Stilling Basin Performance.” Transactions of the American Society of Agricultural and Biological Engineering, 51(5), 1645-1652.
Bhardwaj A.K., McLaughlin, R.A., and Levy, G.J. (2010). “Depositional Seals in Polyacrylamide-Amended Soils of Varying Clay Mineralogy and Texture.” Journal of Soils Sediments, 10, 494-504.
Barvenik, F.W. (1994). “Polyacrylamide Characteristics Related to Soil Applications.” Soil Science, 158(4), 235-243.
Ben-Hur, M. (1994). “Runoff, Erosion, and Polymer Application in Moving-Sprinkler Irrigation.” Soil Science, 158(4), 283-290.
Divakaran, R. and Pillai, V.N.S. (2001). “Flocculation of Kaolinite Suspensions in Water by Chitosan.” Water Research, 35(16), 3904-3908.
Green, V.S., Stott, D.E., Norton, L.D., and Graveel, J.G. (2000). “Polyacrylamide Molecular Weight and Charge Effects on Infiltration under Simulated Rainfall.” Soil Science Society of America Journal, 64, 1786-1791.
Green, V.S., Stott, D.E., Graveel, J.G., and Norton, L.D. (2004). “Stability Analysis of Soil Aggregates Treated with Anionic Polyacrylamides of Different Molecular Formulations.” Soil Science, 169(8), 573-581.
Huang, C.P. and Chen, Y. (1996). “Coagulation of Colloidal Particles in Water by Chitosan.” Journal of Chemical Technology and Biotechnology, 66(3), 227-232.
Kunz, G.W., Templin, E.H., and Page, J.B. (1954). “The Clay Mineral Composition of Representative Soils from Five Geological Regions of Texas.” Clays and Clay Minerals, 3(1), 373-383.
Laird, D.A. (1997). “Bonding Between Polyacrylamide and Clay Mineral Surfaces.” Soil Science, 162(11), 826-832.
Lawler, D. (2010) Physical/Chemical Treatment Processes for Water and Wastewater Vol. 3.

65
Lentz, R.D. and Sojka, R.E. (1994). “Field Results using Polyacrylamide to Manage Furrow Erosion and Infiltration.” Soil Science, 158(4), 274-282.
Letey, J. (1994). “Adsorption and Desorption of Polymers on Soil.” Soil Science, 158(4), 244-248.
Lu, H.J., Wu, L., and Letey, J. (2002). “Effects of Soil and Water Properties on Anionic Polyacrylamide Sorption.” Soil Science Society of America Journal, 66, 578-584.
Mamedov, A.I, Shainberg, L.E., Wagner, D.N., and Levey, G.J. (2009). “Infiltration and Erosion in Soils Treated with Dry PAM, of Two Molecular Weights, and Phophogypsum.” Australian Journal of Soil Research, 47(8).
McLaughlin, R.A. (No Date). “Target Turbidity Limits for Passive Treatment Systems.” McLaughlin, R.A. (2006). “Polyacrylamide Blocks for Turbidity Control on Construction
Sites.” American Society of Agricultural and Biological Engineering Presentation Paper Number: 062254.
McLaughlin, R.A. and Bartholomew, N. (2007). “Soil Factors Influencing Suspended Sediment Flocculation by Polyacrylamide.” Soil Science Society of America Journal, 71(2), 537-544.
McLaughlin, R.A. and Brown, T.T. (2006). “Evaluation of Erosion Products with and without Added Polyacrylamide.” Journal of the American Water Resources Association, 42(3), 675-684.
McLaughlin, R.A. and McCaleb, M.M. (2010). “Passive Treatment to Meet the EPA Turbidity Limit.” American Society of Agricultural and Biological Engineering Presentation Paper Number: 711P0710cd.
McLaughlin, R.A., King S.E., and Jennings, G.D. (2009). “Improving Construction Sites Runoff Quality with Fiber Check Dams and Polyacrylamide.” Journal of Soil and Water Conservation, 64(2), 144-153.
McLaughlin, R.A. and Zimmerman, A. (2009). “Best Management Practices for Chemical Treatment Systems for Construction Stormwater Dewatering.” FHWA-WFL/TD-09-001, http://www.wfl.fhwa.gov/td.
Moore, D.M. and Reynolds, R.C. (1997). X-Ray Diffraction and the Identification and Analysis of Clay Minerals, 2nd edition. Oxford University Press, New York.
Nasser, M.S. and James, A.E. (2006). “The Effect of Polyacrylamide Charge Density and Molecular Weight on the Flocculation and Sedimentation Behaviour of Kaolinite Suspensions.” Separation and Purification Technology, 52, 241-252.
Pan, J.R.S., Huang, C.P., Chen, S.C., and Chung, Y.C. (1999). “Evaluation of a Modified Chitosan Biopolymer for Coagulation of Colloidal Particles.” Colloids and Surfaces A: Physicochemical and Engineering Aspects, 147(3), 359-364.

66
Patience, M., Addai-Menash, J., and Ralston, J. (2003). “Investigation of the Effect of Polymer Type on Flocculation, Rheology and Dewatering Behaviour of Kaolinite Dispersions.” International Journal of Mineral Processing, 71, 247-268.
Peng, F.F. and Di, P. (1994). “Effect of Multivalent Salts—Calcium and Aluminum on the Flocculation of Kaolin Suspension with Anionic Polyacrylamide.” Journal of Colloid and Interface Science, 164, 1994, 229-237.
Roa-Espinosa, A., Bubenzer, G.D., and Miyashita, E.S. (1999). “Sediment and Runoff Control on Construction Sites Using Four Application Methods of Polyacrylamide Mix.” ASAE Annual International Meeting Paper Number: 992013.
Shainberg, I. and Levy, G.J. (1994). “Organic Polymers and Soil Sealing in Cultivated Soils.” Soil Science, 158(4), 267-273.
Teo, J.A., Ray, C., and El-Swaify, S.A. (2006). “Screening of Polymers on Selected Hawaii Soils for Erosion Reduction and Particle Settling.” Hydrological Processes, 20, 109-125.
Texas Commission on Environmnetal Quality. (2008). “General Permit to Discharge Wastes Under Provisions of Section 402 of the Clean Water Act and Chapter 26 of the Texas Water Code.” Docket No. 2007-1588-WQ.
Theng, B.K.G. (1982). “Clay-Polymer Interactions: Summary and Perspectives.” Clays and Clay Minerals, 30(1), 1-10.
Tobiason, S., Jenkins, D., Molash, E., and Rush, S. (2001). “Polymer Use and Testing for Erosion and Sediment Control on Construction Sites.” Erosion Control, January/February, 90-101.
U.S. Environmental Protection Agency. (2009). “Development Document for Final Effluent Guidelines and Standards for the Construction & Development Category”.
U.S. Department of the Interior, U.S. Geological Survey. (2001). Separation of Silt and Clay by Decantation for X-Ray Powder Diffraction. Retrieved June 25, 2012, from http://pubs.usgs.gove/of/2001/of01-041/htmldocs/xrpd.htm.
U.S. Department of Agriculture, National Resource Conservation Service. Texas Online Soil Survey Manuscripts. Retrieved July 18, 2012 from http://soil.usda.gov/survey/online_surveys/texas/.Vacher, Ca., Loch, R.J., and Raine, S.R. (2003). “Effect of Polyacrylamide on Infiltration and Erosion of Disturbed Lands.” Australian Journal of Science Research, 41, 1509-1520.