crwr online report 06-12 - weap · crwr online report 06-12 ... 1.2 objective ... per capita per...
TRANSCRIPT
i
CRWR Online Report 06-12
WEAP Hydrology Model Applied: The Rio Conchos Basin
by
Charlotte C. Amato, M.S., P.E.
Daene C. McKinney, Ph. D., PE
Eusebio Ingol-Blanco, M.S.
and
Rebecca L. Teasley, M.S.
December 2006
CENTER FOR RESEARCH IN WATER RESOURCES
Bureau of Engineering Research • The University of Texas at Austin
J.J. Pickle Research Campus • Austin, TX 78712-4497
This document is available online via World Wide Web at
http://www.ce.utexas.edu/centers/crwr/reports/online.html

ii
Contents
Section Page
1 Introduction ........................................................................................................................... 1 1.1 Background .......................................................................................................................... 1 1.2 Objective .............................................................................................................................. 2
2 WEAP Model Preparation ................................................................................................... 3 2.1 Model Structure .............................................................................................................. 3
2.2 Catchment Area .............................................................................................................. 4
2.3 Soil and Land Use Groups .............................................................................................. 8
2.4 River Reaches ............................................................................................................... 14 2.5 Catchment Runoff to River Connectivity ..................................................................... 16 2.6 Deep Water Capacity .................................................................................................... 17 2.7 Deep Conductivity ........................................................................................................ 18
2.8 Initial Z2........................................................................................................................ 19 2.9 Soil Water (Root Zone) Capacity ................................................................................. 19
2.10 Root Zone Conductivity ................................................................................................ 22 2.11 Preferred Flow Direction .............................................................................................. 22 2.12 Initial Z1........................................................................................................................ 23
2.13 Crop Coefficient, Kc ..................................................................................................... 23
2.14 Leaf Area Index ............................................................................................................ 24 2.15 Precipitation .................................................................................................................. 25 2.16 Temperature, Wind and Humidity ................................................................................ 27
2.17 Latitude ......................................................................................................................... 28 2.18 Melting Point, Freezing Point and Initial Snow............................................................ 29
3 HEC-HMS Data .................................................................................................................. 30
4. Calibration Process for 1980 .............................................................................................. 32 4.1. Root Zone Water Capacity............................................................................................ 33
4.2. Root Zone Conductivity ................................................................................................ 33 4.3. Initial Root Zone Water Capacity ................................................................................. 33
4.4. Lower Deep Water Capacity ......................................................................................... 34 4.5. Lower Deep Conductivity ............................................................................................. 34 4.6. Initial Lower Layer Capacity ........................................................................................ 35
5 Results .................................................................................................................................. 36 5.1. Annual Streamflow Comparison ................................................................................... 37 5.2. Monthly Streamflow Comparison................................................................................. 38
6. Recommendations ............................................................................................................... 45
References .................................................................................................................................... 46
Appendix 1. Soil Land Use Intersects by Sub-basin ............................................................... 47
Appendix 2. CRWR Geodatabase Reach Lengths .................................................................. 67
1
1 Introduction
1.1 Background
The Rio Grande headwaters in Colorado and flows south through New Mexico to Paso del Norte,
the point where New Mexico, Texas and the Mexican state of Chihuahua meet. Paso del Norte is
an exceptionally large bi-national metropolitan area with three large and rapidly growing cities:
Las Cruces, New Mexico, El Paso, Texas and Ciudad Juarez, Chihuahua. Flowing southeast
from Paso del Norte the Rio Grande, known as the Rio Bravo in Mexico, forms the Texas-
Mexico border all the way to the Gulf of Mexico. In both the United States and Mexico the Rio
Grande/Rio Bravo region is experiencing population growth well above the national average of
the respective nations. Due the population growth, this primarily desert river basin is further
stressed by an increasing agricultural demand. These factors culminate to make the basin one of
the most water stressed basins in the world, with less than 500 cubic meters of water available
per capita per year.
The bi-national aspect and water stressed status of the basin make it the subject of many studies,
each with the goal of improving resource management and sustainable solutions to meet the
increasing water supply demands. The Center for Research in Water Resources (CRWR) is a
member of the RioGrande/Bravo Physical Assessment Project consortium of U.S. and Mexican
universities, governmental and non-governmental agencies. The consortium is working to create
a basin wide hydrologic planning model to provide improvement in water resource management.
The Water Evaluation and Planning (WEAP) system developed by the Stockholm Environmental
Institute is a powerful modeling tool. WEAP is river basin simulation software which includes
opportunities for scenarios evaluation as well as water balance and allocation calculations. A
WEAP model for the Rio Bravo basin has recently been developed (Danner et al., 2006). The
missing component is the hydrologic element of the model that allows for predictions of water
flows and availability from precipitation sequences.
The objective of this project is to develop a hydrologic model of the Rio Conchos basin using
WEAP with the ultimate goal of determining the feasibility and practicality of a WEAP
hydrologic model for the entire Rio Bravo basin. The confluence of the Rio Conchos and Rio
Bravo is near Ojinaga, Chihuahua and Presidio, Texas and is significant because the Rio
Conchos provides approximately two thirds of the total annual water volume to the lower Rio
Bravo. The Rio Conchos basin is primarily located in the Mexican state of Chihuahua with the
southern edge spilling into Durango. Figure 1 depicts the Rio Conchos basin in beige and the
remainder of the Rio Bravo basin in grey.

2
Figure 1. Rio Bravo Basin
1.2 Objective
As stated above, the objective of this project is to explore the hydrologic capabilities of WEAP
through the development of a Rio Conchos basin model with the intent of evaluating the
practicality of incorporating a WEAP hydrology model for the entire Rio Bravo basin into the
Physical Assessment Project.
In creating the hydrologic model, data from several sources was compiled and pre-processed for
use by WEAP. The WEAP model structure, data sources and parameter input techniques
employed are discussed in Section 2 of this report. The most significant sources include:
Mexican Institute of Water Technology (IMTA) (Martinez et al., 2005)
Soil Water Assessment Tool (World Bank, 2006)
The hydrologic capabilities of WEAP are evaluated by comparing the flows simulated by WEAP
with the flows simulated by the HEC-HMS model prepared by IMTA (Martinez et al., 2005).
Flow results for six locations within the Rio Conchos basin are compared in Section 4.
3
The practical utilization of WEAP as a large, basin scale hydrologic model to assist in water
resources planning and management will be evaluated by comparing the general performance of
the WEAP model with HEC-HMS model.
2 WEAP Model Preparation
2.1 Model Structure
WEAP supports the use of three hydrologic modeling methods: the Rainfall Runoff Method
FAO (Food and Agriculture Organization of the United Nations), the Irrigation Demands Only of
the FAO, and the Rainfall Runoff Soil Moisture Method. The goal of this project is to create a
hydrologic model that can be calibrated in the future, therefore the Rainfall Runoff Soil Moisture
Method was chosen because it offers the most comprehensive analysis by allowing for the
characterization of land use and/or soil type impacts to hydrological processes (Sieber, 2005).
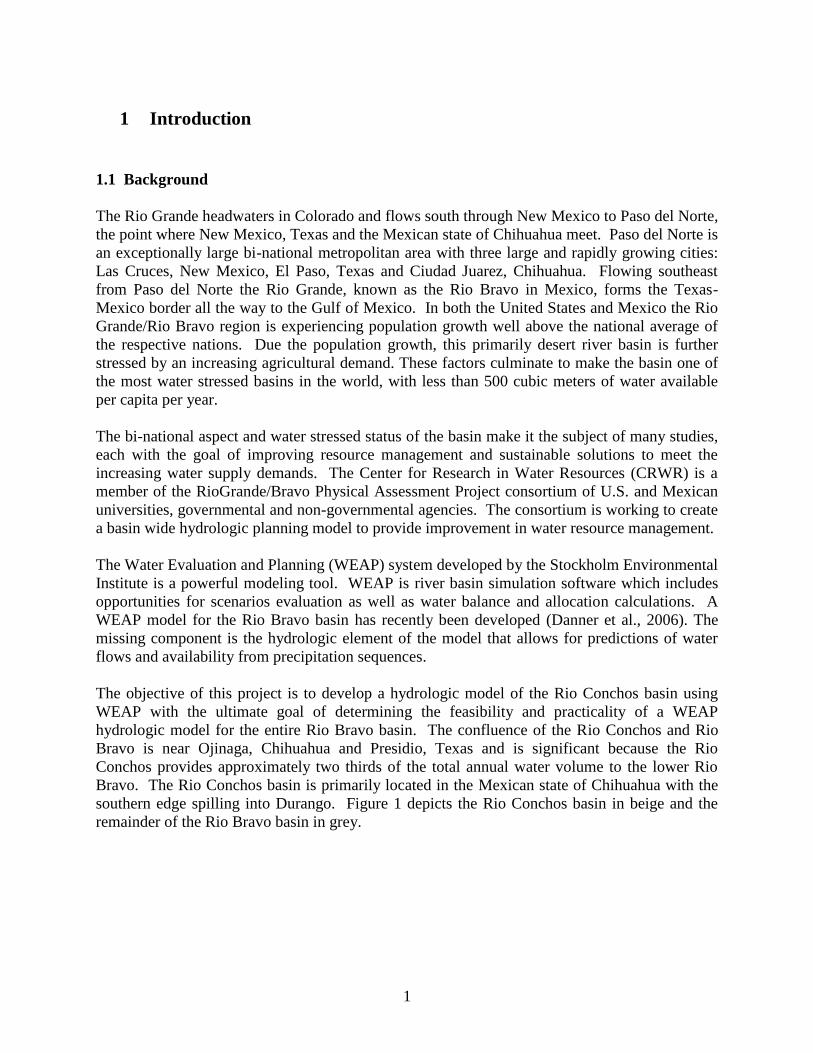
The Rainfall Runoff Soil Moisture Method, or Soil Moisture Method, is a one-dimensional, two
soil layer algorithm for calculating evapotranspiration, surface runoff, sub-surface runoff and
deep percolation for a defined land area unit. A conceptual diagram of the equations incorporated
into the Soil Moisture Method water balance calculations are shown in Figure 2.
Figure 2. Soil Moisture Method Model (Source: Sieber, 2005)

4
Using the Soil Moisture Method to more accurately describe the hydrologic response of the basin
has the implication that more detailed hydrologic and climatic parameters are required for the
model. Consequently, the parameters and data are often difficult to define with certainty. The
basic input parameters are listed in Table 1 along with the sensitivities identified for each
parameter which are a result of the work of Jantzen et al. (2006). WEAP imposes a model
structure in terms input parameter resolution, meaning WEAP forces certain parameters to
describe the entire catchment and others to describe smaller land unit areas such as the soil
classification or land use category. In the remainder of Section 2 each parameter along with the
respective data source and implication of WEAP’s model structure is discussed in greater detail.
Table 1. Input Parameters and Sensitivity
2.2 Catchment Area
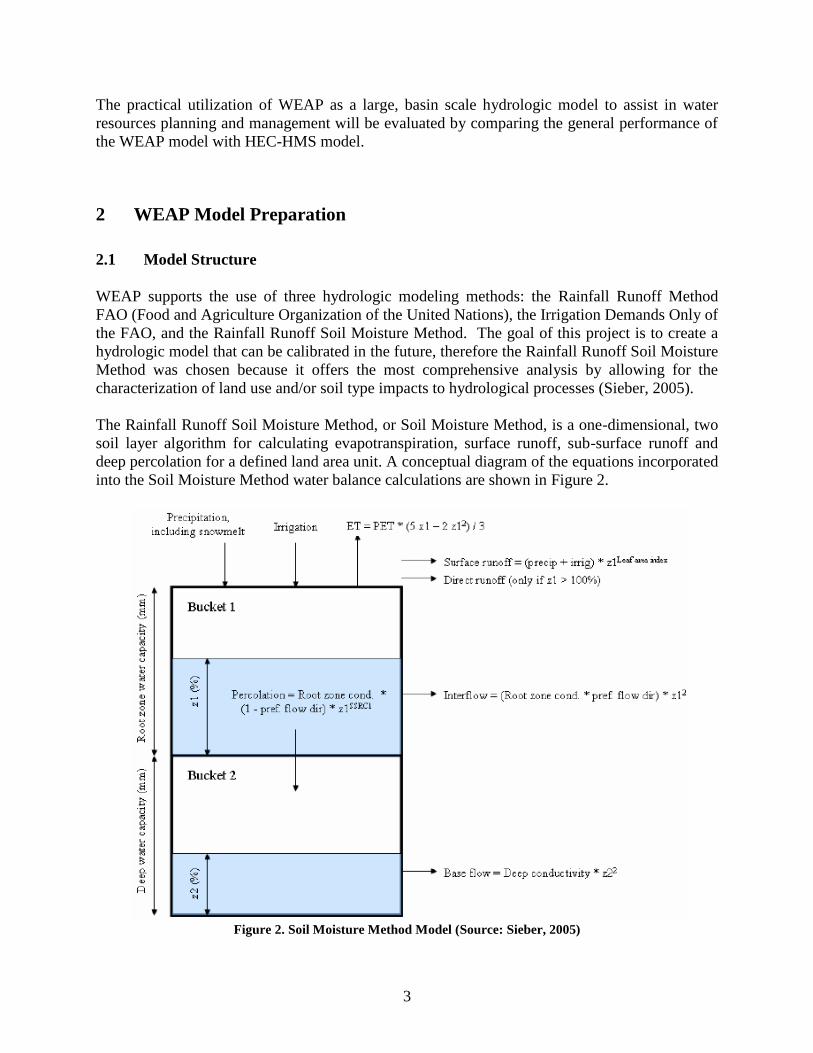
A fundamental parameter of any hydrologic model is the catchment area. The Bi-National Rio
Grande/Bravo Geodatabase contains delineated sub-basins for all of the Rio Bravo basins
including the Rio Conchos (Patiño-Gomez and McKinney, 2005). Thirty-eight sub-basins were
delineated for the Rio Conchos; these are illustrated in Figure 3.
Parameter Units Resolution Sensitivity
Land Use
Area sq km Catchment High
Deep Water Capacity mm Catchment High
Deep Conductivity mm/day Catchment Moderate
Initial Z2 no unit Catchment No Influence
Soil Water Capacity mm Soil Moderate
Root Zone Conductivity mm/day Soil Moderate
Prefered Flow Direction no unit Soil Moderate
Initial Z1 no unit Soil No Influence
Crop Coefficient, Kc no unit Land Use High
Leaf Area Index no unit Land Use High
Climate
Precipitation mm/day Catchment High
Temperature C Catchment Moderate
Wind m/s Catchment Low
Humidity % Catchment Low
Melting Point C Catchment Not evaluated
Freezing Point C Catchment Not evaluated
Latitude degree Catchment Not evaluated
Initial Snow mm Catchment Not evaluated
5
Figure 3. Bi-National Rio Grande/Bravo Geodatabase Rio Conchos Sub-basins
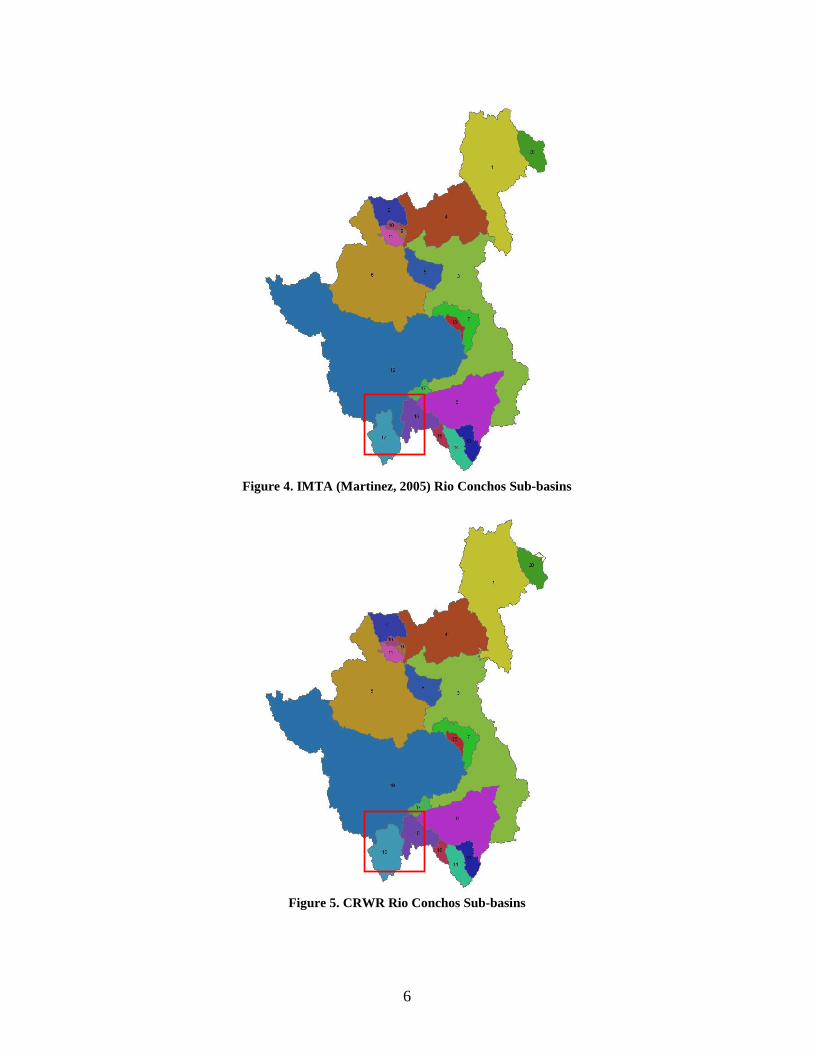
Using different control points 20 sub-basins were delineated by IMTA for use in their HEC-
HMS model (Martinez, 2005). One of the tasks of this project is to compare the WEAP model
results to the results of IMTA’s HEC-HMS model; hence, it is desirable to use the IMTA sub-
basin configuration. Sub-basin areas shown in the IMTA report, however, do not appear to be
delineated consistently with the divides of the river systems observed in the hydro-edge
shapefile. Figure 4 shows the Rio Conchos sub-basins as they appear in the IMTA report. Using
the WRAPHydro process (Patiño-Gomez and McKinney, 2005) the sub-basin areas of the Rio
Conchos basin were re-delineated using IMTA’s basin outlet control points, yielding the results
shown in Figure 5. Significant differences occur only between the La Boquilla (sub-basin 19)
and Llanitos (12) sub-basins, highlighted by the red boxes. Table 2 summarizes the area for each
of the twenty sub-basins as determined by IMTA and the CRWR.
6
Figure 4. IMTA (Martinez, 2005) Rio Conchos Sub-basins
Figure 5. CRWR Rio Conchos Sub-basins

7
Table 2. Comparison of IMTA and CRWR Sub-basins
Basin Name IMTA
ID
IMTA Area CRWR Area
sq km sq km
Peguis 1 7544.99 7999.30
Sacramento 2 1067.03 1042.61
Las Burras 3 11090.21 11309.47
Luis L. Leon 4 5059.43 5085.51
FCO. Madero 5 1209.10 1211.35
Villalba 6 9327.44 9556.86
Conchos 7 1137.42 1114.39
Jimenez 8 4392.87 4422.96
Chuviscar 9 98.26 106.09
El Rejon 10 154.53 146.85
Chihuahua 11 401.77 399.99
Llanitos 12 1483.88 1829.93
Pico del Aguila 13 658.33 647.61
San Antonio 14 843.80 821.16
San Gabriel 15 267.95 305.85
Puente FFCC 16 1251.12 1270.66
Parral 17 347.95 363.79
Colina 18 244.97 259.06
La Boquilla 19 19054.13 18931.98
Ojinaga 20 1004.28 983.47
Conchos Basin Area 66639.45 67808.88
WEAP does not support a geo-referenced map within the program but will allow shapefiles
to be imported as a background map for the WEAP schematic. The sub-basin shapefile
shown in Figure 5 was imported into WEAP as a vector layer so that the WEAP sub-basins
created could be placed in a manner that is visually consistent with the geography of the Rio
Conchos basin. The actual placement of the catchments is arbitrary.
The WEAP schematic displays in GCS_WGS_1984 coordinates with a degree bound frame
while the CRWR geodatabase is in GCS_North_American_1983 coordinates,
NAD_1983_Albers projection (Patiño-Gomez and McKinney, 2005). The shapefile was
reprojected from the CRWR geodatabase to the coordinate system used by WEAP. Figure 6
shows the CRWR sub-basins as they are displayed as a background map layer in WEAP with
the catchments added.

8
Figure 6. CRWR Rio Conchos Sub-basins Displayed in WEAP
2.3 Soil and Land Use Groups
The twenty sub-basins were sub-divided again by soil groups and land use categories. The land
use and soil coverages employed by IMTA (Martinez 2005) are applied in the WEAP model
rather than those available from the SWAT model (World Bank, 2006). Again, this relates to the
task of evaluating the flows simulated by WEAP by comparing results with IMTA’s HEC-HMS
model.
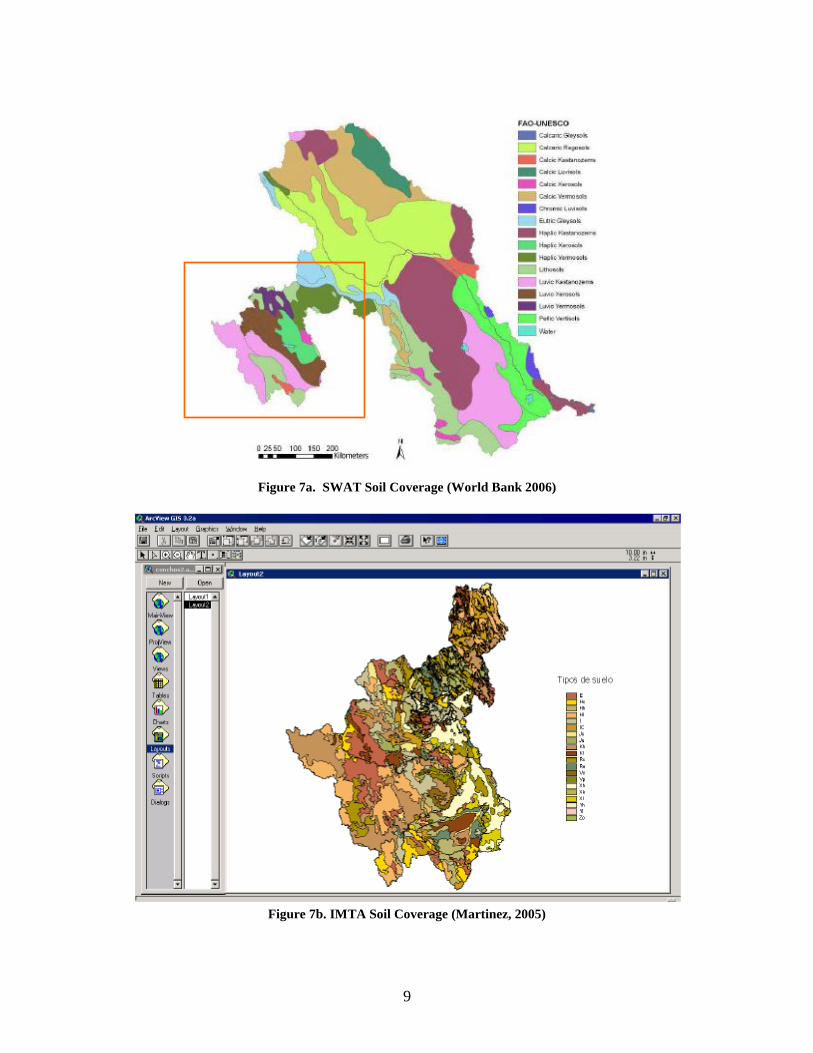
Figure 7a and b compare the soil coverages from the SWAT and IMTA data sets, respectively.
The SWAT soil classification and land use categories are per the Food and Agricultural
Organization (FAO) guidelines. A future model version may find it helpful to work under an
internationally referenced system like that provided by the FAO. No work was done to
investigate and compare the accuracy or quality of the two datasets.
In receiving the soil coverage from IMTA an error occurred in that data for the Ojinaga sub-
basin (No. 20) was omitted. For this reason soil areas were approximated from what overlapping
data was received for the basin. Figure 7c shows the soil coverage that was received from IMTA
in October of 2006.
9
Figure 7a. SWAT Soil Coverage (World Bank 2006)
Figure 7b. IMTA Soil Coverage (Martinez, 2005)

10
Figure 7c. IMTA Soil Coverage Applied to WEAP
Figure 7. Soil Coverage Datasets
To reduce the number of soil categories applied to each sub-basin, with the intent of thereby
reducing computation time, four hydrologic soil group classification, e.g. A, B, C, or D, were
used instead of the soil series classification. Normally this would decrease the resolution of
parameter inputs such as hydraulic conductivity and soil capacities. However, most of the data
applied in the WEAP model is extracted from IMTA’s HEC-HMS report, which reports
hydraulic parameters calibrated on a sub-basin scale rather than a soil group scale. For this
reason the consolidation of soil areas will not affect the results of the model because the
limitation is inherent with the resolution of the input parameter data.
Figure 8a and b compare the land use coverages from the SWAT and IMTA data sets,
respectively. The IMTA shapefile data set was applied to the WEAP model to determine
percentages of land use areas per basin. HEC-HMS however, does not utilize parameters such as
crop coefficient and leaf area index which apply to land use categories and these are required in
WEAP’s Soil Moisture Method. These parameter values were taken from the SWAT dataset and
from literature, respectively. The significant difference between the two land use coverages is
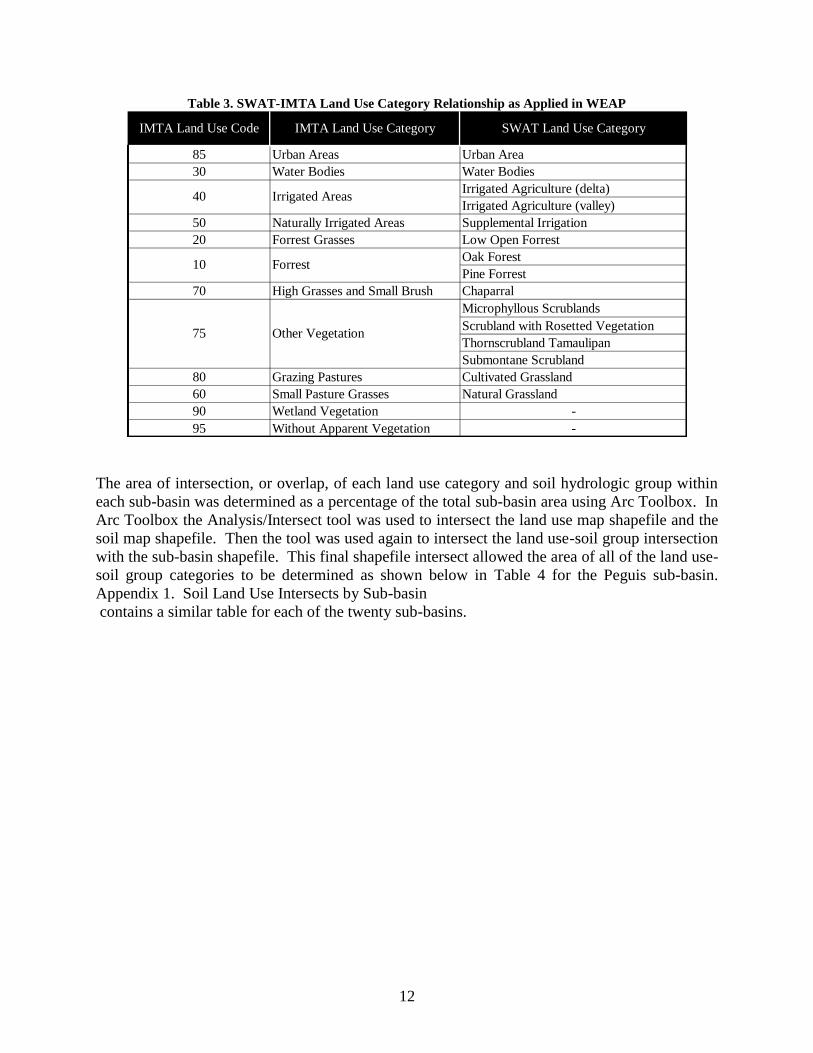
the number of categories and type of categories defined. Table 3 defines the relationship
between the categories as applied to the WEAP model. In cases where multiple SWAT land use
categories are shown to correlate to one IMTA land use category, the multiple values from the
SWAT data set were averaged and applied to the single IMTA category in WEAP. Values were
estimated for categories with no correlation.

11
Figure 8a. SWAT Land Use Coverage (World Bank 2006)
Figure 8b. IMTA Soil Coverage Applied to WEAP
Figure 8. Land Use Coverage Datasets
12
Table 3. SWAT-IMTA Land Use Category Relationship as Applied in WEAP
The area of intersection, or overlap, of each land use category and soil hydrologic group within
each sub-basin was determined as a percentage of the total sub-basin area using Arc Toolbox. In
Arc Toolbox the Analysis/Intersect tool was used to intersect the land use map shapefile and the
soil map shapefile. Then the tool was used again to intersect the land use-soil group intersection
with the sub-basin shapefile. This final shapefile intersect allowed the area of all of the land use-
soil group categories to be determined as shown below in Table 4 for the Peguis sub-basin.
Appendix 1. Soil Land Use Intersects by Sub-basin
contains a similar table for each of the twenty sub-basins.
85 Urban Areas Urban Area
30 Water Bodies Water Bodies
Irrigated Agriculture (delta)
Irrigated Agriculture (valley)
50 Naturally Irrigated Areas Supplemental Irrigation
20 Forrest Grasses Low Open Forrest
Oak Forest
Pine Forrest
70 High Grasses and Small Brush Chaparral
Microphyllous Scrublands
Scrubland with Rosetted Vegetation
Thornscrubland Tamaulipan
Submontane Scrubland
80 Grazing Pastures Cultivated Grassland
60 Small Pasture Grasses Natural Grassland
90 Wetland Vegetation -
95 Without Apparent Vegetation -
IMTA Land Use Code IMTA Land Use Category SWAT Land Use Category
75 Other Vegetation
40 Irrigated Areas
10 Forrest

13
Table 4. Peguis Sub-basin Soil- Land Use Intersect
Peguis Subbasin No. 1 Soil - Land Use Intersect
Soil Group Land Use Area (sq m) Area (sq km) % of Soil Group
A 10 10809 0.01 0.02
20 0 0.00 0.00
30 38164 0.04 0.05
40 6380071 6.38 8.91
50 6502437 6.50 9.08
60 20395521 20.40 28.49
70 27555676 27.56 38.49
75 5846984 5.85 8.17
80 2563815 2.56 3.58
85 576152 0.58 0.80
90 1721146 1.72 2.40
95 0 0.00 0.00
Total Soil Area (sq km) 71.59
% of Total Basin Area 0.93
Soil Group Land Use Area (sq m) Area (sq km) % of Soil Group
B 10 28325 0.03 0.00
20 1509 0.00 0.00
30 210334 0.21 0.01
40 718386 0.72 0.03
50 5966293 5.97 0.28
60 379643859 379.64 17.51
70 1699345239 1699.35 78.36
75 8675007 8.68 0.40
80 63771996 63.77 2.94
85 83173 0.08 0.00
90 4760341 4.76 0.22
95 5466388 5.47 0.25
Total Soil Area (sq km) 2168.67
% of Total Basin Area 28.16
Soil Group Land Use Area (sq m) Area (sq km) % of Soil Group
C 10 497 0.00 0.00
20 30915 0.03 0.00
30 61411 0.06 0.00
40 1953737 1.95 0.06
50 18742950 18.74 0.59
60 1081764821 1081.76 33.82
70 1677846763 1677.85 52.45
75 117288454 117.29 3.67
80 287986809 287.99 9.00
85 935075 0.94 0.03
90 3920024 3.92 0.12
95 8285730 8.29 0.26
Total Soil Area (sq km) 3198.82
% of Total Basin Area 41.53
Soil Group Land Use Area (sq m) Area (sq km) % of Soil Group
D 10 784935 0.78 0.03
20 0 0.00 0.00
30 779358 0.78 0.03
40 268422 0.27 0.01
50 1145767 1.15 0.05
60 196367414 196.37 8.68
70 1896450935 1896.45 83.81
75 43258657 43.26 1.91
80 119299233 119.30 5.27
85 152992 0.15 0.01
90 348263 0.35 0.02
95 3877069 3.88 0.17
Total Soil Area (sq km) 2262.73
% of Total Basin Area 29.38

14
2.4 River Reaches
River reaches cannot be input directly to WEAP from the geodatabase because the WEAP map
serves only as a conceptual schematic. The most significant rivers were added to the WEAP
schematic by first exporting and projecting the rivers from the CRWR geodatabase to the WEAP
display coordinate system and then adding the projected shapefile to WEAP as a vector layer.
The rivers were then drawn in WEAP by tracing over the vector layer. Figure 9a shows the main
rivers in the Rio Conchos basin that were imported as a background vector layer and Figure 9b
shows the selected river reach segments that were drawn in WEAP.
Figure 9a. Geodatabase Main Rivers Figure 9b. WEAP River Reaches
Figure 9. Rio Conchos CRWR Bi-National Geodatabase Hydroedges
Figure 10 compares the river reaches from the CRWR geodatabase with those drawn in WEAP;
the geodatabase reaches are shown in red and the WEAP reaches are in blue. Inaccuracies of the
required tracing are evident by the red lines visible adjacent to the blue lines. The river reaches
drawn in WEAP can be edited to more precise river reach lengths as measured from the CRWR
geodatabase by right clicking on the river reach and selecting Edit Data and then Reach Length.
WEAP uses reach length data when modeling the groundwater and surface water interactions.
Groundwater was not modeled in this project so the reach lengths were not adjusted in this
model. Although the reach length data was not used for this project, the values were determined
and appear in Appendix 2 for use in future work.

15
Figure 10. WEAP River Reaches
The river reaches were drawn into WEAP in segments relating to the sub-basin boundaries for
reasons related to catchment connectivity. Relating reach lengths to the sub-basin boundaries
allows for the runoff from a catchment to link to the river system in a physically appropriate
location. For example the Rio Conchos was traced as one segment in each sub-basin and named
accordingly, e.g. Rio_Conchos_20 represents the Rio Conchos through the Ojinaga sub-basin
which is identified as sub-basin number 20. The reach names are also shown in Figure 10.
There are two exceptions to the naming convention. The first exception is River_10, which
drains the El_Rejon sub-basin, sub-basin 10, through the Chuviscar sub-basin, sub-basin 9, to the
confluence with the Arroyo_Sacramento_9. This reach is generically named because it did not
have a name field in the CRWR geodatabase. The second exception is the WEAP river reach in
the La Boquilla sub-basin, sub-basin 19, which is named the RioBalleza_Conchos_19, because it
represents the Rio Balleza to the confluence with the Rio Conchos and the Rio Conchos from the
confluence to the sub-basin outlet. The river was traced in such a manner so that the Llanitos
sub-basin, sub-basin 12, could be entered as headwater to the river reach segment and so that the
La Boquilla sub-basin could be connected to the river in a more physically appropriate location,
this is further discussed subsequently.

16
2.5 Catchment Runoff to River Connectivity
Once the river system is traced and named the catchment data is edited to direct the runoff from
the sub-basin to the appropriate river reach. For example the Rio Florido headwaters are in the
Puente FFC sub-basin, sub-basin 16, and flows through the San Gabriel sub-basin, sub-basin 15,
the San Antonio sub-basin, sub-basin 14, the Pico de Aquila sub-basin, sub-basin 13, the Jimenez
sub-basin, sub-basin 18, and part of the Las Burras sub-basin, sub-basin 3, to the confluence with
the Rio Conchos. Figure 11 shows the upper Rio Florido portion of the WEAP schematic. The
solid blue lines are rivers and the dashed blue lines are the conceptual connection of the
catchment to the river reach.
Figure 11. WEAP Schematic of the Rio Florido Connectivity
The schematic shows the connectivity either connecting directly to the head of a reach or as a
perpendicular line to the closest point on the identified river reach. The actual surface flow
contribution, however, connects to the center of the selected river reach. For example there is no
river reach in the Puente FFC sub-basin, because runoff from the sub-basin is entered as head
flow for the segment through the downstream San Gabriel sub-basin, Rio_Florido_15. Runoff
from the San Gabriel sub-basin enters the Rio_Florido_15 at the center of the river segment. The
runoff contribution point is dictated by right clicking on the catchment, selecting General Info,
and then selecting the river reach from the pull down menu and selecting the head flow option if
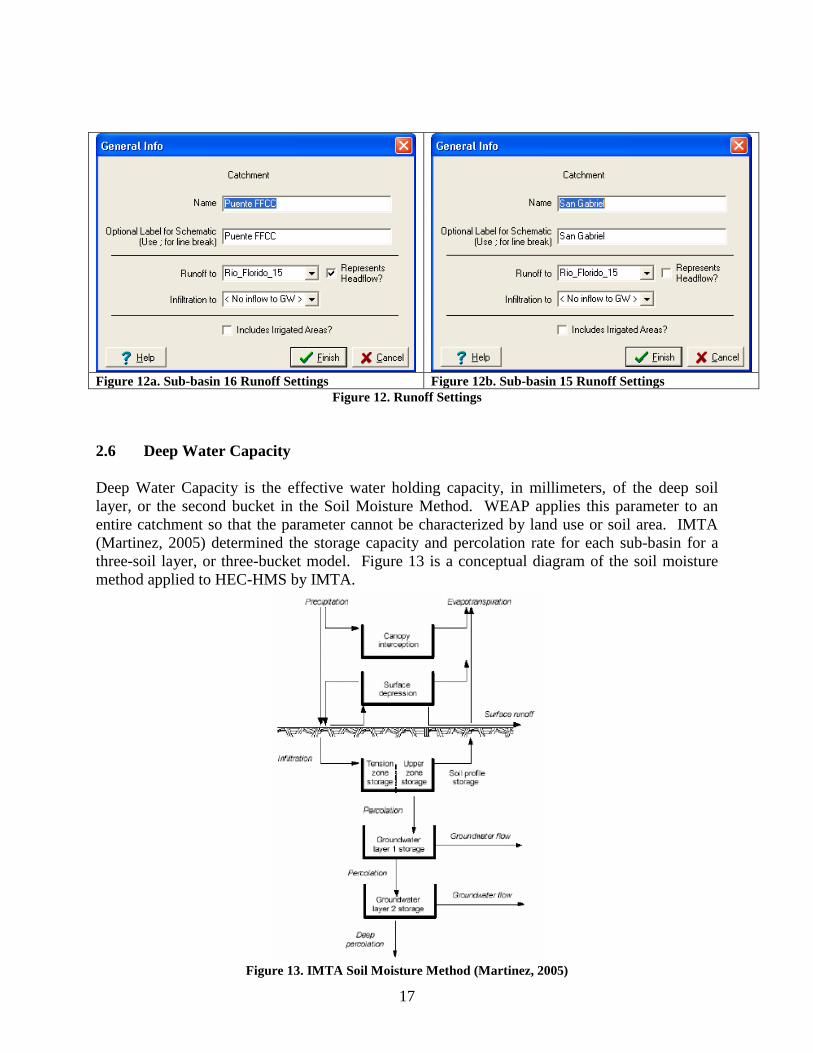
desired. Figure 12 shows the WEAP window settings for the above example.
17
Figure 12a. Sub-basin 16 Runoff Settings Figure 12b. Sub-basin 15 Runoff Settings
Figure 12. Runoff Settings
2.6 Deep Water Capacity
Deep Water Capacity is the effective water holding capacity, in millimeters, of the deep soil
layer, or the second bucket in the Soil Moisture Method. WEAP applies this parameter to an
entire catchment so that the parameter cannot be characterized by land use or soil area. IMTA
(Martinez, 2005) determined the storage capacity and percolation rate for each sub-basin for a
three-soil layer, or three-bucket model. Figure 13 is a conceptual diagram of the soil moisture
method applied to HEC-HMS by IMTA.
Figure 13. IMTA Soil Moisture Method (Martinez, 2005)

18
The first bucket in the WEAP Soil Moisture Method relates to the “Soil Profile” layer in IMTA’s
model. “Ground Water 1” is the second layer in IMTA’s model that relates to the second bucket
in the WEAP Soil Moisture Method. Data for the third bucket of IMTA’s model was not utilized
because the Soil Moisture Method in WEAP only supports two layers. Table 5 lists the values
for Deep Water Capacity found in the IMTA report and those applied in the WEAP model.
Table 5. Deep Water Capacity Values
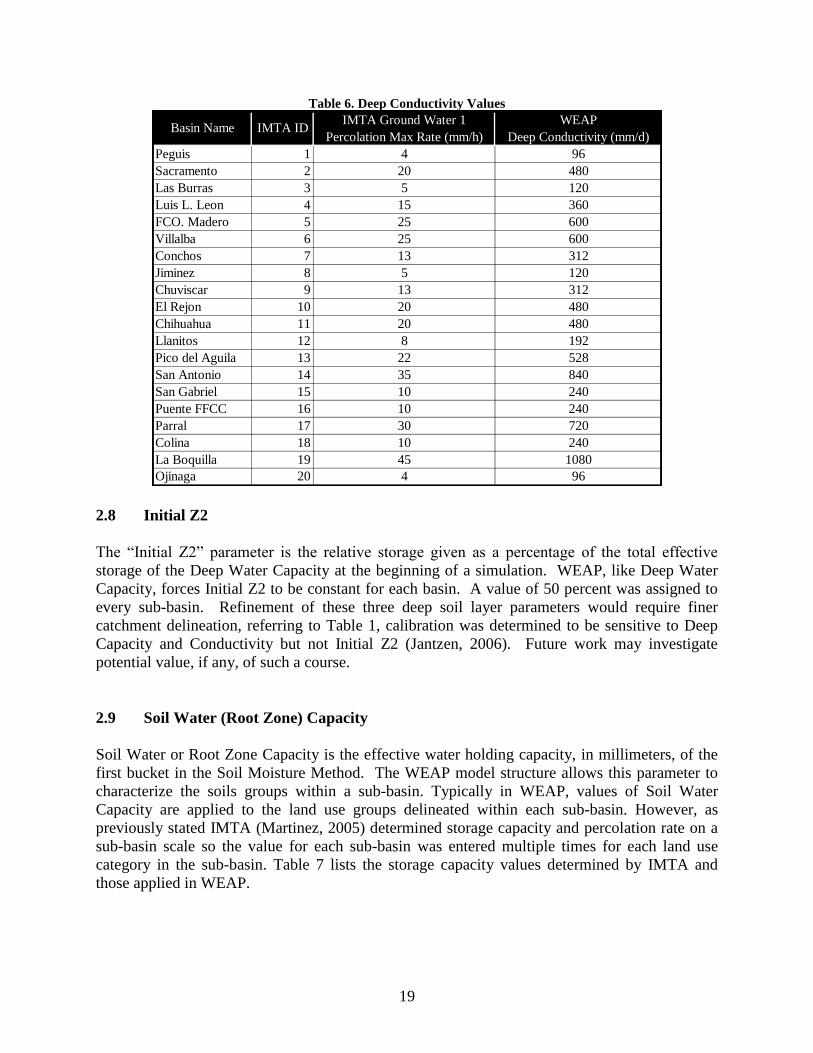
2.7 Deep Conductivity
The Deep Conductivity parameter represents the conductivity rate of the second bucket, in
millimeters per day. As Figure 2 shows, Deep Conductivity controls the transmission of base
flow. WEAP applies a single value of Deep Conductivity to the entire catchment. IMTA
determined percolation rates for each sub-basin, which are applied as conductivity values by
setting the Preferred Flow Direction Values to 0, which indicates 100% vertical flow as
percolation implies. The Preferred Flow Direction is discussed in a subsequent section. Table 6
lists the values IMTA determined for percolation rates and those applied to Deep Conductivity in
the WEAP model.
IMTA Ground Water 1 WEAP
Storage Capacity (mm) Deep Water Capacity (mm)
Peguis 1 4 4
Sacramento 2 5 5
Las Burras 3 1 1
Luis L. Leon 4 25 25
FCO. Madero 5 10 10
Villalba 6 8 8
Conchos 7 3 3
Jiminez 8 3 3
Chuviscar 9 3 3
El Rejon 10 10 10
Chihuahua 11 5 5
Llanitos 12 1 1
Pico del Aguila 13 5 5
San Antonio 14 20 20
San Gabriel 15 25 25
Puente FFCC 16 25 25
Parral 17 8 8
Colina 18 15 15
La Boquilla 19 15 15
Ojinaga 20 4 4
IMTA IDBasin Name
19
Table 6. Deep Conductivity Values
IMTA Ground Water 1 WEAP
Percolation Max Rate (mm/h) Deep Conductivity (mm/d)
Peguis 1 4 96
Sacramento 2 20 480
Las Burras 3 5 120
Luis L. Leon 4 15 360
FCO. Madero 5 25 600
Villalba 6 25 600
Conchos 7 13 312
Jiminez 8 5 120
Chuviscar 9 13 312
El Rejon 10 20 480
Chihuahua 11 20 480
Llanitos 12 8 192
Pico del Aguila 13 22 528
San Antonio 14 35 840
San Gabriel 15 10 240
Puente FFCC 16 10 240
Parral 17 30 720
Colina 18 10 240
La Boquilla 19 45 1080
Ojinaga 20 4 96
IMTA IDBasin Name
2.8 Initial Z2
The “Initial Z2” parameter is the relative storage given as a percentage of the total effective
storage of the Deep Water Capacity at the beginning of a simulation. WEAP, like Deep Water
Capacity, forces Initial Z2 to be constant for each basin. A value of 50 percent was assigned to
every sub-basin. Refinement of these three deep soil layer parameters would require finer
catchment delineation, referring to Table 1, calibration was determined to be sensitive to Deep
Capacity and Conductivity but not Initial Z2 (Jantzen, 2006). Future work may investigate
potential value, if any, of such a course.
2.9 Soil Water (Root Zone) Capacity
Soil Water or Root Zone Capacity is the effective water holding capacity, in millimeters, of the
first bucket in the Soil Moisture Method. The WEAP model structure allows this parameter to
characterize the soils groups within a sub-basin. Typically in WEAP, values of Soil Water
Capacity are applied to the land use groups delineated within each sub-basin. However, as
previously stated IMTA (Martinez, 2005) determined storage capacity and percolation rate on a
sub-basin scale so the value for each sub-basin was entered multiple times for each land use
category in the sub-basin. Table 7 lists the storage capacity values determined by IMTA and
those applied in WEAP.

20
Table 7. Soil Capacity Values
WEAP employs a method known as “Key Assumption”, which allows parameter values that will
be applied frequently to be coded in once as a Key Assumption and then referenced throughout
the model. The Soil Water Capacity values were coded using the Key Assumption function to
assign the sub-basin value to each land use within each soil group. The Root Zone Capacity Key
Assumption setup and application are shown in Figure 14 and Figure 15.
IMTA Soil Profile WEAP
Storage Capacity (mm) Root Zone Capacity (mm)
Peguis 1 20 20
Sacramento 2 20 20
Las Burras 3 10 10
Luis L. Leon 4 15 15
FCO. Madero 5 15 15
Villalba 6 9 9
Conchos 7 10 10
Jiminez 8 25 25
Chuviscar 9 10 10
El Rejon 10 5 5
Chihuahua 11 10 10
Llanitos 12 6 6
Pico del Aguila 13 10 10
San Antonio 14 10 10
San Gabriel 15 8 8
Puente FFCC 16 8 8
Parral 17 15 15
Colina 18 10 10
La Boquilla 19 5 5
Ojinaga 20 20 20
IMTA IDBasin Name

21
Figure 14. Root Zone Capacity Key Assumptions Setup
Figure 15. Root Zone Capacity Key Assumptions Applied

22
2.10 Root Zone Conductivity
Root Zone Conductivity or soil conductivity is the conductivity in the first bucket. Conductivity
rate typically varies among soil and land use classifications. As with the second bucket IMTA
determined percolation rates for the first bucket for each sub-basin. Again the percolation values
are applied as conductivity values by setting the Preferred Flow Direction Values to 0.
Table 8 lists the values for percolation in the first bucket determined by IMTA and those applied
to Root Zone Conductivity in the WEAP model. A Key Assumption for the Root Zone
Conductivity of each basin was created. The land use branches within each sub-basin and soil
group then referenced the Key Assumption.
Table 8. Root Zone Conductivity Basin Values
2.11 Preferred Flow Direction
The Preferred Flow Direction parameter is used to partition flow out of the root zone layer to the
lower soil layer or groundwater. Preferred flow direction can vary by land use classification and
ranges from 0 to 1. A preferred flow direction of 1 indicates 100% horizontal flow direction
while 0 indicates 100% vertical flow direction. A Key Assumption for the Preferred Flow
Direction of each land use category was created with a value equal to zero to effectively apply
the available percolation data from IMTA to hydraulic conductivity input, refer to Figure 2.
Again, each land use category branch then references the Key Assumption for Preferred Flow
Direction.
IMTA Soil Profile WEAP
Percolation Max Rate (mm/h) Soil Conductivity (mm/d)
Peguis 1 6.00 144
Sacramento 2 25.00 600
Las Burras 3 2.00 48
Luis L. Leon 4 8.00 192
FCO. Madero 5 25.00 600
Villalba 6 23.00 552
Conchos 7 1.25 30
Jiminez 8 26.00 624
Chuviscar 9 1.25 30
El Rejon 10 10.00 240
Chihuahua 11 1.00 24
Llanitos 12 2.00 48
Pico del Aguila 13 5.00 120
San Antonio 14 25.00 600
San Gabriel 15 0.28 7
Puente FFCC 16 0.28 7
Parral 17 15.00 360
Colina 18 15.00 360
La Boquilla 19 5.00 120
Ojinaga 20 6.00 144
IMTA IDBasin Name

23
2.12 Initial Z1
The Initial Z1 parameter is the relative storage given as a percentage of the total effective storage
of the Root Zone Water Capacity at the beginning of a simulation. Therefore, like Root Zone
Water Capacity this parameter typically varies with the land use, however, because the Root
Zone Capacity parameter is coded by basin Initial Z1 was done in the same way. A Key
Assumption for the Initial Z1 value of each sub-basin was created with a value equal to 20
percent. Each land use category within the sub-basins then references the Key Assumption.
2.13 Crop Coefficient, Kc
The crop coefficient, Kc, parameter represents the effects of vegetative evapotranspiration and
soil evaporation, for this reason the parameter varies by land class type. The parameter was
created to study the required soil moisture to maximize crop biomass production; hence, Kc is
typically used to calculate the required evapotranspiration using the equation:
(Evapotranspiration)required = Kc * (Evapotranspiration)reference
The Rio Bravo study (World Bank, 2006) determined actual and potential evapotranspiration,
which relates to the required and potential evapotranspiration, respectively. These values were
determined for fifteen land use categories which differ from the land use categories determined
by IMTA and used in the WEAP model. Section 2.3 discusses these differences. Table 9 lists
World Banks data and the crop coefficient values applied in WEAP. A Key Assumption for the
Kc value of each land use category was created and the land use branches within each sub-basin
reference the Key Assumptions.
Table 9. Crop Coefficient Values
ETact ETpot
(mm) (mm)
Urban Area 803 1048 0.77 85 Urban Areas 0.77
Water Bodies 1578 1578 1.00 30 Water Bodies 1.00
Irrigated Agriculture (delta) 1202 1346 0.89
Irrigated Agriculture (valley) 898 1040 0.86
Supplemental Irrigation 1242 1298 0.96 50 Naturrally Irrigated Areas 0.96
Low Open Forrest 483 1272 0.38 20 Forrest Grasses 0.38
Oak Forest 538 1747 0.31
Pine Forrest 487 1272 0.38
Chapparral 481 1424 0.34 70 High Grasses and Small Brush 0.34
Microphyllous Scrublands 237 501 0.47
Scrubland with Rosetted Vegetation 263 616 0.43
Thornscrubland Tamaulipan 583 1254 0.46
Submontane Scrubland 711 1605 0.44
Cultivated Grassland 516 1129 0.46 80 Grazing Pastures 0.46
Natural Grassland 342 642 0.53 60 Small Pasture Grasses 0.53
- - - - 90 Wetland Vegetation 0.9
- - - - 95 Without Apparent Vegetation 0.3
0.35Forrest10
75 Other Vegetation 0.45
Kc Used in
Weap
40 Irrigated Areas 0.88
Land Use IMTA Land
Use CodeIMTA Land Use CategoryKc

24
2.14 Leaf Area Index
Leaf Area Index (LAI) is a parameter that varies by land use and is used to control the surface
runoff response. Runoff tends to decrease with higher values of LAI. LAI is not an easily
determined parameter and there are many discrepancies in definitions and values, which apply to
the same land use. Scurlock et al. (2001) compiled estimates of LAI published between 1932
and 2000 and produced a table of LAI values for fifteen categories of vegetative land use. The
LAI values produced by Scurlock et al. are shown in Table 10. The values as applied to the
WEAP model are listed in Table 11.
Referring to Table 1, simulated flow results from WEAP are highly sensitive to Kc and LAI
parameters. Future work should include an investigation into the importance of these values and
the cost benefit for applying site specific LAI versus literature values and importance of seasonal
Kc and LAI values
Table 10. LAI Values Scurlock et al. , 2001

25
Table 11. LAI Values
2.15 Precipitation
Precipitation data was obtained from the IMTA DSS file as spatially weighted daily values for
each sub-basin. IMTA (Martinez, 2005) applied the Theissen polygon method to sixty-five
climate stations, shown in Figure 16, to determine the incremental precipitation per day for each
sub-basin for the period of 1980 to 1999. The differences between the sub-basins as IMTA
delineated them and as they were delineated for this study (Figure 5) transfer to the application
of the spatially weighted data obtained from IMTA, however, the effect is expected to be minor
is not investigated or addressed in this report.
Figure 16. IMTA Precipitation Stations (Martinez, 2005)
Scurlock et al., 2001
Land Use Category
Forest Average 10 Forrest 5.18
Forest Average (BoDBL and BOENL) 20 Forrest Grasses 3.07
30 Water Bodies 0.10
Crops 40 Irrigated Areas 4.22
Crops 50 Naturrally Irrigated Areas 4.22
Grassland 60 Small Pasture Grasses 2.50
Shrub 70 High Grasses and Small Brush 2.08
Shrub 75 Other Vegetation 2.08
Grassland 80 Grazing Pastures 2.50
85 Urban Areas 8.00
Wetlands 90 Wetland Vegetation 6.34
Desert 95 Without Apparent Vegetation 1.31
IMTA Land Use
CodeIMTA Land Use Category
LAI Used in
Weap

26
The precipitation data extracted from the DSS file was formatted in Excel and saved as a CSV
file, which can be read by WEAP as a daily time series expression. An excerpt of the Excel file
is shown in Figure 17 and Figure 18 shows how the time series for each sub-basin are entered in
WEAP.
Figure 17. Excerpt of Precipitation Data CSV File
Figure 18. WEAP Precipitation Time Series Expression
# WEAP COLUMN NUMBER 3 4 5
# IMTA BASIN NUMBER 1 2 3
# REPORT BASIN NAME PEGUIS SACRAMENTO LAS BURRAS
# HMS BASIN NAME PEGUIS SACRAMENTO BURRAS
# GAGE GAGE GAGE
# MM MM MM
# Year Day Count Month Day PER-CUM PER-CUM PER-CUM
1980 1 1 1 0.000 0.000 0.000
1980 2 1 2 0.000 0.000 0.000
1980 3 1 3 0.000 0.000 0.000
1980 4 1 4 0.000 0.000 0.000
1980 5 1 5 0.000 0.000 0.000
1980 6 1 6 0.000 0.000 0.000
1980 7 1 7 0.000 0.000 0.000
1980 8 1 8 0.000 0.000 0.000
1980 9 1 9 0.000 0.000 0.000
1980 10 1 10 0.000 0.000 0.000
1980 11 1 11 0.000 0.000 0.000
1980 12 1 12 0.500 0.000 0.200
1980 13 1 13 0.000 0.000 0.000
1980 14 1 14 0.000 0.000 0.000
1980 15 1 15 0.000 0.000 0.000
1980 16 1 16 0.000 0.000 0.000
1980 17 1 17 0.000 0.000 0.000
1980 18 1 18 0.000 0.000 0.000
1980 19 1 19 0.000 0.000 0.000

27
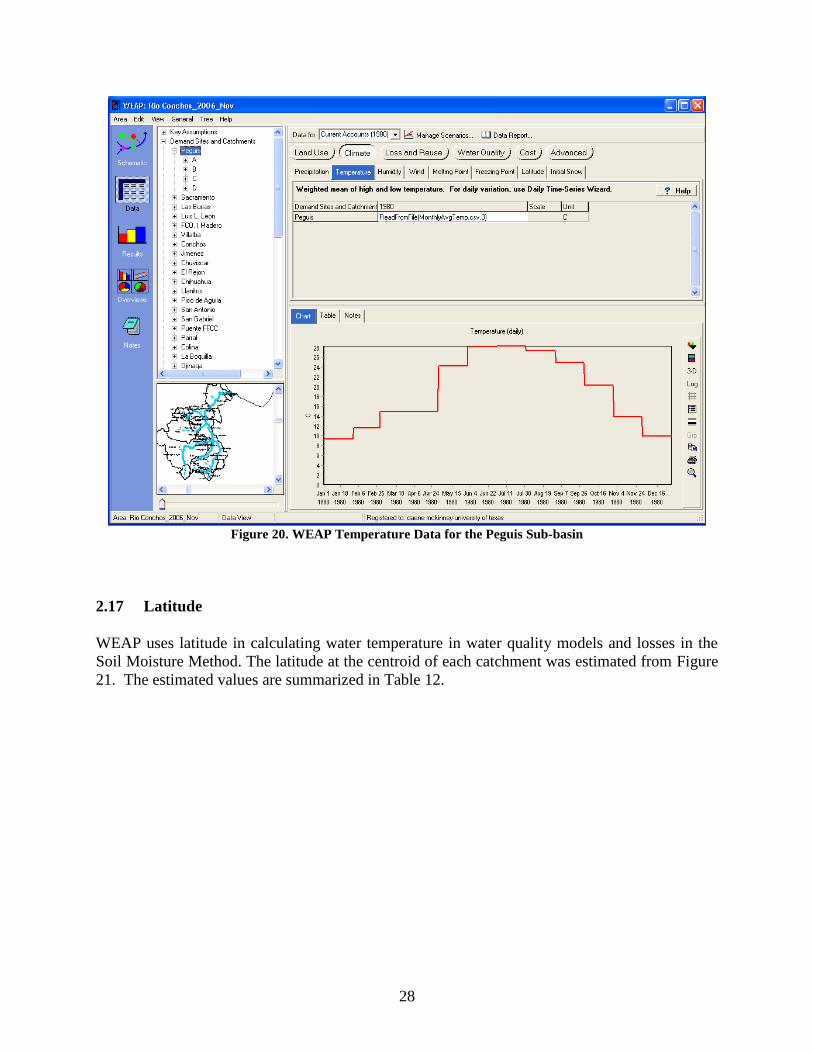
2.16 Temperature, Wind and Humidity
Temperature data is entered in degrees Celsius. Humidity is the relative humidity entered as a
percentage and Wind values are entered in meters per second. Ideally, each of the parameters
should be entered as time series data following the chosen time step of the model, days in this
case. However, only averaged monthly data in raster format was available for the Rio Bravo
basin from the SWAT data set. The Zonal Statistics tool in Arc Toolbox was used to determine a
single average monthly value for each sub-basin for each of the three parameters. The monthly
values were repeated for every day of the corresponding month and read into WEAP as a time
series expression from a CSV file.
Figure 19. Excerpt of Temperature Data CSV File
# WEAP Column 3 4 5
# SWAT DATA
# IMTA BASIN NUMBER 1 2 3
# BASIN NAME PEGUIS SACRAMENTO LAS BURRAS
# Year Month Temp Temp Temp
# 1 9.37 8.8 10
# 2 11.57 10.46 12.24
# 3 14.9 13.52 15.63
# 4 19.87 17.56 20.35
# 5 24.22 21.3 23.84
# 6 28.16 24.88 26.87
# 7 28.32 24.42 25.95
# 8 27.4 23.5 25.29
# 9 25 21.38 23.06
# 10 20.33 17.46 19.32
# 11 13.92 12.4 13.98
# 12 9.86 9 10.51
# Year Day Count Month Day Flow (Mm^3)Flow (Mm^3) Flow (Mm^3)
1980 1 1 1 9.37 8.8 10
1980 2 1 2 9.37 8.8 10
1980 3 1 3 9.37 8.8 10
1980 4 1 4 9.37 8.8 10
1980 5 1 5 9.37 8.8 10
1980 6 1 6 9.37 8.8 10
1980 7 1 7 9.37 8.8 10
28
Figure 20. WEAP Temperature Data for the Peguis Sub-basin
2.17 Latitude
WEAP uses latitude in calculating water temperature in water quality models and losses in the
Soil Moisture Method. The latitude at the centroid of each catchment was estimated from Figure
21. The estimated values are summarized in Table 12.

29
Figure 21. Latitude and Longitude (Martinez 2005)
Table 12. Sub-basin Latitude Values
Basin Name IMTA ID Latitude
DD
Peguis 1 29.50
Sacramento 2 29.00
Las Burras 3 28.00
Luis L. Leon 4 29.00
FCO. Madero 5 28.50
Villalba 6 28.00
Conchos 7 28.00
Jimenez 8 27.50
Chuviscar 9 27.00
El Rejon 10 28.50
Chihuahua 11 28.50
Llanitos 12 26.50
Pico del Aguila 13 26.50
San Antonio 14 26.50
San Gabriel 15 26.50
Puente FFCC 16 26.50
Parral 17 26.50
Colina 18 27.00
La Boquilla 19 29.50
Ojinaga 20 29.50
2.18 Melting Point, Freezing Point and Initial Snow
The remaining three climatic parameters are Melting Point, Freezing Point and Initial Snow
value. Melting Point is the threshold for snow melt in degrees Celsius. A value of 0 was used for
30
all basins. Freezing Point is the threshold for snow accumulation in degrees Celsius. A value of
0 was used for all basins. The Initial Snow value is the snow accumulation at the beginning of
the first month of the simulation. Zero was chosen as the initial value for each of the twenty
catchments.
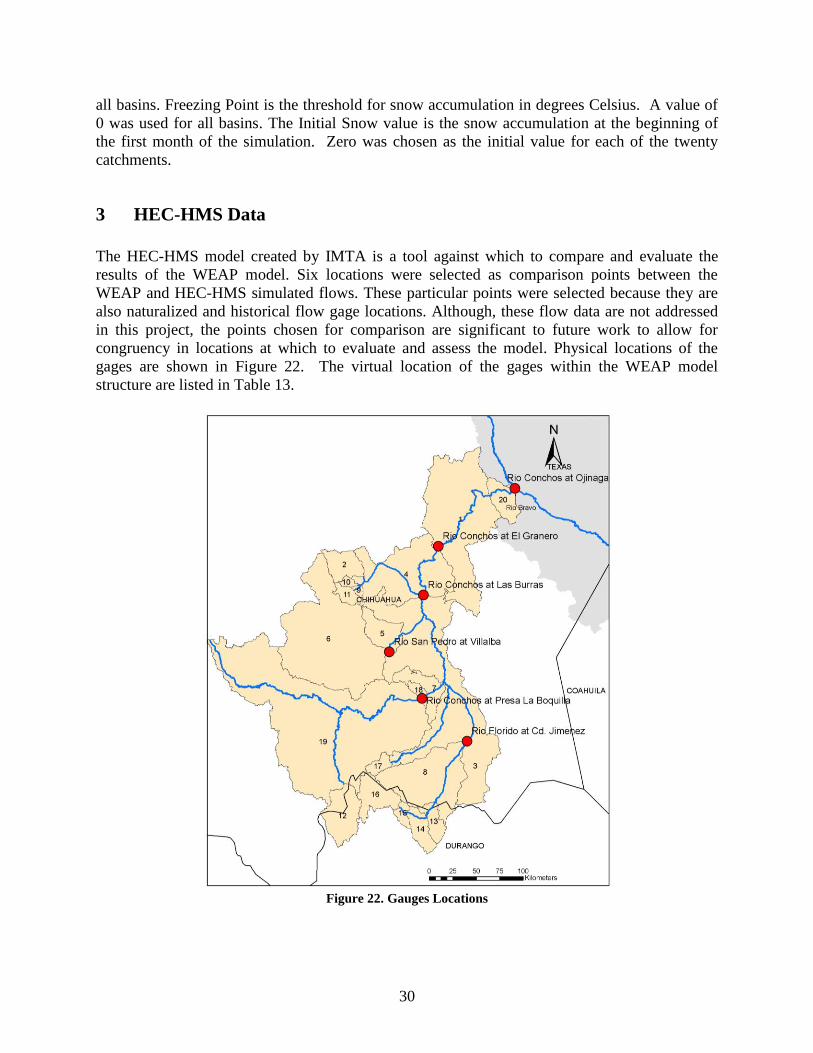
3 HEC-HMS Data
The HEC-HMS model created by IMTA is a tool against which to compare and evaluate the
results of the WEAP model. Six locations were selected as comparison points between the
WEAP and HEC-HMS simulated flows. These particular points were selected because they are
also naturalized and historical flow gage locations. Although, these flow data are not addressed
in this project, the points chosen for comparison are significant to future work to allow for
congruency in locations at which to evaluate and assess the model. Physical locations of the
gages are shown in Figure 22. The virtual location of the gages within the WEAP model
structure are listed in Table 13.
Figure 22. Gauges Locations
31
Table 13. Rio Conchos Gages
Gage Name Gage Location HydroID
Rio Conchos at Ojinaga Bottom of Reach Rio_Conchos_20 2020200051
Rio Conchos at El Granero Top of Reach Rio_Conchos_1 2020200004
Rio Conchos at Las Burras Bottom of Reach Rio_Conchos_3 2020200003
Rio San Pedro at Villalba Top of Reach Rio_San_Pedro_5 2020200001
Rio Conchos at Presa La Boquilla Top of Reach Rio_Conchos_18 2020200005
Rio Florido at Cd. Jimenez Top of Reach Rio_Florido_3 2020200002
Many problems were encountered while using the HEC-HMS model received from IMTA
including errors for missing input data and incomplete run configurations to correlate to the gage
locations. Model runs for La Boquilla, Jimenez and Villalba were completed but with
uncertainty. Run configurations for the remaining three gage locations were not completed due to
either parameter errors or seemingly missing model components. For these reasons a request was
made to IMTA for the direct results of the model; subsequently IMTA provided a DSS file with
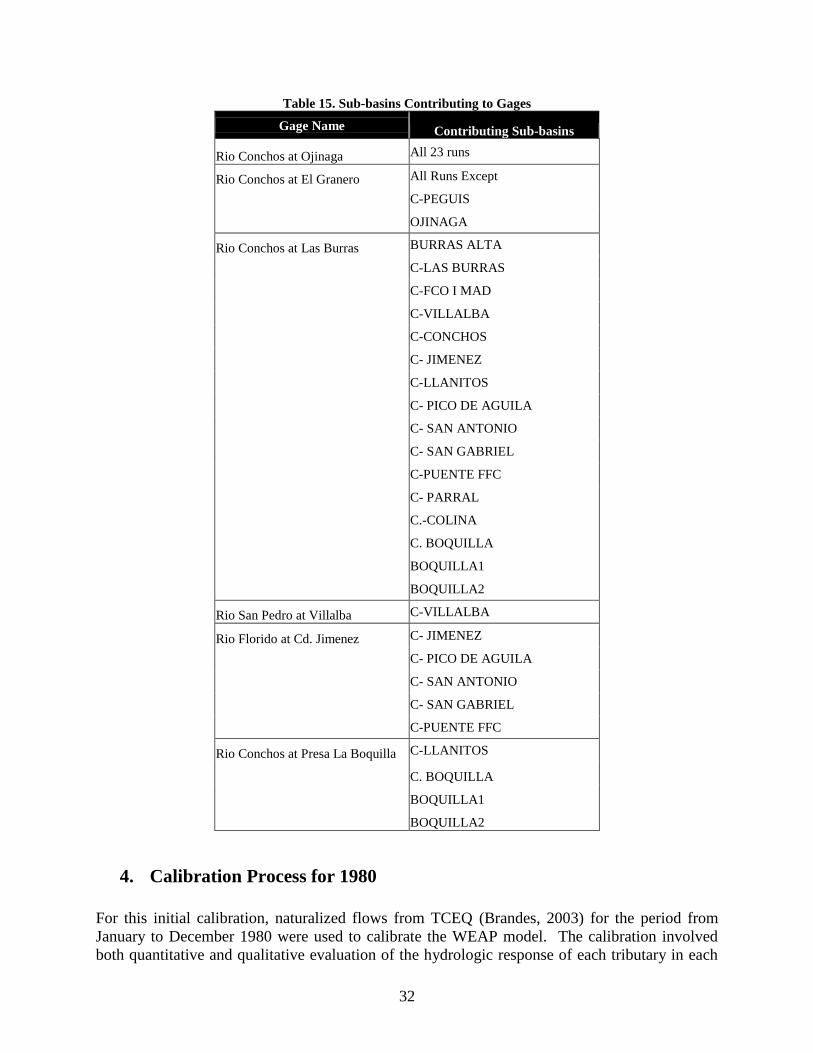
the hourly computed flow rate for all run configurations for the year 1980. Table 15 contains the
run configuration names within the DSS file and the correlation to the gage locations.
There were large discrepancies between the computed volumes determined from the model for
La Boquilla, Jimenez and Villalba and the values from the DSS file. The source of this
discrepancy is unknown at this time possible causes are user error or the use of an incomplete
model. The values obtained from each source are listed below:
Table 14. Comparison of HEC-HMS Model and DSS Flow Values
Gage Name HEC-HMS Flow (Mm3) DSS Flow from IMTA (Mm3)
Rio Conchos at Ojinaga - 2,740
Rio Conchos at El Granero - 2,620
Rio Conchos at Las Burras - 2,409
Rio San Pedro at Villalba 4,171 864
Rio Florido at Cd. Jimenez 2,064 262
Rio Conchos at Presa La Boquilla 2,064 923
32
Table 15. Sub-basins Contributing to Gages
Gage Name Contributing Sub-basins
Rio Conchos at Ojinaga All 23 runs
Rio Conchos at El Granero All Runs Except
C-PEGUIS
OJINAGA
Rio Conchos at Las Burras BURRAS ALTA
C-LAS BURRAS
C-FCO I MAD
C-VILLALBA
C-CONCHOS
C- JIMENEZ
C-LLANITOS
C- PICO DE AGUILA
C- SAN ANTONIO
C- SAN GABRIEL
C-PUENTE FFC
C- PARRAL
C.-COLINA
C. BOQUILLA
BOQUILLA1
BOQUILLA2
Rio San Pedro at Villalba C-VILLALBA
Rio Florido at Cd. Jimenez C- JIMENEZ
C- PICO DE AGUILA
C- SAN ANTONIO
C- SAN GABRIEL
C-PUENTE FFC
Rio Conchos at Presa La Boquilla C-LLANITOS
C. BOQUILLA
BOQUILLA1
BOQUILLA2
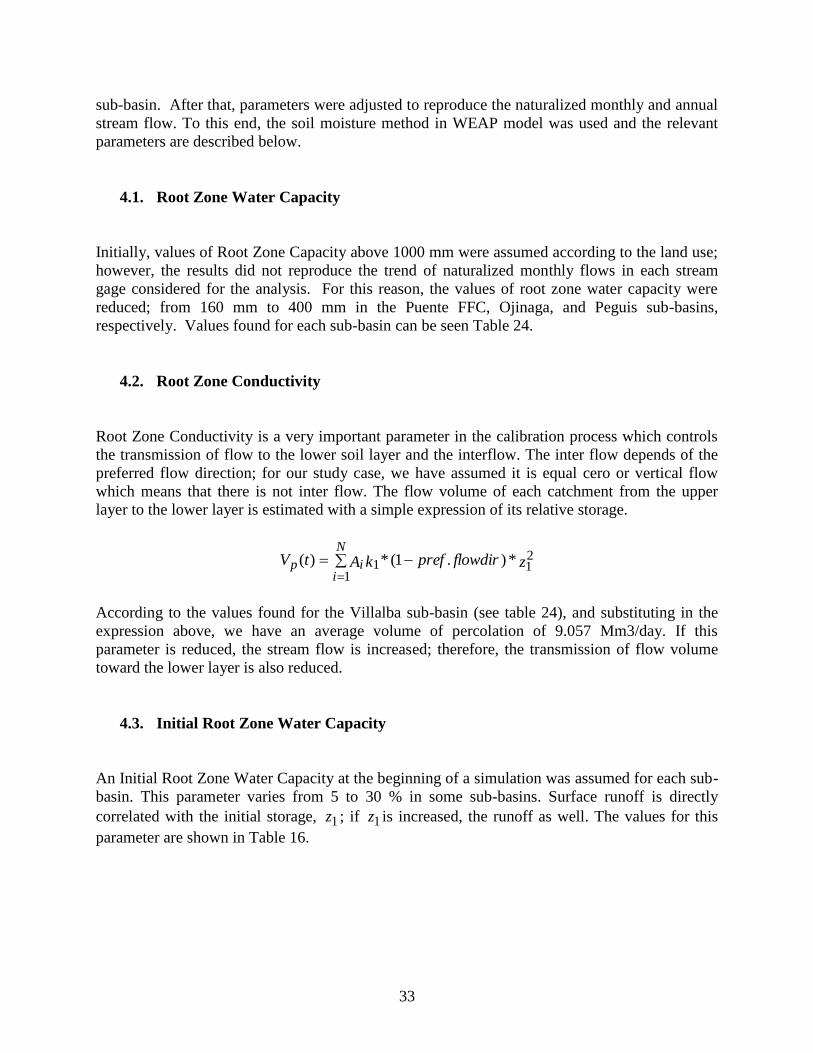
4. Calibration Process for 1980
For this initial calibration, naturalized flows from TCEQ (Brandes, 2003) for the period from
January to December 1980 were used to calibrate the WEAP model. The calibration involved
both quantitative and qualitative evaluation of the hydrologic response of each tributary in each
33
sub-basin. After that, parameters were adjusted to reproduce the naturalized monthly and annual
stream flow. To this end, the soil moisture method in WEAP model was used and the relevant
parameters are described below.
4.1. Root Zone Water Capacity
Initially, values of Root Zone Capacity above 1000 mm were assumed according to the land use;
however, the results did not reproduce the trend of naturalized monthly flows in each stream
gage considered for the analysis. For this reason, the values of root zone water capacity were
reduced; from 160 mm to 400 mm in the Puente FFC, Ojinaga, and Peguis sub-basins,
respectively. Values found for each sub-basin can be seen Table 24.
4.2. Root Zone Conductivity
Root Zone Conductivity is a very important parameter in the calibration process which controls
the transmission of flow to the lower soil layer and the interflow. The inter flow depends of the
preferred flow direction; for our study case, we have assumed it is equal cero or vertical flow
which means that there is not inter flow. The flow volume of each catchment from the upper
layer to the lower layer is estimated with a simple expression of its relative storage.
N
iip zflowdirprefkAtV
1
211 *).1(*)(
According to the values found for the Villalba sub-basin (see table 24), and substituting in the
expression above, we have an average volume of percolation of 9.057 Mm3/day. If this
parameter is reduced, the stream flow is increased; therefore, the transmission of flow volume
toward the lower layer is also reduced.
4.3. Initial Root Zone Water Capacity
An Initial Root Zone Water Capacity at the beginning of a simulation was assumed for each sub-
basin. This parameter varies from 5 to 30 % in some sub-basins. Surface runoff is directly
correlated with the initial storage, 1z ; if 1z is increased, the runoff as well. The values for this
parameter are shown in Table 16.

34
Table 16. WEAP Upper Layer Soil Parameters Calibrated for the Conchos River Basin
Drainage Bucket 1
Sub-basin Area Root Zone Root Zone Initial
Km2 Capacity Conductivity Z1
Mm mm/day %
Peguis 7999.2972 400 120 10
Sacramento 1042.6059 250 70 10
Las Burras 11309.4666 350 80 10
Luis L. Leon 5085.5131 350 120 5
FCO. I Madero 1211.3488 260 24 20
Villalba 9556.8624 253 13 27
Conchos 1114.3944 280 14 30
Jimenez 4422.9591 257 28 10
Chuviscar 106.0884 250 75 10
El Rejon 146.8494 250 70 10
Chihuahua 399.9897 250 80 10
Llanitos 1829.9295 270 4 30
Pico de Aguila 647.6067 250 45 5
San Antonio 821.1609 210 24 10
San Gabriel 305.8525 210 24 10
Puente FFCC 1270.6609 160 14 10
Parral 363.7890 250 12 10
Colina 259.0569 280 28 30
La Boquilla 18931.9788 315 4 30
Ojinaga 983.4705 400 100 10
4.4. Lower Deep Water Capacity
Values assumed for the Lower Deep Water Capacity are shown in Table 17. It is likely the high
values found in some sub-basins shows the existence of deep aquifers. Initially, values between
100 mm to 300 mm as deep water capacity were proposed for the sub-basins. This range of
values gave a high stream flow per year (relative to the naturalized flows), and a great amount of
base flow was generated from September to December. For this reason, upper values 2800 mm
were assumed and evaluated.
4.5. Lower Deep Conductivity
The Lower Deep Conductivity controls the transmission of base flow in each sub-basin. This
parameter can be estimated with the following expression:

35
)()(1
222
N
iif zkAtB
where iA is the area of the land use cover fraction, i, 2k is the conductivity rate of the lower
layer at full saturation ( 00.12 z ) in mm/month, and 2z is the relative storage given as a
percentage of the effective storage of the lower soil layer. From the expression mentioned
above, initial hydraulic conductivity was estimated of the following way:
22
2
)/(
z
ABk
if
The baseflow ( fB ) can be estimated with different methods depending of hydrologic behavior
of basin in study. To this end, considering the limitation of information, it is possible to make
rough calculations of the baseflow using the straight line method. For example, for the Villalba
sub-basin with a drainage area of 9,557 km2, the baseflow was estimated to be 1.5 Mm3/month
for 1980, and the average initial store 2z was assumed to be 4% for all fractions i, the resulting
hydraulic conductivity is monthmmk /982 , or equal to 3.2 mm/day. In this case, in order to
have more accurate results from the hydrologic simulation, this value was adjusted to 60
mm/month. The 2k parameter found for each sub-basin can be seen in Table 17.
4.6. Initial Lower Layer Capacity
Different values of Lower Layer Initial Storage were assumed in the hydrologic simulation. At
the beginning of the simulation, percentages around 40 – 50 % were assumed; nevertheless, in
many cases, the baseflow was more than 50 % with regard to the stream flow. For example, in
the Villalba Sub-basin, the baseflow was more than 70%; for this reason, small values of 2z were
assumed varying from 4% to 10%. The initial storage 2z assumed for each sub-basin is shown
in Table 17.

36
Table 17. WEAP Lower Layer Soil Parameters Calibrated for the Rio Conchos Basin
Drainage Bucket 2
Sub-basin Area Deep Water Deep Water
Conductivity
Initial
km2 Capacity Z2
Mm mm/day mm/month %
Peguis 7999.2972 4500 1.0 30.0 5
Sacramento 1042.6059 3500 2.0 60.0 5
Las Burras 11309.4666 4500 3.0 90.0 10
Luis L. Leon 5085.5131 30000 1.0 30.0 5
FCO. I Madero 1211.3488 3500 2.0 60.0 6
Villalba 9556.8624 2800 2.0 60.0 4
Conchos 1114.3944 3700 3.0 90.0 10
Jimenez 4422.9591 5000 0.5 15.0 4
Chuviscar 106.0884 3500 2.0 60.0 5
El Rejon 146.8494 3500 2.0 60.0 10
Chihuahua 399.9897 3500 2.0 60.0 5
Llanitos 1829.9295 25000 2.0 60.0 10
Pico de Aguila 647.6067 4500 0.5 15.0 5
San Antonio 821.1609 4000 0.5 15.0 5
San Gabriel 305.8525 4000 0.5 15.0 5
Puente FFCC 1270.6609 4000 0.5 15.0 5
Parral 363.7890 4000 3.0 90.0 5
Colina 259.0569 4000 2.0 60.0 10
La Boquilla 18931.9788 30000 3.5 105.0 10
Ojinaga 983.4705 4500 1.0 30.0 5
5 Results
This section compares the simulated flows from the IMTA HEC-HMS model and the WEAP
model for the calendar year 1980. This specific year (1980) was selected because it is the first
year within in the period of record, 1980 to 1999, for which IMTA utilized climatic data to
develop their HEC-HMS model. The year is also within the period of record, 1980 to 1985,
against which IMTA calibrated the values of Soil Capacity and Soil Conductivity.
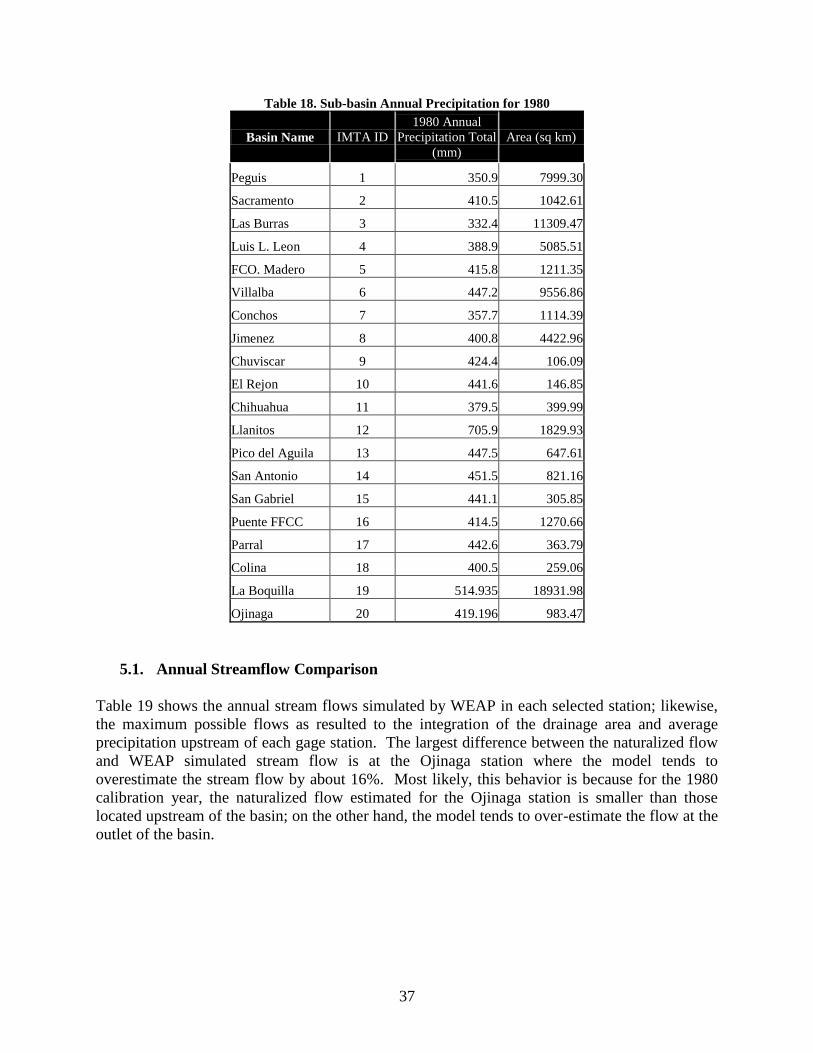
Before comparing the flows of the two models the total annual precipitation was determined for
each basin and the average annual precipitation was then determined for each of the gage
locations. The average annual precipitation was then multiplied by the drainage area to
determine to the maximum possible flow volume at each gage site. This serves as a good
reference point to evaluate the rough accuracy or plausibility of the simulated flow output. Table
18 contains the total annual precipitation of each sub-basin.
37
Table 18. Sub-basin Annual Precipitation for 1980
Basin Name IMTA ID
1980 Annual
Precipitation Total
(mm)
Area (sq km)
Peguis 1 350.9 7999.30
Sacramento 2 410.5 1042.61
Las Burras 3 332.4 11309.47
Luis L. Leon 4 388.9 5085.51
FCO. Madero 5 415.8 1211.35
Villalba 6 447.2 9556.86
Conchos 7 357.7 1114.39
Jimenez 8 400.8 4422.96
Chuviscar 9 424.4 106.09
El Rejon 10 441.6 146.85
Chihuahua 11 379.5 399.99
Llanitos 12 705.9 1829.93
Pico del Aguila 13 447.5 647.61
San Antonio 14 451.5 821.16
San Gabriel 15 441.1 305.85
Puente FFCC 16 414.5 1270.66
Parral 17 442.6 363.79
Colina 18 400.5 259.06
La Boquilla 19 514.935 18931.98
Ojinaga 20 419.196 983.47
5.1. Annual Streamflow Comparison
Table 19 shows the annual stream flows simulated by WEAP in each selected station; likewise,
the maximum possible flows as resulted to the integration of the drainage area and average
precipitation upstream of each gage station. The largest difference between the naturalized flow
and WEAP simulated stream flow is at the Ojinaga station where the model tends to
overestimate the stream flow by about 16%. Most likely, this behavior is because for the 1980
calibration year, the naturalized flow estimated for the Ojinaga station is smaller than those
located upstream of the basin; on the other hand, the model tends to over-estimate the flow at the
outlet of the basin.

38
Table 19. Annual TCEQ Naturalized and WEAP Simulated Flows for the Rio Conchos Basin
Gage Name
Drainage
Area
(km2)
Ave.
Precipitation
(mm)
Stream flows (Mm3) Ratio
WEAP/TCEQ
Ratio
WEAP/HMS TCEQ WEAP HMS
Rio Conchos at Ojinaga 67,809 429 2,029 2,362 2,740 1.16 0.86
Rio Conchos at El Granero 58,826 434 2,192 2,299 2,620 1.05 0.88
Rio Conchos at Las Burras 52,045 444 2,220 2,230 2,409 1.00 0.93
Rio San Pedro at Villalba 9,557 447 341 340 864 1.00 0.39
Rio Florido at Cd. Jiminez 7,468 431 123 123 262 1.00 0.47
Rio Conchos at La Boquilla 20,762 610 1,446 1,439 923 1.00 1.56
Figures Figure 23, Figure 24, Figure 25, Figure 26, Figure 27, and Figure 28 show the TCEQ
naturalized flows and the WEAP simulated flows for the selected gage stations. Figure 23 is a
plot of the monthly mean observed and simulated stream flow for the Rio San Pedro at Villalba
(period from Jan to Dec 1980). In this stream gage, the model simulates less baseflow in the
period January to April (33% on average of the naturalized flow). However, the simulated flows
are more accurate in the summer and fall seasons; for example, the WEAP flow in August
represents 95 % of the naturalized flow and 104% in September; which means that in this month,
the model only overestimates the monthly peak flow in 4%. It is possible to increase the base
flow in the first months of year, by using a larger 2z or 2k . However, if 2z is increased from
4% to 10%, the monthly stream flows in November and December increase to more than 80%
and 100 % respectively.
5.2. Monthly Streamflow Comparison
Figure 24 shows the monthly WEAP simulated flow for the Rio Conchos at La Boquilla. The
most notable difficulty of the hydrologic simulation is to predict the spring and summer flow
(Feb –Jun) when the simulated values are around 45 % of the naturalized flows, except in
January when the simulation is almost perfect. However, the simulation is more accurate for the
fall and winter flows; even though they are overestimated. For example, from August to October
when the most important flows occur the ratio the simulated to naturalized flow is 1.09; which
means that the model only overestimated the stream flow by 9% on average during this period.
Figure 25 shows the WEAP simulated and TCEQ naturalized flows for the Rio Florido at Cd.
Jimenez. Despite of its perfect approximation of the annual flow, there are important differences
in the monthly flows. From January to June, simulated flows are smaller than the naturalized
flows, while peak flows are close to the naturalized flows (at least in September). It is possible
to improve this performance, increasing the hydraulic conductivity, 1k of the upper soil layer to
reduce the stream flows in August and September as well as 1z in order to increase the stream
flows in April, May, June, and November, in all sub-basin located upstream of the Cd. Jimenez
stream gage.
Similar behavior is presented in Las Burras, El Granero, and Ojinaga gage stations whose
tendencies can be seen in Figure 26, Figure 27, and Figure 28. However, the differences
between observed and simulated flows are more noticeable in the last two stations located

39
downstream of the Rio Conchos at Las Burras, because the natural flows are reduced in those
points. The rainfall contributions from the Luis Leon, Peguis, and Ojinaga sub-basins are quite
small (< 1%) and most of this water is lost to evaporation and seepage along the river. In
general, the model overestimates the peak flows produced in September by around 15 %. Figure
29, Figure 30, Figure 31, Figure 32, Figure 33, and Figure 34 are plots showing the daily stream
flows simulated by WEAP in the selected points.
Simulated and Natural stream flows in the Rio San Pedro at Villalba
0
50
100
150
200
250
Months
Str
eam
flo
w i
n M
m3
Nat. Flow Simulated WEAP
Nat. Flow 5.200 4.450 3.596 2.648 1.647 1.345 2.398 44.155 233.339 27.286 5.321 9.314
Simulated WEAP 1.142 1.346 1.391 1.367 1.419 1.441 2.538 42.099 242.464 24.046 11.790 9.101
Ene Feb Mar Apr May Jun Jul Aug Sep Oct Nov Dec
Total year:
WEAP= 340.14
Nat. Flow = 340.70
Ratio = WEAP/Nat. Flow = 0.998
Figure 23. Monthly WEAP simulated and TCEQ naturalized streamflow in the Rio San Pedro at Villalba

40
Simualted and Natural stream flows in the Rio Conchos at Presa La Boquilla
0
100
200
300
400
500
600
700
800
Months
Str
ea
m f
low
in
M
m3
Nat. Flow Simulated WEAP
Nat. Flow 19.760 38.430 53.180 56.710 47.580 66.050 77.670 165.540 713.810 168.600 9.930 28.820
Simulated WEAP 22.446 21.057 22.617 21.180 21.891 22.512 38.391 189.019 783.500 178.263 74.214 43.972
Ene Feb Mar Apr May Jun Jul Ago Sep Oct Nov Dic
Total year:
WEAP= 1439. 062
Nat. Flow = 1446.08
Ratio = WEAP/Nat. Flow = 0.995
Figure 24. Monthly WEAP simulated and TCEQ naturalized streamflow in the Rio Conchos at La Boquilla
Simulated and Natural stream flows in the Rio Florido at CD Gimenez
0
10
20
30
40
50
60
70
80
Months
Str
ea
m f
low
in
Mm
3
Nat. Flow Simulated WEAP
Nat. Flow 0.000 0.000 0.052 1.497 2.396 3.685 3.156 15.067 67.362 27.124 1.821 0.730
Simulated WEAP 0.286 0.345 0.245 0.236 0.260 0.408 3.062 26.600 77.525 11.184 1.917 1.069
Ene Feb March Apr May Jun Jul Aug Sep Oct Nov Dic
Total year:
WEAP= 123.136
Nat. Flow = 122.89
Ratio = WEAP/Nat. Flow =1 . 00
Figure 25. Monthly WEAP simulated and TCEQ naturalized streamflow in the Rio Conchos at Jimenez

41
Simulated and Natural stream flows in the rio Conchos at Las Burras
0
200
400
600
800
1000
1200
1400
Months
Str
eam
flo
w i
n M
m3
Nat. Flow Simulated WEAP
Nat. Flow 37.8606 59.9896 45.6388 44.4083 64.5306 84.1077 86.8575 303.3935 1043.73 292.0544 71.485 85.8154
Simulated WEAP 36.4215 34.4743 37.2713 35.3659 36.5933 37.3606 57.9972 296.5854 1215.9141 245.8279 115.1041 81.1253
Ene Feb Mar Apr May Jun Jul Aug Sep Oct Nov Dec
Total year:
WEAP= 2230. 04
Nat. Flow = 2219.87
Ratio = WEAP/Nat. Flow =1 . 004
Figure 26. Monthly WEAP simulated and TCEQ naturalized streamflow in the Rio Conchos at Las Burras
Simulated and Natural stream flows in the Rio Conchos at El Granero
0
200
400
600
800
1000
1200
1400
Months
Str
eam
Flo
w i
n M
m3
Nat. Flow Simulated WEAP
Nat. Flow 36.346 55.366 57.240 50.221 73.320 86.116 83.596 316.484 1022.775 284.474 57.434 69.119
Simulated WEAP 37.182 35.220 38.056 36.185 37.397 38.395 59.123 323.800 1241.887 248.974 118.660 83.764
Ene Feb Mar Apr May Jun Jul Aug Sep Oct Nov Dec
Total year:
WEAP= 2298.64
Nat. Flow = 2192.49
Ratio = WEAP/Nat. Flow = 1.04
Figure 27. Monthly WEAP simulated and TCEQ naturalized streamflow in the Rio Conchos at El Granero

42
Simulated and Natural stream flows in the Rio Conchos at Ojinaga
0
200
400
600
800
1000
1200
1400
Months
Str
eam
flo
w in
Mm
3
Nat. Flow Simulated WEAP
Nat. Flow 38.437 51.580 46.447 40.870 62.910 73.315 56.817 366.781 891.026 264.565 67.680 68.682
Simulated WEAP 37.981 35.981 38.904 37.032 38.272 39.333 60.723 346.393 1263.838 254.399 122.531 86.837
Ene Feb Mar Apr May Jun Jul Aug Sep Oct Nov Dec
Total year:
WEAP= 2362.22
Nat. Flow = 2019.108
Ratio = WEAP/Nat. Flow = 1.17
Figure 28. Monthly WEAP simulated and TCEQ naturalized streamflow in the Rio Conchos at Ojinaga
Figure 29. Daily WEAP simulated streamflow in the Rio San Pedro at Villalba

43
Figure 30. Daily WEAP simulated streamflow in the Rio Conchos at La Boquilla
Figure 31. Daily WEAP simulated streamflow in the Rio Florido at Jimenez

44
Figure 32. Daily WEAP simulated streamflow in the Rio Conchos at Las Burras
Figure 33. Daily WEAP simulated streamflow in the Rio Conchos at El Granero

45
Figure 34. Daily WEAP simulated streamflow in the Rio Conchos at Ojinaga
6. Recommendations
The results show a good approximation to both annual and monthly flows. However, the
hydrologic model needs to be validated for a period of time larger, making adjustments as
necessary in some soil parameters in order to improve the accuracy in the hydrologic response of
the whole basin, considering that the hydraulic conductivity and initial storage increase when the
available water in the soil layers increases. In other words, the hydraulic conductivity should be
larger in a period with significant rainfall than a period with little to no rainfall.
The integration of WEAP’s hydrologic flow predication capabilities into the existing WEAP
model of the Rio Bravo basin creates a powerful tool for regional planners. There remains a
great deal of work to bring this idea to fruition. The model could be useful in generating inflows
to the basin under various sequences of future precipitation. These inflows could be used in the
WEAP water management model (Danner et al., 2006) to assess the result for basin stakeholders
on different scenarios of basin operation.

46
References
Brandes, R.J. Company, Water Availability Modeling for the Rio Grande Basin: Naturalized
Streamflow Data, Texas Commission on Environmental Quality, Austin, Texas, October
2003
Constance L. Danner, B.S., Daene C. McKinney, PhD., PE, and Rebecca L. Teasley, M.S.:
Documentation and Testing of the WEAP Model for the Rio Grande/Bravo Basin, August
2006 (http://www.crwr.utexas.edu/reports/2006/rpt06-8.shtml)
Jantzen, T., B. Klezendorf, J. Middleton, and J. Smith. WEAP Hydrology Modeling Applied:
The Upper Rio Florido Rive Basin
Martinez, J. and R.M. Zermeno and A.G. Lopez. Estudio Para la Gestion Integrada del Agua en
la Cuenca del Rio Bravo, Instituto Mexicano De Tecnologia Del Agua. Report No. 2002-
C-01-0569.A3, 2005 (in Spanish).
Patiño-Gomez, C. and D.C. McKinney. GIS for Large-Scale Watershed Observational Data
Model, The University of Texas at Austin, Center for Research in Water Resources
Online Report No. 2005-05, 2005 (http://www.crwr.utexas.edu/reports/2005/rpt05-
5.shtml)
Scurlock, J. M. O., G. P. Asner, and S. T. Gower. 2001. Global Leaf Area Index Data from Field
Measurements, 1932-2000. Data set. Available on-line [http://www.daac.ornl.gov] from
the Oak Ridge National Laboratory Distributed Active Archive Center, Oak Ridge,
Tennessee, U.S.A.
Sieber, J., Swartz, C., and Huber-Lee, A. (2005). Water Evaluation and Planning System User
Guide for WEAP 21. Stockholm Environment Institute, Tellus Institute, Boston,
Massachusetts.
Texas Commission on Environmental Quality. Water Availability Modeling for the Rio Grande
Basin: Naturalized Streamflow Data: Final Report. Prepared by R.J. Brandes Company.
October 2003.
World Bank. The Hydrological Flow Path and Options for Sustainable Water Resources
Management in the Overexploited Rio Bravo Basin: A Preliminary Analysis from Remote
Sensing and Hydrological Modeling: Final Draft. Washington DC, March, 2006.

47
Appendix 1. Soil Land Use Intersects by Sub-basin
Peguis Subbasin No. 1 Soil - Land Use Intersect
Soil Group Land Use Area (sq m) Area (sq km) % of Soil Group
A 10 10809 0.01 0.02
20 0 0.00 0.00
30 38164 0.04 0.05
40 6380071 6.38 8.91
50 6502437 6.50 9.08
60 20395521 20.40 28.49
70 27555676 27.56 38.49
75 5846984 5.85 8.17
80 2563815 2.56 3.58
85 576152 0.58 0.80
90 1721146 1.72 2.40
95 0 0.00 0.00
Total Soil Area (sq km) 71.59
% of Total Basin Area 0.93
Soil Group Land Use Area (sq m) Area (sq km) % of Soil Group
B 10 28325 0.03 0.00
20 1509 0.00 0.00
30 210334 0.21 0.01
40 718386 0.72 0.03
50 5966293 5.97 0.28
60 379643859 379.64 17.51
70 1699345239 1699.35 78.36
75 8675007 8.68 0.40
80 63771996 63.77 2.94
85 83173 0.08 0.00
90 4760341 4.76 0.22
95 5466388 5.47 0.25
Total Soil Area (sq km) 2168.67
% of Total Basin Area 28.16
Soil Group Land Use Area (sq m) Area (sq km) % of Soil Group
C 10 497 0.00 0.00
20 30915 0.03 0.00
30 61411 0.06 0.00
40 1953737 1.95 0.06
50 18742950 18.74 0.59
60 1081764821 1081.76 33.82
70 1677846763 1677.85 52.45
75 117288454 117.29 3.67
80 287986809 287.99 9.00
85 935075 0.94 0.03
90 3920024 3.92 0.12
95 8285730 8.29 0.26
Total Soil Area (sq km) 3198.82
% of Total Basin Area 41.53
Soil Group Land Use Area (sq m) Area (sq km) % of Soil Group
D 10 784935 0.78 0.03
20 0 0.00 0.00
30 779358 0.78 0.03
40 268422 0.27 0.01
50 1145767 1.15 0.05
60 196367414 196.37 8.68
70 1896450935 1896.45 83.81
75 43258657 43.26 1.91
80 119299233 119.30 5.27
85 152992 0.15 0.01
90 348263 0.35 0.02
95 3877069 3.88 0.17
Total Soil Area (sq km) 2262.73
% of Total Basin Area 29.38

48
Sacramento Subbasin No. 2 Soil - Land Use Intersect
Soil Group Land Use Area (sq m) Area (sq km) % of Soil Group
A 10 0 0.00 #DIV/0!
20 0 0.00 #DIV/0!
30 0 0.00 #DIV/0!
40 0 0.00 #DIV/0!
50 0 0.00 #DIV/0!
60 0 0.00 #DIV/0!
70 0 0.00 #DIV/0!
75 0 0.00 #DIV/0!
80 0 0.00 #DIV/0!
85 0 0.00 #DIV/0!
90 0 0.00 #DIV/0!
95 0 0.00 #DIV/0!
Total Soil Area (sq km) 0.00
% of Total Basin Area 0.00
Soil Group Land Use Area (sq m) Area (sq km) % of Soil Group
B 10 0 0.00 0.00
20 0 0.00 0.00
30 0 0.00 0.00
40 0 0.00 0.00
50 2080698 2.08 3.75
60 8281386 8.28 14.93
70 10034072 10.03 18.09
75 0 0.00 0.00
80 34897129 34.90 62.92
85 136785 0.14 0.25
90 0 0.00 0.00
95 28815 0.03 0.05
Total Soil Area (sq km) 55.46
% of Total Basin Area 5.55
Soil Group Land Use Area (sq m) Area (sq km) % of Soil Group
C 10 421382 0.42 0.11
20 9461908 9.46 2.36
30 0 0.00 0.00
40 864396 0.86 0.22
50 106013400 106.01 26.46
60 57268101 57.27 14.29
70 27067093 27.07 6.76
75 0 0.00 0.00
80 177389566 177.39 44.28
85 22133664 22.13 5.52
90 0 0.00 0.00
95 3602 0.00 0.00
Total Soil Area (sq km) 400.62
% of Total Basin Area 40.10
Soil Group Land Use Area (sq m) Area (sq km) % of Soil Group
D 10 58019667 58.02 10.69
20 256652163 256.65 47.27
30 54019 0.05 0.01
40 3601 0.00 0.00
50 3521854 3.52 0.65
60 9638093 9.64 1.78
70 20659107 20.66 3.80
75 0 0.00 0.00
80 194298060 194.30 35.79
85 18005 0.02 0.00
90 0 0.00 0.00
95 86430 0.09 0.02
Total Soil Area (sq km) 542.95
% of Total Basin Area 54.35
Total Basin Area (sq km) 999.03

49
Las Burras Subbasin No. 3 Soil - Land Use Intersect
Soil Group Land Use Area (sq m) Area (sq km) % of Soil Group
A 10 1348679 1.35 0.22
20 3491398 3.49 0.56
30 268862 0.27 0.04
40 51729070 51.73 8.25
50 86410404 86.41 13.78
60 82011311 82.01 13.08
70 116617155 116.62 18.60
75 34740718 34.74 5.54
80 239524731 239.52 38.21
85 9928058 9.93 1.58
90 0 0.00 0.00
95 816475 0.82 0.13
Total Soil Area (sq km) 626.89
% of Total Basin Area 5.70
Soil Group Land Use Area (sq m) Area (sq km) % of Soil Group
B 10 10808 0.01 0.00
20 57645 0.06 0.00
30 33211 0.03 0.00
40 146417057 146.42 6.81
50 152207712 152.21 7.08
60 630808464 630.81 29.34
70 489318169 489.32 22.76
75 44466833 44.47 2.07
80 666539542 666.54 31.00
85 9861356 9.86 0.46
90 10522179 10.52 0.49
95 0 0.00 0.00
Total Soil Area (sq km) 2150.24
% of Total Basin Area 19.54
Soil Group Land Use Area (sq m) Area (sq km) % of Soil Group
C 10 100871 0.10 0.00
20 8485561 8.49 0.13
30 3383403 3.38 0.05
40 520324527 520.32 7.79
50 837594285 837.59 12.53
60 2302947107 2302.95 34.46
70 790753723 790.75 11.83
75 618490117 618.49 9.25
80 1451828717 1451.83 21.72
85 24897806 24.90 0.37
90 123750614 123.75 1.85
95 887566 0.89 0.01
Total Soil Area (sq km) 6683.44
% of Total Basin Area 60.75
Soil Group Land Use Area (sq m) Area (sq km) % of Soil Group
D 10 8725885 8.73 0.57
20 7897203 7.90 0.51
30 5232815 5.23 0.34
40 123439312 123.44 8.01
50 98788610 98.79 6.41
60 177172330 177.17 11.49
70 346895520 346.90 22.50
75 87087745 87.09 5.65
80 661684417 661.68 42.92
85 21056387 21.06 1.37
90 3291647 3.29 0.21
95 429987 0.43 0.03
Total Soil Area (sq km) 1541.70
% of Total Basin Area 14.01
Total Basin Area (sq km) 11002.28

50
Luis L Leon Subbasin No. 4 Soil - Land Use Intersect
Soil Group Land Use Area (sq m) Area (sq km) % of Soil Group
A 10 0 0.00 0.00
20 0 0.00 0.00
30 0 0.00 0.00
40 244063 0.24 3.08
50 978266 0.98 12.35
60 1685046 1.69 21.27
70 3233952 3.23 40.81
75 0 0.00 0.00
80 1782518 1.78 22.50
85 0 0.00 0.00
90 0 0.00 0.00
95 0 0.00 0.00
Total Soil Area (sq km) 7.92
% of Total Basin Area 0.16
Soil Group Land Use Area (sq m) Area (sq km) % of Soil Group
B 10 22933 0.02 0.00
20 183851 0.18 0.02
30 481725 0.48 0.05
40 15393824 15.39 1.69
50 45813616 45.81 5.03
60 207607031 207.61 22.78
70 388365033 388.37 42.61
75 7949771 7.95 0.87
80 234443639 234.44 25.72
85 9379959 9.38 1.03
90 7206 0.01 0.00
95 1717651 1.72 0.19
Total Soil Area (sq km) 911.37
% of Total Basin Area 18.01
Soil Group Land Use Area (sq m) Area (sq km) % of Soil Group
C 10 513492 0.51 0.02
20 132648 0.13 0.01
30 460195 0.46 0.02
40 47912375 47.91 1.89
50 175992744 175.99 6.93
60 1116136960 1116.14 43.93
70 671332564 671.33 26.43
75 58332673 58.33 2.30
80 348657461 348.66 13.72
85 111326273 111.33 4.38
90 52882 0.05 0.00
95 9619594 9.62 0.38
Total Soil Area (sq km) 2540.47
% of Total Basin Area 50.22
Soil Group Land Use Area (sq m) Area (sq km) % of Soil Group
D 10 5980885 5.98 0.37
20 10580280 10.58 0.66
30 13338357 13.34 0.83
40 2970647 2.97 0.19
50 14201108 14.20 0.89
60 223999441 224.00 14.01
70 937009929 937.01 58.59
75 3783948 3.78 0.24
80 368206205 368.21 23.02
85 16899482 16.90 1.06
90 414581 0.41 0.03
95 1867838 1.87 0.12
Total Soil Area (sq km) 1599.25
% of Total Basin Area 31.61
Total Basin Area (sq km) 5059.01

51
Fco. I Madero Subbasin No. 5 Soil - Land Use Intersect
Soil Group Land Use Area (sq m) Area (sq km) % of Soil Group
A 10 14409 0.01 0.01
20 3602 0.00 0.00
30 718311 0.72 0.29
40 617966 0.62 0.25
50 96833 0.10 0.04
60 96709578 96.71 38.86
70 127171804 127.17 51.11
75 3362445 3.36 1.35
80 19442604 19.44 7.81
85 0 0.00 0.00
90 320622 0.32 0.13
95 384658 0.38 0.15
Total Soil Area (sq km) 248.84
% of Total Basin Area 20.55
Soil Group Land Use Area (sq m) Area (sq km) % of Soil Group
B 10 0 0.00 0.00
20 10806 0.01 0.01
30 0 0.00 0.00
40 0 0.00 0.00
50 529854 0.53 0.57
60 8404140 8.40 9.01
70 64451280 64.45 69.10
75 244893 0.24 0.26
80 19180655 19.18 20.57
85 0 0.00 0.00
90 199476 0.20 0.21
95 246604 0.25 0.26
Total Soil Area (sq km) 93.27
% of Total Basin Area 7.70
Soil Group Land Use Area (sq m) Area (sq km) % of Soil Group
C 10 21615 0.02 0.01
20 177022 0.18 0.05
30 850377 0.85 0.23
40 454043 0.45 0.12
50 5502779 5.50 1.46
60 66640433 66.64 17.68
70 85946828 85.95 22.80
75 6576606 6.58 1.74
80 209290902 209.29 55.52
85 0 0.00 0.00
90 1296603 1.30 0.34
95 218890 0.22 0.06
Total Soil Area (sq km) 376.98
% of Total Basin Area 31.12
Soil Group Land Use Area (sq m) Area (sq km) % of Soil Group
D 10 9180988 9.18 1.87
20 9229651 9.23 1.88
30 16087745 16.09 3.27
40 930897 0.93 0.19
50 2272540 2.27 0.46
60 26940121 26.94 5.47
70 137512567 137.51 27.94
75 5368029 5.37 1.09
80 284000170 284.00 57.71
85 479061 0.48 0.10
90 56554 0.06 0.01
95 36020 0.04 0.01
Total Soil Area (sq km) 492.09
% of Total Basin Area 40.63
Total Basin Area (sq km) 1211.18

52
Villalba Subbasin No. 6 Soil - Land Use Intersect
Soil Group Land Use Area (sq m) Area (sq km) % of Soil Group
A 10 198132641 198.13 8.56
20 413894292 413.89 17.87
30 187225 0.19 0.01
40 8933646 8.93 0.39
50 533238747 533.24 23.03
60 98264833 98.26 4.24
70 107702593 107.70 4.65
75 0 0.00 0.00
80 952504833 952.50 41.13
85 1555012 1.56 0.07
90 0 0.00 0.00
95 1228024 1.23 0.05
Total Soil Area (sq km) 2315.64
% of Total Basin Area 24.78
Soil Group Land Use Area (sq m) Area (sq km) % of Soil Group
B 10 125748168 125.75 4.65
20 161637049 161.64 5.98
30 0 0.00 0.00
40 5899623 5.90 0.22
50 555046757 555.05 20.54
60 182512530 182.51 6.75
70 291867882 291.87 10.80
75 375438 0.38 0.01
80 1375486854 1375.49 50.90
85 439389 0.44 0.02
90 381 0.00 0.00
95 3179484 3.18 0.12
Total Soil Area (sq km) 2702.19
% of Total Basin Area 28.92
Soil Group Land Use Area (sq m) Area (sq km) % of Soil Group
C 10 362443991 362.44 12.56
20 443870114 443.87 15.38
30 7201 0.01 0.00
40 7068322 7.07 0.24
50 269218659 269.22 9.33
60 220214230 220.21 7.63
70 126818601 126.82 4.39
75 0 0.00 0.00
80 1452923855 1452.92 50.33
85 3010849 3.01 0.10
90 3221 0.00 0.00
95 965096 0.97 0.03
Total Soil Area (sq km) 2886.54
% of Total Basin Area 30.89
Soil Group Land Use Area (sq m) Area (sq km) % of Soil Group
D 10 335729645 335.73 23.31
20 370882733 370.88 25.75
30 0 0.00 0.00
40 21603 0.02 0.00
50 54475310 54.48 3.78
60 28195313 28.20 1.96
70 156117713 156.12 10.84
75 0 0.00 0.00
80 492312880 492.31 34.18
85 2211562 2.21 0.15
90 10906 0.01 0.00
95 317715 0.32 0.02
Total Soil Area (sq km) 1440.28
% of Total Basin Area 15.41
Total Basin Area (sq km) 9344.65

53
Conchos Subbasin No. 7 Soil - Land Use Intersect
Soil Group Land Use Area (sq m) Area (sq km) % of Soil Group
A 10 0 0.00 0.00
20 50436 0.05 0.02
30 0 0.00 0.00
40 408759 0.41 0.18
50 309305 0.31 0.14
60 83971705 83.97 36.98
70 35919750 35.92 15.82
75 43267506 43.27 19.06
80 57232239 57.23 25.21
85 0 0.00 0.00
90 158360 0.16 0.07
95 5743406 5.74 2.53
Total Soil Area (sq km) 227.06
% of Total Basin Area 20.38
Soil Group Land Use Area (sq m) Area (sq km) % of Soil Group
B 10 0 0.00 0.00
20 0 0.00 0.00
30 110478 0.11 0.02
40 43823515 43.82 8.95
50 17907504 17.91 3.66
60 237194242 237.19 48.47
70 70536060 70.54 14.41
75 57198139 57.20 11.69
80 47225575 47.23 9.65
85 2708745 2.71 0.55
90 12673210 12.67 2.59
95 0 0.00 0.00
Total Soil Area (sq km) 489.38
% of Total Basin Area 43.92
Soil Group Land Use Area (sq m) Area (sq km) % of Soil Group
C 10 0 0.00 0.00
20 0 0.00 0.00
30 0 0.00 0.00
40 347434 0.35 0.12
50 1253316 1.25 0.44
60 72240662 72.24 25.41
70 6163864 6.16 2.17
75 69507528 69.51 24.45
80 124531733 124.53 43.80
85 0 0.00 0.00
90 8414032 8.41 2.96
95 1852499 1.85 0.65
Total Soil Area (sq km) 284.31
% of Total Basin Area 25.52
Soil Group Land Use Area (sq m) Area (sq km) % of Soil Group
D 10 0 0.00 0.00
20 36025 0.04 0.03
30 0 0.00 0.00
40 9770 0.01 0.01
50 133881 0.13 0.12
60 23126719 23.13 20.38
70 31533083 31.53 27.79
75 3644145 3.64 3.21
80 52251006 52.25 46.06
85 0 0.00 0.00
90 0 0.00 0.00
95 2717052 2.72 2.39
Total Soil Area (sq km) 113.45
% of Total Basin Area 10.18
Total Basin Area (sq km) 1114.20

54
Jimenez Subbasin No. 8 Soil - Land Use Intersect
Soil Group Land Use Area (sq m) Area (sq km) % of Soil Group
A 10 34913902 34.91 3.76
20 28441541 28.44 3.07
30 1389805 1.39 0.15
40 4202684 4.20 0.45
50 97692805 97.69 10.53
60 84047669 84.05 9.06
70 1924469 1.92 0.21
75 0 0.00 0.00
80 666241918 666.24 71.84
85 5153187 5.15 0.56
90 3341768 3.34 0.36
95 0 0.00 0.00
Total Soil Area (sq km) 927.35
% of Total Basin Area 20.98
Soil Group Land Use Area (sq m) Area (sq km) % of Soil Group
B 10 23815323 23.82 6.21
20 48552171 48.55 12.67
30 0 0.00 0.00
40 3189980 3.19 0.83
50 29959563 29.96 7.82
60 43308066 43.31 11.30
70 21440609 21.44 5.59
75 0 0.00 0.00
80 212842931 212.84 55.54
85 113220 0.11 0.03
90 0 0.00 0.00
95 32421 0.03 0.01
Total Soil Area (sq km) 383.25
% of Total Basin Area 8.67
Soil Group Land Use Area (sq m) Area (sq km) % of Soil Group
C 10 15956187 15.96 0.60
20 31508941 31.51 1.18
30 1505934 1.51 0.06
40 63100775 63.10 2.35
50 464100157 464.10 17.32
60 558066867 558.07 20.82
70 191146341 191.15 7.13
75 20821027 20.82 0.78
80 1317856274 1317.86 49.17
85 2615272 2.62 0.10
90 13393245 13.39 0.50
95 3602 0.00 0.00
Total Soil Area (sq km) 2680.07
% of Total Basin Area 60.62
Soil Group Land Use Area (sq m) Area (sq km) % of Soil Group
D 10 48816092 48.82 11.34
20 33443498 33.44 7.77
30 0 0.00 0.00
40 78064788 78.06 18.14
50 68821328 68.82 15.99
60 54500399 54.50 12.66
70 11771107 11.77 2.73
75 0 0.00 0.00
80 128987283 128.99 29.97
85 1247547 1.25 0.29
90 4748616 4.75 1.10
95 0 0.00 0.00
Total Soil Area (sq km) 430.40
% of Total Basin Area 9.74
Total Basin Area (sq km) 4421.08

55
Chuviscar Subbasin No. 9 Soil - Land Use Intersect
Soil Group Land Use Area (sq m) Area (sq km) % of Soil Group
A 10 0 0.00 #DIV/0!
20 0 0.00 #DIV/0!
30 0 0.00 #DIV/0!
40 0 0.00 #DIV/0!
50 0 0.00 #DIV/0!
60 0 0.00 #DIV/0!
70 0 0.00 #DIV/0!
75 0 0.00 #DIV/0!
80 0 0.00 #DIV/0!
85 0 0.00 #DIV/0!
90 0 0.00 #DIV/0!
95 0 0.00 #DIV/0!
Total Soil Area (sq km) 0.00
% of Total Basin Area 0.00
Soil Group Land Use Area (sq m) Area (sq km) % of Soil Group
B 10 0 0.00 #DIV/0!
20 0 0.00 #DIV/0!
30 0 0.00 #DIV/0!
40 0 0.00 #DIV/0!
50 0 0.00 #DIV/0!
60 0 0.00 #DIV/0!
70 0 0.00 #DIV/0!
75 0 0.00 #DIV/0!
80 0 0.00 #DIV/0!
85 0 0.00 #DIV/0!
90 0 0.00 #DIV/0!
95 0 0.00 #DIV/0!
Total Soil Area (sq km) 0.00
% of Total Basin Area 0.00
Soil Group Land Use Area (sq m) Area (sq km) % of Soil Group
C 10 64830 0.06 0.20
20 0 0.00 0.00
30 374542 0.37 1.14
40 0 0.00 0.00
50 4194101 4.19 12.75
60 5450720 5.45 16.56
70 10403415 10.40 31.61
75 0 0.00 0.00
80 6810254 6.81 20.70
85 5608765 5.61 17.04
90 0 0.00 0.00
95 0 0.00 0.00
Total Soil Area (sq km) 32.91
% of Total Basin Area 31.69
Soil Group Land Use Area (sq m) Area (sq km) % of Soil Group
D 10 0 0.00 0.00
20 1085320 1.09 1.53
30 0 0.00 0.00
40 0 0.00 0.00
50 362367 0.36 0.51
60 6543030 6.54 9.23
70 48892701 48.89 68.94
75 0 0.00 0.00
80 6040955 6.04 8.52
85 7997881 8.00 11.28
90 0 0.00 0.00
95 0 0.00 0.00
Total Soil Area (sq km) 70.92
% of Total Basin Area 68.31
Total Basin Area (sq km) 103.83

56
El Rejon Subbasin No. 10 Soil - Land Use Intersect
Soil Group Land Use Area (sq m) Area (sq km) % of Soil Group
A 10 0 0.00 #DIV/0!
20 0 0.00 #DIV/0!
30 0 0.00 #DIV/0!
40 0 0.00 #DIV/0!
50 0 0.00 #DIV/0!
60 0 0.00 #DIV/0!
70 0 0.00 #DIV/0!
75 0 0.00 #DIV/0!
80 0 0.00 #DIV/0!
85 0 0.00 #DIV/0!
90 0 0.00 #DIV/0!
95 0 0.00 #DIV/0!
Total Soil Area (sq km) 0.00
% of Total Basin Area 0.00
Soil Group Land Use Area (sq m) Area (sq km) % of Soil Group
B 10 0 0.00 #DIV/0!
20 0 0.00 #DIV/0!
30 0 0.00 #DIV/0!
40 0 0.00 #DIV/0!
50 0 0.00 #DIV/0!
60 0 0.00 #DIV/0!
70 0 0.00 #DIV/0!
75 0 0.00 #DIV/0!
80 0 0.00 #DIV/0!
85 0 0.00 #DIV/0!
90 0 0.00 #DIV/0!
95 0 0.00 #DIV/0!
Total Soil Area (sq km) 0.00
% of Total Basin Area 0.00
Soil Group Land Use Area (sq m) Area (sq km) % of Soil Group
C 10 0 0.00 0.00
20 0 0.00 0.00
30 0 0.00 0.00
40 0 0.00 0.00
50 6387713 6.39 38.39
60 3037632 3.04 18.26
70 3075528 3.08 18.48
75 0 0.00 0.00
80 4138956 4.14 24.87
85 0 0.00 0.00
90 0 0.00 0.00
95 0 0.00 0.00
Total Soil Area (sq km) 16.64
% of Total Basin Area 11.34
Soil Group Land Use Area (sq m) Area (sq km) % of Soil Group
D 10 6056313 6.06 4.65
20 41631691 41.63 31.99
30 0 0.00 0.00
40 28813 0.03 0.02
50 2486618 2.49 1.91
60 4600997 4.60 3.54
70 11264658 11.26 8.66
75 0 0.00 0.00
80 64079278 64.08 49.24
85 0 0.00 0.00
90 0 0.00 0.00
95 0 0.00 0.00
Total Soil Area (sq km) 130.15
% of Total Basin Area 88.66
Total Basin Area (sq km) 146.79

57
Chihuahua Subbasin No. 11 Soil - Land Use Intersect
Soil Group Land Use Area (sq m) Area (sq km) % of Soil Group
A 10 5980028 5.98 20.05
20 2063619 2.06 6.92
30 0 0.00 0.00
40 0 0.00 0.00
50 15126355 15.13 50.71
60 234106 0.23 0.78
70 314262 0.31 1.05
75 0 0.00 0.00
80 6111300 6.11 20.49
85 0 0.00 0.00
90 0 0.00 0.00
95 0 0.00 0.00
Total Soil Area (sq km) 29.83
% of Total Basin Area 7.46
Soil Group Land Use Area (sq m) Area (sq km) % of Soil Group
B 10 241982 0.24 32.57
20 25687 0.03 3.46
30 0 0.00 0.00
40 0 0.00 0.00
50 300345 0.30 40.42
60 0 0.00 0.00
70 51689 0.05 6.96
75 0 0.00 0.00
80 123307 0.12 16.60
85 0 0.00 0.00
90 0 0.00 0.00
95 0 0.00 0.00
Total Soil Area (sq km) 0.74
% of Total Basin Area 0.19
Soil Group Land Use Area (sq m) Area (sq km) % of Soil Group
C 10 43220 0.04 0.06
20 1825414 1.83 2.33
30 551099 0.55 0.70
40 0 0.00 0.00
50 11020715 11.02 14.06
60 3614801 3.61 4.61
70 32032113 32.03 40.85
75 0 0.00 0.00
80 29321473 29.32 37.40
85 0 0.00 0.00
90 0 0.00 0.00
95 0 0.00 0.00
Total Soil Area (sq km) 78.41
% of Total Basin Area 19.61
Soil Group Land Use Area (sq m) Area (sq km) % of Soil Group
D 10 25436490 25.44 8.75
20 79428062 79.43 27.31
30 0 0.00 0.00
40 32412 0.03 0.01
50 5477565 5.48 1.88
60 1361756 1.36 0.47
70 44840350 44.84 15.42
75 0 0.00 0.00
80 134267868 134.27 46.16
85 0 0.00 0.00
90 0 0.00 0.00
95 18008 0.02 0.01
Total Soil Area (sq km) 290.86
% of Total Basin Area 72.74
Total Basin Area (sq km) 399.84

58
Llanitos Subbasin No. 12 Soil - Land Use Intersect
Soil Group Land Use Area (sq m) Area (sq km) % of Soil Group
A 10 207646613 207.65 66.46
20 46749497 46.75 14.96
30 0 0.00 0.00
40 0 0.00 0.00
50 622991 0.62 0.20
60 567584 0.57 0.18
70 0 0.00 0.00
75 0 0.00 0.00
80 55468865 55.47 17.75
85 1378106 1.38 0.44
90 0 0.00 0.00
95 7203 0.01 0.00
Total Soil Area (sq km) 312.44
% of Total Basin Area 18.85
Soil Group Land Use Area (sq m) Area (sq km) % of Soil Group
B 10 424400774 424.40 47.59
20 289603320 289.60 32.47
30 0 0.00 0.00
40 115251 0.12 0.01
50 4628554 4.63 0.52
60 9684430 9.68 1.09
70 0 0.00 0.00
75 0 0.00 0.00
80 162060957 162.06 18.17
85 0 0.00 0.00
90 0 0.00 0.00
95 1311011 1.31 0.15
Total Soil Area (sq km) 891.80
% of Total Basin Area 53.81
Soil Group Land Use Area (sq m) Area (sq km) % of Soil Group
C 10 6519778 6.52 8.68
20 15990376 15.99 21.29
30 0 0.00 0.00
40 0 0.00 0.00
50 9375068 9.38 12.48
60 1530698 1.53 2.04
70 0 0.00 0.00
75 0 0.00 0.00
80 41693464 41.69 55.50
85 0 0.00 0.00
90 0 0.00 0.00
95 14406 0.01 0.02
Total Soil Area (sq km) 75.12
% of Total Basin Area 4.53
Soil Group Land Use Area (sq m) Area (sq km) % of Soil Group
D 10 260274965 260.27 68.85
20 71044864 71.04 18.79
30 0 0.00 0.00
40 0 0.00 0.00
50 3075931 3.08 0.81
60 375746 0.38 0.10
70 0 0.00 0.00
75 64830 0.06 0.02
80 41570696 41.57 11.00
85 0 0.00 0.00
90 0 0.00 0.00
95 1615693 1.62 0.43
Total Soil Area (sq km) 378.02
% of Total Basin Area 22.81
Total Basin Area (sq km) 1657.39

59
Pico del Aguila Subbasin No. 13 Soil - Land Use Intersect
Soil Group Land Use Area (sq m) Area (sq km) % of Soil Group
A 10 563035 0.56 0.29
20 3633432 3.63 1.90
30 3499174 3.50 1.83
40 248823 0.25 0.13
50 3411540 3.41 1.79
60 6280169 6.28 3.29
70 10814 0.01 0.01
75 0 0.00 0.00
80 173088051 173.09 90.57
85 0 0.00 0.00
90 365534 0.37 0.19
95 0 0.00 0.00
Total Soil Area (sq km) 191.10
% of Total Basin Area 29.60
Soil Group Land Use Area (sq m) Area (sq km) % of Soil Group
B 10 1943288 1.94 1.07
20 4702495 4.70 2.59
30 0 0.00 0.00
40 1456622 1.46 0.80
50 30130067 30.13 16.61
60 22652882 22.65 12.49
70 0 0.00 0.00
75 0 0.00 0.00
80 118993787 118.99 65.61
85 555938 0.56 0.31
90 936755 0.94 0.52
95 0 0.00 0.00
Total Soil Area (sq km) 181.37
% of Total Basin Area 28.10
Soil Group Land Use Area (sq m) Area (sq km) % of Soil Group
C 10 35215145 35.22 13.91
20 11339547 11.34 4.48
30 183745 0.18 0.07
40 270212 0.27 0.11
50 20267463 20.27 8.00
60 8301945 8.30 3.28
70 0 0.00 0.00
75 0 0.00 0.00
80 177661692 177.66 70.16
85 0 0.00 0.00
90 0 0.00 0.00
95 0 0.00 0.00
Total Soil Area (sq km) 253.24
% of Total Basin Area 39.23
Soil Group Land Use Area (sq m) Area (sq km) % of Soil Group
D 10 0 0.00 0.00
20 525530 0.53 2.65
30 0 0.00 0.00
40 1396 0.00 0.01
50 2943179 2.94 14.84
60 3456129 3.46 17.43
70 0 0.00 0.00
75 0 0.00 0.00
80 12888235 12.89 65.00
85 13305 0.01 0.07
90 0 0.00 0.00
95 0 0.00 0.00
Total Soil Area (sq km) 19.83
% of Total Basin Area 3.07
Total Basin Area (sq km) 645.54

60
San Antonio Subbasin No. 14 Soil - Land Use Intersect
Soil Group Land Use Area (sq m) Area (sq km) % of Soil Group
A 10 12245098 12.25 3.37
20 10223355 10.22 2.81
30 0 0.00 0.00
40 6803211 6.80 1.87
50 70427757 70.43 19.36
60 93638097 93.64 25.73
70 24514 0.02 0.01
75 0 0.00 0.00
80 168993744 168.99 46.44
85 529094 0.53 0.15
90 974165 0.97 0.27
95 0 0.00 0.00
Total Soil Area (sq km) 363.86
% of Total Basin Area 44.58
Soil Group Land Use Area (sq m) Area (sq km) % of Soil Group
B 10 1006218 1.01 5.15
20 1137574 1.14 5.82
30 0 0.00 0.00
40 59303 0.06 0.30
50 601006 0.60 3.08
60 3761115 3.76 19.25
70 0 0.00 0.00
75 0 0.00 0.00
80 12589580 12.59 64.45
85 0 0.00 0.00
90 379312 0.38 1.94
95 0 0.00 0.00
Total Soil Area (sq km) 19.53
% of Total Basin Area 2.39
Soil Group Land Use Area (sq m) Area (sq km) % of Soil Group
C 10 9386 0.01 0.01
20 7938507 7.94 4.55
30 0 0.00 0.00
40 0 0.00 0.00
50 66525125 66.53 38.14
60 14968165 14.97 8.58
70 0 0.00 0.00
75 0 0.00 0.00
80 84987486 84.99 48.72
85 0 0.00 0.00
90 0 0.00 0.00
95 0 0.00 0.00
Total Soil Area (sq km) 174.43
% of Total Basin Area 21.37
Soil Group Land Use Area (sq m) Area (sq km) % of Soil Group
D 10 7055845 7.06 2.73
20 34584464 34.58 13.38
30 0 0.00 0.00
40 5054908 5.05 1.96
50 23854670 23.85 9.23
60 30056910 30.06 11.63
70 225807 0.23 0.09
75 0 0.00 0.00
80 151562386 151.56 58.65
85 2558464 2.56 0.99
90 3472480 3.47 1.34
95 0 0.00 0.00
Total Soil Area (sq km) 258.43
% of Total Basin Area 31.66
Total Basin Area (sq km) 816.25
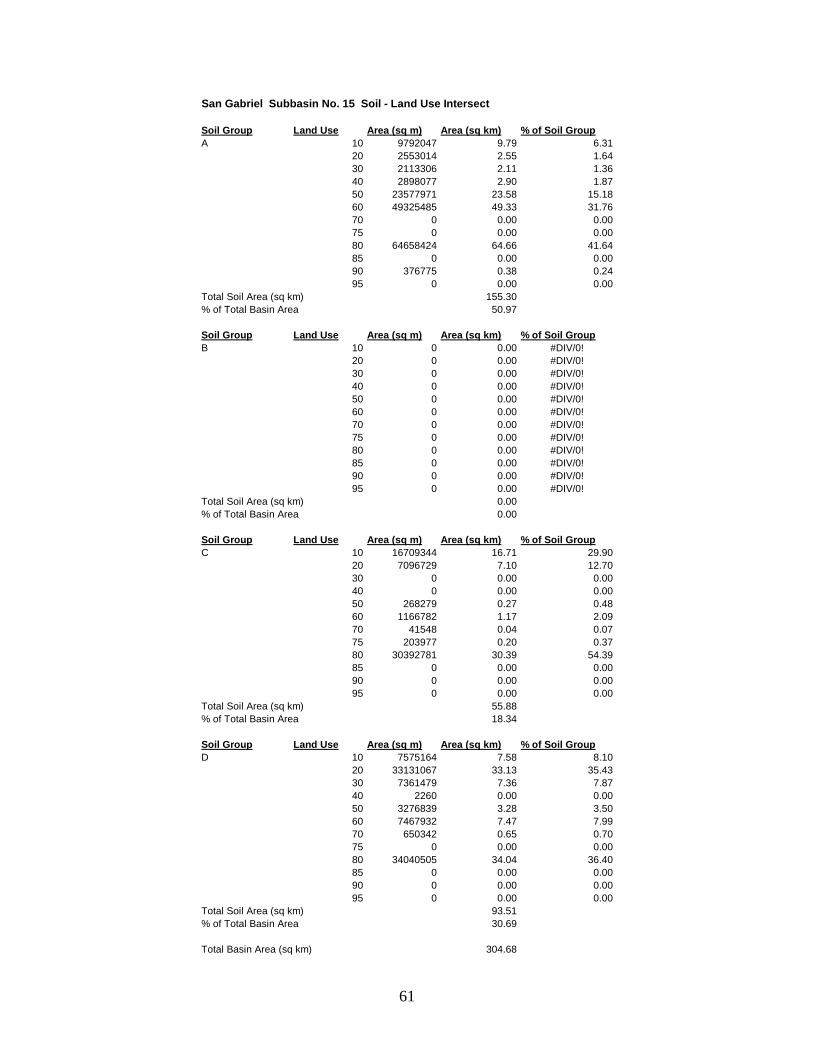
61
San Gabriel Subbasin No. 15 Soil - Land Use Intersect
Soil Group Land Use Area (sq m) Area (sq km) % of Soil Group
A 10 9792047 9.79 6.31
20 2553014 2.55 1.64
30 2113306 2.11 1.36
40 2898077 2.90 1.87
50 23577971 23.58 15.18
60 49325485 49.33 31.76
70 0 0.00 0.00
75 0 0.00 0.00
80 64658424 64.66 41.64
85 0 0.00 0.00
90 376775 0.38 0.24
95 0 0.00 0.00
Total Soil Area (sq km) 155.30
% of Total Basin Area 50.97
Soil Group Land Use Area (sq m) Area (sq km) % of Soil Group
B 10 0 0.00 #DIV/0!
20 0 0.00 #DIV/0!
30 0 0.00 #DIV/0!
40 0 0.00 #DIV/0!
50 0 0.00 #DIV/0!
60 0 0.00 #DIV/0!
70 0 0.00 #DIV/0!
75 0 0.00 #DIV/0!
80 0 0.00 #DIV/0!
85 0 0.00 #DIV/0!
90 0 0.00 #DIV/0!
95 0 0.00 #DIV/0!
Total Soil Area (sq km) 0.00
% of Total Basin Area 0.00
Soil Group Land Use Area (sq m) Area (sq km) % of Soil Group
C 10 16709344 16.71 29.90
20 7096729 7.10 12.70
30 0 0.00 0.00
40 0 0.00 0.00
50 268279 0.27 0.48
60 1166782 1.17 2.09
70 41548 0.04 0.07
75 203977 0.20 0.37
80 30392781 30.39 54.39
85 0 0.00 0.00
90 0 0.00 0.00
95 0 0.00 0.00
Total Soil Area (sq km) 55.88
% of Total Basin Area 18.34
Soil Group Land Use Area (sq m) Area (sq km) % of Soil Group
D 10 7575164 7.58 8.10
20 33131067 33.13 35.43
30 7361479 7.36 7.87
40 2260 0.00 0.00
50 3276839 3.28 3.50
60 7467932 7.47 7.99
70 650342 0.65 0.70
75 0 0.00 0.00
80 34040505 34.04 36.40
85 0 0.00 0.00
90 0 0.00 0.00
95 0 0.00 0.00
Total Soil Area (sq km) 93.51
% of Total Basin Area 30.69
Total Basin Area (sq km) 304.68

62
Puente FFCC Subbasin No. 16 Soil - Land Use Intersect
Soil Group Land Use Area (sq m) Area (sq km) % of Soil Group
A 10 13674219 13.67 9.36
20 5234650 5.23 3.58
30 0 0.00 0.00
40 1159997 1.16 0.79
50 53005090 53.01 36.28
60 15190917 15.19 10.40
70 889732 0.89 0.61
75 0 0.00 0.00
80 55854892 55.85 38.23
85 1018642 1.02 0.70
90 64841 0.06 0.04
95 0 0.00 0.00
Total Soil Area (sq km) 146.09
% of Total Basin Area 12.23
Soil Group Land Use Area (sq m) Area (sq km) % of Soil Group
B 10 0 0.00 0.00
20 0 0.00 0.00
30 0 0.00 0.00
40 0 0.00 0.00
50 0 0.00 0.00
60 0 0.00 0.00
70 0 0.00 0.00
75 0 0.00 0.00
80 366379 0.37 100.00
85 0 0.00 0.00
90 0 0.00 0.00
95 0 0.00 0.00
Total Soil Area (sq km) 0.37
% of Total Basin Area 0.03
Soil Group Land Use Area (sq m) Area (sq km) % of Soil Group
C 10 91085210 91.09 21.30
20 133778292 133.78 31.29
30 0 0.00 0.00
40 0 0.00 0.00
50 60150210 60.15 14.07
60 8993159 8.99 2.10
70 204982 0.20 0.05
75 558517 0.56 0.13
80 132792471 132.79 31.06
85 10807 0.01 0.00
90 0 0.00 0.00
95 3552 0.00 0.00
Total Soil Area (sq km) 427.58
% of Total Basin Area 35.80
Soil Group Land Use Area (sq m) Area (sq km) % of Soil Group
D 10 341348993 341.35 55.03
20 206538030 206.54 33.30
30 0 0.00 0.00
40 37 0.00 0.00
50 3998262 4.00 0.64
60 2448281 2.45 0.39
70 2417668 2.42 0.39
75 21612 0.02 0.00
80 60283452 60.28 9.72
85 231431 0.23 0.04
90 0 0.00 0.00
95 3004692 3.00 0.48
Total Soil Area (sq km) 620.29
% of Total Basin Area 51.94
Total Basin Area (sq km) 1194.33
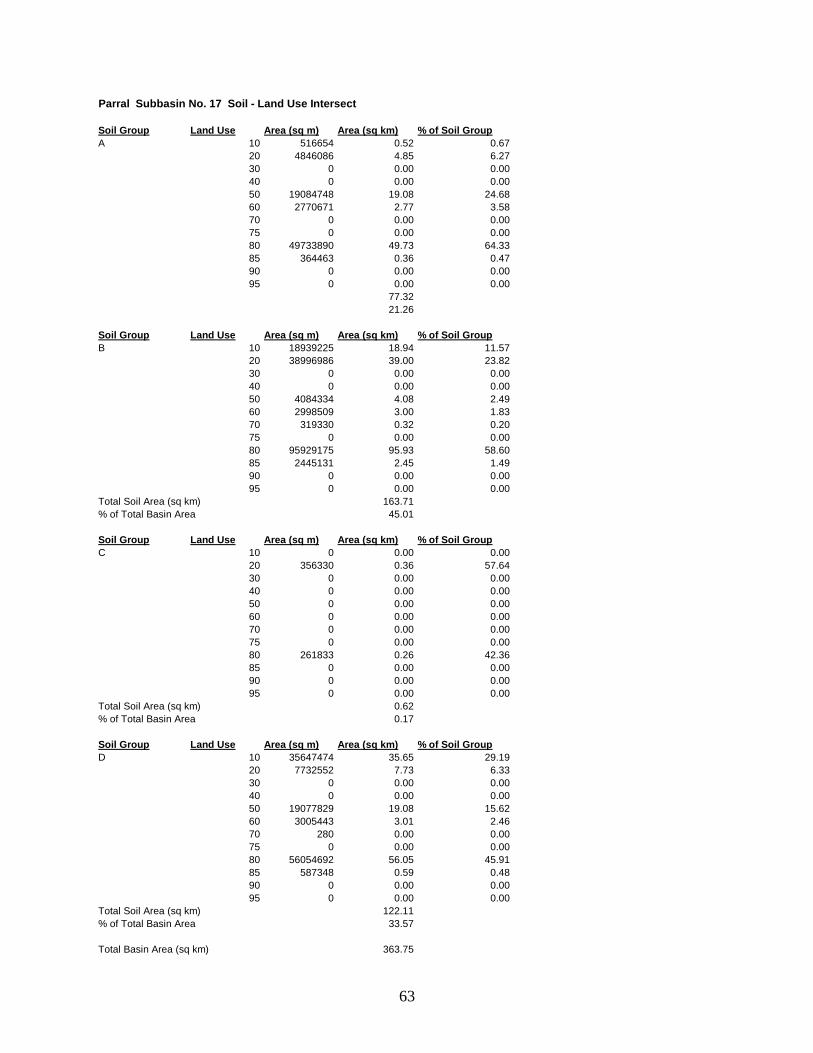
63
Parral Subbasin No. 17 Soil - Land Use Intersect
Soil Group Land Use Area (sq m) Area (sq km) % of Soil Group
A 10 516654 0.52 0.67
20 4846086 4.85 6.27
30 0 0.00 0.00
40 0 0.00 0.00
50 19084748 19.08 24.68
60 2770671 2.77 3.58
70 0 0.00 0.00
75 0 0.00 0.00
80 49733890 49.73 64.33
85 364463 0.36 0.47
90 0 0.00 0.00
95 0 0.00 0.00
77.32
21.26
Soil Group Land Use Area (sq m) Area (sq km) % of Soil Group
B 10 18939225 18.94 11.57
20 38996986 39.00 23.82
30 0 0.00 0.00
40 0 0.00 0.00
50 4084334 4.08 2.49
60 2998509 3.00 1.83
70 319330 0.32 0.20
75 0 0.00 0.00
80 95929175 95.93 58.60
85 2445131 2.45 1.49
90 0 0.00 0.00
95 0 0.00 0.00
Total Soil Area (sq km) 163.71
% of Total Basin Area 45.01
Soil Group Land Use Area (sq m) Area (sq km) % of Soil Group
C 10 0 0.00 0.00
20 356330 0.36 57.64
30 0 0.00 0.00
40 0 0.00 0.00
50 0 0.00 0.00
60 0 0.00 0.00
70 0 0.00 0.00
75 0 0.00 0.00
80 261833 0.26 42.36
85 0 0.00 0.00
90 0 0.00 0.00
95 0 0.00 0.00
Total Soil Area (sq km) 0.62
% of Total Basin Area 0.17
Soil Group Land Use Area (sq m) Area (sq km) % of Soil Group
D 10 35647474 35.65 29.19
20 7732552 7.73 6.33
30 0 0.00 0.00
40 0 0.00 0.00
50 19077829 19.08 15.62
60 3005443 3.01 2.46
70 280 0.00 0.00
75 0 0.00 0.00
80 56054692 56.05 45.91
85 587348 0.59 0.48
90 0 0.00 0.00
95 0 0.00 0.00
Total Soil Area (sq km) 122.11
% of Total Basin Area 33.57
Total Basin Area (sq km) 363.75

64
Colina Subbasin No. 18 Soil - Land Use Intersect
Soil Group Land Use Area (sq m) Area (sq km) % of Soil Group
A 10 0 0.00 0.00
20 0 0.00 0.00
30 0 0.00 0.00
40 0 0.00 0.00
50 0 0.00 0.00
60 47971579 47.97 39.93
70 20500895 20.50 17.06
75 20308646 20.31 16.90
80 26849590 26.85 22.35
85 0 0.00 0.00
90 1253886 1.25 1.04
95 3249572 3.25 2.70
Total Soil Area (sq km) 120.13
% of Total Basin Area 46.94
Soil Group Land Use Area (sq m) Area (sq km) % of Soil Group
B 10 0 0.00 0.00
20 0 0.00 0.00
30 121537 0.12 0.25
40 2379373 2.38 4.97
50 615402 0.62 1.29
60 15650886 15.65 32.69
70 23176041 23.18 48.41
75 0 0.00 0.00
80 5893782 5.89 12.31
85 0 0.00 0.00
90 36028 0.04 0.08
95 0 0.00 0.00
Total Soil Area (sq km) 47.87
% of Total Basin Area 18.71
Soil Group Land Use Area (sq m) Area (sq km) % of Soil Group
C 10 258856 0.26 0.40
20 0 0.00 0.00
30 5161004 5.16 8.06
40 4142957 4.14 6.47
50 3509971 3.51 5.48
60 25459693 25.46 39.78
70 4716003 4.72 7.37
75 0 0.00 0.00
80 20750688 20.75 32.42
85 0 0.00 0.00
90 0 0.00 0.00
95 0 0.00 0.00
Total Soil Area (sq km) 64.00
% of Total Basin Area 25.01
Soil Group Land Use Area (sq m) Area (sq km) % of Soil Group
D 10 274349 0.27 1.15
20 0 0.00 0.00
30 2650974 2.65 11.08
40 2098721 2.10 8.77
50 1447651 1.45 6.05
60 7382191 7.38 30.86
70 9806207 9.81 40.99
75 0 0.00 0.00
80 261624 0.26 1.09
85 0 0.00 0.00
90 3603 0.00 0.02
95 0 0.00 0.00
Total Soil Area (sq km) 23.93
% of Total Basin Area 9.35
Total Basin Area (sq km) 255.93

65
La Boquilla Subbasin No. 19 Soil - Land Use Intersect
Soil Group Land Use Area (sq m) Area (sq km) % of Soil Group
A 10 1170628229 1170.63 24.86
20 746690894 746.69 15.86
30 400181 0.40 0.01
40 10911772 10.91 0.23
50 619673766 619.67 13.16
60 422781624 422.78 8.98
70 85146360 85.15 1.81
75 317979 0.32 0.01
80 1633173132 1633.17 34.68
85 1313984 1.31 0.03
90 50402 0.05 0.00
95 17931306 17.93 0.38
Total Soil Area (sq km) 4709.02
% of Total Basin Area 26.56
Soil Group Land Use Area (sq m) Area (sq km) % of Soil Group
B 10 2076083278 2076.08 30.18
20 1610168768 1610.17 23.41
30 0 0.00 0.00
40 9992579 9.99 0.15
50 497251893 497.25 7.23
60 257303211 257.30 3.74
70 42635586 42.64 0.62
75 523486 0.52 0.01
80 2380528535 2380.53 34.60
85 1871345 1.87 0.03
90 1260822 1.26 0.02
95 1808601 1.81 0.03
Total Soil Area (sq km) 6879.43
% of Total Basin Area 38.80
Soil Group Land Use Area (sq m) Area (sq km) % of Soil Group
C 10 494974896 494.97 12.79
20 471496196 471.50 12.18
30 17042455 17.04 0.44
40 4733926 4.73 0.12
50 343967487 343.97 8.89
60 446845917 446.85 11.54
70 63865488 63.87 1.65
75 1594508 1.59 0.04
80 2005201600 2005.20 51.80
85 5061537 5.06 0.13
90 0 0.00 0.00
95 16256688 16.26 0.42
Total Soil Area (sq km) 3871.04
% of Total Basin Area 21.83
Soil Group Land Use Area (sq m) Area (sq km) % of Soil Group
D 10 343710053 343.71 15.13
20 395442448 395.44 17.41
30 32836869 32.84 1.45
40 3428887 3.43 0.15
50 108937067 108.94 4.80
60 392471158 392.47 17.28
70 70823994 70.82 3.12
75 2142447 2.14 0.09
80 909521959 909.52 40.04
85 284184 0.28 0.01
90 57591 0.06 0.00
95 11918114 11.92 0.52
Total Soil Area (sq km) 2271.57
% of Total Basin Area 12.81
Total Basin Area (sq km) 17731.06
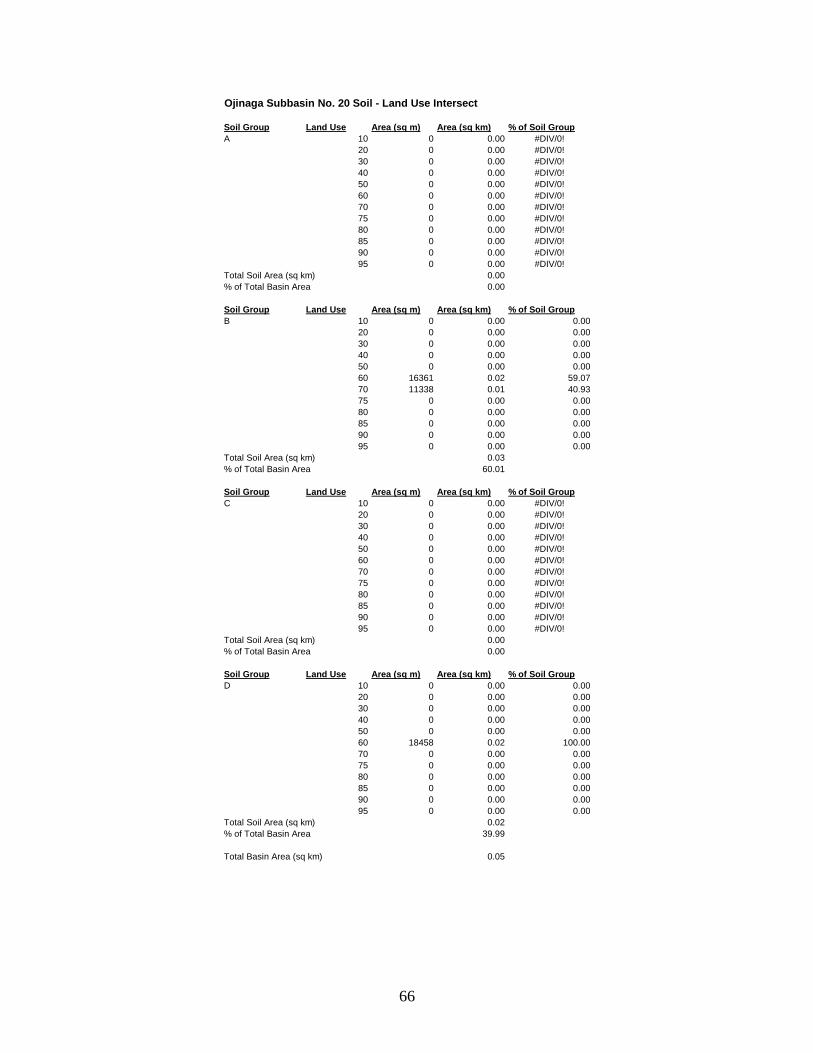
66
Ojinaga Subbasin No. 20 Soil - Land Use Intersect
Soil Group Land Use Area (sq m) Area (sq km) % of Soil Group
A 10 0 0.00 #DIV/0!
20 0 0.00 #DIV/0!
30 0 0.00 #DIV/0!
40 0 0.00 #DIV/0!
50 0 0.00 #DIV/0!
60 0 0.00 #DIV/0!
70 0 0.00 #DIV/0!
75 0 0.00 #DIV/0!
80 0 0.00 #DIV/0!
85 0 0.00 #DIV/0!
90 0 0.00 #DIV/0!
95 0 0.00 #DIV/0!
Total Soil Area (sq km) 0.00
% of Total Basin Area 0.00
Soil Group Land Use Area (sq m) Area (sq km) % of Soil Group
B 10 0 0.00 0.00
20 0 0.00 0.00
30 0 0.00 0.00
40 0 0.00 0.00
50 0 0.00 0.00
60 16361 0.02 59.07
70 11338 0.01 40.93
75 0 0.00 0.00
80 0 0.00 0.00
85 0 0.00 0.00
90 0 0.00 0.00
95 0 0.00 0.00
Total Soil Area (sq km) 0.03
% of Total Basin Area 60.01
Soil Group Land Use Area (sq m) Area (sq km) % of Soil Group
C 10 0 0.00 #DIV/0!
20 0 0.00 #DIV/0!
30 0 0.00 #DIV/0!
40 0 0.00 #DIV/0!
50 0 0.00 #DIV/0!
60 0 0.00 #DIV/0!
70 0 0.00 #DIV/0!
75 0 0.00 #DIV/0!
80 0 0.00 #DIV/0!
85 0 0.00 #DIV/0!
90 0 0.00 #DIV/0!
95 0 0.00 #DIV/0!
Total Soil Area (sq km) 0.00
% of Total Basin Area 0.00
Soil Group Land Use Area (sq m) Area (sq km) % of Soil Group
D 10 0 0.00 0.00
20 0 0.00 0.00
30 0 0.00 0.00
40 0 0.00 0.00
50 0 0.00 0.00
60 18458 0.02 100.00
70 0 0.00 0.00
75 0 0.00 0.00
80 0 0.00 0.00
85 0 0.00 0.00
90 0 0.00 0.00
95 0 0.00 0.00
Total Soil Area (sq km) 0.02
% of Total Basin Area 39.99
Total Basin Area (sq km) 0.05

67
Appendix 2. CRWR Geodatabase Reach Lengths
Basin Name IMTA
Basin ID Reach Name
Reach Length Notes
(km)
Peguis 1 Rio_Conchos_1 142.32 DS Reach Rio_Conchos_20
Sacramento 2 - - Headwater to Rio_Sacramento_4
Las Burras 3 Rio_Conchos_3 135.41 DS Reach Rio_Conchos_4
Rio_Florido_3 89.05 DS Reach Rio_Conchos_3
Arroyo_El_Parral_3 148.77 DS Reach Rio_Florido_3
Rio_San_Pedro_3 38.65 DS Reach Rio_Conchos_3
Luis L. Leon 4 Rio_Conchos_4 88.74 DS Reach Rio_Conchos_1
Rio_Sacramento_4 103.49 DS Reach Rio_Conchos_4
Arroyo_Sacramento_4 5.55 DS Reach Rio_Sacramento_4
FCO. Madero 5 Rio_San_Pedro_5 29.15 Headwater to Rio_San_Pedro_3
Villalba 6 - - Headwater to Rio_San_Pedro_5
Conchos 7 Rio_Conchos_7 25.94 DS Reach: Rio_Conchos_3
Jimenez 8 Rio_Florido_8 88.08 DS Reach: Rio_FLorido_3
Chuviscar 9 Arroyo_Sacramento_9 140.41 DS Reach: Arroyo_Sacramento_4
River_10 3.12 DS Reach Arroyo_Sacramento_9
El Rejon 10 - - Headwater to River_10
Chihuahua 11 - - Headwater to Arroyo_Sacramento_9
Llanitos 12 - - Headwater to RioBalleza_Conchos_19
Pico del Aguila 13 Rio_Florido_13 24.05 DS Reach Rio_Florido_8
San Antonio 14 Rio_Florido_14 28.33 DS Reach Rio_Florido_13
San Gabriel 15 Rio_Florido_15 12.54 DS Reach Rio_Florido_14
Puente FFCC 16 - - Headwater to Rio_Florido_15
Parral 17 - - Headwater to Arroyo_El_Parral_3
Colina 18 Rio_Conchos_18 18210.59 DS Reach Rio_Conchos_7
La Boquilla 19 RioBalleza_Conchos_19 259.86 DS Reach Rio_Conchos_18
Ojinaga 20 Rio_Conchos_20 45.90 Outfall