teachers guidebook cce whole guide
TRANSCRIPT

SS EE AA MM EE OO
Integrating Climate
Change Issues in
Southeast Asian Schools
A Teachers’ Guidebook
Edited by
Azian T.S. Abdullah
SEAMEO RECSAM
Southeast Asian Ministers of Education Organization
2010

Integrating Climate Change Issues in Southeast
Asian Schools A Teachers’ Guidebook
Edited by:
Azian T.S. Abdullah
Southeast Asian Ministers of Education Organisation

Copyright © 2010 SEAMEO
Integrating Climate Change Issues in Southeast Asian Schools
A Teachers’ Guidebook
Published by:
SEAMEO RECSAM Jalan Sultan Azlan Shah
11700 Gelugor Pulau Pinang, Malaysia
Tel: +604-6522700
Fax: +604-6522737
Email: [email protected] URL: http://www.recsam.edu.my
We are grateful to owners of copyright material for allowing us to use their material. In some instances we have been unable to trace the owners, and we would appreciate any information that would enable us to acknowledge them. All rights reserved, except for educational purposes with no commercial interests. No part of this publication may be reproduced, transmitted in any form or by any means, electronic or mechanical including photocopying, recorded or by any information storage or retrieval system, without prior permission from SEAMEO.
ISBN 978-967-930-019-2

FOREWORD

FOREWORD
SEAMEO
ii
Foreword
“The countries of the world must act now, act together and act differently on climate change,” said World Bank President Robert B. Zoellick. As part of the world community, the Southeast Asian Ministers of Education Organisation (SEAMEO) has come a long way to promote meaningful cooperation in education, science and culture. With eleven (11) Member Countries, eight (8) Associate Members, three (3) Affiliate Members and nineteen (19) specialist institutions with interdisciplinary fields of expertise, SEAMEO as with the rest of the world is committed to attend to the emerging concerns on climate change and to support climate change education in the region and beyond. Integrating Climate Change Issues in Southeast Asian Schools Teacher’s Guidebook is an initiative by SEAMEO to provide teachers with useful initial resources to facilitate the capacity building of young people on the issues. This guidebook, which covers a range of related climate change concerns such as poverty, health and nutrition, and food security, would be particularly helpful to assist teachers to prepare our young generation in experiencing and dealing with the effects of climate change. This guidebook, which is produced through a collaborative effort of experts from eight SEAMEO Regional Centres, namely SEAMEO RECSAM, SEAMEO SPAFA, SEAMEO INNOTECH, SEAMEO SEARCA, SEAMEO SEAMOLEC, SEAMEO BIOTROP and the SEAMEO TROPMED Centres in Indonesia and the Philippines, will be shared with all the Ministries of Education of SEAMEO and Associate Member Countries. Led by SEAMEO RECSAM, experts from the eight SEAMEO Regional Centres effortlessly and painstakingly worked on planning and developing the integrative learning framework and selected the most appropriate materials including providing some lesson exemplars. For greater impact, it is our hope that this guidebook will be used extensively in schools in the region to enhance teachers’ competencies to create effective learning experiences for the young people not only on the issues and impact of climate change but also on how these should be addressed. I wish to congratulate SEAMEO RECSAM for leading the initiative, and SEAMEO SPAFA, SEAMEO INNOTECH, SEAMEO SEARCA, SEAMEO SEAMOLEC, SEAMEO BIOTROP and the SEAMEO TROPMED Centres in Indonesia and the Philippines for the collaboration and hard work of putting together the guidebook. Dato’ Dr. Ahamad bin Sipon Director SEAMEO Secretariat Bangkok

iii
PREFACE

PREFACE
iv
SEAMEO
Preface
The Southeast Asian Ministers of Education Organisation (SEAMEO) was established on
30 November 1965 as a chartered international organisation whose purpose is to
promote cooperation in education, science and culture in the Southeast Asian region.
SEAMEO’s mission is “to enhance regional understanding and cooperation and unity of
purpose among SEAMEO Member Countries and achieve a better quality of life through
(a) the establishment of networks and partnerships, (b) the provision of an intellectual
forum for policy makers and experts, and (c) the promotion of sustainable human
resource development.
Eight SEAMEO Regional Centres, namely; RECSAM, BIOTROP, SPAFA, SEARCA,
SEAMOLEC, TROPMED Philippines, TROPMED Indonesia, and INNOTECH embarked
on a collaboration to publish this Teachers’ Guidebook to address the impact of climate
change in Southeast Asia. The publication of this guidebook aims to raise the
awareness level of our future citizens in Southeast Asia with their teachers’ guidance
and help; so that they will take positive actions for a better quality of life on our planet.
This Teachers’ Guidebook is intended for use by educators, teachers, curriculum
developers, and instructional administrators responsible for connecting academic
concepts with climate change issues in their respective schools and communities across
Southeast Asian countries. It was developed by a multidisciplinary team from the
different SEAMEO Centers using an interdisciplinary approach.
This guidebook contains the various issues that result from climate change and
describes the integration process in developing the adaptive capacity of the people of
Southeast Asia through formal and non-formal education. It provides basic information
on the causes of global warming that triggers climate change. It also presents lesson
exemplars using climate change issues and other environment-oriented or eco-friendly
activities as learning context. Moreover, it describes strategies to integrate climate
change issues and adaptation concepts in classroom teaching as well as how to assess
the effectiveness of such an integrated learning system.
The learning activities are not exhaustive but they serve as a practical guide for honing
the teacher’s creativity as a learning facilitator. Maximum utilisation of this guidebook will
help teachers learn more about the implications of climate change to the environment, its
natural resources and human lives as well. To ensure success in adopting the prototype
lesson plans, it would require teacher training to assist them in preparing lesson plans
that integrate climate change issues in the basic education curriculum. The chapters and
accompanying lesson plans can be used as “stand alone” teaching and learning
materials but it would be more useful if the teacher thoroughly reads and understands
the Introduction section first.

PREFACE
v
SEAMEO
Preface
Looking forward, this guidebook hopes to operationalise the objectives of Agenda 21 by
focusing and aligning education efforts towards sustainable development. Agenda 21 will
be successful if our teachers could effectively increase young people’s awareness of
environmental and climate change issues, and develop their resilience and adaptive
capacity. May this guidebook lead us towards a more sustainable living and learning for
our children’s children.
Dr. Azian T.S. Abdullah Centre Director SEAMEO RECSAM MALAYSIA Dr. Gatot Hari Priyowiryanto
Centre Director
SEAMEO SEAMOLEC, Jakarta,
INDONESIA
Dr. Nina G. Gloriani Centre Director SEAMEO TROPMED Philippines for Public Health, Manila PHILIPPINES Dr. Ratna Sitompul Centre Director SEAMEO TROPMED Indonesia for Community Nutrition Jakarta, INDONESIA
Dr. Bambang Purwantara.
Centre Director SEAMEO BIOTROP, Bogor INDONESIA Dr. Gil C Saguiguit, Jr Centre Director SEAMEO SEARCA, Laguna, PHILIPPINES
Dr. Ramon C Bacani Centre Director SEAMEO INNOTECH, Quezon City, PHILIPPINES
Dr. R. Rujaya Abhakorn Centre Director
SEAMEO SPAFA, Bangkok
THAILAND

TEACHER’S GUIDEBOOK ON CLIMATE CHANGE TABLE OF CONTENTS

TEACHER’S GUIDEBOOK ON CLIMATE CHANGE
vii
SEAMEO
Contents
Foreword i-ii
Preface iii-v
Table of Contents vi-x
Acronyms xi-xii
Glossary of Terms xiii-xxii
Introduction: Introduction • Once upon a Time, Earth was Healthy • Earth Having Fever? • Making More Money • What Energy Sources Do We Have? • Are We in Serious Trouble? How? • Drought and Flooding, a Water Seesaw • We Get Sick Too • Operation Rescue! • What is our Response? • References
1-11 2 2-3 3-4 4 4-6 7 7 7-8 8-10 11
Chapter I: Impact of Climate Change on Biodiversity and Ecosystem • The Ecosystem • Functions of Biodiversity and Ecosystem • How does Climate Change Affect Biodiversity and Ecosystem? • Biodiversity and What Can Countries Do? • Biodiversity and What You Can Do? • References • Lesson Plan Exemplars
Lesson 1: Climate Change, A Mixed Blessing Lesson 2: Climate Change: Threat to Biodiversity
Lesson 3: Interesting Insects
12-50 13-14 14-15 15-18 18 18-20 21-22 23-33 34-41 42-50
Chapter II: Climate Change and Freshwater Resources • What Are Freshwater Resources? • How Does Climate Change Affect our Freshwater Resources? • What Can We Do to Save our Freshwater Resources? • Conclusion • References • Lesson Plan Exemplars
Lesson 1: Thirst for More! Lesson 2: Freshwater at Risk! Lesson 3: Wanted: Safe Drinking Water
51-89 52-53 53-54 55-56 56-57 58 59-68 69-77 78-89

TEACHER’S GUIDEBOOK ON CLIMATE CHANGE
viii
SEAMEO
Contents
Chapter III: Impact of Climate Change on Rising Sea Level and Sea Temperature
• Introduction • Rising Sea Levels • Effects of Rising Sea Levels • Rising Sea Temperature • Effects of Rising Sea Temperature • Ocean Acidification • What to do? • References • Lesson Plan Exemplars
Lesson 1: Saving the Marines Lesson 2: Acid Ocean Alert! Lesson 3: Let’s Measure It!
90-124 91-92 92-93 93-95 95-96 96-97 97-98 98 99-100 101-109 110-118 119-124
Chapter IV: Climate Change and Energy Efficiency • What is Energy? • What is the Greenhouse Effect? • The Greenhouse Effect and Climate Change • What is Renewable Energy (RE)? • Clean Energy Generation of Thailand (A Case Study) • What is Energy Efficiency (EE)? • Conclusion • References • Lesson Plan Exemplars
Lesson 1: Choosing a Greener Energy Lesson 2: Save Energy, Save the Earth Lesson 3: Electrical Energy and Carbon Footprint: Which
Fits Best?
125-168 126-127 128-129 129-130 130-135 135-136 136 137 138-139 140-147 148-159 160-168
Chapter V: Impact of Climate Change on Food Security • Introduction • Basic Environmental Principles • Disruptions of Carbon and Water Cycles • Climate Change and Food Security • Fishes at Risk • How can Farmers Boost Food Production? • What Can Farmers Do to Create a More Climate-Friendly
Environment? • References • Lesson Plan Exemplars
Lesson 1: We’re Messing up the Food Chain!
169-213 170 170-173 173-174 174-175 175 176 176 177-178 179-185

TEACHER’S GUIDEBOOK ON CLIMATE CHANGE
ix
SEAMEO
Contents
Lesson 2: Save our Forest and Water Areas Lesson 3: Mea Culpa, Mother Earth Lesson 4: Utilising Agricultural Wastes
186-192 193-206 207-213
Chapter VI: Impact of Climate Change on Health and Nutrition • Introduction • Ways in Which Climate Change can Affect Human Health • Influence of Climate Change on Disease Triad • Vector-Borne Diseases • Waterborne Diseases • What Impact will Climate Change Have on Water Quality? • What are the Impacts of Climate Change on Nutrition? • Food Contamination • Nutrition and Quality of Caring Practices • What Needs to be Done? • What can the students do to make a difference? • References • Lesson Plan Exemplars
Lesson 1: Contaminated Water and Water-borne Diseases Lesson 2: Let’s Fight Dengue! Lesson 3: Understanding Filariasis
214-251 215 215-216 216-217 217-218 219 219-221 221-223 223-224 224-225 225 225-226 227-228 229-237 238-243 244-251
Chapter VII: Impact of Climate Change on Poverty• Introduction • What is Poverty? • What is the Relationship between Climate Change and Poverty? • Climate Change and Poverty in Southeast Asia • Poverty Cycle • A Summary on Continuing Poverty • Climate Change, Poverty and Women • Breaking the Poverty Cycle • Our Future • References • Lesson Plan Exemplars
Lesson 1: A Life Behind Every Statistic Lesson 2: Life Stories Lesson 3: Time for Action
252-290 253 253-254 254-256 256-257 258-259 259-260 260-262 262-263 264 264-265 266-275 276-284 285-290
Chapter VIII: Impact of Climate Change on Conflict• Introduction • What is the Relationship between Climate Change and Conflict? • Climate Change and Southeast Asia • History of Climate Change and Conflict • What Should We Do Globally?
291-338 292 292 293-294 295 296-297

TEACHER’S GUIDEBOOK ON CLIMATE CHANGE
x
SEAMEO
Contents
• How Should We Help Locally? • References • Lesson Plan Exemplars
Lesson 1: How Much Do I Get? Lesson 2: The Two Goats Lesson 3: Where Do I Belong?
298-301 301 302-311 312-317 318-338
Conclusion 339-341
Contributors 342-349
Appendix (Concept Map)

ACRONYMS

ACRONYMS
xii
SEAMEO
Acronyms
ADB Asian Development Bank BIOTROP Regional Centre for Tropical Biology IFAD International Fund for Agricultural Development IIED International Institute for Environment and Development INNOTECH Regional Centre for Educational Innovation and Technology ILO International Labour Organisation IPCC Intergovernmental Panel on Climate Change IRRI International Rice Research Institute GDP Gross Domestic Product GHG Greenhouse Gas GNH Gross National Happiness NGO Non-Government Organisation RECSAM Regional Centre for Education in Science and Mathematics SEAMEO Southeast Asian Ministers of Education Organisation SEAMOLEC Regional Open Learning Centre SEARCA Regional Centre for Graduate Study and Research in Agriculture SPAFA Regional Centre for Archaeology and Fine Arts TROPMED (Indonesia) Regional Centre for Community Nutrition TROPMED (Philippines) Regional Centre for Public Health, Hospital Administration, Environmental and Occupational Health UNCBD United Nations Convention on Biological Diversity UNFCCC United Nations Framework Convention on Climate Change UNFPA United Nations Population Fund Agency UNICEF United Nations Children's Education Fund WB World Bank WHO-SEARO World Health Organisation Southeast Asia Regional Office WWF World Wildlife Fund

GLOSSARY of TERMS

GLOSSARY OF TERMS
xiv
SEAMEO
Glossary
Adaptation Adjustment in natural or human systems to a new or changing environment. Adaptation to climate change refers to adjustment in natural or human systems in response to actual or expected climatic stimuli or their effects, which moderates harm or exploits beneficial opportunities. Adaptive capacity The ability of a system (e.g., ecosystem) to adapt to climate change or other environmental disturbances. This may mean moderating potential damages, taking advantage of opportunities or coping with the consequences. In discussions on global warming adaptive capacity often refers to a country. In this case it is currently much lower in developing countries, consequential to poverty. Aerosol A collection of airborne solid or liquid particles, with a typical size between 0.01 and 10 micrometers (µm) and residing in the atmosphere for at least several hours. Aerosols may influence climate in two ways: directly through scattering and absorbing radiation, and indirectly through acting as condensation nuclei for cloud formation or modifying the optical properties and lifetime of clouds. The term has also come to be associated, erroneously, with the propellant used in "aerosol sprays." Alternative Energy Energy derived from nontraditional sources (e.g., solar, hydroelectric, wind, wave, tidal, biomass and geothermal) Anthropogenic Made by people or resulting from human activities. Usually used in the context of emissions that is produced as a result of human activities Atmosphere The gaseous envelope surrounding the Earth. The dry atmosphere consists almost entirely of nitrogen (78.1% volume mixing ratio) and oxygen (20.9% volume mixing ratio), together with a number of trace gases, such as argon (0.93% volume mixing ratio), helium, radiatively active greenhouse gases such as carbon dioxide (0.035% volume mixing ratio), and ozone. In addition the atmosphere contains water vapour, whose amount is highly variable but typically 1% volume mixing ratio. The atmosphere also contains clouds and aerosols. Biodiversity Life in all its forms, essential to maintain functioning ecosystems that provide services essential for human survival and quality of life. Biogeochemical Cycle Movements through the Earth system of key chemical constituents essential to life, such as carbon, nitrogen, oxygen, and phosphorus. Biomass Total dry weight of all living organisms that can be supported at each tropic level in a food chain. Also, materials that are biological in origin, including organic material (both living and dead) from above and below ground, for example, trees, crops, grasses, tree litter, roots, and animals and animal waste.

GLOSSARY OF TERMS
xv
SEAMEO
Glossary
Biosphere The part of the Earth system comprising all ecosystems and living organisms, in the atmosphere, on land (terrestrial biosphere) or in the oceans (marine biosphere), including derived dead organic matter, such as litter, soil organic matter and oceanic detritus. Carbon Cycle All parts (reservoirs) and fluxes of carbon. The cycle is usually thought of as four main reservoirs of carbon interconnected by pathways of exchange. The reservoirs are the atmosphere, terrestrial biosphere (usually includes freshwater systems), oceans, and sediments (includes fossil fuels). The annual movements of carbon, the carbon exchanges between reservoirs, occur because of various chemical, physical, geological, and biological processes. The ocean contains the largest pool of carbon near the surface of the Earth, but most of that pool is not involved with rapid exchange with the atmosphere. Carbon Dioxide A naturally occurring gas, and also a by-product of burning fossil fuels and biomass, as well as land-use changes and other industrial processes. It is the principal anthropogenic greenhouse gas that affects the Earth's radiative balance. It is the reference gas against which other greenhouse gases are measured and therefore has a Global Warming Potential of 1. See Global Warming Potential. Carbon Footprint It is an estimate of how much carbon dioxide is produced to support your lifestyle. It is a measure of your impact on the climate based on how much carbon dioxide you produce. Factors that contribute to your carbon footprint include your travel methods and general home energy usage. Chlorofluorocarbons Greenhouse gases covered under the 1987 Montreal Protocol and used for refrigeration, air conditioning, packaging, insulation, solvents, or aerosol propellants. Since they are not destroyed in the lower atmosphere, CFCs drift into the upper atmosphere where, given suitable conditions, they break down ozone. These gases are being replaced by other compounds, including hydrochlorofluorocarbons and hydrofluorocarbons, which are greenhouse gases covered under the Kyoto Protocol. Climate Climate in a narrow sense is usually defined as the "average weather," or more rigorously, as the statistical description in terms of the mean and variability of relevant quantities over a period of time ranging from months to thousands of years. The classical period is three decades, as defined by the World Meteorological Organisation (WMO). These quantities are most often surface variables such as temperature, precipitation, and wind. Climate in a wider sense is the state, including a statistical description, of the climate system. A simple way of remembering the difference is that climate is what you expect (e.g., cold winters) and 'weather' is what you get (e.g., a blizzard). Climate Change Climate change refers to any significant change in measures of climate (such as temperature, precipitation, or wind) lasting for an extended period (decades or longer). Climate change may result from:

GLOSSARY OF TERMS
xvi
SEAMEO
Glossary
• natural factors, such as changes in the sun's intensity or slow changes in the Earth's orbit around the sun;
• natural processes within the climate system (e.g., changes in ocean circulation); and
• human activities that change the atmosphere's composition (e.g., through burning fossil fuels) and the land surface (e.g., deforestation, reforestation, urbanisation, desertification, etc.)
Climate (change) scenario A climate scenario consists of projections of possible climate futures, containing developments of driving forces, greenhouse gas emissions, temperature change and sea level rise and their key relationships. A climate change scenario is the difference between a climate scenario and the current climate. Climate projection A projection of the response of the climate system to emission or concentration scenarios of greenhouse gases and aerosols, or radiative forcing scenarios, often based upon simulations by climate models. Climate projections are distinguished from climate predictions in order to emphasise that climate projections depend upon the emission/concentration/ radiative forcing scenario used, which are based on assumptions, concerning, e.g., future socio-economic and technological developments, that may or may not be realised, and are therefore subject to substantial uncertainty. Climate System (or Earth System) The five physical components (atmosphere, hydrosphere, cryosphere, lithosphere, and biosphere) that are responsible for the climate and its variations. Deforestation Those practices or processes that result in the conversion of forested lands for non-forest uses. This is often cited as one of the major causes of the enhanced greenhouse effect for two reasons: 1) the burning or decomposition of the wood releases carbon dioxide; and 2) trees that once removed carbon dioxide from the atmosphere in the process of photosynthesis are no longer present. Drought A period of abnormally dry weather long enough to cause serious shortages of water for agriculture and other needs in the affected area. Ecosystem Any natural unit or entity including living and non-living parts that interact to produce a stable system through cyclic exchange of materials. El Niño El Niño, in its original sense, is a warm water current that periodically flows along the coast of Ecuador and Peru, disrupting the local fishery. This oceanic event is associated with a fluctuation of the intertropical surface pressure pattern and circulation in the Indian and Pacific Oceans, called the Southern Oscillation. This coupled atmosphere-ocean phenomenon is collectively known as El Niño-Southern Oscillation. During an El Niño event, the prevailing trade winds weaken and the equatorial countercurrent strengthens, causing warm surface waters in the Indonesian area to flow eastward to overlie the cold waters of the Peru current. This

GLOSSARY OF TERMS
xvii
SEAMEO
Glossary
event has great impact on the wind, sea surface temperature, and precipitation patterns in the tropical Pacific. It has climatic effects throughout the Pacific region and in many other parts of the world. The opposite of an El Niño event is called La Niña. Environment The complex physical, chemical, and biotic factors (as climate, soil, and living things) that act upon an organism (a living thing) or an ecological community (a collection of living things) and ultimately determine its form and survival. The circumstances, objects, and conditions that surround each of us. Evapotranspiration The combined process of evaporation from the Earth's surface and transpiration from vegetation. Extreme weather event An extreme weather event is an event that is rare within its statistical reference distribution at a particular place. Definitions of “rare” vary, but an extreme weather event would normally be as rare as or rarer than the 10th or 90th percentile. By definition, the characteristics of what is called extreme weather may vary from place to place. An extreme climate event is an average of a number of weather events over a certain period of time, an average which is itself extreme (e.g., rainfall over a season). Fluorocarbons Carbon-fluorine compounds that often contain other elements such as hydrogen, chlorine, or bromine. Common fluorocarbons include chlorofluorocarbons (CFCs), hydrochlorofluorocarbons (HCFCs), hydrofluorocarbons (HFCs), and perfluorocarbons (PFCs). Geosphere The soils, sediments, and rock layers of the Earth's crust, both continental and beneath the ocean floors. Glacier A multi-year surplus accumulation of snowfall in excess of snowmelt on land and resulting in a mass of ice at least 0.1 km2 in area that shows some evidence of movement in response to gravity. A glacier may terminate on land or in water. Glacier ice is the largest reservoir of fresh water on Earth, and second only to the oceans as the largest reservoir of total water. Glaciers are found on every continent except Australia. Global Warming Global warming is an average increase in the temperature of the atmosphere near the Earth's surface and in the troposphere, which can contribute to changes in global climate patterns. Global warming can occur from a variety of causes, both natural and human induced. In common usage, "global warming" often refers to the warming that can occur as a result of increased emissions of greenhouse gases from human activities.

GLOSSARY OF TERMS
xviii
SEAMEO
Glossary
Global Warming Potential (GWP) Global Warming Potential (GWP) is defined as the cumulative radiative forcing effects of a gas over a specified time horizon resulting from the emission of a unit mass of gas relative to a reference gas. The GWP-weighted emissions of direct greenhouse gases in the U.S. Inventory are presented in terms of equivalent emissions of carbon dioxide (CO2), using units of teragrams of carbon dioxide equivalents (Tg CO2 Eq.). Greenhouse Effect Trapping and build-up of heat in the atmosphere (troposphere) near the Earth’s surface. Some of the heat flowing back toward space from the Earth's surface is absorbed by water vapour, carbon dioxide, ozone, and several other gases in the atmosphere and then reradiated back toward the Earth’s surface. If the atmospheric concentrations of these greenhouse gases rise, the average temperature of the lower atmosphere will gradually increase. Greenhouse Gas (GHG) Any gas that absorbs infrared radiation in the atmosphere. Greenhouse gases include, but are not limited to, water vapour, carbon dioxide (CO2), methane (CH4), nitrous oxide (N2O), chlorofluorocarbons (CFCs), hydrochlorofluorocarbons (HCFCs), ozone (O3), hydrofluorocarbons (HFCs), perfluorocarbons (PFCs), and sulfur hexafluoride (SF6). Greenhouse pollution Pollution of the Earth's atmosphere by excessive emissions of greenhouse gases by humans. This increases the volume of gases in the atmosphere, traps more solar radiation and leads to global warming. Heat Stress A variety of problems associated with very warm temperatures and high humidity. Heat exhaustion is a condition marked by weakness, nausea, dizziness, and profuse sweating that results from physical exertion in a hot environment. Heat stroke is a condition marked especially by cessation of sweating, extremely high body temperature, and collapse that results from prolonged exposure to high temperature. Hydrocarbons Substances containing only hydrogen and carbon. Fossil fuels are made up of hydrocarbons. Hydrologic Cycle The process of evaporation, vertical and horizontal transport of vapor, condensation, precipitation, and the flow of water from continents to oceans. It is a major factor in determining climate through its influence on surface vegetation, the clouds, snow and ice, and soil moisture. The hydrologic cycle is responsible for 25% to 30% of the mid-latitudes' heat transport from the equatorial to polar regions. Hydrosphere The component of the climate system comprising liquid surface and subterranean water, such as oceans, seas, rivers, fresh water lakes and underground water etc.

GLOSSARY OF TERMS
xix
SEAMEO
Glossary
Intergovernmental Panel on Climate Change (IPCC) The IPCC was established jointly by the United Nations Environment Programme and the World Meteorological Organisation in 1988. The purpose of the IPCC is to assess information in the scientific and technical literature related to all significant components of the issue of climate change. The IPCC draws upon hundreds of the world's expert scientists as authors and thousands as expert reviewers. Leading experts on climate change and environmental, social, and economic sciences from some 60 nations have helped the IPCC to prepare periodic assessments of the scientific underpinnings for understanding global climate change and its consequences. With its capacity for reporting on climate change, its consequences, and the viability of adaptation and mitigation measures, the IPCC is also looked to as the official advisory body to the world's governments on the state of the science of the climate change issue. For example, the IPCC organised the development of internationally accepted methods for conducting national greenhouse gas emission inventories. Methane (CH4) A hydrocarbon that is a greenhouse gas with a global warming potential most recently estimated at 23 times that of carbon dioxide (CO2). Methane is produced through anaerobic (without oxygen) decomposition of waste in landfills, animal digestion, decomposition of animal wastes, production and distribution of natural gas and petroleum, coal production, and incomplete fossil fuel combustion. Mitigation A human intervention to reduce the sources or enhance the sinks of greenhouse gases. Mitigation of global warming Any actions to reduce or avoid greenhouse gas emissions (in order to avoid global warming). Natural Gas Underground deposits of gases consisting of 50% to 90% methane (CH4) and small amounts of heavier gaseous hydrocarbon compounds such as propane (C3H8) and butane (C4H10). Nitrogen Oxides (NOx) Gases consisting of one molecule of nitrogen and varying numbers of oxygen molecules. Nitrogen oxides are produced in the emissions of vehicle exhausts and from power stations. In the atmosphere, nitrogen oxides can contribute to formation of photochemical ozone (smog), can impair visibility, and have health consequences; they are thus considered pollutants. Nitrous Oxide (N2O) A powerful greenhouse gas with a global warming potential of 296 times that of carbon dioxide (CO2). Major sources of nitrous oxide include soil cultivation practices, especially the use of commercial and organic fertilisers, fossil fuel combustion, nitric acid production, and biomass burning. The GWP is from the IPCC's Third Assessment Report (TAR).

GLOSSARY OF TERMS
xx
SEAMEO
Glossary
Ozone (O3) Ozone, the triatomic form of oxygen (O3), is a gaseous atmospheric constituent. In the troposphere, it is created both naturally and by photochemical reactions involving gases resulting from human activities (photochemical smog). In high concentrations, tropospheric ozone can be harmful to a wide range of living organisms. Tropospheric ozone acts as a greenhouse gas. In the stratosphere, ozone is created by the interaction between solar ultraviolet radiation and molecular oxygen (O2). Stratospheric ozone plays a decisive role in the stratospheric radiative balance. Depletion of stratospheric ozone, due to chemical reactions that may be enhanced by climate change, results in an increased ground-level flux of ultraviolet (UV-) B radiation. Ozone Layer The layer of ozone that begins approximately 15 km above Earth and thins to an almost negligible amount at about 50 km, shields the Earth from harmful ultraviolet radiation from the sun. The highest natural concentration of ozone (approximately 10 parts per million by volume) occurs in the stratosphere at approximately 25 km above Earth. The stratospheric ozone concentration changes throughout the year as stratospheric circulation changes with the seasons. Natural events such as volcanoes and solar flares can produce changes in ozone concentration, but man-made changes are of the greatest concern. Photosynthesis The process by which plants take CO2 from the air (or bicarbonate in water) to build carbohydrates, releasing O2 in the process. There are several pathways of photosynthesis with different responses to atmospheric CO2 concentrations. Precipitation Rain, hail, mist, sleet, snow or any other moisture that falls to the Earth. Radiation Energy transfer in the form of electromagnetic waves or particles that release energy when absorbed by an object. Recycling Collecting and reprocessing a resource so it can be used again. An example is collecting aluminum cans, melting them down, and using the aluminum to make new cans or other aluminum products. Reforestation Planting of forests on lands that have previously contained forests but that have been converted to some other use. Solar Radiation Radiation emitted by the Sun. It is also referred to as short-wave radiation. Solar radiation has a distinctive range of wavelengths (spectrum) determined by the temperature of the Sun. Stratosphere Region of the atmosphere between the troposphere and mesosphere, having a lower boundary of approximately 8 km at the poles to 15 km at the equator and an upper boundary of approximately 50 km. Depending upon latitude and season, the
GLOSSARY OF TERMS
xxi
SEAMEO
Glossary
temperature in the lower stratosphere can increase, be isothermal, or even decrease with altitude, but the temperature in the upper stratosphere generally increases with height due to absorption of solar radiation by ozone. Stream flow The volume of water that moves over a designated point over a fixed period of time. It is often expressed as cubic feet per second (ft3/sec). Troposphere The lowest part of the atmosphere from the surface to about 10 km in altitude in mid-latitudes (ranging from 9 km in high latitudes to 16 km in the tropics on average) where clouds and "weather" phenomena occur. In the troposphere temperatures generally decrease with height. United Nations Framework Convention on Climate Change (UNFCCC) The Convention on Climate Change sets an overall framework for intergovernmental efforts to tackle the challenge posed by climate change. It recognises that the climate system is a shared resource whose stability can be affected by industrial and other emissions of carbon dioxide and other greenhouse gases. The Convention enjoys near universal membership, with 189 countries having ratified. Under the Convention, governments:
• gather and share information on greenhouse gas emissions, national policies and best practices
• launch national strategies for addressing greenhouse gas emissions and adapting to expected impacts, including the provision of financial and technological support to developing countries
• cooperate in preparing for adaptation to the impacts of climate change The Convention entered into force on 21 March 1994. Vulnerability It is the degree to which a system is susceptible to, or unable to cope with, adverse effects of climate change, including climate variability and extremes. Vulnerability is a function of the character, magnitude, and rate of climate change and variation to which a system is exposed, its sensitivity, and its adaptive capacity. Wastewater Water that has been used and contains dissolved or suspended waste materials. Water Vapour The most abundant greenhouse gas, it is the water present in the atmosphere in gaseous form. Water vapour is an important part of the natural greenhouse effect. While humans are not significantly increasing its concentration, it contributes to the enhanced greenhouse effect because the warming influence of greenhouse gases leads to a positive water vapour feedback. In addition to its role as a natural greenhouse gas, water vapour plays an important role in regulating the temperature of the planet because clouds form when excess water vapour in the atmosphere condenses to form ice and water droplets and precipitation.

GLOSSARY OF TERMS
xxii
SEAMEO
Glossary
Weather Atmospheric condition at any given time or place. It is measured in terms of for e.g., wind, temperature, humidity, atmospheric pressure, cloudiness, and precipitation. In most places, weather can change from hour-to-hour, day-to-day, and season-to-season. RESOURCES California Energy Commission, (2010). Energy Information Administration's Energy
Glossary. Retrieved on October, 25, 2010 from http://www.energy.ca.gov/glossary/
IPCC (2010). Third Assessment Report Working Group I: The Scientific Basis. Retrieved on October, 25, 2010 from http://www.ipcc.ch/ipccreports/tar/wg1/index.php?idp=518
IPCC (2010) Third Assessment Report Working Group II: Impacts, Adaptation and Vulnerability. Retrieved on October, 25, 2010 from http://www.epa.gov/climatechange/glossary.html
IPCC (2010) Third Assessment Report Working Group III: Mitigation. Retrieved on
October, 25, 2010 from http://www.epa.gov/climatechange/glossary.html
NASA, (2010). Earth Observatory library. Retrieved on October, 25, 2010 from http://earthobservatory.nasa.gov/Glossary/?mode=all
UNFCCC, (2010). Climate Change Glossary. Retrieved on October, 25, 2010 from
http://unfccc.int/resource/cd_roms/na1/ghg_inventories/english/8_glossary/Glossary.htm

2121
INTRODUCTION
[SEAMEO RECSAM]

INTRODUCTION
2
SEAMEO
Introduction
Once upon a Time, Earth was Healthy
A healthy earth ages ago had naturally existing greenhouse gases (GHGs), and warming the earth enough for its inhabitants to live comfortably. These naturally occurring gases trap the heat from the sun as its rays deliver the heat over 150 million kilometers away. Its rays enter our atmosphere and warm our planet. About one third of this solar energy is reflected back into the universe by shimmering glaciers, water and other bright surfaces. Two thirds, however, are absorbed by the Earth, thus warming lands, oceans, and atmosphere.
What are these gases? Water vapour, carbon dioxide (CO2), methane (CH4), hexafluoroethane (C2F6), carbon monoxide (CO), and nitrous oxide (N2O) are some examples of GHGs (ELC, n.d.). Without these naturally occurring gases, the earth will be too cold to live for humans, animals, and plants (Figure 1).
Figure 1 The Greenhouse Effect Source: U.S EPA (n.d.) Earth Having Fever?
A healthy human body records a temperature of 36.50 Celsius. An increase in body temperature of one degree or more leaves the body feeling feverish or cold. The earth too is experiencing fever as it either becomes so hot in some parts, or so cold in other parts.
What makes the earth feverish? While there are naturally existing GHGs, there are also those which are derived from human activities. This means that the sun's heat is being trapped and stays inside the GHGs and cannot anymore reflect back to the

INTRODUCTION
3
SEAMEO
Introduction
outer spaces, thus increasing the Earth’s temperature. When too much heat is being trapped, the planet gets warm (in some parts) or cold (in other parts) beyond its natural capacity and this leads to what we call Global Climate Change.
Making More Money
Buying and selling are key words that fuel the economy. However, before you can buy anything, somebody has to produce something to sell. Human societies, through the years, have moved from household consumption to commercial production patterns which heavily extract from earth’s resources.
Due of this, people have used more litres of petrol, diesel fuel, oil to fly planes, run factories and related machines (this is burning fossil fuels: coal, natural gas, oil, and petrol) to complete the cycle of producing and selling things in large quantities.
The processes in producing goods and selling goods and running machines as shown in Figure 2 have indeed increased carbon dioxide and other GHGs, like methane and make the earth hotter each day (U.S. EPA, n.d.).
Figure 2 Carbon Emitting Industry Source: FotoSearch (n.d.) Power, land use, transport, and agriculture—they all contribute to GHG emissions. Figure 3 shows how much each sector contributes GHGs in 2000 by source (Chevalier, 2009).

INTRODUCTION
4
SEAMEO
Introduction
Figure 3 Greenhouse Gas Emissions in 2000 by source
What energy sources do we have?
Southeast Asian countries use fossil fuels, and a mix of oil, natural gas and coal. In 2007, this energy mix collectively accounted for 73% of total demand. Biomass and waste resources, such as wood and agricultural residues, also represent important sources of energy and met 23% of demand in 2007. Within the same period, carbon dioxide (CO2) emissions increased sharply as countries switched from biomass to fossil fuels. Table 1 shows the energy sector for ASEAN countries (IEA, 2009).
According to some country leaders, the future of our energy supply is not good. If we do not reduce the energy we use daily, in the coming years, our energy supply will fail and our environment will experience a lot of disasters (IEA, 2006).
Are We in Serious Trouble? How?
What would you do if one day you wake up surrounded with flood waters and the water keeps on rising?
If you live in Southeast Asia, your country may be in trouble or may be vulnerable. Accelerated climate change brings in floods, fire risks, typhoon, tropical storms, and landslides, and aggressive vector-borne diseases that infect humans, animals, and crops.

INTRODUCTION
5
SEAMEO
Introduction
Overview Brunei Darussalam
Oil and gas have been the backbone of the economy since their discovery in 1929. Today, it is the third-largest oil producer in ASEAN and ninth-largest Liquefied Natural Gas (LNG) exporter in the world. Diversifying the economy to reduce reliance on oil and gas export earnings is a key priority.
Cambodia Energy infrastructure remains damaged by decades of civil war. Increasing the rate of electrification is one of the main priorities. Exploitation of offshore oil and gas resources discovered in 2005 could jump-start economic development.
Indonesia The world’s fourth most-populous country, it is the world’s leading steam coal exporter, third-largest LNG exporter, and until 2004, a net exporter of oil. Increasing energy investment will be essential for its economic development.
Laos It has significant hydropower potential and export of hydroelectricity is one of the main sources of export earnings. As access to modern energy services remains limited, rural electrification is one of the major priorities.
Malaysia It heavily depends on fossil fuels. It has significant oil and gas resources and is the world’s second-largest exporter of LNG. A key challenge will be to diversify the power-generation mix to meet the increase in demand for electricity.
Myanmar The bulk of the population lives in rural areas and depends heavily on traditional energy, such as fuel wood, charcoal and biomass. Rural electrification is a priority, as is the development of the country’s hydropower resources and offshore gas deposits, which could play a key role in fostering economic development.
Philippines Its reliance on imported energy is high and it faces serious challenges in attracting investment to overcome electricity shortages. It is pushing to reduce imports by developing renewable, including geothermal – of which it is already the world’s second-largest producer.
Singapore It is the world’s third-largest oil trading and refining hub. Due to its small size and low energy resource endowments, it is heavily dependent on imported energy and is currently constructing an LNG import terminal to improve diversity of supply.
Thailand It is the second-largest energy consumer in ASEAN and is heavily dependent on imports- particularly oil but also natural gas, coal and electricity. A key challenge will be to meet growing demand for electricity, including through expanding imports, while diversifying the generation mix.
Vietnam It is rich in coal, oil and hydropower and has been a net energy exporter since 1990. Domestic energy demand is growing rapidly and reliance on traditional biomass remains high in rural areas. The government is currently pursuing policies to increase rural electrification and the use of renewable energy.
Table 1 Energy Sector Overview for ASEAN by Country Source: IEA (2009)

INTRODUCTION
6
SEAMEO
Introduction
Figure 4 Climate Change Vulnerability Map of Southeast Asia Source: Yusuf and Francisco (2009) If we look at Figure 4, it shows how vulnerable each country is to climate change. In the map, seven countries are most vulnerable or the least able to cope with the destructive impact of climate change. The Philippines, the Mekong River Delta region of Vietnam; almost all the regions of Cambodia; North and East Lao PDR; the Bangkok region of Thailand; the west and south of Sumatra, and western and eastern Java in Indonesia are countries that are vulnerable (Yusuf and Francisco, 2009). The Philippines, unlike other countries in Southeast Asia, is not only exposed to tropical cyclones, especially in the northern and eastern parts of the country, but also to many other climate-related hazards like floods (such as in central Luzon and Southern Mindanao), landslides (due to the terrain of the country), and droughts. In Malaysia, the most vulnerable regions are the states of Kelantan and Sabah. Cambodia, however, becomes highly vulnerable since it is sharing borders with the Mekong River Delta in northern Vietnam which is susceptible to flooding and sea level rise.
INTRODUCTION
7
SEAMEO
Introduction
Drought and Flooding, a Water Seesaw
Drought and flooding are like two persons, each sitting at either end of a seesaw, and their weights move their ends of the board up and down causing the other end of the board to move. Like a seesaw, some countries experience drought, while others, flooding.
In both cases, water, a basic resource is affected. Where there is drought, plants die. Likewise, so much water also drowns the plants. In the end, we will have no harvest for rice, corn, vegetables, and many others. No harvest means no food on the table. Our farmers, housewives, and all our communities, regardless of which part of Southeast Asia we come from, will have a real problem, if water supply is badly affected.
We get sick too
Warmer climate and rainfall combined provide a conducive surrounding for mosquitoes carrying malaria to breed much faster. In addition to scientific explanations, there are many related factors creating conditions for an increase in malaria and other diseases.
Operation Rescue!
Operation rescue of earth takes two faces: mitigate and adapt. To mitigate means to reduce carbon dioxide and other GHG emissions. Why do we mitigate? We mitigate because we want to rescue earth from further self destruction. If earth is overheated, we lose our home, and we end up being destroyed as well.
How do we mitigate or reduce carbon dioxide in the environment? A common practice is to reduce the “amount of Earth’s resources that we use.” We can reuse (Reduce Reuse Recyle, n.d.) by not storing our things and giving them to others who can still make use of them, or earn from them by having a garage sale. We can recycle by making old materials into new useful ones. For example, you can use old glasses and jars to store many small stuff or turn them into pretty vases.
How about adapting? How do we adapt? Each country has what we call an “adaptive capacity.” Adaptive capacity simply means our ability to cope with or respond to the damages of climate change (IPCC, 2001). Do we have the technology or enough money to build strong houses, roads, and bridges that are able to stand firm during floods and storms?
Figure 5 shows the Adaptive Capacity Index of the different countries in Southeast Asia. The map reveals that Lao PDR and Cambodia have very low adaptive capacity index while Thailand, Malaysia and Vietnam have relatively high adaptive capacity indices.

INTRODUCTION
8
SEAMEO
Introduction
Figure 5 Adaptive Capacity Map of Southeast Asia Source: Yusuf & Francisco (2009) We increase our adaptive capacity if we have the right education, enough income, technical skills, disaster preparedness and management; and health care systems, especially when we need to relocate communities affected by storms, flooding, sea-level rise and many others.
Best of all, we can increase our adaptive capacity by educating our young people and the rest of the public on how to prepare for upcoming disasters.
What is our Response?
We, the SEAMEO community, being one of the movers of education in Southeast Asia, take this initiative to develop a Guidebook for Teachers. This guidebook, designed for teachers, aims to facilitate learning on climate change in classrooms and engage students through the exemplars given.
Eight chapters that reflect and elaborate concepts on climate change and its accompanying negative impacts and effects on all forms of life are presented in the concept map (Refer to Appendix on last page of book).
Chapters 1 to 4, respectively, present the natural resources and how climate change affects them. Security in terms of biodiversity, freshwater, sea water, and energy is the keyword for sustainability both for the environment and for the people.

INTRODUCTION
9
SEAMEO
Introduction
Chapters 5 to 8 look at human-based needs being shaped and/or affected by climate change. The connection between climate change and food security is discussed in Chapter 5. This Chapter explains that as the temperature increases, the frequency and intensity of severe-weather events around the world also increase. Droughts, flooding, tropical cyclones have greatly reduced production of crops, fish, and forest harvests; thus, our food security is threatened.
Not only are food resources reduced by these extreme weather events, they also impact on the health and nutrition of people where mostly, the poor ones are greatly affected. Chapter 6 discusses how climate change increases mortality in terms of the resulting heat- and cold-related illnesses and death, as well as, the widening range of resistance of infective vectors which carry bacteria, viruses, and parasites.
These weather events are indeed making the poor, much poorer.
Climate change not only affects food resources and good health, but also has an impact on our land, trees, rivers, coastlines, fishes, and many others. The loss of resources causes poverty. The connection between climate change and poverty is discussed in Chapter 7. This Chapter explains that extreme weather events causing loss of lives, properties, farms, etc., severely damage the resources of the poor and are indeed making them much poorer.
As the tension of having very little or badly damaged resources increases, competition over these resources grows more intense. And as people grow in number, they would end up competing or fighting over resources that are getting fewer. This competition over resources could lead to ‘Conflict’ and discussed in Chapter 8. The book ends up with a brief Conclusion that gives some key issues of climate change and what we can do about it.
“As the world becomes increasingly interdependent and fragile, we must recognise that in the midst of diversity of cultures and life forms we are one Earth community with a common destiny. We must join together to bring forth a sustainable global society founded on respect for nature, universal human rights and a culture of peace”. (Ikeda, 2002, pp. 2)

INTRODUCTION
10
SEAMEO
Introduction
We must also not forget that each and everyone must be responsible for whatever happens to Mother Earth. The three quotes below should also be constantly used to remind everyone of that responsibility.
“The earth, water and the air are not a gift from our parents, but a loan from our children that we must pay back”. – An old Indian saying
“We cannot command Nature except by obeying her”. – Francis Bacon (1561-1626)
“Only when the last tree has died, the last river has been poisoned and the last fish has been caught, will we realise that we cannot eat money”. – Cree Proverb
INTRODUCTION
11
SEAMEO
Introduction
REFERENCES
Barnett, J., Dessai, S., & Jones, R. (2003). Climate change in Timor Leste: Science impacts, policy and planning. A briefing report to government, civil society, and donors in Timor Leste. Retrieved on 26 October 2010 from http://geography.exeter. ac.uk/SurajeDessai/TimorReport.pdf
Chevalier, J. M. (2009). The new energy crisis: Climate, economics and geopolitics.
Basingstoke: Palgrave Macmillan. ELC (Environmental Literacy Council). (n.d.). Greenhouse gases. Retrieved on 26
October 2010 from http://www.enviroliteracy.org/article.php/428.html FotoSearch (n.d.). Stock photo-Factory at sunset. Retrieved on 26 October 2010
from http://www.fotosearch.com/UNU002/u10307194/ IEA (International Energy Agency). (2006). World energy outlook 2006. Paris:
OECD/IEA. IEA (International Energy Agency). (2009). World energy outlook 2009. Paris:
OECD/IEA. Ikeda, D. (2002). Seeds of change: A proposal on education for a sustainable future.
Tokyo, Japan: Soka Gakkai International. IPCC Working Group II (2001). Summary for policymakers - Climate change 2001:
Impacts, adaptation, and vulnerability. A summary report of Working Group II of the Intergovernmental Panel on Climate Change. approved in detail at the Sixth Session of IPCC Working Group II held in Geneva, Switzerland from 13-16 February 2001. Retrieved from http://www.ipcc.ch/pdf/climate-changes-2001/synthesis-syr/english/ wg2-summary-policymakers.pdf
Reduce Reuse Recyle. (n.d.). Reduce reuse recyle-Your green guide. Retrieved from
http://www.reducereuserecycle.co.uk/ The Free Dictionary. (n.d.). Biomass. Retrieved on 26 October 2010 from http://www.
thefreedictionary.com/biomass U.S. EPA (United States Environmental Protection Agency). (n.d.). Climate change-
science. Retrieved on 26 October 2010 from http://www.epa.gov/climatechange/ science/index.html
Yusuf, A. A., & Francisco. H. (2009) Climate change vulnerability mapping for
Southeast Asia. Singapore: EEPSEA (Economy and Environment Program for Southeast Asia). Retrieved on 27 October 2010 from http://www.idrc.ca/uploads/user-S/12483270391Mapping_Reportv02.pdf

CHAPTER I:
Impact of Climate
Change on
BIODIVERSITY and
ECOSYSTEM
[SEAMEO BIOTROP and SEAMEO RECSAM]

IMPACT OF CLIMATE CHANGE ON BIODIVERSITY AND ECOSYSTEM
13
SEAMEO
Chapter I
The Ecosystem
An ecosystem is an interdependent, functioning system of plants, animals and
microorganisms (Figure 1.1). The Intergovernmental Panel on Climate Change
(IPCC, 2002) defines ecosystem as a system of dynamic and interacting living
organisms (plant fungus, animal, and microorganism) together with their physical
environment.
Figure 1.1 A marine ecosystem (1st photo) and terrestrial ecosystem (2nd photo)
Source: SEAMEO RECSAM (2010)
Figure 1.1 shows an example of two types of ecosystem: a marine (ocean) and a
terrestrial (land) ecosystem. If you look at the two photos, you can see various
organisms. This variety of organisms and their various roles, we call biodiversity, is
very important to make an ecosystem function well. Let’s use the photo on marine
ecosystem to explain what we mean by biodiversity.

IMPACT OF CLIMATE CHANGE ON BIODIVERSITY AND ECOSYSTEM
14
SEAMEO
Chapter I
Marine ecosystem. The plants underwater are called phytoplankton (producers).
They are very small and cannot be seen by the naked eye. As plants, they use
carbon dioxide during photosynthesis and provide food and oxygen to all the
consumers, like the zooplankton (tiny shrimp, eggs of sea animals, baby sea animals
or primary consumers; Gjerde, 2006).
The zooplankton is eaten by fishes (secondary consumers); and turtles (tertiary
consumers) feed on fishes. When they defecate or they die, there is another set of
organisms; we call them the decomposers (microorganisms) or the army of bacteria
and fungi.
We can also call them nature’s recyclers because as they eat the dead bodies for
their energy, they recycle the nutrients coming from the consumers back to the soil
which in turn is taken in by the roots of the plants to make them grow and produce
food and oxygen. Without them, earth will be covered with lots of dead bodies which
are still intact. All life forms would not survive without the support of other organisms
within their own ecosystem (Lyons, Dunworth, Tilbury & Johnston, 2010).
Functions of Biodiversity and Ecosystem
Biodiversity makes the earth liveable. The photos that we explained earlier showcase
what biodiversity is: the variety of organisms, their genetic make-up, and their
respective roles in the
communities where they live
(Thompson, 2007).
Because of biodiversity, we
have air (a product of
photosynthesis by green
plants) to breathe.
Insects, worms, bacteria, and
other tiny organisms break
down wastes and aid in
decomposing dead plants and
animals to enrich the soils.
Figure 1.2 Biodiversity
More than 90% of our food is produced from 80 plant species and almost 30% of our
medicines come from plants and animals (Thompson, 2007).
The United Nations Convention on Biological Diversity (UNCBD) defines
biodiversity as the variability among living organisms from all sources like land,
marine, and other aquatic ecosystems and the ecological complexes of which they
are part of. Like a washing machine that has various parts to make it function well,

IMPACT OF CLIMATE CHANGE ON BIODIVERSITY AND ECOSYSTEM
15
SEAMEO
Chapter I
biodiversity too makes the earth function smoothly. The diversity of genes, species
and ecosystems make us survive on planet earth (UNCBD, 2002).
Ecosystems make humans survive. We depend on ecosystems for the natural,
cultural, spiritual, recreational and aesthetic resources they provide. Ecosystem
services are the ecosystem processes or functions that have value to individuals or
society. The Millennium Ecosystem Assessment (MEA, 2005) describes five major
categories of ecosystem services as shown in Figure 1.3 below:
1) provisioning, such as the production of food and water;
2) regulating, such as the control of climate and disease;
3) supporting, such as nutrient cycles and crop pollination;
4) cultural, such as spiritual and recreational benefits; and
5) preserving, such as the maintenance of diversity.
Figure 1.3 Diagram of Ecosystem Services Source: MEA (2005)
How does Climate Change Affect Biodiversity and Ecosystem?
Biodiversity loss. The life of plants, animals, and microorganisms is affected by
climate factors. When the climate is drastically altered, the ability of plants and
animals to live, produce, and adapt to their environment is disrupted. Those
organisms with very narrow tolerance to climate changes disappear. We call this as
biodiversity loss.

IMPACT OF CLIMATE CHANGE ON BIODIVERSITY AND ECOSYSTEM
16
SEAMEO
Chapter I
The higher the number of plants and animals being lost because of drastic changes
in climate, the higher the threat to human security. Many plants in the forest have
been reported to have high medicinal values which are endangered because they
may not be able to cope with extreme low or high temperatures, flooding and drought
which have lately become unpredictable.
Climate controls the vegetation structure, productivity, and plant and animal species
composition. Many plants can successfully reproduce and grow only within a specific
range of temperatures and respond to specific amounts and seasonal patterns of
rainfall. They may be displaced by competition from other plants or may fail to survive
if climate changes. Animals also have distinct temperature and/or precipitation
ranges and are also dependent on the ongoing persistence of their food species. For
example, one or two degree temperature increase will push the fish to migrate to
cooler waters, if not, will cause them to die.
Over the course of history, ecosystems have always had to adapt to changing
climatic conditions. The current rate of climate change, however, is higher than that
recorded in the past years. According to IPCC (2007), scientists have observed
evidences that the composition of the atmosphere is changing, such as the earth’s
climate.
The increasing atmospheric
concentrations of greenhouse gases from
fossil fuel burning, as shown in Figure
1.5, have increased Earth’s temperature
which caused extreme climatic events
including heat waves, heavy precipitation,
and droughts. The IPCC states that the
recent observed rate of warming, an
increase of 0.6°C in average annual
temperature during the 20th century, is
faster than those temperatures recorded
at any other time in the past 1000 years
(Houghton, Ding, Griggs, Noguer, van der
Linden, Dai, Maskell & Johnson, 2001).
Figure 1.5 Carbon emitting industry Source: Wikipedia (2010) Many regions across the world have already been affected by changes in climate.
Specifically, the growth and behaviour of plants and animals, their population and
age structure have shown some changes. Climate change also directly affects the
ecosystem structure and function (e.g. decomposition, nutrient cycling, water flows,
and species composition and interactions). Seasonal patterns like hot and rainy

IMPACT OF CLIMATE CHANGE ON BIODIVERSITY AND ECOSYSTEM
17
SEAMEO
Chapter I
seasons used to be very definite in the past. Now, we cannot anymore determine
whether our coming days would be very hot or very wet.
Because of the change in seasonal patterns, the ecosystem structure and function,
and the biodiversity of earth are also affected. Climate change alters directly all living
organisms, their populations and species, and their reproduction, fecundity,
establishment, and dispersal (Gayton, 2008).
Phenology such as flowering, breeding, and migration, growth rates, and mortality;
length of growing or their biologically active season; geographic distribution,
population size, and response to disturbance are all influenced by climate change.
Simply stated, species can respond to altered climate in four different ways: they can
adapt to the new conditions, evolve, migrate to areas of more suitable climate, or go
extinct (Gitay, Brown, Easterling & Jallow, 2001).
Species most vulnerable to extinction will be those with small populations, slow rates
of dispersal, restrictive elevation, climate requirements, and/or those whose habitat is
limited or occurs in patches.
Migratory species face particular extinction risk, since they require multiple habitats in
a particular seasonal order; thus, increasing the probability of climate change-
induced disruption of their habitat requirements. Also at risk are endemics, or species
with narrow elevational ranges, and species with limited dispersal ability or those with
long reproductive cycles (Dunlop & Howden, 2001; Hannah, Lovejoy & Schneider,
2005).
In summary, climate change is likely to induce the following:
Large-scale biome, ecosystem, and species shifts;
A breakdown and re-sorting of current plant communities and ecosystems;
A general expansion of species ranges northwards and upslope (note that for
alpine and boreal species, this will mean range contractions);
Loss of ecosystems, including some wetland and alpine areas;
Changes in habitat quality and availability;
Changes in synchrony between species — for example, the timing of
predator/prey or flower/ pollinator interaction;
Differential range shifting—for example, when a pollinator insect experiences
a range expansion but its host plant does not.
Examples of the urban impacts of such species changes are:
Loss of trees in streets, gardens and parks, as changing temperatures add
stress and reduce their resilience to pests and diseases;

IMPACT OF CLIMATE CHANGE ON BIODIVERSITY AND ECOSYSTEM
18
SEAMEO
Chapter I
Loss of species and damage of (municipal) forests, reducing economic gains
as well as recreational values;
Risk of collapsing waste water treatment systems as micro-organisms are
vulnerable to temperature differences;
Damages to flora and fauna through the immigrating of (alien) species;
Risks to human health through the immigration of disease carrying insects
such as mosquitoes.
Biodiversity and What Can Countries Do?
There are many ways that countries can slow down loss of biodiversity. The following
tips are recommended by the Global Change Project (2010):
1. Create protected areas. For example, establish Ecological Parks where trees
and wildlife are preserved, and people’s entry to cut trees are prevented.
Countries can also designate marine protected sanctuaries to nurture baby
fishes and protect overfishing activities.
2. Create policies that will prevent entry of foreign plants and animals. Many
times, introduced species can disturb the natural growth and reproduction of
endemic plants and animals because they have the tendency to grow,
multiply, and eat up food resources much faster than the naturally existing
species.
3. Inform, communicate, and educate all people, young and old alike, on the
importance of biodiversity, and what people can do to prevent loss of
biodiversity.
Biodiversity and What You Can Do?
Biodiversity is threatened by the combined actions of our society by just going about
our day-to-day business. Here are ten simple things that will help reduce your own
environmental impact, and thereby your adverse impact on biodiversity. Many of
them help in multiple ways (Hooper, 2009).
Habitat
1. Reduce use of pesticides and fertilisers in the farmland and backyard gardens.
These often contaminate adjacent lakes and streams with adverse effects for
the plants and animals living there.
2. Get involved with ecological restoration in your area. Most areas have groups
active in restoration. By volunteering, you can help restore habitat for native
species and eliminate invasive species, all the while learning something about
your local plants and animals and getting active out in the fresh air.

IMPACT OF CLIMATE CHANGE ON BIODIVERSITY AND ECOSYSTEM
19
SEAMEO
Chapter I
Waste stream
3. Reduce, reuse, and recycle, with an emphasis on the first one. The more you
can each reduce your demand for new resources, the less habitat conversion
will be necessary to get those resources or the energy to make the products
you demand, and the less waste goes into the landfill.
4. Composting both reduces the overall waste stream and thereby the need for
landfill space, and it provides natural slow-release fertiliser for your flower or
vegetable garden.
5. Use environmentally friendly products for cleaning. This reduces chemical
contamination of habitats both during manufacturing and when those
chemicals go down the drain.
Food choices
6. Buy organic foods. This helps reduce inputs of fertilisers and pesticides into
the environment, which in turn reduces negative impacts on nearby beneficial
insects (for pollination and pest control) and adjacent aquatic biodiversity.
Organic foods are increasingly available, even in regular supermarkets. Your
favourite place to shop doesn’t offer any? Start requesting it!
7. Buy sustainably harvested seafood. Many seafood, though delicious, are not
harvested sustainably–either for the individual species itself or for those
species that are unlucky enough to be ensnared as ―by catch‖. Some trawlers
destroy extensive seafloor habitat in the process of catching fish; many shrimp
farms destroy mangrove forests which serve as nurseries for wild fish species.
Energy use - By reducing your energy demand, you reduce both carbon dioxide
release into the atmosphere, which contributes to global warming, and the need to
disturb habitat for fossil fuel prospecting and extraction. Save energy and save
something for the future.
8. Aim for energy conservation in your home. Home energy audits are often
available from your local power companies. They know that it’s more
economical to conserve than having to build new power plants. Check out
some energy conservation websites in Southeast Asia;
(i) http://www.monstersandcritics.com/lifestyle/life/news/article_1521312.
php/Singapore-experiments-with-energy-saving-home-for-the-tropics.
(ii) http://www.edalight.net/
9. Reduce single-person car use. Each litre of petrol burned, releases 2.7
kilograms of the greenhouse gas CO2. Car pooling, public transport, walking,
and bicycling are often options. If you need to drive, look into the growing

IMPACT OF CLIMATE CHANGE ON BIODIVERSITY AND ECOSYSTEM
20
SEAMEO
Chapter I
number of fuel efficient vehicles, either gas efficient or turbo diesel (tdi)
models. If you use 100% biodiesel, you can even make your driving ―carbon
neutral‖ – no more CO2 released into the atmosphere from your vehicle than
was taken up by photosynthesis by the plants used to make your fuel.
10. Incorporate renewable energy and/or energy efficiency into your next home.
Thinking about building a new home or remodelling? With some careful
thought about your region, your site, and your needs, you can drastically
reduce your own energy consumption and still have a beautiful, comfortable
home. While you are at it, think about some of the many alternative building
and ―green landscaping‖ materials out there. See some web sites in
Southeast Asia with recent article on Designing a "Green" Building.
(i) http://asia.cnet.com/crave/2009/10/27/singapore-showcases-its-first-zero-
energy-building/
(ii) http://www.mgbc.org.my/aboutus.htm

IMPACT OF CLIMATE CHANGE ON BIODIVERSITY AND ECOSYSTEM
21
SEAMEO
Chapter I
REFERENCES
Dunlop, M. & Howden, M. (2001). Chapter 6. Policy discussion. In Climate change impacts on biodiversity in Australia: Outcomes of a workshop sponsored by the Biological Diversity Advisory Committee, 1–2 October, 2002. M. Howden, L. Hughes, M. Dunlop, I. Zethoven, D. Hilbert, and C.Chilcott (editors). csiro Sustainable Ecosystems, Cranberra, Australia. Available: http://www.environment.gov.au/biodiversity/publications/greenhouse/pubs/ greenhouse.pdf
Gayton, D.V. (2008). Impacts of climate change on British Columbia’s biodiversity: A
literature review. Extended Abstract. BC Journal of Ecosystems and Management 9(2):26–30.
Gitay, H., Brown, S., Easterling, W. & Jallow, B. (editors) (2001). Ecosystems and
their goods and services. In Climate change 2001: Impacts, adaptation, and vulnerability. McCarthy, J., O. Canziani, N. Leary, D. Dokken, and K. White (editors).Contribution of Working Group ii to the Third Assessment Report of the Intergovernmental Panel on Climate Change. Cambridge University Press, UK.
Available: http://www.grida.no/climate/ipcc_tar/wg2/pdf/wg2TARchap5.pdf Gjerde, K. M. (2006). Ecosystems and Biodiversity in Deep Waters and High Seas.
UNEP Regional Seas Report and Studies No. 178. UNEP-Regional Seas-WCPN-IUCN. Available: www.unep.org/pdf/EcosystemBiodiversity_DeepWaters_20060616.pdf (Retrieved on 24 Oct 2010)
Global Change Project, (2010).Paleontological Research and its Museum of the
Earth, 2010. Available; http://www.priweb.org/globalchange/bioloss/bl_06.html (Retrieved on 25 Oct 2010)
Hannah, L., Lovejoy, T. E., & Schneider, S. H. (2005). Biodiversity and climate
change in context. In Climate change and biodiversity. T. E. Lovejoy and L. Hannah (editors). Yale University Press, New Haven, CT.
Hooper, D. (2009). Ten Thing you Can Do to Help Biodiversity, Dept. of Biology;
Washington University. Available: http://ecocitizen.tatasteel.com/eco-
management/pdf/bio-diversity.pdf (Retrieved on 24 Oct 2010)
Houghton, J. T., Ding, Y., Griggs, D., Noguer, M., van der Linden, P.J., Dai, X.,
Maskell, K. & Johnson, C.A., [editors]. (2001). Climate Change 2001. The science of climate change. Cambridge University Press, Cambridge.
IPCC. (2007). Climate Change 2007: Impact, Adaptation and Vulnerability.
Contribution of Working Group II to the Fourth Assessment Report of the Intergovernmental Panel on Climate Change. Parry, ML, OF Canziani, JP
Palutikof, PJ van der Linden and CE Hanson (eds.). Cambridge University Press,
Cambridge, United Kingdom, 1000 pp. Retrieved on 24 Oct 2010 from www.ipcc-wg2.org/index.html

IMPACT OF CLIMATE CHANGE ON BIODIVERSITY AND ECOSYSTEM
22
SEAMEO
Chapter I
Lyons, D.J., Dunworth, P.M., Tilbury, D. W. & Johnston, L. (2010). Decomposition.
Available: http://www.countrysideinfo.co.uk/decompos.htm (Retrieved on 25 Oct 2010).
MEA. (2005). Millennium Ecosystem Assessment Synthesis Report. Available:
www.millenniumassessment.org/documents/bridging/bridging.04.pdf Thompson, S.A. (2007). What is biodiversity. Available:
http://www.pabiodiversity.org/whatisbiodiversity.html (Retrieved on 20 Oct 2010)
UNCBD. (2002). Climate Change and Biodiversity. Response of Working Group II to the UN-CBD. Gitay, H, A Suarez, RT Watson, and DJ Dokken (eds.). IPCC.
SEAMEO RECSAM, 2010. Impact of Climate Change on Biodiversity and
Ecosystem, Integrating Climate Change Issues in Southeast Asian Schools: A
Teachers’ Guidebook 2010.
Wikipedia Free Encyclopedia, 2010. Industrial smoke.Industry smoke.jpg. Available;
http://en.wikipedia.org/wiki/File:Industry_smoke.jpg
(Retrieved on 25 Oct 2010)
IMPACT OF CLIMATE CHANGE ON BIODIVERSITY AND ECOSYSTEM
23
SEAMEO
Chapter I
Lesson 1
CLIMATE CHANGE, A MIXED BLESSING
(Effects of Climate Change on the Interdependence of Living Things)
GRADE LEVEL: High School
SUBJECT: Biology
TOPIC: Life Energy, Photosynthesis and Respiration
PREREQUISITES
Students should have prior knowledge about the nature and requirements of
photosynthesis and cellular respiration.
Prior to this lesson, ask the students to conduct a research on the positive
and negative effects of high concentration of CO2 in the atmosphere on living
things.
DURATION: 2 sessions
LEARNING OBJECTIVES
Subject Matter Objectives: At the end of this lesson, the students should be able to:
explain the relationship between the processes of photosynthesis and
respiration;
explain the equation showing the opposite reaction in the photosynthesis and
respiration processes; and
cite the importance of interdependence of living things based on the oxygen-
carbon dioxide cycle.
Climate Change Objectives:
explain the factors (e.g., CO2, light intensity and temperature ) which can be
attributed to climate change that affect the photosynthesis process;
discuss what will happen to plants and its dependents when photosynthesis
rapidly increases; and
identify ways to mitigate the effects of climate change on biodiversity and
ecosystem.
MAIN CONCEPTS AND SKILLS
The production of food from carbon dioxide and water in the presence of
chlorophyll utilising light energy and releasing oxygen is called photosynthesis.
Plants produce food in the form of simple sugars (carbohydrate). In order for
photosynthesis to occur, sunlight and chlorophyll must be present. The chemical

IMPACT OF CLIMATE CHANGE ON BIODIVERSITY AND ECOSYSTEM
24
SEAMEO
Chapter I
reaction involved in photosynthesis is: 6CO2 + 6H2O (+ light energy) C6H12O6 +
6O2. This is the source of oxygen (O2) that human and animals breathe.
Photosynthesis and respiration are reversible chemical reactions, meaning that
the products of one process are the exact reactants for the opposite process.
Both are processes that involve electron transport chains and affect the
concentrations of carbon dioxide and oxygen in the atmosphere. They are the
main source of energy in all living things and hence provide power for different
cellular activities.
Below are the photosynthesis and respiration equations. The products from
respiration, six carbon dioxide molecules and six water molecules are the exact
reactants and the correct number of molecules to start the photosynthesis
equation. This clearly demonstrates the balance of life on earth and the
interdependence of all life on other organisms.
36 ADP
+ 36 Pi 36 ATP
C6H12O6 + 6O2 6CO2 + 6H2O
Glucose + Oxygen Carbon dioxide + Water
Equation 1) Cellular Respiration
6CO2 + 12 H2O + Light energy C6H12O6 + 6H2O + 6O2
Equation 2) Photosynthesis
The increase in atmospheric CO2 levels resulting from fossil fuel
combustion has a fertilizing effect on most plants since CO2 is needed for
photosynthesis (the biochemical mechanism of plant growth).
Photosynthesis converts carbon dioxide and water into the simple sugar
(glucose) and emits oxygen, making it possible for animals to live on
Earth. Sunlight is the energy that powers this reaction.
Extreme heat and extreme cold temperatures are not suitable for the
photosynthesis process, because the photosynthetic reactions are
controlled by the enzyme activity. Very high temperatures lead to
denatured enzymes, which in turn leads to lowering of the rate of
photosynthesis. The ideal temperature for enzyme activity ranges from
IMPACT OF CLIMATE CHANGE ON BIODIVERSITY AND ECOSYSTEM
25
SEAMEO
Chapter I
25oC to 35oC. Enzymes play an important role, as it is required in both
stages of photosynthesis.
If the concentration of CO2 increases, the rate at which sugars are made
by the light-independent reactions will also increase. The enzyme has a
binding affinity for both CO2 and oxygen in the presence of light in
independent reactions. If the concentration of CO2 is high, the enzyme
has greater affinity to bind with CO2, but if the CO2 concentration is low, it
will bind/fix oxygen instead. This phenomenon, called photorespiration,
uses energy but does not make sugars.
However, very high concentrations of CO2 could be toxic to the plants.
Generally, the increase in CO2 concentration will make crops more
productive, but the quality of the crops may be degraded.
MATERIALS NEEDED
Oxygen-Carbon Dioxide Cycle Chart
Elodea or other aquatic plant that does not have needle-like leaves
Light source
Bromothymol blue and drinking straws
Five 25 ml graduated cylinders and rubber stoppers
Flip charts and marker pens for presentation
PRESENTATION OF LESSON
Scenario
The teacher will show this phrase to the class “Climate Change: a Mixed
Blessing” and will ask for the students to give their reactions and comments
on this phrase. Based on their prior research activity, ask the students to
identify the positive and negative effects of climate change particularly on the
high concentration of carbon dioxide in the atmosphere and its impact on
living things.
Ask the following guide questions:
1. Why do you say that ―Climate Change is a Mixed Blessing‖?
2. What are the positive effects of having a high concentration of CO2 in the
atmosphere on plants?
3. What are the negative effects of having a high concentration of CO2 in the
atmosphere on plants?
4. What is the effect of high concentration of CO2 in the atmosphere on the
rate of photosynthesis?

IMPACT OF CLIMATE CHANGE ON BIODIVERSITY AND ECOSYSTEM
26
SEAMEO
Chapter I
Student Activities
The students will demonstrate how photosynthesis and respiration work
through a simple experiment. They will carefully read and follow the
procedure based on the given Student Worksheet. Working together in
groups, they will analyse the relationship between the processes of
photosynthesis and respiration.
Process Guide for Teachers
1. After the brief discussion about the issue of ―climate change and its mixed
blessing‖ particularly on plants, conduct a short review about the nature and
requirements of photosynthesis and respiration.
2. Prepare the class for the group activity. Divide the class into working groups
and distribute the required materials and activity sheets. Brief the students
about the proper handling of chemicals as a precaution. For this activity,
students will use Bromothymol blue (BTB) as an indicator. This is a substance
that changes colour as the pH of a solution changes. BTB stains hands and
clothes hence, you must instruct the students to wear goggles and to follow
the safety precautions when using the BTB solution.
3. The reactions for Step No. 5 as prescribed in the Student Worksheet
(Attachment 1.1.1) will take place for twenty four (24) hours. Hence, ensure
that you have prepared a ready set-up prior to this lesson activity so that the
students can already make an observation during the activity.
4. Move from one group to another and observe how the students perform the
experiment. Use a performance rubric to assess the level participation of
each group in this activity.
5. After the laboratory work, instruct each group to prepare for a plenary
presentation. Ask two to three representatives from each group to present the
results of their investigation. At the end of all the presentations, discuss the
chemical equations for both processes of photosynthesis and respiration.
6. Conduct a reflection of the students’ learning experiences using the following
guide questions;
a. Which parts of the activity represent the processes of photosynthesis and
respiration?
b. What are the factors that affect the processes of photosynthesis and
respiration?
c. Explain why photosynthesis and respiration are called reversible chemical
reactions.

IMPACT OF CLIMATE CHANGE ON BIODIVERSITY AND ECOSYSTEM
27
SEAMEO
Chapter I
d. What is the importance of maintaining balance on the amount of carbon
dioxide and oxygen in the atmosphere particularly on living things and the
ecosystem?
e. How does climate change affect the processes of photosynthesis and
respiration?
f. What are some ways to mitigate the effect of climate change on
biodiversity and ecosystem?
Achieving the Objectives
Objective This is achieved by
Explain the relationship between
the processes of photosynthesis
and respiration.
Conducting an experiment about
photosynthesis and respiration. Students’
interaction during the activity proper and
output presentation.
Explain the equation showing the
opposite reaction in the
photosynthesis and respiration.
Teacher and students’ discussion and
interaction based on the guide questions from
the Students’ Worksheet.
Cite the importance of
interdependence of living things
based on the oxygen-carbon
dioxide cycle.
Processing the learning experiences of the
students during and after the experiment on
photosynthesis and respiration.
Explain the factors which can be
attributed to climate change that
affect photosynthesis process.
Students’ interaction and discussion ideas
about photosynthesis in relation to climate
change after the group presentation.
Cite ways to mitigate the effect of
climate change to biodiversity
and ecosystem.
Integrating the overall learning experiences of
the students in relation to climate change
mitigation and adaptation.

IMPACT OF CLIMATE CHANGE ON BIODIVERSITY AND ECOSYSTEM
28
SEAMEO
Chapter I
Assessment
Skills assessment will be conducted during the performance of the assigned
activity. The teacher will utilise a group performance rubric upon completion
of their experiment and group presentation (Attachment 1.1.2).
The formative assessment will be done through a “Picture Analysis”. Ask the
students to carefully read, analyse and fill in the correct information to
complete the Carbon-Oxygen Cycle given in the figure below:
Source:
http://www.esrl.noaa.gov/gmd/outreach/lesson_plans/The%20Carbon%20Dioxide-
%20Oxygen%20Cycle.pdf
Carbon dioxide used by plants Carbon dioxide given off by animals
Oxygen given off by plants Oxygen used by animals
Oxygen from photosynthesis available to animals
Carbon dioxide from respiration available to plants
Carbon dioxide given off by decaying organic matter

IMPACT OF CLIMATE CHANGE ON BIODIVERSITY AND ECOSYSTEM
29
SEAMEO
Chapter I
Closure Activity
1) Reiterate to the students the concept of exchange of gases and how humans
and plants live together in a mutual relationship through the processes of
photosynthesis and respiration. Also, connect these processes to climate
change issues and mitigation measures. Say something like this:
Without plants, humans would not have oxygen and without humans,
plants would have no carbon dioxide. Through photosynthesis, plants
produce food for themselves and other living organisms. When animals
eat plants they too are eating the food that the plants produced.
Climate is an integral part of ecosystems and organisms have adapted to
their regional climate over time. Climatic factors affect plant and animal
productivity and other ecosystem functions. The concentration of CO2 in
the atmosphere affects the rate and efficiencies of both photosynthesis
and water use, thus can affect both the productivity of plants and other
ecosystem processes. Climate change is a factor that has the potential to
alter ecosystems and the many resources and services they provide to
each other and to society.
The effects of climate change on biodiversity are aggravated by the loss
of forests, which serve as carbon sinks and watersheds. Trees need
carbon dioxide to form chlorophyll. But, with half of the Earth’s forests
gone, this gas goes straight to the atmosphere.
2) Summarise the ideas of student about the mitigation measures that they can
take which may include the following ways:
―Keep plants in your home, and school to freshen the air. Plants absorb
CO2 and releases O2. Include landscaping with native and indigenous
plants; support organic farming; start urban farming; find your local
watershed and woodland and adopt it; be involved in protecting and/or
rehabilitating denuded forests and watershed; plant a tree at least once a
year and regularly maintain it; give your family and friends the gift of
planting a tree in their name; support local restaurants that use organically
grown food derived less than 100 miles away and learn more about the
benefits of eating locally…‖(Earth Day Network Philippines, 2010)

IMPACT OF CLIMATE CHANGE ON BIODIVERSITY AND ECOSYSTEM
30
SEAMEO
Chapter I
Assignment
Option 1) Ask the students to conduct a research about CO2 fertilisation and will be
guided by the following:
Use a consequence map to show its advantages and disadvantages.
Make a chart of the carbon-oxygen cycle using poster paper and
coloured paper. Write a brief explanation about the carbon-oxygen
cycle.
Option 2) Ask students to conduct a research project on ―What are the implications to
the ecosystem and biodiversity if photosynthesis advances or slows
down?’’.
RESOURCES
Andaya, C.V. (2008). Understandings the Earth through Environmental Science. C&E
Publishing, Inc.
Earth Day Network Philippines. (2010). Retrieved on 29 October 2010 from
http://www.earthdayphils.org/html/support_us.html
Help Save the Climate. (2010). Photosynthesis. Retrieved on 29 October 2010 from
http://www.helpsavetheclimate.com/photosynthesis.html
I. Science Mate. (2010). Life cycle-plants (5A). Retrieved on 29 October 2010 from
http://www.msnucleus.org/membership/html/k-6/lc/plants/5/lcp5_3a.html
Photosynthesis Lab. (n.d.). Retrieved on 29 October 2010 from
http://chem.lapeer.org/Bio1Docs/PhotoLab.html
Photosynthesis versus respiration. (n.d.). Retrieved on 29 October 2010 from
http://sciences.aum.edu/bi/bi4523/student/cardwell/phvre.html
Rabago, L. (2003). M. Science and Technology Series - Functional biology: Modular
approach. Quezon City: Vibal Publishing House Inc.
The Science Behind Our Food. (n.d.). Respiration and photosynthesis lab. Retrieved
on 29 October 2010 from
http://apps.caes.uga.edu/sbof/main/lessonPlan/Lab.pdf
Tutor Vista.com. (2010. Factors that affect photosynthesis. Retrieved on 29 October
2010 from http://www.tutorvista.com/biology/factors-that-affect-photosynthesis

IMPACT OF CLIMATE CHANGE ON BIODIVERSITY AND ECOSYSTEM
31
SEAMEO
Chapter I
Attachment 1.1.1 Student’s Worksheet
DEMYSTIFYING THE RELATIONSHIP OF
PHOTOSYNTHESIS AND RESPIRATION
Objectives
By the end of this activity, you will:
demonstrate how photosynthesis and respiration work; and
explain the relationship between the processes of photosynthesis and respiration.
Materials
Elodea or other aquatic plant that does not have needle-like leaves
Light source, Bromothymol Blue and drinking straws
Five 25 ml Graduated Cylinders and rubber stoppers
Safety Precaution!
Bromothymol blue (BTB) is a substance that changes colour as the pH of a solution
changes. BTB stains hands and clothes. Always wear goggles and follow the safety
precautions when using the BTB solution.
Procedure
1. Mix two one (1) or two (2) drops of bromothymol blue to 15ml of water in a 25 ml
graduated cylinder. Using a drinking straw, gently blow into the graduated
cylinder until the solution changes its colour to yellow.
2. Place a piece of Elodea in the 25ml graduated cylinder with the yellow solution
and insert a cork stopper in the beak of the cylinder. Expose the cylinder to
sunlight for twenty (20) minutes.
3. Using another cylinder, add 1-2 drops of bromothymol blue to water and gently
blow with a straw until the solution changes its colour. Without Elodea, plug the
top of the cylinder with a stopper and place it under the sunlight for 20 minutes.
4. Prepare another cylinder in the same manner as the previous one (Step 3), but
do not expose it to sunlight. Wait for twenty (20) minutes.
5. Again, place an Elodea plant, bromothymol blue and water in the cylinder and
leave it in a dark place for twenty four (24) hours. Note: Since the reactions for
this procedure will take place for a while, your teacher will present to the class a
ready set-up which was prepared a day before your activity so that you can
already make your observations.

IMPACT OF CLIMATE CHANGE ON BIODIVERSITY AND ECOSYSTEM
32
SEAMEO
Chapter I
Guide Questions
1. What causes the change in colour after blowing into the solution?
________________________________________________________________
________________________________________________________________
2. What happens when the Elodea plant was placed in a yellow solution and also
exposed to sunlight?
________________________________________________________________
________________________________________________________________
3. What happens when the Elodea plant and the yellow solution was left in the dark
for twenty four (24) hours?
________________________________________________________________
________________________________________________________________
4. Which parts of the activity represent the photosynthesis and respiration
processes? Why?
________________________________________________________________
________________________________________________________________
________________________________________________________________
________________________________________________________________
5. What factors both affect the processes of photosynthesis and respiration? How?
_______________________________________________________________________________________________________________________________________________________________________________________________________________________________________________________________________________________________________________________________________________________________________________________________
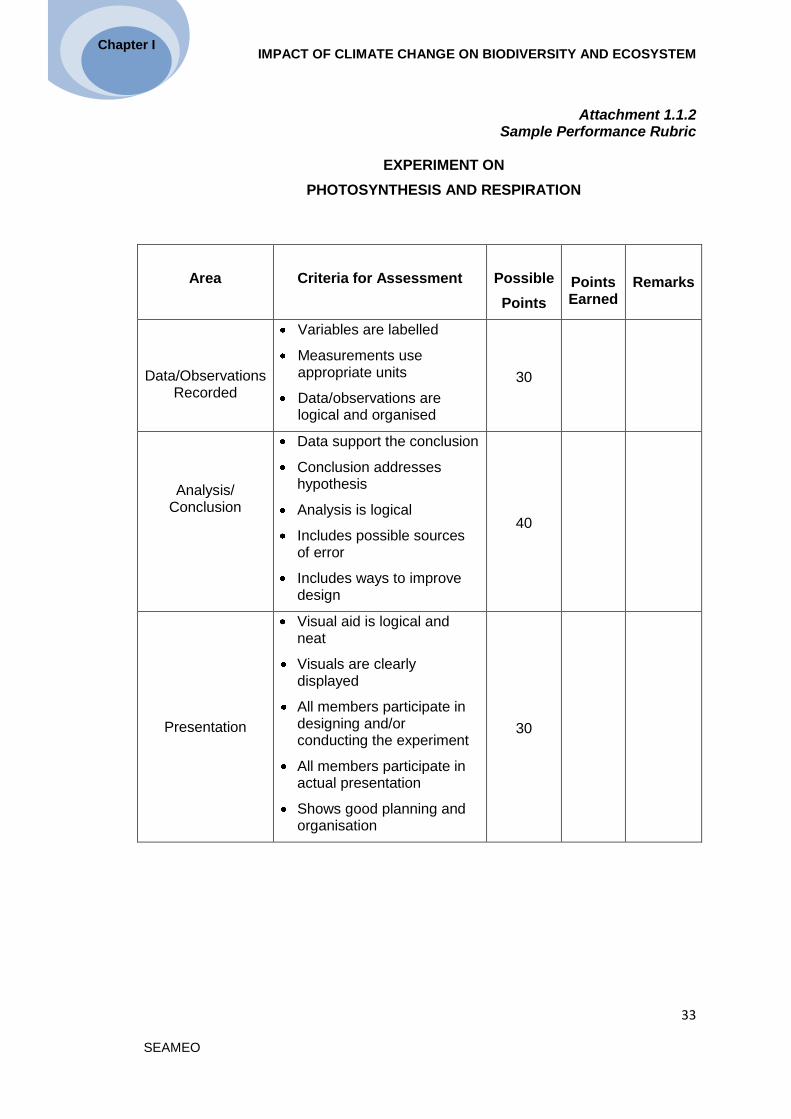
IMPACT OF CLIMATE CHANGE ON BIODIVERSITY AND ECOSYSTEM
33
SEAMEO
Chapter I
Attachment 1.1.2 Sample Performance Rubric
EXPERIMENT ON
PHOTOSYNTHESIS AND RESPIRATION
Area Criteria for Assessment
Possible
Points
Points Earned
Remarks
Data/Observations
Recorded
Variables are labelled
Measurements use appropriate units
Data/observations are logical and organised
30
Analysis/ Conclusion
Data support the conclusion
Conclusion addresses hypothesis
Analysis is logical
Includes possible sources of error
Includes ways to improve design
40
Presentation
Visual aid is logical and neat
Visuals are clearly displayed
All members participate in designing and/or conducting the experiment
All members participate in actual presentation
Shows good planning and organisation
30

IMPACT OF CLIMATE CHANGE ON BIODIVERSITY AND ECOSYSTEM
34
SEAMEO
Chapter I
Lesson 2
CLIMATE CHANGE: THREAT TO BIODIVERSITY
GRADE LEVEL: High School
SUBJECTS: Biology/Environmental Science
TOPIC: Diversity and Stability of Ecological Community
PREREQUISITES
Students should have prior knowledge on the components of an ecosystem
and the different types of ecosystem.
Student should also have prior knowledge about ecological population and
communities.
DURATION: 2 sessions
LEARNING OBJECTIVES
Subject Matter Objectives: At the end of this lesson, students should be able to:
differentiate species diversity and stability;
explain the changes that take place in an ecological community; and
determine the factors that affect the diversity of species in a community.
Climate Change Objectives
explain how climate change affects the diversity of species and the stability of
an ecological community; and
suggest ways to mitigate the impact of climate change on species’ diversity
and stability of an ecological community.
MAIN CONCEPTS AND SKILLS
Species diversity refers to the total number of species of plants and animals
in an ecological community. It is also known as ―species richness‖.
A diverse community is one having a large variety of organisms. Specific
diversity is affected by several factors such as geological history, climatic
stability, and productivity, diversity of resources, and predation and
competition.
Stability refers to the ability of a community to maintain its normal conditions
despite changes in the conditions of the environment. It also includes the

IMPACT OF CLIMATE CHANGE ON BIODIVERSITY AND ECOSYSTEM
35
SEAMEO
Chapter I
ability of the organism to recover and return to its original condition after some
disturbances. Stability is influenced by two factors: growth and reduction.
Growth factors increase the population size while reduction factors decrease
the population size.
There are two kinds of extinction or disappearance of certain species: natural
and human induced extinction. Natural extinction results from physical and
biological changes in the environment. Physical changes are the effects of
events such as natural calamities (earthquakes, volcanic eruptions, typhoons)
or natural geological changes (gradual sinking of an island, gradual soil
erosion). Biological changes may be the result of natural processes occurring
among species like predation and competition.
Rising temperatures over time can lead to an increase in dry, desert-like
conditions, which will affect not only the survival of particular species, but also
the natural resources they have adapted to use in their natural environment.
Species are thus forced to move elsewhere to find places to live and food to
eat.
MATERIALS NEEDED
Pictures of forest and grassland ecosystems
Locally produced video presentation on biodiversity
Notebook for field investigation
Hand lens and pen marker
Flip chart/sheets for nature mapping
PRESENTATION OF LESSON
Scenario
Present a picture of a forest, grassland and desert ecosystems to the class.
Allow students to visualise, imagine and briefly share their own personal
experience (for e.g., hiking) in one of these ecosystems. Listen to individual
stories and facilitate the class discussion using the following guide questions:
1. Have you ever hiked through a forest or grassland?
2. What did you observe during your hike?
3. How many organisms of plants and animals did you see during the hike?
4. How does the diversity of species in the forest or grassland affect the
stability of the community?

IMPACT OF CLIMATE CHANGE ON BIODIVERSITY AND ECOSYSTEM
36
SEAMEO
Chapter I
Student Activities
Students will create a ―Nature Map‖ by preparing an inventory of plants and
animals living in the ecosystems around the school or the immediate
community. The students will also create a ―scrapbook‖ of the wildlife and
habitats around the school or their immediate community.
Process Guide for Teachers
1. Conduct a short lecture about the biodiversity of your immediate
community or your country. If the school has a provision for video
presentation, allow the students to watch a locally produced video about
the country’s biodiversity.
2. After the brief lecture or video presentation, divide the class into working
groups. Explain to the class that they will conduct a field investigation.
Each group will prepare a ―nature map‖ of the school-community which
contains a list of plants and animals living in the ecosystem.
Notes: The field observation and investigation will take one whole
session. The teacher will have to decide on the format or template to be
used for nature mapping.
3. Discuss something about Nature Mapping:
―Nature Mapping is a process of data collection about the number of
animals that live in different areas. Using this data, interested
individuals like scientists, environmental professionals and students
can determine what animals are common and share the same habitats
in an area. They can also see which places are more diverse, so that
these areas can be protected‖ (Netting, 2007).
4. After the field work, instruct the students to prepare a poster showing the
results of their nature mapping. The poster will be presented through
gallery viewing. Ask the students to move around the class and observe
the results of nature mapping. Instruct the students to take notes on
diversity of species in the community and the factors that might affect the
stability of the ecological community.
5. After the gallery viewing and class interaction, process the students’
learning experiences using guide questions below:
a. What do you observe about the nature maps presented by all groups?
Does your community have biodiversity? Why did you say that?
b. What changes are taking place in your community which might affect
the species diversity and community’s stability?
c. What are the human-induced activities which contribute to the
reduction and later on extinction of species?

IMPACT OF CLIMATE CHANGE ON BIODIVERSITY AND ECOSYSTEM
37
SEAMEO
Chapter I
d. How does species diversity affect ecological stability?
e. How does climate change affect the species diversity and ecological
stability?
f. How can we mitigate the effects of climate change on biodiversity?
Achieving the Objectives
Objective This is achieved by
Differentiate species diversity
and stability.
Review of ecosystem and brief lecture on
biodiversity; class discussion and
students-teacher interaction on these two
concepts.
Explain the changes that take
place in an ecological
community.
Nature mapping and class interaction
between students and teacher.
Cite the factors that affect
species diversity in a community.
Processing of students’ learning
experiences on nature mapping.
Explain how climate change
affects species diversity and the
stability of ecological community.
Students-teacher interaction and group
discussion during the ―gallery viewing of
posters on nature maps‖.
Cite ways to mitigate the effect
of climate change on species
diversity and stability of
ecological community.
Integrating students’ learning
experiences in real life; raising their
awareness on climate change and its
impact on diversity and stability of eco-
communities; and, challenging them to
act and be involved in climate change
mitigation and adaptation.
Assessment
This will be conducted during the performance of the assigned activity. The
teacher will utilise a rubric to assess the presence of teamwork and
cooperation among working groups and the quality of posters produced by
each group (See Attachments 1.2.1 and 1.2.2).
In a clean sheet of paper, the students will answer the following questions:
1. What is the difference between species diversity and ecological stability?
2. How do changes in the ecological community affect the species diversity
and stability?

IMPACT OF CLIMATE CHANGE ON BIODIVERSITY AND ECOSYSTEM
38
SEAMEO
Chapter I
3. What factors affect the species diversity in a community?
4. How does climate change affect the species diversity in a community?
5. As a student, what common activities can you do to help mitigate the
effects of climate change on biodiversity in your community?
Closure Activity
Identify which of the following human-induced activities are contributing to the
extinction of some species in your community which in the long run will affect its
biodiversity. Then, discuss briefly on what you can do to prevent the extinction of
some species.
1. Destructing the natural ecosystems for the purpose of progress and
development (e.g. conversion of rice fields into subdivisions)
2. Constructing dams which flood certain areas and drain others.
3. Polluting the air, water, and land.
4. Overgrazing of fields by livestock-raising.
5. Extinction of predators.
Assignment
1. Create a‖―scrapbook‖ of the wildlife and their habitats around your
community.
2. Conduct an ―action research‖ on the endangered species in your country.
3. Draw a ―before and after‖ scenario of your immediate community.
Describe your community ten (10) years ago and at present. Highlight the
plants and animals that were present ten years ago which are no longer
around due to industrial progress and development.

IMPACT OF CLIMATE CHANGE ON BIODIVERSITY AND ECOSYSTEM
39
SEAMEO
Chapter I
RESOURCES
Andaya, C. V.(2008). Understandings the earth through environmental science.
Quezon City: C&E Publishing, Inc.
Convention on biological diversity. (2007). Biodiversity and climate change.
Retrieved on 29 October 2010 from www.cbd.int/doc/bioday/2007/ibd-
2007-booklet-01-en.pdf -
Deauna, M.C. & Dorado, S. L. (1998). Environmental science for Philippine
schools. Quezon City: Phoenix Publishing House.
Netting, R. (2007). What is nature mapping? Retrieved on 29 October 2010 from
http://science.hq.nasa.gov/kids/imagers/teachersite/BD2wkst1.htm
Philippine biodiversity conservation manual. (2006). Haribon Foundation for the
Conservation of Natural Resources Inc.
Progress in physical geography. (2010). Sage Online Journal. Retrieved on 29
October 2010 from http://ppg.sagepub.com/content/32/2/139.short
Science Daily. Science News. Retrieved on 29 October 2010 from
http://www.sciencedaily.com/releases/2008/08/080804100143.htm
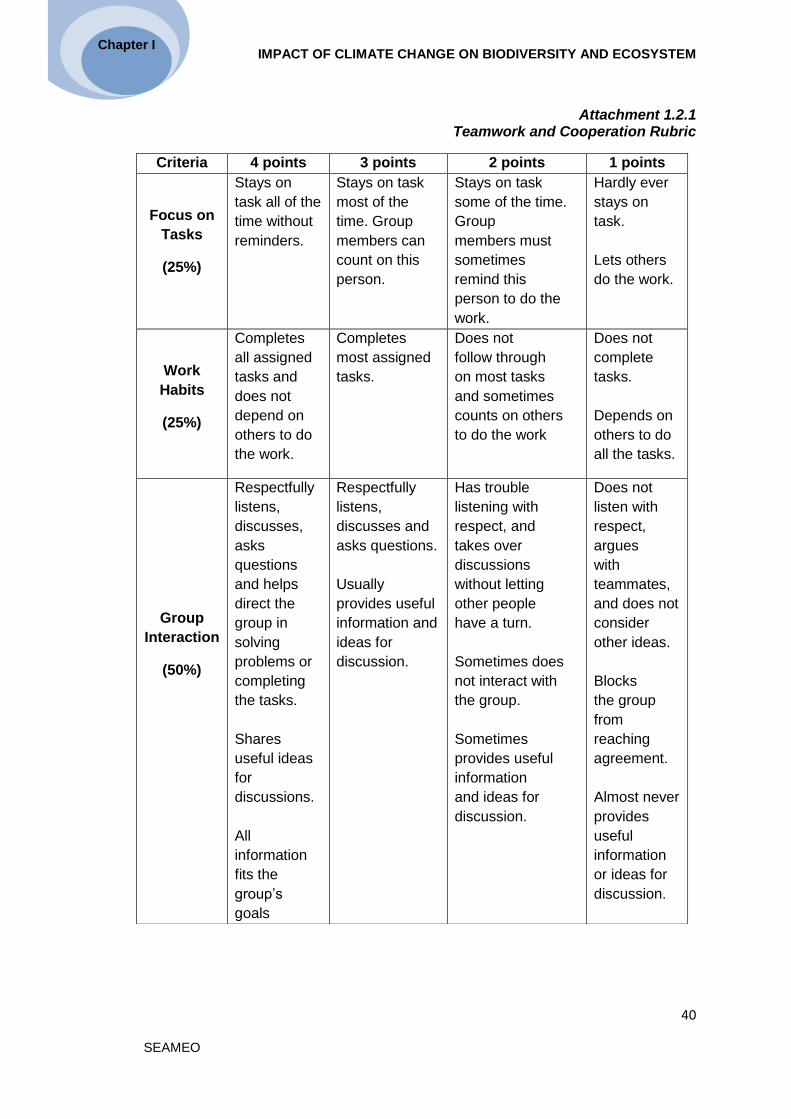
IMPACT OF CLIMATE CHANGE ON BIODIVERSITY AND ECOSYSTEM
40
SEAMEO
Chapter I
Attachment 1.2.1 Teamwork and Cooperation Rubric
Criteria 4 points 3 points 2 points 1 points
Focus on
Tasks
(25%)
Stays on
task all of the
time without
reminders.
Stays on task
most of the
time. Group
members can
count on this
person.
Stays on task
some of the time.
Group
members must
sometimes
remind this
person to do the
work.
Hardly ever
stays on
task.
Lets others
do the work.
Work
Habits
(25%)
Completes
all assigned
tasks and
does not
depend on
others to do
the work.
Completes
most assigned
tasks.
Does not
follow through
on most tasks
and sometimes
counts on others
to do the work
Does not
complete
tasks.
Depends on
others to do
all the tasks.
Group
Interaction
(50%)
Respectfully
listens,
discusses,
asks
questions
and helps
direct the
group in
solving
problems or
completing
the tasks.
Shares
useful ideas
for
discussions.
All
information
fits the
group’s
goals
Respectfully
listens,
discusses and
asks questions.
Usually
provides useful
information and
ideas for
discussion.
Has trouble
listening with
respect, and
takes over
discussions
without letting
other people
have a turn.
Sometimes does
not interact with
the group.
Sometimes
provides useful
information
and ideas for
discussion.
Does not
listen with
respect,
argues
with
teammates,
and does not
consider
other ideas.
Blocks
the group
from
reaching
agreement.
Almost never
provides
useful
information
or ideas for
discussion.

IMPACT OF CLIMATE CHANGE ON BIODIVERSITY AND ECOSYSTEM
41
SEAMEO
Chapter I
Attachment 1.2.2 Poster Rubric
Group Name _________________________________________________________
CATEGORY 4 3 2 1
Required Elements
The poster includes all required elements as well as additional information.
All required elements are included in the poster.
All but one of the required elements are included in the poster.
Several required elements were missing.
Labels All items of importance on the poster are clearly labelled that can be read from at least one metre away.
Almost all items of importance on the poster are clearly labelled that can be read from at least one metre away.
Many items of importance on the poster are clearly labelled that can be read from at least one metre away.
Labels are too small to view OR no important items were labelled.
Relevance of Graphics
All graphics are related to the topic and make it easier to understand. All borrowed graphics have a source citation.
All graphics are related to the topic and most are easy to understand. Some borrowed graphics have a source citation.
All graphics relate to the topic. One or two borrowed graphics have a source citation.
Graphics do not relate to the topic OR several borrowed graphics do not have a source citation.
Attractiveness The poster is exceptionally attractive in terms of design, layout, and neatness.
The poster is attractive in terms of design, layout and neatness.
The poster is acceptably attractive though it may be a bit messy.
The poster is distractingly messy or very poorly designed. It is not attractive.
Grammar There are no grammatical/ mechanical mistakes in the poster.
There are 1-2 grammatical/ mechanical mistakes in the poster.
There are 3-4 grammatical/ mechanical mistakes in the poster.
There are more than 4 grammatical/ mechanical mistakes in the poster.
Source: http://www.teacherweb.com/ME/JALeonardMiddleSchoolOldTown/Ecologywebquest/ page3.htm,2003-07-28

IMPACT OF CLIMATE CHANGE ON BIODIVERSITY AND ECOSYSTEM
42
SEAMEO
Chapter I
Lesson 3
INTERESTING INSECTS
(Effect of Temperature on Insect Behaviour)
GRADE LEVEL: High School
SUBJECT: Biology
TOPIC: Organisation in Living Systems, Phylum Arthropod, Class Insecta
PREREQUISITE
Students should have prior knowledge about the biological classification of
organisms.
DURATION: 2 sessions
LEARNING OBJECTIVES
Subject Matter Objectives: At the end of this lesson, the students should be able to:
identify the characteristics of arthropods; and
describe the effects of temperature on cold-blooded insects.
Climate Change Objectives
describe the effect of higher temperature on the behaviour, distribution,
development, survival, and reproduction of insects;
explain the effect of climate change on biodiversity; and
cite practical measures to help farmers reduce the potential impacts of global
warming on agricultural crops and pest infestation.
MAIN CONCEPTS AND SKILLS
Arthropods include insects, spiders and other arachnids, crustaceans (such as
lobsters), millipedes, centipedes and other animals with exoskeletons. Other
than exoskeleton, segmented body and multiple pairs of legs, the general
characteristics of arthropods include the dorsal heart, hemocoelic body cavity
and a nervous system comprising of the dorsal brain and ventral nerve chord.
On the basis of the physical characteristics of arthropods, they can be divided
into five major classes - Arachnida, Crustacea, Diplopoda, Chilopoda, and
Hexapoda.
Insects are cold-blooded organisms - the temperature of their bodies is
approximately the same as that of the environment. Therefore, temperature is
probably the single most important environmental factor influencing insect
behaviour, distribution, development, survival, and reproduction.

IMPACT OF CLIMATE CHANGE ON BIODIVERSITY AND ECOSYSTEM
43
SEAMEO
Chapter I
The body temperatures of insects are highly influenced by their
environments. If the weather is warm, their body temperatures are warm.
If the weather is cold, so are they. When their bodies become cold, they
slow down and may even stop.
Insect life stage predictions are most often calculated using accumulated
degree days from a base temperature and biofix point. Some researchers
believe that the effect of temperature on insects largely overwhelms the
effects of other environmental factors (Bale et al., 2002).
It has been estimated that with a 20C temperature increase insects might
experience one to five additional life cycles per season (Yamamura &
Kiritani, 1998). Other researchers have found that moisture and CO2
effects on insects can be potentially important considerations in a global
climate change setting. Climate change resulting in increased
temperature could impact on crop pest and insect populations in several
complex ways. Although some climate change temperature effects might
tend to depress insect populations, most researchers seem to agree that
warmer temperatures in temperate climates will result in more types and
higher populations of insects.
15% - 20% of greenhouse gases (GHG) is generated from intensive use
of agro chemicals (e.g., pesticides) and fertilisers and methane gas from
livestock production. Using organic farming, farmers can help reduce the
potential impacts of global warming on agricultural crops and pest/insect
infestation.
MATERIALS NEEDED
News article about insect infestation in farms (preferably the news articles
should be sourced from a local news paper or magazines)
Insect net, tall clear plastic cup, thermometer, mesh
Paper and pencil
PRESENTATION OF THE LESSON
Scenario
Distribute copies of the news article about insect infestation in a farming
community. Provide ample time for the students to read and understand the
article. Facilitate the class discussion based on the following guide questions:
1. What facts in this article caught your attention?
2. What causes the insect infestation?

IMPACT OF CLIMATE CHANGE ON BIODIVERSITY AND ECOSYSTEM
44
SEAMEO
Chapter I
3. What factors have contributed to increase the population of insects that
attacked the farm crops?
4. How does the insect’s behaviour relate to the environment in which it
lives?
Student Activities
Students will carry out an experiment to study the ―insect response
(behaviour) to a certain stimuli‖. Based on the given Student Worksheet, they
will investigate the possible effects of temperature on cold-blooded insects
like a ―bug‖ (See Attachment 1.3.1).
Process Guide for Teachers
1. Use the class discussion on the news article as a spring board to explain
the nature and characteristics of the ―phylum arthropods‖.
2. Divide the class into working groups. Give each group a set of materials
and a worksheet for the experiment. Provide precautionary measures
particularly in the proper handling of insects.
3. Also, explain the difference between temperature maintenance in warm-
versus cold-blooded organisms.
4. In groups, ask the students to design and perform a short activity about
the effect of temperature on cold-blooded insects. Refer to the Student’s
Worksheet.
5. Monitor the students while working in groups and assess their level of
participation using a performance rubric.
6. Upon completion of the assigned tasks, give time for each group to
present the results of their experiment.
7. Debrief the learning experiences of the students using the following guide
questions:
a. How does the temperature of the environment affect the behaviour
of arthropods such as insects?
b. What is the difference between warm-blooded and cold-blooded
organisms?
c. Does temperature affect the population growth of organisms?
d. What other stimulus may affect the behaviour of insects?
e. How does an extreme change in the global temperature (brought
about by climate change) affect the population of insects and other
organisms?

IMPACT OF CLIMATE CHANGE ON BIODIVERSITY AND ECOSYSTEM
45
SEAMEO
Chapter I
8. What are the effects of the change in insect population in your
community’s biodiversity?
9. As a responsible student and citizen, what common activities can you do
to help mitigate the effects of climate change on crop pest/insects in your
community?
Achieving the Objectives
Objective This is achieved by
Identify the characteristics of
arthropods.
Class discussion on news article on insect
infestation and brief lecture on arthropods.
Describe the effects of
temperature on cold-blooded
insects.
Conducting a simple experiment (hands-on
activity) on cold-blooded insects.
Describe the effect of higher
temperature on the
behaviour of insects.
Group presentation of outputs; Students and
teacher interaction on climate change impact
on biodiversity.
Explain the effect of climate
change on biodiversity.
Processing students’ learning experiences
through integration of climate change impact on
phylum arthropods’ population growth.
Cite practical measures to
help farmers reduce the
potential impacts of global
warming on agricultural
crops and pest infestation.
Encouraging students to think of possible
measures to help farmers mitigate climate
change impact on proliferation of unwanted or
harmful insects (e.g., organic farming to protect
crops from insect infestation)
Assessment
Arthropods Quiz: Fill-in the missing word to complete each sentence.
1. Arthropods are ________________.
2. Certain types of _______________include exoskeletons.
3. Arthropods have _______________bodies.
4. Arthropods have __________pairs of legs.
5. Arthropods have __________that pumps blood through the whole
body.
6. Insects are cold-blooded organisms, the ___________of their
bodies are approximately the same as that of the environment.
Answer Key: 1. crustaceans
2. arthropods

IMPACT OF CLIMATE CHANGE ON BIODIVERSITY AND ECOSYSTEM
46
SEAMEO
Chapter I
3. segmented
4. multiple
5. hearts
6. temperatures
Thought Questions for Today
How does the insect’s behaviour relate to the environment in
which it lives?
Does climate change (rise in temperature) also affect the
population growth of insects? What can farmers do to mitigate the
impact of climate change on crop pest and insect infestation?
Closure
Discuss how the rising temperature affects the behaviour of insects. Read the
news article in Attachment 1.3.2. Tell them that ―climate change resulting in
increased temperature could impact on crop pest (insect) populations
because warmer temperatures in climates will result in more types and higher
populations of insects.‖
Farmers can adopt a number of strategies to reduce the potential negative
impacts and to take advantage of possible benefits of global warming such as
the following: (Source:http://www.climatehotmap.org/impacts/agriculture.html)
change sowing dates to exploit a lengthening of the growing seasons and
to avoid excessive heat stress during dry season (summer);
adopt different cropping systems that take advantage of warmer climates;
adopt new crop varieties better suited to warmer temperatures, increased
water stresses, etc., as they become available through either genetic
engineering or standard plant breeding techniques;
increase the use of conservation tillage to better retain soil organic matter
during high temperatures and increased flooding;
implement the use of short-term climate prediction to reduce losses due to
weather variability.
Assignment
Option 1) Interview some farmers about their observations on the behaviour
of insects when the temperature in the farm is high. Determine how this
impact to their crops or animals and what practical and simple measures
they adopt in mitigating climate change.

IMPACT OF CLIMATE CHANGE ON BIODIVERSITY AND ECOSYSTEM
47
SEAMEO
Chapter I
Option 2) Based on what you have learned about the behaviour of insects on
increasing temperature, design an experiment to show the effects of
another stimulus on the behaviour of insects.
RESOURCES
Andaya, C.V. (2008). Understandings the Earth through Environmental Science. C&EPublishing, Inc.
Bale, et al. (2002). Herbivory in global climate research: direct effect of rising
temperatures on insect herbivores. Global change biology, 8: 1-16. Bloomfield, J., and Tubiello, F. (2000). The Potential impacts of global warming on
U.S. agriculture - An overview. Retrieved on 29 October 2010 from http://www.climatehotmap.org/impacts/agriculture.html
Buzzle.com. (2010). Arthropods characteristics. Retrieved on 29 October 2010 from
http://www.buzzle.com/articles/arthropods-characteristics.html Earth Day Network Philippines. (2010). 101 ways to a greener lifestyle. Retrieved on
29 October 2010 from http://www.earthdayphils.org/html/support_us.html
Editors of Publications International, Ltd. (2010). Insects experiments. Discovery Communications Inc. Retrieved from http://tlc.howstuffworks.com/family/insect- experiments2.htm
Idaho State University. (2003). Animal behavior lab. Retrieved on 29 October 2010 from http://www.isu.edu/biolearn/Lesson%20Plans/behavior/lessonplans/ LessonAnimalBehavior.html
Petzoldt, C., and Seaman, A. (n.d.). Climate change and agriculture: Promoting
practical and profitable responses. Climate change effect on insects and pathogens. Retrieved on 29 October 2010 from. http://www.climateandfarming.org/pdfs/FactSheets/III.2Insects.Pathogens.pdf
Rabago, L.M., et.al. (2003). Science and Technology Series – Functional biology:
modular approach. Quezon CityVibal Publishing House Inc. 2003. Yamamura, K. and K. Kiritani. (1998). A simple method to estimate the potential
increase in the number of generations under global warming in temperate zones. Appl. Ent. and Zool. Retrieved on November 2, 2010 from http://www.climateandfarming.org/pdfs/FactSheets/III.2Insects.Pathogens.pdf
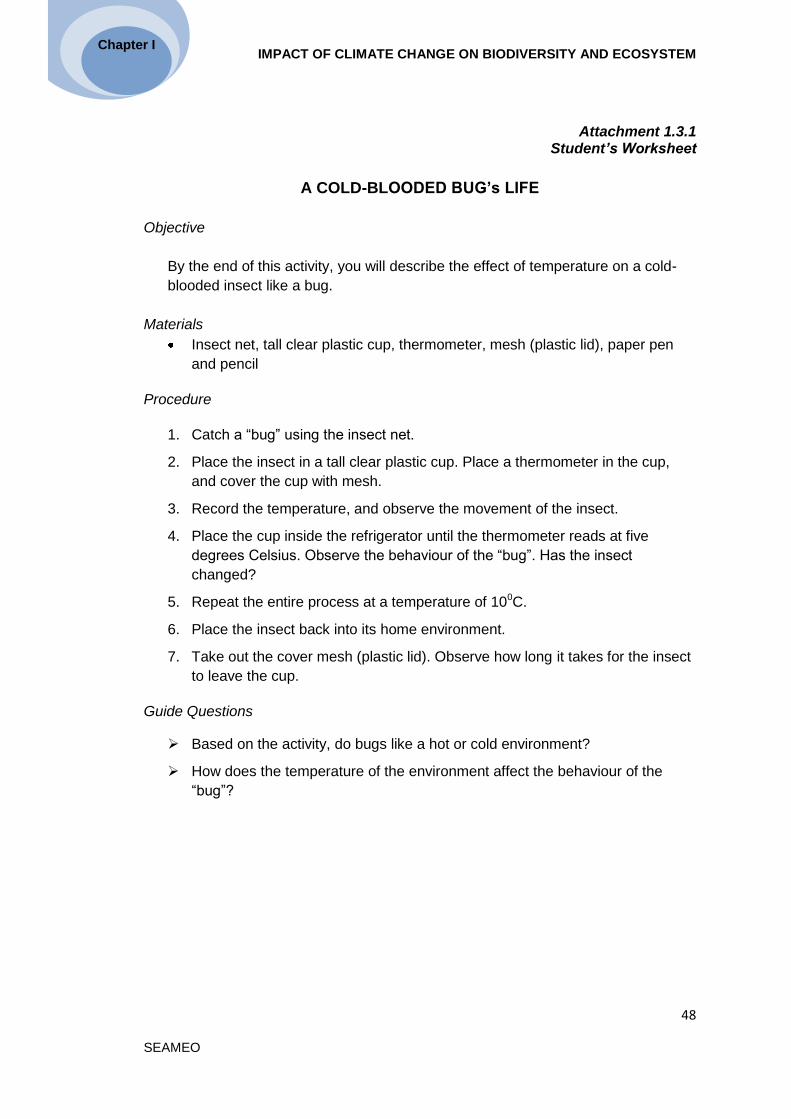
IMPACT OF CLIMATE CHANGE ON BIODIVERSITY AND ECOSYSTEM
48
SEAMEO
Chapter I
Attachment 1.3.1
Student’s Worksheet
A COLD-BLOODED BUG’s LIFE
Objective
By the end of this activity, you will describe the effect of temperature on a cold-
blooded insect like a bug.
Materials
Insect net, tall clear plastic cup, thermometer, mesh (plastic lid), paper pen
and pencil
Procedure
1. Catch a ―bug‖ using the insect net.
2. Place the insect in a tall clear plastic cup. Place a thermometer in the cup,
and cover the cup with mesh.
3. Record the temperature, and observe the movement of the insect.
4. Place the cup inside the refrigerator until the thermometer reads at five
degrees Celsius. Observe the behaviour of the ―bug‖. Has the insect
changed?
5. Repeat the entire process at a temperature of 100C.
6. Place the insect back into its home environment.
7. Take out the cover mesh (plastic lid). Observe how long it takes for the insect
to leave the cup.
Guide Questions
Based on the activity, do bugs like a hot or cold environment?
How does the temperature of the environment affect the behaviour of the
―bug‖?

IMPACT OF CLIMATE CHANGE ON BIODIVERSITY AND ECOSYSTEM
49
SEAMEO
Chapter I
Attachment 1.3.2 Sample News Article
Black bugs attack Albay rice farms By Mar S. Arguelles, Rey M. Nasol Philippine Daily Inquirer September 30, 2010
LEGAZPI CITY, Philippines -- Black bugs have already destroyed rice plants in close to a thousand hectares of farm lands in Albay, causing an estimated damage of P16.7 million, the Provincial Agriculture Office said Thursday.
Ruben Limos, PAO chief, said the rice black bug (Scotinophara coarctata) is a sap-feeding insect and is one of the most difficult agricultural pests to eradicate.
Locally known as ―itim na atangya,‖ the rice black bug (RBB) attacks rice plants in irrigated areas at almost all stages of the plants' growth, particularly from maximum tillering to ripening stage.
The insect infests the base stem of a rice plant, drains it of sap and causes it to eventually wither (bug burn) and die.
He said they were continuously assessing the extent of damage brought by the RBB in areas affected and they are conducting continuous information drive on RBB management.
He said they had already distributed metharhizium anasopliae, a biological control insecticide, to stop the spread of the pest.
Albay Gov. Joey Salceda said the province's food security program is being threatened by the pest infestation, which he said is presently destroying 975 hectares of rice lands in the towns of Guinobatan, Oas and Polangui and in Ligao City in the third district, considered as the rice granary of the province.
Salceda in a text message said, ―It’s the first major incident of that magnitude in my memory, being a 49-year-old resident of Polangui where the black bug infestations are completely colossal. All signs lead to El Niño and climate change as the culprits.‖
He said he had asked the Department of Agriculture for assistance and directed the Albay Public Safety and Emergency and Management Office and the Provincial Agriculture Services Office to draw up emergency measures to curb the negative effects of the pest infestation in the province's agriculture sector.
The RBB infestation was first reported in April this year, with close to 1,000 hectares of rice lands affected in 48 villages from two towns and a city in the third district of the province.
Limos said the RBBs are fast affecting the rice farms during the night, especially when the moon is out.

IMPACT OF CLIMATE CHANGE ON BIODIVERSITY AND ECOSYSTEM
50
SEAMEO
Chapter I
"They also travel during the night, following the lights of trucks, sea craft and the moon; that is why they have reached us here although these pests came from the southern provinces of the Philippines," he said.
Limos said RBB prefers marshy and wetland environments. The main habitat of this pest is the base of the rice plant.
―Also, the bugs can live on the leaves of other plants like taro, corn and weeds. At daytime, RBBs can be seen at the base of the plant and move up to the panicle at night,‖ he added.
Limos said he would recommend the declaration of a state of calamity in the affected towns, depending on the extent of damages to the areas under investigation.
Meanwhile, the DA Bicol office reported that aside from Albay, the RBB has also attacked the provinces of Camarines Sur, Sorsogon and Catanduanes.

CHAPTER II:
Climate Change and
FRESHWATER
RESOURCES
[SEAMEO SEAMOLEC and SEAMEO RECSAM]

CLIMATE CHANGE AND FRESHWATER RESOURCES
52
SEAMEO
Chapter ll
What Are Freshwater Resources?
When we say freshwater resources, we mean two things: groundwater and surface
water (Figure 2.1). Groundwater consists of aquifers and underground streams
which give us fresh water to drink and to grow our crops and animals. People living in
the desert and urban areas rely mainly on the groundwater as their only source of
freshwater (Stone, n.d.). Freshwater supplies water for drinking, agriculture,
sanitation, transport and many others.
Freshwater also creates ecological or environmental area for a various range of
animals and plants in all over the worlds. Major facts of freshwater nowadays are as
follows (Hinrichsen, Robey & Upadhyay, 1998).
Around 70% of the Earth's surface is covered with oceans and account for
97% of its water.
Approximately 3% of all water on Earth is fresh water and most of it is frozen
in the polar ice caps.
Only about 1% of all water found on this planet is easily accessible for human
use.
Surface water, on the other hand, consists of rivers, lakes, streams, wetland, ponds,
etc. Lakes and rivers provide habitat for all the plants, fishes, and other organisms
that live in them.
Figure 2.1 Groundwater and surface water
Source: Wikipedia (2010)
A very significant freshwater resource in Southeast Asia is the Mekong River. It
provides food and income to millions of peoples from China, Myanmar, Laos,
Thailand, Cambodia, and Vietnam (International Rivers, n.d.). The Mekong River is
home to giant fishes, like the giant freshwater stingray (Figure 2.2) and the Mekong
giant catfish (Figure 2.3).

CLIMATE CHANGE AND FRESHWATER RESOURCES
53
SEAMEO
Chapter ll
Figure 2.2. Giant fresh water stingray. (Maximum Size: 600kg, 500cm length, 240cm disc width) Source: Hogan (2010)
Figure 2.3 Giant catfish in Mekong river (Maximum size: 300kg, 300cm)
Source: Kritsanavarin (2005)
How Does Climate Change Affect Our Freshwater Resources?
Drought
Less water. As the temperature gets warmer, the productivity of our freshwater
resources will likely be reduced. When drought occurs, we will have lesser drinking
water supply (Figure 2.4). Water in the lakes and rivers will be warmer and endanger
the lives of the fishes and the plants with which they feed on.

CLIMATE CHANGE AND FRESHWATER RESOURCES
54
SEAMEO
Chapter ll
Decreased water oxygen. The rise in water temperatures corresponding increases
microbial populations in water, which negatively affects to all life forms. More
microbes in the water means lesser dissolved oxygen. When water warms, its ability
to hold oxygen decreases (Curseu, Popa & Sirbu, 2009). Decreased oxygen in water
endangers the lives of fishes and freshwater plants.
Figure 2.4 Impact of Changes in Climatic Variables to Water in Major SEA
Countries
Fishes and plants die. Warm water temperatures affect fishes because they do not
have the ability to adjust their bodies to external temperature like humans do, any
sharp increase or decrease in water temperature will either kill them or push them to
look for other lakes with temperatures more suitable for them. This is currently
happening in the Mekong Delta. A number of fishes have not been seen in recent
years because of the increase in
temperature. As fishes disappear,
farmers’s income will
correspondingly decrease.
Flooding
Contaminated water. On the other
hand, flooding can contaminate our
drinking water supply because of the
microbes (Curseu et al., 2009) and
other pollutants it brings. These are
mixed into our public water supply
(MSDH, n.d.). When we drink
polluted water, we are prone to
intestinal infections.
Flooding occurred in Indonesia on
February 2, 2007 (Figure 2.5). This
affected 80 districts (WHO, 2007).
CLIMATE VARIABLES
Increase temperature
and heatwaves
Increase/decrease
rainfall
Increase in potential
evaporation and
precipitation
IMPACTS
Reduction in
available water per
consumptive use
(potable),
commercial/industrial
and agricultural
Floods and Droughts
Declining water
quality
Figure 2.5 Jakarta Floods 2007 Source: Flickr.com ( n.d.)

CLIMATE CHANGE AND FRESHWATER RESOURCES
55
SEAMEO
Chapter ll
What Can We Do To Save Our Freshwater Resources?
Educating people. To strengthen the desire of people to preserve their environments,
habitats and ecosystems from destructive actions, they would need to be exposed
constantly with lessons which explain or remind them of interconnectedness of
human based activities with the environment and its vulnerability to climate change.
Expectedly, with critical and participative environmental education actions, tackling
cross-sectoral and interdisciplinary subjects can motivate a responsible attitude in
young people with regard to face the global socio-environmental challenges (The
Charter of Human Responsibilities, 2010).
Developing Policies. At the regional level, Southeast Asian countries can join
together in protecting our freshwater resources by developing and strictly
implementing the following sustainable land and water policies:
Implementing reforestation of mountains and along rivers, lakes and all water
bodies
Promoting the use of organic fertilisers to reduce use of harmful substances
in the farms
Practising proper solid waste management
Banning the use of harmful and/or poisonous substances to catch fish
Regulating the permits to extract ground water with the use of electric pumps
Collecting rain water and storing this for multiple purposes (industry,
agriculture, etc.)
Other measures to mitigate the impacts of climate changes on the availability of fresh
water (Wilk & Wittgren, 2009) include:
1. Increasing water supply by:
expanding rainwater collection system and filter it to provide water and
groundwater recharge
building water storage facilities
2. Increasing water-use efficiency and decreasing demand by:
water recycling to improve water-use efficiency
spreading of drought-resistant crops
improving irrigated agriculture management (e.g., changing the cropping
calendar, irrigation method, crop mix, repair and maintenance of irrigation
infrastructure, etc)
providing benefits and/or economic incentives to encourage water
conservation
improving urban water and sanitation infrastructure

CLIMATE CHANGE AND FRESHWATER RESOURCES
56
SEAMEO
Chapter ll
3. Improving flood protection by:
restoring and maintaining wetlands
improving flood forecasting
expanding river areas
constructing flood protection infrastructure
4. Reducing pollution reduction by:
using renewable and/or alternative energy sources that are
environmentally friendly (e.g. use of biofuel);
recycling all materials that can be reused;
Conserving energy and contributing to keep the air clean (not using
aerosol sprays, putting off equipment like computers when not using them
etc).
5. Applying integrated and holistic watershed management system by:
developing springs (accumulate the flowing water underground to protect
it from surface contamination)
implementing integrated and appropriate land use planning
implementing appropriate conservation techniques (terracing, mulching,
ridge, furrow planting, and contour planting);
implementing conservation farming systems (strip cropping, multiple crops
farming systems including fish and/or livestock);
employing proper soil management techniques (contour planting, contour
tillage);
building grass waterways, drainage ditch, diversion ditch, efficient
irrigation systems and building of check dams/water entrapment
structures at proper sites.
Conclusion
Conserving the security of water resources is a primary issue for the Southeast Asian
countries especially for the rural population. Climate change has worsened and
accelerated water shortage by extreme events such as droughts which threaten food
security and extreme rainfall conditions which cause flooding.
Some regions relying on limited groundwater and rainfall collection have already
encountered water stress. To handle water stress, Southeast Asian countries need to
aggressively restore groundwater and surface water resources. This can be done by

CLIMATE CHANGE AND FRESHWATER RESOURCES
57
SEAMEO
Chapter ll
continuously educating communities to enable them to fully understand the impacts
of climate change.
Education cannot stand alone. Southeast Asian countries must develop and
implement policies on sustainable management and rehabilitation of freshwater
resources. Strict implementation of these policies will ensure sustainable freshwater
supply for all the countries of Southeast Asia.

CLIMATE CHANGE AND FRESHWATER RESOURCES
58
SEAMEO
Chapter ll
REFERENCES
Curseu, D., Popa, M., & Sirbu, D. (2009). Climate change impact on water resources
and life quality. Paper presented at the 13th International Water Technology
Conference (IWTC), Hurghada, Egypt, 12-13 March 2009. Retrieved from
http://www.iwtc.info/ 2009_pdf/1-7.pdf
Flickr. Com. (2007). Jakarta floods 2007. Retrieved on 20 October 2010 from
http://www. flickr.com/photos/javajive/389792884/ Kritsanavarin, S.,2005. Giant Catfish. Retrieved on 20 October 2010 from
http://www.lightstalkers.org/images/show/418201 Hinrichsen, D., Robey, B., & Upadhyay, U.D. (1998). Population reports: Solutions for
a water-short world. Retrieved from http://info.k4health.org/pr/m15/m15.pdf Hogan, Z., 2010, Giant Fresh Water Stingray; Megafishes Project. Retrieved on 20
October 2010 from http://animals.nationalgeographic.com/animals/fish/about-megafishes-project/
International Rivers. (n.d.). Southeast Asia. Retrieved on 20 October 2010 from
http://www. internationalrivers.org/en/southeast-asia
Mississippi State Department of Health (MSDH). (n.d.). Water quality. Retrieved on
25 October 2010 from
http://www.msdh.ms.gov/msdhsite/_static/44,402,122,292.html
Stone., B. (n.d.). The importance of aquifers. Retrieved on 20 October 2010 from http://www. helium. com/items/1324522-aquifers
The Charter of Human Responsibilities. (2010). Sustainable development and
climate change education. Retrieved from http://www.charter-human-
responsibilities.net/spip.php? article 2064
Wilk, J., & Wittgren, H.B. (eds). (2009). Adapting water management to climate change. Swedish Water House Policy Brief Nr. 7, SIWI. Trosa, Sweeden: Trosa Tryckeri. Retrieved from http://www.swedishwaterhouse.se/swh/resources/1250679072664 Policy_Brief_ Water_and_Climate.pdf
WHO (World Health Organization). (2007). Floods in DKI Jakarta Province. Retrieved
on 14 September 2010 from
http://www.searo.who.int/LinkFiles/EHA_ESR_02_Floods-DKI.pdf
Wikipedia Free Encyclopedia, 2010. Groundwater flow time usgs cir1139.png.
Retrieved on Oct. 26, 2010 from
http://en.wikipedia.org/wiki/File:Groundwater_flow_times_usgs_cir1139.png

CLIMATE CHANGE AND FRESHWATER RESOURCES
59
SEAMEO
Chapter ll
Lesson 1
THIRST FOR MORE!
(Impact of Climate Change on Freshwater Availability and Accessibility)
GRADE LEVEL: Second Year High School (14-16 years old)
SUBJECT: Mathematics
TOPIC: Direct and Inverse Variations
PREREQUISITE
Students should have enough background on linear equations and quadratic
equations and prior knowledge on linear relationships and ratios.
DURATION: 1 session
LEARNING OBJECTIVES
Subject Matter Objectives: By the end of this lesson, the students should be able to:
differentiate direct variation from inverse variation;
solve problems on direct and inverse variations; and
determine relationships that exist between the following paired quantities:
temperature level and amount of available freshwater resources
amount of precipitation and the amount of water supplies in a certain
area
Climate Change Objectives
explain how climate change affects water resources in terms of quality,
quantity and availability; and
identify ways and means on how to help save water especially during dry
seasons.
MAIN CONCEPTS AND SKILLS
Direct variation is a relationship of two quantities x and y such that y
varies directly as x. In symbol, kxy , where k is the constant of variation
Inverse variation is a relationship between two quantities x and y such
that y varies inversely as x. In symbol, y= k/x where k is the constant of
variation.
The higher the temperature, the greater the amount of water that is lost
from the earth’s surface and returned to the atmosphere through
evaporation and transpiration, collectively known as evapotranspiration.

CLIMATE CHANGE AND FRESHWATER RESOURCES
60
SEAMEO
Chapter ll
Climate change will lead to more precipitation but could also lead to more
evaporation.
Precipitation greatly influences the amount of water flowing through the
water cycle and, consequently, water availability. Changes in rainfall
patterns are likely to lead to severe water shortage and/or flooding.
Generally, the higher the precipitation, the more water is available. On the
other hand, low precipitation and drought reduce water supply.
The relationship existing between variables can be better understood by
differentiating inverse variation from direct variation
The analysis and proper interpretation of data on water consumption
could help raise the awareness of the local community on the current
state of freshwater resources in the community.
There are various ways and means to help save water.
MATERIALS NEEDED
Pictures of dams during rainy season and during dry season, pictures
showing flood and drought
Local data on water consumption per household for a year
Water bill per student, if available and worksheets
PRESENTATION OF THE LESSON
Scenario
The teacher will show two main pictures. The first is a picture showing a dam
during rainy season where the water level is at its maximum. Then show
another picture showing the same dam but during dry season or during
drought where the water level is very low. In addition, the teacher will show
new set of pictures depicting flood and drought. After posting the pictures, the
students will be asked to answer the following:
1. What facts do we know about the first picture? The second and third
pictures?
2. What seems to be the main difference from the three pictures? What is
common?
3. What do you think are some factors that cause the water level of the dam
to decrease?
4. What will happen to the water level in the dam as the number of days
without rain increases?
5. What do you observe during a drought?

CLIMATE CHANGE AND FRESHWATER RESOURCES
61
SEAMEO
Chapter ll
6. What do you think will happen to the quality of water when there is flood in
the area?
7. Can you give some phenomena where you can point out some of its
possible causes?
Discussion Notes
The countries in Southeast Asia are already facing water stress, and
most areas in this region are often dependent upon limited
groundwater and rainfall collection. Climate change will further
aggravate water shortage by extreme events such as droughts which
undermine food security, or extreme rainfall events which increase the
risk of flooding.
8. Identify two quantities showing the following relationships:
a. When one increases, the other also increases.
b. When one decreases, the other increases.
Student Activities
There are many things in the real world that may vary or change which
depend on its relationship to other things. In Mathematics we call this
variation. In this lesson, the students will undergo three group activities to
gain better understanding and appreciation of direct and inverse variations.
First, they will analyse the water consumption of their family using their
monthly water bills. Secondly, they will determine the amount of water usage
of a certain population (community) and, lastly, the water levels of a certain
dam after 24 days of drought. In each of the activities, they will describe the
relationships of the two variables using the equation form and by graph. They
will analyse the constant of variation k in each of the activities. The students’
worksheet will be provided to guide the students. (See Attachment 2.1.1)
Process Guide for the Teacher
a. Assign two or three groups to present and discuss their answers together
with the rest of the class for 3 minutes per group.
b. Discuss some other relationships of two quantities showing direct
variation and inverse variation.
c. Provide coaching to students in determining the constant of variation k in
each of the activities.
d. Allow each group to present the results of the activity. They will also
discuss their answers to the guide questions as provided on the students’
worksheet.

CLIMATE CHANGE AND FRESHWATER RESOURCES
62
SEAMEO
Chapter ll
e. Facilitate the class discussion by asking a few more questions that will
help them connect the concept of variation in relation to water
consumption or water resource utilisation.
Where does your community get your water supply for drinking? Do
you think it will last for many more years?
List down how you utilise your water and estimate the amount of water
used in each using cubic meter.
f. In each activity, ask the students to identify the variables that show
inverse relationship and variables that show direct relationship. Then
show them how to solve for the constant of variation.
Example of Direct Variation: Activity 2
As x increases, the value of y also increases.
To solve for the constant of variation:12
12
xx
yyk
120034
36004800k
The equation is y = 1200x.
Example of Inverse Variation: Activity 3
As x increases, the value of y decreases. The
product of x and y is a constant. To solve for the
constant of variation: k = xy
Thus, equation isx
ky .
Therefore, the equation of the relationship of the water level (y) and the
number of days (x) is given by the equation,
xy
1152.

CLIMATE CHANGE AND FRESHWATER RESOURCES
63
SEAMEO
Chapter ll
Achieving the Objectives
Assessment
Instruction: In each of the following,
1. Identify the kind of variation
2. Find the constant of variation
3. Write the equation representing the relationship of x and y
4. Fill up the remaining entries in each table:
a)
x 7 6 5 8
y 21 18 15 9
b)
x 2 4 8 9 11
y 26 13 6.5
5. Solve the following:
a) If y varies as x, y = 1 when x = 3, and y = 4 when x = 12. Find y when
x is 18.
Objective This is achieved by
To differentiate direct variation
from inverse variation.
Students will analyse the water consumption
of their family using the monthly water bills;
they will determine the amount of water usage
of a certain population and the water levels of
a certain dam after 24 days of drought.
To solve problems on direct and
inverse variations
Students will solve problems on variations by
finding the constant of variation and writing the
equation.
Objective This is achieved by
To identify the kind of
relationships existing between
two quantities.
In Activities 1 & 2, they will describe the
relationships of the two variables using the
equation form and by graphing and finding the
constant of variation k.
To identify ways and means on
how to help save water
especially during dry season.
Students will identify some water phenomena
that affect its quality, quantity and accessibility.
They will list down some of its possible causes
and identify ways to use water wisely.

CLIMATE CHANGE AND FRESHWATER RESOURCES
64
SEAMEO
Chapter ll
b) If y varies inversely as the square of x and y = 1 when x = 2, and y = 4 when x = 1. Find x when y is 9.
Assignment
Identify some activities in your community that may help conserve water.
Interview at least five (5) people and ask them some of the activities that they
do to minimise shortage of potable water.
Closure Activity
Provide a short summary of the lesson on variation by asking the students
to differentiate inverse variation from direct variation. Make copies of
Attachment 2.1.2 for the students.
Ask the students to make a poster that will help people to be aware of
climate change and how it affects the quality, quantity, and accessibility of
water supply. On their posters, they will list down some innovative
activities that may minimise the impact of climate change on water quality,
quantity and accessibility.
DISCUSSION POINTS
Impact of Climate Change on Quantity of Water
For many regions of the globe, future climate change will be characterised by less
rainfall and increasing temperatures. This has severely reduced the availability of
water for drinking, household use, agriculture, and industry. Unfortunately, many of
these areas also include the world’s poorest countries, which already struggle under
existing water stress.
Impact of Climate Change on Quality of Water
Changes in the amounts or patterns of precipitation will change the route/residence
time of water in the watershed, thereby affecting its quality. As a result, regardless of
quantity, water could become unsuitable as a resource. Higher ocean levels will lead
to salt water intrusion in groundwater supplies, threatening the quality and quantity of
freshwater access to large populations.
Impact of Climate Change on Accessibility of Water
As water quantities and quality decrease, competition for available resources will
intensify. Agriculture has always been the dominant end-use of diverted water; this
will only intensify with increasing needs for irrigation brought on by higher
temperatures and reduced precipitation, coupled with increasing populations.
Meanwhile, demands of industry are expected to become a greater issue in the
competition for dwindling resources, since industrial water supplies are generally
extracted from groundwater. In the event of decreasing water tables, industrial needs
will be forced to compete with agricultural and domestic water supply sources, and
could lead to conflict.

CLIMATE CHANGE AND FRESHWATER RESOURCES
65
SEAMEO
Chapter ll
RESOURCES
Climate Change Could Deepen Poverty In Developing Countries, Study Finds. (2009, Aug 21). Science Daily. Available:http://www.sciencedaily.com/releases/2009/08/090820082101.htm
Global Climate Change: Key Indicators (2010). Retrieved from
http://climate.nasa.gov/keyIndicators/index.cfm
Impact of Climate Change to Potable Water Fresh Resources. (2010). SEAMEO
Regional Open Learning Center (SEAMEOLEC).
Posamentier, A. S. (1995). Teaching Secondary School Mathematics, 4th ed. New
Jersey: Prentice Hall, Inc.

CLIMATE CHANGE AND FRESHWATER RESOURCES
66
SEAMEO
Chapter ll
Attachment 2.1.1
Students’ Worksheet
WATER METRICS
Activity 1: THE WATER BILLS
Instruction: Compare the water consumptions using the monthly water bills of
your respective families. Record the average monthly consumption in cubic
meters in each family and the number of members in the family using the
following table:
Family
1
Family
2
Family
3
Family
4
Family
5
Family
6
No. of Family Members
Monthly water
consumption in cubic
meters (m3)
Guide Questions:
1. What do you notice about the monthly consumption and the number of
members in the family?
2. Identify some reasons why there are some families with equal number
of members but different amount of water consumption. List possible
ways in which each family is using the water.
3. Graph the water consumption in relation to the number of members in
the family. Describe the graph.
4. In general, how does the number of members in the family relate to
the amount water consumption per month?
Activity 2: THE WATER USERS
Suppose that in a certain city, the following data is obtained showing its
population in thousand and its corresponding amount of water usage, in cubic per
meter per day.
Population in thousands (x) 3 4 7 12
Amount of potable water
needed in cubic meters (m3)
per day (y)
3600
4800
8400
?

CLIMATE CHANGE AND FRESHWATER RESOURCES
67
SEAMEO
Chapter ll
Guide Questions:
1. Describe the relationship of the two quantities x and y in words.
2. How much water is needed for twelve (12) thousand people?
3. Write the relationship of x and y in equation form.
4. Draw its graph. What do you observe about the graph as the values of x increases?
5. Using the graph, can you predict the amount of water needed in 20 years?
Activity 3: THE DAM LEVELS
Suppose that the following table shows the water levels of the dam as
recorded in interval number of days during months of drought in 2010.
No of days from January 31, 2010 (x) 8 12 18 24
Water Level in Meters (y) 144 96 64 ?
Guide Questions:
1. Describe the relationship of the two quantities x and y in words.
2. What is the water level after 24 days? Show your solution.
3. Write the relationship of x and y in equation form.
4. Draw the graph. What do you observe about the graph as the values
of x become larger?

CLIMATE CHANGE AND FRESHWATER RESOURCES
68
SEAMEO
Chapter ll
Attachment 2.1.2
THINGS I KNOW TO BE TRUE
(Direct and Inverse Variations)
Name ______________________________________________ Date __________
These Things I Know to be True… about Direct Variations
___________________________________________________________________
___________________________________________________________________
___________________________________________________________________
___________________________________________________________________
___________________________________________________________________
These Things I Know to be True… about Inverse Variations
___________________________________________________________________
___________________________________________________________________
___________________________________________________________________
___________________________________________________________________
___________________________________________________________________
These Things I Know to be True… about Climate Change and its Impact
on Water Resources
___________________________________________________________________
___________________________________________________________________
___________________________________________________________________
___________________________________________________________________
___________________________________________________________________

CLIMATE CHANGE AND FRESHWATER RESOURCES
69
SEAMEO
Chapter ll
Lesson 2
FRESHWATER AT RISK!
(Impact of Climate Change on Water Quality)
GRADE LEVEL: High School (16-18 years old)
SUBJECT(S): Physical Science, Chemistry
TOPIC: Separating Mixtures
PREREQUISITE
Students should have prior knowledge about the difference between
elements, compound and mixture. They can differentiate a solute from a
solvent.
Before conducting this lesson, the teacher will collect freshwater samples
from nearby water sources (e.g., river, stream and lake)
DURATION: 2 sessions
LEARNING OBJECTIVES
Subject Matter Objective: By the end of this lesson, students should be able to:
describe and explain the different techniques in separating mixtures.
cite the importance of these techniques in purifying water.
Climate Change Objectives
explain how climate change affects the freshwater resources.
demonstrate different measures to maintain quality of freshwater resources.
MAIN CONCEPTS AND SKILLS
Water shortage is one of the effects of climate change. The distribution of
precipitation in different areas will become very uneven, leading to
tremendous disproportion in water supply.
Climate change affects the rate of evaporation which impacts the amount of
water available to replenish groundwater supplies. The combination of shorter
duration but more intense rainfall (meaning more runoff and less infiltration)
combined with increased “evapotranspiration” (the sum of evaporation and
plant transpiration from the earth's land surface to atmosphere) and increased
irrigation is expected to lead to groundwater depletion.
Natural freshwater sources have very limited capacity to process the pollution
coming from expanding urban, industrial and agricultural uses. In effect, the
degradation of the quality of fresh water can be a major source of water
shortage.

CLIMATE CHANGE AND FRESHWATER RESOURCES
70
SEAMEO
Chapter ll
Water quality degradation can be reduced through the separation of mixtures
of nutrients, pathogens and pollutants that are present in a polluted or
contaminated water.
Students can create a model for separating mixtures using various techniques
and thereby learn how to improve water quality.
MATERIALS NEEDED
fresh water samples, filter paper, 100 ml beakers, evaporating dish,
alcohol lamp
funnel, iron ring with stand, glass tube, ethyl alcohol, stirring-rod,
condenser
simple distillation set-up, activated charcoal, student’s worksheet
surface run-off and infiltration poster (see Fig. A on page 72)
PRESENTATION OF LESSON
Scenario
The teacher will obtain a glass of tap water, show it to the class, and then ask
the students the following questions.
1. What qualities do you expect in a drinking water?
2. Why is it important to have safe tap water?
3. What common problems do you observe from the sources of freshwater in our school, at home and in the community?
4. What causes the degradation of water quality?
5. How can we possibly eliminate the presence of contaminants in freshwater?
The teacher will take note of the responses to be given by the students on the
board and summarise the discussion using these concepts:
1. Water quality refers to how appropriate a particular ecosystem’s water
is for some “use,” whether biological or economic. Many fish species,
for instance, have narrow habitat quality preferences for dissolved
oxygen, water temperature, dissolved sediment, and acidity/pH.
Humans generally avoid freshwater for drinking or cooking if it has
excessive levels of dissolved minerals or has a very high or low
acidity/pH.
2. Water is indispensable for all forms of life. It is needed in almost all
human activities. Access to safe freshwater is now regarded as a
universal human right and the Millennium Development Goals include
the extended access to safe drinking water and sanitation.

CLIMATE CHANGE AND FRESHWATER RESOURCES
71
SEAMEO
Chapter ll
3. Some of the common problems we have are: decreasing freshwater
quality, contaminated drinking water, and freshwater scarcity.
4. Some reasons for the decline in water quality are: An increase in
precipitation carries with it higher levels of nutrients, pathogens and
pollutants. These contaminants were originally stored in the
groundwater reserves but the increase in precipitation flushes them
out into the discharged water. Water quality degradation can be a
major cause of freshwater scarcity.
5. There are different methods that people can apply to separate the
contaminants in water. Hence, this lesson focuses on knowing how to
separate mixtures.
Student Activities
The students will use the different techniques in separating mixtures using the
fresh water samples from the different bodies of water in the community. See
student’s worksheet (Attachment 2.2.1) for details. (Note: Use a group
performance rubric to assess the groups’ output)
Each group will be given a chance to present their findings for class
discussion.
Process Guide for Teachers
1. Conduct a brief explanation on the following techniques in separating mixtures.
Evaporation – a process in which surface molecules in liquid phase
becomes gas molecules (water becomes water vapour). The process
takes place faster when heat is absorbed by the liquid molecules.
Filtration – a process of separating the solid and liquid components of a
mixture. This is accomplished by the use of porous medium of the desired
porosity so that the solid or precipitate is retained in the porous medium
while the liquid filtrate passes through the pores of the medium.
Decantation - is a process for the separation of mixture. This is achieved
by carefully pouring a solution from a container in order to leave the
precipitate sediments at the bottom of the original container. A small
amount of solution must be left in the container, and care must be taken
to prevent a small amount of precipitate from flowing with the solution out
of the container. It is generally used to separate a liquid from an insoluble
solid.
Distillation – the process of separating substances of different boiling
points from one another by vapourisation and condensation, usually done
to separate solute from solvent.

CLIMATE CHANGE AND FRESHWATER RESOURCES
72
SEAMEO
Chapter ll
2. Present the freshwater samples collected from the different bodies of water in
the nearby area.
3. Allow the students to observe the given water samples focusing on quality of
water particularly the odour and appearance.
4. Distribute the student’s worksheet and present the pre-cautionary measures
in separating mixtures.
5. Divide the students into working groups to perform the different techniques in
separating mixtures using the freshwater samples.
6. Supervise the students during the activity. Ask the group leaders to evaluate
the performance of the members using a performance rubric.
7. After the group activity, the class will have a plenary presentation of the
outputs. A representative from each group will present the results.
8. Lead the discussion to the answers given by the students at the start of the
lesson. The focus of the discussion should be on water safety, water sources
and the effects of climate change on water supply.
Guide Questions
a. What causes the shortage of freshwater supply?
b. How can the people mitigate the effects of climate change on freshwater
resources?
Discussion Points
a. Changes in water supply include changes in precipitation, increased flooding,
and sea-level rise, higher temperatures, due to global climate change,
negatively impact the amount of total water in the hydrologic system and,
thereof, reusable water. Evaporation, the process by which water goes into
the air, is increasingly becoming a major factor in potable water loss. Simply,
if water is not on the ground in liquid form it cannot be used for drinking. Its
change affects freshwater quantity and quality with respect to both mean
states and variability (e.g., water availability as well as floods and droughts).
b. Some of the approaches to mitigate the impact of climate change on the
availability of fresh water.
Increasing water supply and ecosystem services.
Decreasing water demand and increasing use/efficiency.
Improving flood protection.
Reducing pollution using alternative, renewable, and environmentally
friendly energy sources whenever possible, recycling all appropriate
materials that can be reused, and conserving energy and taking steps
to keep the air clean.

CLIMATE CHANGE AND FRESHWATER RESOURCES
73
SEAMEO
Chapter ll
Applying integrated and holistic watershed management system.
9. Present the surface run-off and infiltration poster to the class to guide them in
understanding how climate change affects the supply of freshwater.
Figure A Surface Run-off and Infiltration Diagram
Source: http://www.isws.illinois.edu/docs/watercycle/images/hcycle.jpg
Discussion Notes
Groundwater plays a central role in all the changes of the earth system and in
the impacts of climate change on the various sectors of activity. This century,
annual runoff and water availability are projected to increase at high latitudes
by 10–30% but decrease by 10–30% at mid-latitudes and in the dry tropics.
Drought-affected areas will likely increase in extent. Poor communities will be
especially vulnerable because they are more dependent on climate-sensitive
resources.

CLIMATE CHANGE AND FRESHWATER RESOURCES
74
SEAMEO
Chapter ll
Achieving the Objectives
Objective This is achieved by
Describe and explain different techniques in separating mixtures.
Students’ interaction within the group
during the conduct of the hands-on
activity.
Students’ presentation of the different
techniques in separating mixtures.
Cite the importance of these
techniques in purifying water.
Students presenting their outputs in front
of the class.
Explain how climate change affects the freshwater resources.
Sharing of students’ experiences during
the class discussion on shortage of
freshwater supply and climate change.
Assessment
Performance assessment: This will be conducted during the performance of
the assigned activity. The teacher will utilise a performance rubric.
Formative assessment: In a clean sheet of paper, the students will do the
following:
a. Label each of the figures with the corresponding technique used. Describe and
explain the physical properties illustrated by each technique:
1. Evaporation 2. Filtration 3. Decantation 4. Distillation
b. Write 3 measures that will help mitigate the effects of climate change on the
quality of fresh water supply.

CLIMATE CHANGE AND FRESHWATER RESOURCES
75
SEAMEO
Chapter ll
Closure Activity
To emphasise the key learning points, and as a means to check whether the
students gave the correct answers on the assessment test, the teacher will pose
the questions:
How is drinking water treated to make it safe?
Why is it important to maintain water quality at all times?
In our own little way, how can we help in mitigating the effects of climate
change on freshwater resources?
RESOURCES
Conrad, L.S., Eubank, L. P., Middlecamp, C. H., Pienta, N. J. & Stratton, W. (2003).
Chemistry in Context: Applying Chemistry to Society. 4th Edition. Mc Graw Hill
Companies.
Evaporation. (2008). Retrieved from
http://www.ssc.education.ed.ac.uk/bsl/pictures/evaporation.jpg
How to separate sand from water. (2010). (http://www.tutorvista.com/chemistry/how-to-separate-sand-from-water.)
Kundzewicz, Z.W., Mata, L.J. , Arnell, L.J. , Döll, P., Kabat, P., Jiménez, B., Miller,
K.A. , Oki, T., Sen, Z. & Shiklomanov, I.A. (2007). Freshwater resources and their management. Climate Change 2007: Impacts, Adaptation and Vulnerability. Contribution of Working Group II to the Fourth Assessment Report of the Intergovernmental Panel on Climate Change, Parry, M.L., Canziani, O.F., Palutikof, J.P., van der Linden, P.J. & Hanson, C.E. (Eds.), Cambridge University Press, Cambridge, UK, 173-210Impact of Climate Change on Access to Potable Water Freshwater Resources.
Water and climate change. Climate Institute. (n.d). Retrieved from
http://www.climate.org/topics/water.html
What is infiltration in the water cycle. (2006). Retrieved from http://www.isws.illinois.edu/docs/watercycle/images/hcycle.jpg
Chansigaud (2005). Retrieved from
http://en.wikipedia.org/wiki/File:Simple_chem_distillation.PNG Polimerik (2010). Retrieved from
http://en.wikipedia.org/wiki/File:Evaporating_dish.svg Padlekas (2005). http://en.wikipedia.org/wiki/File:Berlese.svg

CLIMATE CHANGE AND FRESHWATER RESOURCES
76
SEAMEO
Chapter ll
Attachment 2.2.1
Student’s Worksheet
TECHNIQUES IN SEPARATING MIXTURES
DECANTATION
EVAPORATION
1) Pour the sample mixture to
the evaporating basin or
beaker. See Figure b.
2) Heat the mixture until all the
liquid components
evaporate.
FILTRATION
1) Set-up a funnel lined with
filter paper on a stand. See
Figure c.
2) Pour the mixture through the
filter funnel. The filter will
trap the insoluble
substances. The liquid
passes through the filter
paper and collected in
another container.
1) Allow the mixture to stand
for sometime and wait for
the sediments to settle. See
Figure a.
2) Slowly pour the liquid into
the other container.
Figure b Evaporation
Source: Polimerek (2005)
Figure a Decantation
Figure c Filtration
Figure c Filtration
Source: Chansigaud (2005)

CLIMATE CHANGE AND FRESHWATER RESOURCES
77
SEAMEO
Chapter ll
3) Layers of gravel, sand, cotton wool and activated charcoal can also be
used as the filter.
SIMPLE DISTILLATION
1) Fill the distillation flask. See
Figure d. The flask should be
no more than two thirds full to
have a sufficient clearance
above the surface of the liquid
so that when boiling
commences the liquid is not
propelled into the condenser.
2) Heat the distillation flask slowly
until the liquid begins to boil.
Vapours will begin to rise
through the neck of the
distillation flask. As the
vapours pass through the
condenser, they will condense
and drip into the collection
receiver.
Figure d Sample distillation
Source: Padleckas (2005)

CLIMATE CHANGE AND FRESHWATER RESOURCES
78
SEAMEO
Chapter ll
Lesson 3
WANTED: SAFE DRINKING WATER
(Impact of Climate Change on Water Quality)
GRADE LEVEL: High School (15-18 years old)
SUBJECT(S): Earth and Environmental Science
TOPIC: Groundwater and Aquifer
PREREQUISITE
Students should have prior knowledge about the hydrologic cycle and the
different processes involved in the cycle.
DURATION: 2 sessions
LEARNING OBJECTIVES
Subject Matter Objectives: By the end of this lesson, students should be able to:
identify the major components of an aquifer
discuss the movement of water through an aquifer
explain how water storage in an aquifer changes over time
Climate Change Objectives
appreciate the importance of water cycle on earth
explain how climate change affects the freshwater resources
demonstrate different measures to maintain quality of freshwater resources
MAIN CONCEPTS AND SKILLS
Water permeates life on Earth. Water is essential as an enabler and sustainer
both of life such as plants, animals, and humans, and of human civilization.
One of the conclusions after NASA's Mission on Mars was the urgent need to
pay increased interest on the importance of “water cycle for life on Earth” the
only planet where water can exist in liquid form.
An aquifer is an underground storage of water that people use as a fresh
water drinking supply. The water in an aquifer is stored in geologic
formations. Rocks which are porous can hold water much like a sponge holds
water. Aquifers have different zones: for collecting water, for water entering
the ground, and sometimes, for confining water.
Ground water is found in aquifers. Aquifers can be either unconfined or
confined. Unconfined (open) aquifers are "connected" to the surface above.
Confined (closed) aquifers are sandwiched in between dense impermeable

CLIMATE CHANGE AND FRESHWATER RESOURCES
79
SEAMEO
Chapter ll
layers of earth material called an aquiclude (aquitard). Ground water is
replenished by percolation of water from the zone of aeration downward to
the zone of saturation, or in the recharge zone of a confined aquifer.
Aquifers replenish their supply of water very slowly. The rate of ground water
flow depends on the permeability of the aquifer and the hydraulic gradient.
Permeability is affected by the size and connectivity of pore spaces while
hydraulic gradient is the difference in elevation between two points on the
water table divided by the horizontal distance between them.
Changes in precipitation, increased flooding, and sea-level rise could
decrease freshwater quality and potentially contaminate fresh water (drinking
water). Water quality degradation can be a major cause of freshwater
scarcity.
Longer periods of drought deplete groundwater reserves. The residual water
that remains is often of inferior quality. Similarly the decrease precipitation
and runoff results in a concentration of pollution in the water, which leads to
an increased load of microbes in waterways and drinking-water reservoirs.
Agricultural water use grew twice as rapidly as total water use and “there is
widespread over-exploitation of aquifers from irrigation; and over irrigated
agriculture are depleting groundwater resources beyond natural recharge
rates in Asia and “competition for water resources is also acute”.
Environmental impacts of water pollution are predicted to increase in most
trans-boundary water regions based on studies of Global International Waters
Assessment (GIWA 2007). If this will continue, the world is threatened by a
“hydrocide,” a circumstance in which the water accessible in rivers is no
longer fit for use. The Living Planet Index indicates that in a mere 30 years,
aquatic ecosystems have lost 50% (largest) of their biodiversity.
Disposal of wastewater, which is untreated in many parts of the world, has
resulted in considerable negative impacts on aquatic ecosystems. A rapid
industrial growth in semiarid regions (where the dilution effect is limited during
the dry season) is particularly problematic because relatively large volumes of
water are required, and the volume of effluents is correspondingly large.
MATERIALS NEEDED
large plastic cup per group and measuring cup
one (1) plastic cup of small gravel and 1 small cup of dry sand
modelling clay and pitcher of water
student’s worksheet (See Attachment 2.3.1), pictures of aquifer and
permanent markers

CLIMATE CHANGE AND FRESHWATER RESOURCES
80
SEAMEO
Chapter ll
PRESENTATION OF LESSON
Scenario
The teacher will ask the students: “Why do people buy bottled water despite
its relatively high cost compared to tap water?”
Make a list of answers given by the students. Highlight the answers which are
related to water quality and water safety. Then ask these follow up questions:
Where does drinking water come from?
What are the most common sources of drinking water?
Do you think that our tap water is safe for drinking?
Students’ Activities
The students will design a model that shows how an aquifer works using the
given materials. Each group will conduct a gallery presentation and explain
their aquifer model. The teacher will use a group performance rubric to
assess their outputs. (See Attachment 2.3.2)
Process Guide for Teachers
1. Distribute pictures of a typical aquifer to the students. Ask them to study the sample picture below and analyse the direction of the groundwater flow.
Source: http://en.wikipedia.org/wiki/File:Aquifer_en.svg

CLIMATE CHANGE AND FRESHWATER RESOURCES
81
SEAMEO
Chapter ll
2. Conduct a brief presentation about the different parts of an aquifer. Relate
the discussion on the relevance of aquifer as a major source of
groundwater/freshwater resources.
3. Divide the class into working groups and distribute the student’s
worksheets and other materials. Instruct the group to brainstorm on a
model of aquifer out of the given materials. Ask the group to make a
simple sketch of their model.
4. Before trying the actual model the group must present a sketch to their
teacher for comment and advice.
5. After preparing the aquifer models, the class will conduct a gallery
presentation. Each group will showcase their model aquifer. There should
be at least two students per group who will act as the leaders of the
group. The students will move around the class to observe the gallery and
interact with their fellow students by giving feedback and/or ask for
clarification about the model aquifer.
6. After the gallery viewing, convene the class into a single group and ask
for student’s reaction about the different models of aquifer. (Note: the
teacher may use an Aquifer Model Rubric to grade the groups’ output.
(See Attachment 2.3.3)
a. Which group has the best model of aquifer?
b. Why did you say it is the best model?
c. What components are present in the best model? What are missing
from the rest of the models?
7. Process the students’ learning experiences using the guide questions
below:
a. How does water move through an aquifer?
b. How does an aquifer recharge its supply of water?
c. Is there a possibility that aquifers may be contaminated?
d. How can human activities seriously affect water quality in aquifers?
e. How does the aquifer react to climatic changes?
Discussion Notes:
Remember, everything (contaminants) that ends up on the ground
could end up in your drinking water - so be careful!
Whatever products you use, follow the directions and dispose of leftovers properly.

CLIMATE CHANGE AND FRESHWATER RESOURCES
82
SEAMEO
Chapter ll
Achieving the Objectives
Objective This is achieved by
Identify the major components of an
aquifer.
Class discussion about the
components of aquifer.
Discuss the movement of water
through an aquifer.
Creating/developing aquifer models.
Explain how water storage in an
aquifer changes over time.
Student’s interaction during the
gallery presentation and processing
of learning experiences.
Explain how climate change affects
the freshwater resources.
Class interaction and processing of
learning experiences.
Demonstrate different measures to
maintain quality of freshwater
resources.
Poster making about safe drinking
water
Assessment
Performance assessment: This will be conducted during the assigned group
activity. The teacher will utilise the group performance and aquifer model
rubric.
Formative assessment (Essay Questions): In a clean sheet of paper, the
students will answer the following questions:
1. What are the major components of an aquifer?
2. How does water move through an aquifer?
3. What causes the depletion of groundwater in the aquifer?
4. Cite at least two measures which can mitigate the effect of climate change
on the quality of our drinking water.
Assignment
Design a poster or project that will launch a campaign on safe drinking water
and the protection of surface and ground water as a source of potable water
for the community.
Look through your home and garage or shed for the inescapable assortment
of cans and bottles and boxes of leftover household cleaners, paints, stain
removal products, and automotive fluids of all sorts. If used in any other way
than for what they were intended, they are considered hazardous materials,

CLIMATE CHANGE AND FRESHWATER RESOURCES
83
SEAMEO
Chapter ll
and could harm our drinking water supply. Follow the directions and dispose
them properly.
Closure Activity
Using the aquifer models, present a simple demonstration about ground water
contamination such as seepage of water contaminants coming from domestic
and industrial sources.
Search for the source of your home’s drinking water. Then answer these
questions.
1. What type of water system services your home?
2. What is the primary source of that water system?
3. What can you say about the quality of that system’s drinking water?
DISCUSSION POINTS
Adaptation and Mitigation to Climate Change
Most climate change impacts will be hitting society through altered water-
related phenomena. As such, water plays a crucial role in the adaptation
efforts of the various socioeconomic sectors, in terms of managing altered
water availability, altered water demands, and increased water variability.
Increased rain variability is noted in many Southeast Asian countries and
seen as one of the signs of ongoing climate change. Improved ability to cope
with water variability will in fact be a key to successful adaptation to the
unavoidable impacts of climate change.
Some of the mitigation measures to save our freshwater resources that we
can take are as follows:
Septic system maintenance
Proper contaminant disposal and improving waste disposal techniques
Private well monitoring
Planting trees and protecting watersheds
Wise gardening practices such as:
o Using organic fertilisers that release nutrients slowly.
o Skipping fertilising altogether, or apply smaller amounts throughout
the year instead of one large application once a year.
o Planting less lawn area and introduce more planting beds for trees,
shrubs, groundcovers and/or perennials.

CLIMATE CHANGE AND FRESHWATER RESOURCES
84
SEAMEO
Chapter ll
o Increasing the organic matter in your soil. This will help to hold water
longer, reducing the need to water so frequently, which can lead to
over watering and leaching. A rule of-thumb for watering is: ½ inch or
less per hour to avoid runoff.
o Not using chemicals near open water such as streams, rivers or lakes.
o Reducing runoff to storm drains by not watering impermeable surfaces
such as concrete, asphalt or compacted ground.
o Keeping your plants healthy and avoid by planting disease and pest
resistant varieties.
o Using mulch or fabric covers to prevent weeds.
o Match plants with growing conditions by choosing plants adapted to
this climate (i.e. 18"+ precipitation per year) and shade tolerant plants
for shady areas.
o Using chemical methods as a last resort, and then choose the least
toxic compounds such as horticultural oils, soaps and botanical
insecticides.
o Installing drip irrigation to save water and save money.
For the sake of our children and grandchildren, take sustainable development seriously, by calling the attention of all sectors on the following development policies.
o Pollution must be stopped to secure usable raw water sources and
protect biodiversity of aquatic ecosystems, in the long term moving
toward a water pollution veto.
o Awareness of depletive water use involved in plant production is
essential, therefore water resources planning and management
approaches need to incorporate green water resources (soil moisture)
and green water use (evaporation).
o Groundwater has to be incorporated into water resources planning and
management because of its link to river flow.
o Water conservation (e.g., fix leaking pipes or toilets right away, use a
glass when brushing teeth instead of keeping the taps open)
o Water recycling (use treated wastewater for other uses such as
flushing the toilets.
o Keep rivers, lakes, and seas clean and safe for humans and other
organisms
o Promote sustainable use and protection of water resources to support
continued food production and quality of life for humans, domestic
animals, and wildlife through innovative approaches to assessing the

CLIMATE CHANGE AND FRESHWATER RESOURCES
85
SEAMEO
Chapter ll
vulnerability of the environment to management practices that involve
renewable resources considerations.
o Build stronger practical country-level NGO networks that represent the
wider water sector.
o Promote greater accountability in the water sector institutions.
RESOURCES
Andaya, C. V. (2008). Understandings the Earth through Environmental Science.
C&E Publishing, Inc.
Aquifer. (2010). Retrieved from
http://www.gulfallianceeducation.org/educatorresources_bytopic.php
Aquifer Definitions. (n.d). Retrieved from
http://www.paveroadsfirst.com/page/page/4914855.htm
Conrad, L.S., Eubank, L. P., Middlecamp, C. H., Pienta, N. J. & Stratton, W. (2003).
Chemistry in Context: Applying Chemistry to Society. 4th Edition. Mc Graw Hill
Companies.
Falkenmark, M. (2008). Water and Sustainability: A Reappraisal. Environment
Science and Policy Development. Retrieved from
http://www.environmentmagazine.org/Archives/Back%20Issues/March-
April%202008/Falkenmark-full.html
GIWA, (2007) Global International Waters Assessment (GIWA), Challenges to
International Waters: Regional Assessments in a Global Perspective, Final Report
Kalmar, Sweden. Retrieved on November 2, 2010 from
http://www.environmentmagazine.org/Archives/Back%20Issues/March-
April%202008/Falkenmark-full.html
Kundzewicz, Z.W., Mata, L.J. , Arnell, L.J. , Döll, P., Kabat, P., Jiménez, B., Miller,
K.A. , Oki, T., Sen, Z. & Shiklomanov, I.A. (2007). Freshwater resources and
their management. Climate Change 2007: Impacts, Adaptation and Vulnerability.
Contribution of Working Group II to the Fourth Assessment Report of the
Intergovernmental Panel on Climate Change, Parry, M.L., Canziani, O.F.,
Palutikof, J.P., van der Linden, P.J. & Hanson, C.E. (Eds.), Cambridge University
Press, Cambridge, UK, 173-210Impact of Climate Change on Access to Potable
Water Freshwater Resources.
Ritter, M. E. (2006) The Physical Environment: an Introduction to Physical
Geography. Retrieved from
http://www.uwsp.edu/geo/faculty/ritter/geog101/textbook/title_page.html
Scientists and educators working together to promote inquiry in the classroom. (n.d).
Retrieved from http://www.bsu.edu/web/fseec/pie/lessonplans.htm
Walker, P. & Wood, E. (2008). Hand-On General Science Activities with Real-life
Application Second Edition. John Wiley and Sons, Inc.

CLIMATE CHANGE AND FRESHWATER RESOURCES
86
SEAMEO
Chapter ll
Water and climate change. Climate Institute. (n.d). Retrieved from
http://www.climate.org/topics/water.html
Water quality and climate change. (n.d). Retrieved from
http://www.theclimatechangeclearinghouse.org/ResearchByTheFoundation/
WaterQuality and climateChange/default.aspx

CLIMATE CHANGE AND FRESHWATER RESOURCES
87
SEAMEO
Chapter ll
Attachment 2.3.1
Student’s Worksheet
THE MODEL AQUIFER
Objectives
By working in groups, you will:
design a model of an aquifer using the given materials;
discuss and share your ideas with the entire class during the gallery
presentation.
Materials
large plastic cup per group, measuring cup, 1 plastic cup of small gravel
1 small cup of dry sand, modelling clay, pitcher of water
masking tape and permanent markers
Procedure
1. Brainstorm on how you can use the following materials to demonstrate
how an aquifer works.
2. Draw a simple model of your aquifer. Include the appropriate labels.
3. Ask your teacher to check your model.
4. Execute your design using the given materials.
5. Prepare for a gallery presentation. Assign at least two students who will
act as lead of your group. The assigned leader will explain to the
audience how the model aquifer works.
6. After the gallery presentation, prepare for a plenary discussion.
7. At the end of the gallery presentation the class will select the best model.
Guide Questions
1. How does water move through an aquifer?
2. How does the aquifer recharge its supply of water?
3. Is there a possibility that aquifers may be contaminated?
4. What are the human activities that affect the quality of water in aquifers?
5. How does climate change affects the depleting groundwater in the
aquifers?
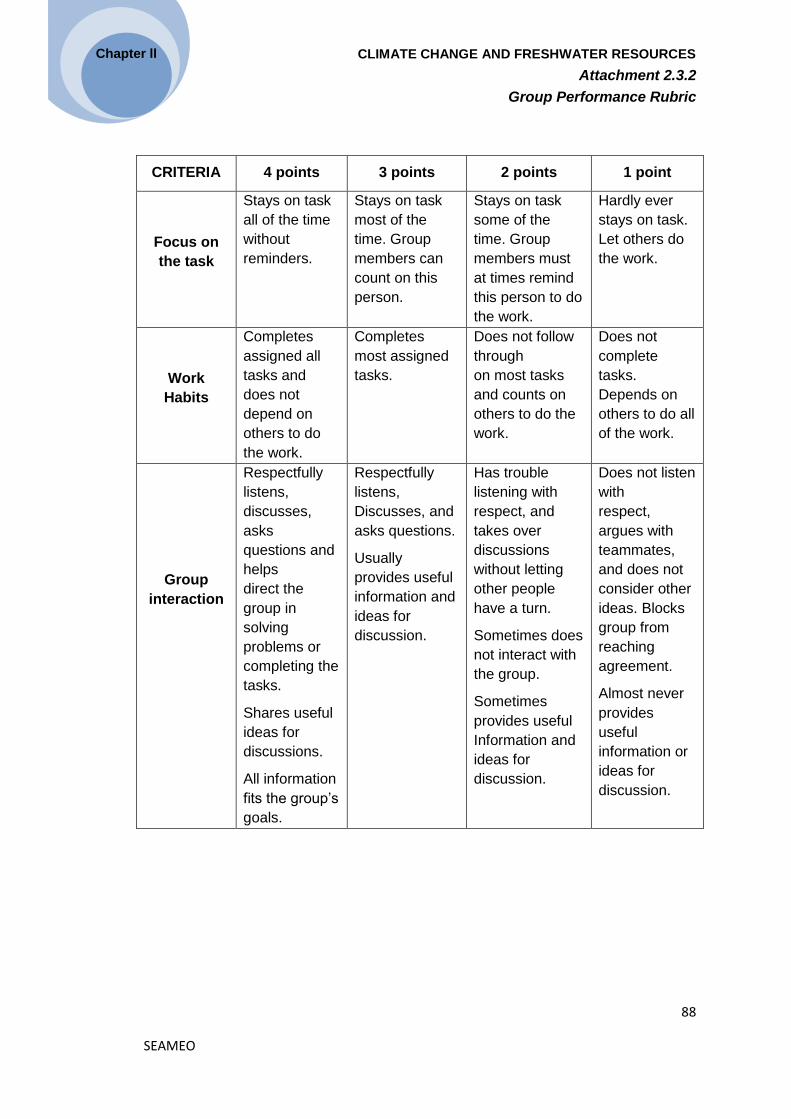
CLIMATE CHANGE AND FRESHWATER RESOURCES
88
SEAMEO
Chapter ll
Group Performance Rubric
CRITERIA 4 points 3 points 2 points 1 point
Focus on
the task
Stays on task
all of the time
without
reminders.
Stays on task
most of the
time. Group
members can
count on this
person.
Stays on task
some of the
time. Group
members must
at times remind
this person to do
the work.
Hardly ever
stays on task.
Let others do
the work.
Work
Habits
Completes
assigned all
tasks and
does not
depend on
others to do
the work.
Completes
most assigned
tasks.
Does not follow
through
on most tasks
and counts on
others to do the
work.
Does not
complete
tasks.
Depends on
others to do all
of the work.
Group
interaction
Respectfully
listens,
discusses,
asks
questions and
helps
direct the
group in
solving
problems or
completing the
tasks.
Shares useful
ideas for
discussions.
All information
fits the group’s
goals.
Respectfully
listens,
Discusses, and
asks questions.
Usually
provides useful
information and
ideas for
discussion.
Has trouble
listening with
respect, and
takes over
discussions
without letting
other people
have a turn.
Sometimes does
not interact with
the group.
Sometimes
provides useful
Information and
ideas for
discussion.
Does not listen
with
respect,
argues with
teammates,
and does not
consider other
ideas. Blocks
group from
reaching
agreement.
Almost never
provides
useful
information or
ideas for
discussion.
Attachment 2.3.2

CLIMATE CHANGE AND FRESHWATER RESOURCES
89
SEAMEO
Chapter ll
Aquifer Model Rubric
Source: Walker & Wood, 2008
CRITERIA 4
Excellent
3
Emerging
2
Developing
1
Needs
Improvement
Design for aquifer
meets these
criteria:
Uses prescribed materials
Sketch of design clear and neat
Design includes list of materials
Appropriate labels are present
4 of 4 items
present
3 of 4 items
present
2 of 4 items
present
1 of 4 items
present
Model constructed
as designed
Model follows
design
perfectly
Only very
minor design
flaws
Several
design flaws
Many design
flaws
Demonstrated and
described the flow
of water into the
aquifer
Demonstrated
and describe
fully the flow
of water into
the aquifer
Demonstrated
but failed to
fully describe
the flow of
water into the
aquifer
Demonstrated
but failed to
describe the
flow of water
into the
aquifer
Does note
demonstrate
and describe
the flow of
water into the
aquifer
Attachment 2.3.3

90
CHAPTER III: Impact of Climate Change on RISING SEA LEVEL AND SEA TEMPERATURE [SEAMEO BIOTROP, SEAMEO SPAFA and SEAMEO RECSAM]

Chapter lll IMPACT OF CLIMATE CHANGE ON RISING SEA LEVEL AND SEA TEMPERATURE
91
SEAMEO
Introduction
Until fairly recently the terms climate change and global warming were both used interchangeably as having the same meaning. This is no longer the case. We use the term climate change to indicate that there are other changes like precipitation or wind taking place in addition to rising global temperatures. Rising temperatures or global warming is one key component or factor amongst many that collectively constitute climate change which is caused by both natural and man-induced factors. For e.g., GHGs are both natural as well as industrial gases. They trap heat from the earth and warm the surface resulting in a rise in temperature, known as the greenhouse effect. The consequences of a warming world are shown Figure 3.1.
Figure 3.1 Ten Indicators for a Warming World, Past Decade Warmest on Record According to Scientists Source: NOAA (2010) There are 10 indicators of which three would decrease – glaciers, snow cover, and sea ice. Seven would increase which means an expected rise in sea surface temperatures as well as temperatures over land and oceans, in ocean heat content, in humidity and tropospheric temperatures. (The troposphere is the lowest portion of Earth’s atmosphere containing about 75% of the atmosphere’s mass) (NOAA, 2010).
Figure 3.2 shows how global warming will have significant impacts on nature and people and the interconnected cause/effect relationships. The largest impact will be on many natural ecosystems and on people who live in developing countries and
Tropospheric Temperature
Humidity
Temperature Over Oceans
Sea Surface Temperature
Temperature Over Land
Sea Level
Ocean Heat Content
Glaciers
Snow Cover
Sea Ice

Chapter lll IMPACT OF CLIMATE CHANGE ON RISING SEA LEVEL AND SEA TEMPERATURE
92
SEAMEO
have few resources and little ability to adapt. The impact on the oceans not only include rising sea levels and warming sea temperatures but also sea acidification and changing sea currents. All these will lead to major shifts in the diversity and abundance of life in the ocean. How serious are the impacts of global warming on rising sea levels and sea temperatures, and what can we do?
Figure 3.2 An overview of Impact of Global Warming on Rising Sea Level and Temperature
Rising Sea Levels
Sea levels have already risen due to warming and the projection is that it will rise much more in the future. Although global warming has caused significant polar ice melting over the past few decades, it is a mistake to think that sea levels only rise when the polar ice caps melt. Water expands when heated and so other factors play their part in contributing to rising sea levels. Of course as glaciers melt and when land-based ice melts, the water runs to the sea and increases its level. If there is any significant melting of the polar ice sheets, the additional rise in sea level would be enormous. The combination of rising global temperatures with melting Arctic and Greenland sea- ice equals sea level rises. Every centimeter of sea level rise covers about 2.4-4.8 metres of beach. If the ice keeps melting, the global sea level could rise more than 6 metres. That would put a lot of coastlines under water, and whole islands could disappear (Weart, 2003).
Climate Change
Melting Ice in the Arctic and Antarctic

Chapter lll IMPACT OF CLIMATE CHANGE ON RISING SEA LEVEL AND SEA TEMPERATURE
93
SEAMEO
The map below (Figure 3.3) is designed to emphasise portions of Southeast Asia that are near sea level and hence could potentially be vulnerable to sea level rise.
Height above Sea Level (m)
Figure 3.3 Sea level risks in Southeast Asia Source: Rohde (2009)
The dramatic impact of a projected sea level rise of 5 m for Southeast Asia and Northern Australia would put 183.4 million people at risk in the inundated areas is shown in Figure 3.4.
Effects of Rising Sea Levels
The subsequent increases in sea level have an effect on coastal ecosystems and the species that depend on these habitats to live. Most coastal areas contain ecologically and economically important habitats such as tidal wetlands, and sea grass beds, which may also be at risk from sea-level rise. Sea-level rise contributes to coastal erosion and inundation of coastal regions as well as leading to saline intrusion into coastal land and waterways. These impacts can be exaggerated by local land motions, for e.g., the compaction of sediments following the extraction of ground water which is very intense in the coastal area, or exploitation of petroleum and gas. Sea-level rise impacts on the coasts will be felt most severely during storm surges and storm wave events and at times of high tides.

Chapter lll IMPACT OF CLIMATE CHANGE ON RISING SEA LEVEL AND SEA TEMPERATURE
94
SEAMEO
Figure 3.4 Sea level rise Map of Southeast Asia (5m) Source: Yusuf & Francisco (2009)
Thousands of small islands are threatened by the projected sea-level rise for the 21st Century, as are low-lying coastal areas such as in Indonesia and other places. According to oceanologists, more than 2000 small islands in Indonesia alone will sink and wash off in the next decade, due to the rising sea level. The Mekong Delta is an area of particular concern. In his article, published in The Bangkok Post, journalist Jeff Hodson (2009), notes that:
“It's not hard to imagine the Mekong Delta under water. The fertile rice fields are flat as a table top except for the odd limestone mountain and stretch as far as the eye can see. Much of the region lies barely a meter above sea level. According to some projections, nearly half of the Delta's farmland could be destroyed from rising sea levels due to global warming.”
He also notes that in addition to the rising ocean levels due to water expanding as it warms, and because glaciers and ice sheets are melting, that…
“…other factors compound the effect, including erosion and the loss of mangrove forests. Many cities in Southeast Asia, like Bangkok, are sinking into soft clay soils faster than the seas are rising.”
A World Bank report projects that Vietnam, with more than 3,000 km of coastline, will be one of the five most affected countries in the world. Likewise, Thailand with 2,600km of coastline is increasingly vulnerable to flooding and coastal erosion. The

Chapter lll IMPACT OF CLIMATE CHANGE ON RISING SEA LEVEL AND SEA TEMPERATURE
95
SEAMEO
report warns that in the worst case scenario that the entire southern tip of Vietnam, an area of roughly 40,000sq km, could be inundated (Dasgupta, S., Laplante, B., Meisner, C., Wheeler, D., & Yan, J., 2007). Rising Sea Temperature
Earth's climate has changed naturally throughout time as shown in Figure 3.5, but the current rate of change due to human activity is unprecedented. The projected range of temperature rise is wide because it includes a variety of possible future conditions, such as whether or not we control greenhouse gas emissions and different ways the climate system might respond. Temperatures over land areas closer to the poles are projected to warm faster than those nearer the equator.
Surface water temperature had risen by about one degree Celsius over the past century and is expected to increase by up to another three degrees in the next 100 years if emissions continue at current rates.
Figure 3.5 The Change in Global Surface Temperature From Years 1880-2000 Average Temperatures (NASA/GISS) Source: NASA (2009)
Rising air temperatures affect the physical nature of our seas. As air temperatures rise, water becomes less dense and separates from a nutrient-filled cold layer below. This is the basis for a chain effect that has an impact on all marine life that relies on these nutrients for survival. There are two general physical effects of sea warming on the marine population that are crucial to consider namely- changes in natural habitats and food supply, and changing sea chemistry or ocean acidification.
Rising sea temperatures influence all kinds of sea conditions, including sea levels, critical to the survival of microscopic phytoplankton, the base of the food web. Phytoplanktons are one-celled plants that live at the ocean surface and use photosynthesis for nutrient fulfillment. Photosynthesis is a process that removes carbon dioxide from the atmosphere and converts it into organic carbon and oxygen that feeds almost every ecosystem. According to a recent NASA study as cited by Lindell (2008), phytoplankton is more likely to thrive in cooler oceans. Similarly, an

Chapter lll IMPACT OF CLIMATE CHANGE ON RISING SEA LEVEL AND SEA TEMPERATURE
96
SEAMEO
algae, a plant that produces food for other marine life through photosynthesis, is vanishing due to sea warming. Since seas are warmer, nutrients are blocked from travelling upward to these suppliers that are limited to a small surface layer and therefore cannot supplement marine life with necessary organic carbon and oxygen. Natural ecosystems such as coral reefs, sea grass and mangrove swamps, are especially vulnerable to global warming and may disappear entirely in some areas. The International Union for the Conservation of Nature (IUCN) 2010, reported that in India and Southeast Asia, 80% of all mangrove area have been lost over the past 60 years.
Effects of Rising Sea Temperature
One of the most visually dramatic effects of increasing sea temperature is coral bleaching, a stress response caused by high water temperatures. Corals are animals, related to anemones and jellyfish. Corals consist of a limestone structure filled with thousands of small animals called polyps. Each polyp has a skeleton cup, tentacles with stinging cells, a mouth and a stomach. The tiny tentacles snatch at passing plankton for food (Nova Science in the News, 2003). Coral reefs are extremely important for biodiversity, providing a home to over 25% of all marine life, and are also vital for people. They provide nurseries for many species of commercially important fish, protection of coastal areas from storm waves, and are a significant attraction for the tourism industry. However, coral reefs are very fragile and sensitive ecosystems that can only tolerate a narrow temperature range.
Rising water temperatures block the photosynthetic reaction that converts carbon dioxide into sugar. This results in a build-up of products that poison the algae. To save itself, the corals spit out the algae but in the process some of its own tissue too leaving the coral bleached white. If temperatures remain too high for too long and bleaching persists, the corals die. The bleached corals can recover, but only if cooler water temperatures return and the algae are able to grow again. If not, the corals slowly starve to death. That is happening around the world, according to the report as cited by Lobe, (2010), and he further said that in 1998, the hottest year in at least six centuries, corals suffered the most extensive damage with severe bleaching and subsequent mortality as shown in Figure 3.6.

Chapter lll IMPACT OF CLIMATE CHANGE ON RISING SEA LEVEL AND SEA TEMPERATURE
97
SEAMEO
Figure 3.6 Bleached Coral due to Increase of Sea Water Temperature Source: Wikipedia, (n. d.)
Ocean Acidification
Emissions of CO2 arise mainly from fossil-fuel combustion, land-use practices, and concrete production. These emissions first enter the atmosphere, but a large proportion of them are then absorbed into the ocean by physical and biological processes that are normal parts of the natural carbon cycle. As CO2 is being released into the ocean, the ocean chemistry drastically changes. Greater CO2
concentrations released into oceans create increased ocean acidity. Ocean acidification describes the relative decrease in seawater pH that is caused by oceanic uptake of specific compounds from the atmosphere, where CO2 forms a weak acid (carbonic acid) making sea more acid (Howard et al. 2009). As sea acidity increases, phytoplankton is reduced. This results in less sea plants able to uptake greenhouse gases. Also, increased sea acidity threatens marine life, such as corals and shellfish, which may become extinct later this century from the chemical effects of CO2. As CO2 increases in the atmosphere, the sea acidification is increased and the carbonate ions from corals will vanish. This results in lower extension rates or weaker skeletons in most corals.

Chapter lll IMPACT OF CLIMATE CHANGE ON RISING SEA LEVEL AND SEA TEMPERATURE
98
SEAMEO
According to the National Oceanic and Atmospheric Administration, at least 19% of the world’s coral reefs are already gone. An additional 15% could be gone within 20 years and, if global warming continues unchecked, all corals could be extinct within 100 years. The fish that we eat make their homes around the coral reefs. With dead reefs, experts say, hunger, poverty and political instability could follow. Some types of coral and marine species that rely on reefs are being used by the pharmaceutical industry to develop possible cures for cancer, arthritis and other diseases. Hence, people all over the world could pay the price if reefs were to disappear. What to do? Climate change action will require the concerted effort of government and their partners (private sector, non-government organisations, communities, development partners) to manage and adapt to change in a more invasive environment. As such, we need to strengthen school community relationships, establish strong networking or partnerships between schools and government and non-government organisations. To arrest rising sea temperatures and ocean acidification, we must reduce carbon (GHG) releases through mitigation measures. At the same time, we must reduce our risk by adaptation. Some measures includes cutting on carbon, declaring some reefs off limits to fishing and diving, planting mangrove trees and controlling coastal development and pollution.

Chapter lll IMPACT OF CLIMATE CHANGE ON RISING SEA LEVEL AND SEA TEMPERATURE
99
SEAMEO
REFERENCES
Dasgupta, S., Laplante, B., Meisner, C., Wheeler, D., & Yan, J. (2007). The impact of sea level rise on developing countries: a comparative analysis. World Bank Policy Research Working Paper 4136, February 2007. Retrieved on 17 July 2010 from http://econ.worldbank.org/external/default/main?ImgPagePK=64202988&entityID=000016406_20070209161430&pagePK=64165259&theSitePK=469382&piPK=585673
Hodson, J. (2008, April 8). In Mekong Delta, few know or worry about rising seas.
The Bangkok Post. Retrieved on 20 October 2010 from http://www.livingriversiam.org/mk /mek_ne60.html
Howard, W.R., Havenhand, J.,Parker, L., Raftos, D., Ross, P., Williamson, J., and
Matear, R.,(2009). Ocean Acidification, Retrieved on 20 October 2010 from http://www.oceanclimatechange.org.au/content/index.php/site/report_card_extended/ocean_acidification/
IUCN, (2010). Mangrove Action Project (MAP). (n. d.). Extinction threat for mangroves warns IUCN. Retrieved on 27 October 2010 from http://mangroveactionproject.org/issues/mangrove-loss/extinction-threat-for-mangroves-warns-iucn
Lindell, N, (2008). A Discordant Sea: Global Warming and its Effect on Marine Populations. Retrieved on October 26, 2010 from http://geography.about.com/od/geographyintern/a/globalmarine.htm
Lobe, J. (2010). Global warming threatens marine life. Retrieved on October 26, 2010 from http://www.twnside.org.sg/title/marine-cn.htm
Mangrove Action Project (MAP). (n. d.). Extinction threat for mangroves warns IUCN. Retrieved on 27 October 2010 from http://mangroveactionproject.org/issues/mangrove-loss/extinction-threat-for-mangroves-warns-iucn
NASA, (2009). The Change in Global Surface Temperature. Retrieved on October 25, 2010 from http://en.wikipedia.org/wiki/File:NASA_global_temperature_since_1880.gif
National Oceanic and Atmospheric Administration. (2010). NOAA: Past decade warmest on record according to scientists in 48 countries. Retrieved on 20 October 2010 from http://www.noaanews.noaa.gov/stories2010/20100728_stateoftheclimate.html
Nova Science in the News. (2003). Coral bleaching – will global warming kill the reefs?. Retrieved on 27 October 2010 from http://www.science.org .au/nova /076/076key.htm
Rohde, R.A. (2009). Global warming art. Retrieved on October 24, 2010 from http://www.globalwarmingart.com/wiki/File:SE_Asia_Sea_Level_Risks_png

Chapter lll IMPACT OF CLIMATE CHANGE ON RISING SEA LEVEL AND SEA TEMPERATURE
100
SEAMEO
Shah, A. (n. d.). Climate change and global warming introduction. Global Issues. Retrieved on 27 October 2010 from http://www.globalissues.org/article/233/climate-change-and-global-warming-introduction#Increasingoceanacidification
Weart, R.S. (2003). The discovery of global warming. Cambridge, MA: Harvard University Press
Wikipedia. (n. d.). Retrieved on 27 October 2010 from http://en.wikipedia.org/wiki /File :Moofushi_bleached_corals.JPG
Yusuf, A. A., & Francisco, H. (2009) Climate Change Vulnerability Mapping for Southeast Asia. Retrieved 25 October 2010 from Economy and Environment Program for Southeast Asia (EEPSEA) website http://www.idrc.ca/uploads/user-S/12483270391 Mapping _Reportv 02.pdf

Chapter lll IMPACT OF CLIMATE CHANGE ON RISING SEA LEVEL AND SEA TEMPERATURE
101
SEAMEO
Lesson 1 SAVING THE MARINES
GRADE LEVEL: High School
SUBJECT: Biology
TOPIC: Interaction between Biotic and Abiotic Components in a Marine Ecosystem
PREREQUISITE: Before the laboratory work, the students should have:
• prior knowledge about the biotic and abiotic factors in an ecosystem;
• familiarity with proper care and maintenance of fish; and
• knowledge on the difference between temperature maintenance in warm-blooded versus cold-blooded organisms.
DURATION: 2 sessions
LEARNING OBJECTIVES
Subject Matter Objectives: By end of session, students should be able to: • explain the interaction between the biotic and abiotic factors in a marine
ecosystem; and
• relate climate and abiotic components of ecosystems.
Climate Change Objectives • demonstrate the effect of rising sea level on coastal erosion and inundation or
salt water intrusion to groundwater or impact to low-lying coastal and agricultural land; and
• explain the cause and effect of rising sea temperature on fish physiology and behaviour.
MAIN CONCEPTS AND SKILLS
• Abiotic factors are essentially non-living components that affect the living organisms of the freshwater and seawater community. When an ecosystem is barren and unoccupied, new organisms colonising the environment rely on favourable environmental conditions in the area to allow them to successfully live and reproduce. These environmental factors are abiotic factors. When a variety of species are present in such an ecosystem, the consequent actions of these species can affect the lives of fellow species in the area, these factors are deemed biotic factors.
• The biotic and abiotic factors combine to create an ecosystem. An ecosystem is a community of living and non-living things considered as a unit. If a single factor is changed (such as temperature), perhaps by pollution or natural phenomenon, the whole system could be altered.
• Human beings may alter the environment through farming or irrigating. While we usually cannot see what we are doing to various ecosystems, the impact

Chapter lll IMPACT OF CLIMATE CHANGE ON RISING SEA LEVEL AND SEA TEMPERATURE
102
SEAMEO
is being felt all over. For example, climate change causes sea temperature to rise in some regions and has resulted in the decline of fish species and population.
• Rising air temperatures affect the physical nature of our seas. As air temperatures rise, water becomes less dense and separates from a nutrient-filled cold layer below. This is the basis for a chain effect that impacts all marine life who counts on these nutrients for survival. There are two general physical effects of sea warming on marine populations that are crucial to consider, namely: change in natural habitats and food supply, and change in sea chemistry such as acidification.
• Most aquatic animals need to obtain O2 from the surrounding water in order to carry on cellular respiration. The amount of O2 in water is limited, and both O2 solubility and demand are correlated with temperature. At most, there is only about 15 mg of O2 per liter of water. In order to carry out the chemical reactions needed to maintain life and to reproduce, aquatic organisms must be able to efficiently extract that 15 mg of O2 from the water.
• High water temperature would cause oxygen to leave the water. Consequently, the fish and other organisms would lack oxygen and suffocate. All aquatic life are ectotherms, meaning their body temperature varies directly with its environment.
MATERIALS NEEDED
• pictures of a fish-kill incident in your immediate community • beakers or large bowls, warm and cold water, aquarium fish, thermometers,
plastic cups, timing device • student worksheet
PRESENTATION OF LESSON
The world’s climate is constantly changing. How will these changes impact natural systems, especially ecosystems? How will humans and other living things be affected? This lesson provides the basis to start exploring possible answers to these questions by understanding the interactions between abiotic and biotic components of ecosystems and relating these to a changing climate.
Scenario: “The Fish Kill”
Present a recent photo of a fish kill incident in your community. Ask for students’ reactions on the photograph.
• What do you notice about this photo? • What caught your attention about this photo? • What facts do you know about this situation?
Ask them about the possible causes of this incident. Students may give several reasons for the fish-kill. Hence, highlight only those that are directly connected to climate change particularly on the rising sea temperature.

Chapter lll IMPACT OF CLIMATE CHANGE ON RISING SEA LEVEL AND SEA TEMPERATURE
103
SEAMEO
Guide Questions
• What were the possible factors that caused the fish-kill?
• What was altered in the ecosystem that caused this incident? • How are these factors related to climate change?
Student Activity: “Simple Experiment on Fish Respiration” • Allow students to observe and analyse how a change in water temperature
can affect the behaviour of fish in an experiment which they will themselves design and execute.
Process Guide for Teachers
1. After the initial class discussion about the fish-kill incident, conduct a short discussion about the biotic and abiotic factors in an ecosystem. Discuss the interaction between the two factors. Also, together with the students, review the differences between temperature maintenance in warm-versus cold-blooded organisms.
2. Divide the class into working groups. Give each group a set of materials and worksheet needed in the activity. Provide precautionary measures particularly on proper handling and maintenance of the fish.
3. In groups, ask the students to design and perform a brief experiment to determine how water temperature affects fish respiration. Refer to the attached Student’s Worksheet 1(Attachment 3.1.1). The students will undergo a semi-guided science inquiry activity.
4. Monitor the students while working in groups. Use the attached sample rubric of Experimental Design for the performance rubric (Attachment 3.1.2).
5. After the group activity, ask each group to present the results of their work.
6. Debrief students on their learning experiences by asking the following guide questions:
a. How does fish respiration change with severe temperature change?
b. Why do the fish require a constant supply of fresh water over their gills?
c. Aside from respiration, what other physiological factors are affected by water temperature change?
d. What are the limiting factors which affect the balance in a water ecosystem?
e. What is the impact of sea temperature change in the population of aquatic organisms?
f. What day-to-day activities can cause imbalance in our ecosystem?
g. How does climate change affect the balance in our ecosystem?

Chapter lll IMPACT OF CLIMATE CHANGE ON RISING SEA LEVEL AND SEA TEMPERATURE
104
SEAMEO
Achieving the Objectives
Objective This is achieved by Explain the interaction between the biotic and abiotic factors in an ecosystem.
Group interaction during the conduct of the group activity. Presenting the results of the activity in the class.
Demonstrate the effects of rising sea temperature on fish physiology and behaviour.
Designing and performing a simple activity on the effects of water temperature change on fish respiration.
Explain the cause and effect of rising sea level and temperature.
Processing the student’s learning during class discussion and interaction.
Assessment: “Sketching Task”
Ask students to draw an ecosystem that highlights three (3) biotic and 3 abiotic components.
1. Write a short narrative to explain the 3 possible interactions between abiotic and biotic components in normal conditions.
2. What will happen to the interactions if changes such as rise of temperature are observed? Draw a diagram to describe the new phenomenon.
Closure: “Concept Mapping”
Students will create a concept map illustrating the connections between abiotic and biotic components in an ecosystem and climate change and its potential impact on the ecosystem. Use the attached concept map rubric (Attachment 3.1.3) to assess student’s output.

Chapter lll IMPACT OF CLIMATE CHANGE ON RISING SEA LEVEL AND SEA TEMPERATURE
105
SEAMEO
RESOURCES:
Andaya, C. V. (2008). Understanding the Earth through Environmental Science, C&E Publishing, Inc.
Buchheim, J. (n.d). Fish: A Quick Course on Ichthyology. Retrieved from
http://www.marinebiology.org/fish/htm Climate Change. (2008). Retrieved from
http://www.wildbc.org/index.php/programs/climate-change-education Pittis, M. (1999). The Effects of Water Temperature Change on Goldfish Physiology
and Behavior. Lexington School for the Deaf Jackson Heights, New York. Pond / Lake Health:Fish Kills in Ponds and Lakes. (2005). Retrieved from
http://www.lake-aeration.com/Fish_Kills_In_ponds_lakes.asp Project Wet: Curriculum and Activity Guide. (1995). The Watercourse and the
Council for Environmental Education. SEAMEO BIOTROP, (2010). Climate Change and Rising Sea level and
Temperature. Teachers’ Guidebook Integrating Climate Change Issues in Southeast Asian Schools, 2010.
Chapter lll IMPACT OF CLIMATE CHANGE ON RISING SEA LEVEL AND SEA TEMPERATURE
106
SEAMEO
Attachment 3.1.1 Student’s Worksheet
SIMPLE EXPERIMENT ON FISH RESPIRATION
Objectives
• Observe fish respiration by watching a fish’s mouth or gill movement.
• Determine the rate of fish respiration using water of varying temperatures.
Materials
Preferably, use aquarium pet gold fish Beakers or large bowls, warm and cold water, aquarium fish, thermometers, plastic cups, timing device
Research Question
• How water of varying temperatures affect fish respiration?
Parameters for Temperature and Circulation
• The fish in this activity must stay alive.
• The fish can stay out of the water for a maximum of 30 seconds.
• The fish must have at least four minutes of recovery time in its normal water temperature before it is used again in another trial.
• The water temperatures can range from 15 to 30o C.
Procedure
1. Plan a simple experiment to answer the research question.
2. Write the complete procedures of the experiment before conducting the actual experiment.
Guide questions in formulating the procedures
• How will you keep track of individual fish?
• How will you change the temperature of the water?
• How will you ensure the fish gets 4 minutes of rest between trials?

Chapter lll IMPACT OF CLIMATE CHANGE ON RISING SEA LEVEL AND SEA TEMPERATURE
107
SEAMEO
3. Record your observation and data using the Record Sheet below:
Record Sheet of the Experiment on Fish Respiration
Fish Number
Water Temperature in degree Celsius
Respiration Rate in Minutes
Observations
4. Prepare for a class presentation. It must include an introduction, hypothesis, procedures, data and results, and conclusion.
Sample guide question for discussion during your presentation:
• What have you observed based on data and results?
• What happened to the fish when the water temperature changes? Why?
(Use your information about temperature homeostasis for warm- and cold-blooded animals)
Analysis and Conclusion
• address your hypothesis

Chapter lll IMPACT OF CLIMATE CHANGE ON RISING SEA LEVEL AND SEA TEMPERATURE
108
SEAMEO
Attachment 3.1.2 Performance Rubric
EXPERIMENTAL DESIGN
Area Criteria for Assessment
PossiblePoints
Points Earned
Remarks
Experimental Design
• Lists materials, uses proper amounts
• Procedure written clearly; can replicate
• Procedure in logical order
• Identifies variables
• Includes repetitions, if applicable
25
Data
Recorded
• Variables are labelled
• Measurements use appropriate units
• Chart/table is logical and organised
20
Analysis/ Conclusion
• Data support the conclusion
• Conclusion addresses hypothesis
• Analysis is logical
• Includes possible sources of error
• Includes ways to improve design
30
Presentation
• Poster is logical and neat
• Visuals are clearly displayed
• All members participate in designing and conducting the experiment
• All members participate in actual presentation
• Shows good planning and organisation
25

Chapter lll IMPACT OF CLIMATE CHANGE ON RISING SEA LEVEL AND SEA TEMPERATURE
109
SEAMEO
Attachment 3.1.3 Concept Map Rubric
CRITERIA Not Satisfactory Level 1
Satisfactory Level 2
Good Level 3
Excellent Level 4
Concepts
• Bare minimum number of concepts selected relating to topic
• Arrangement of concepts illustrates basic understanding of relationships between them
• Acceptable number of concepts selected, with some relationships to topic
• Arrangement
of concepts demonstrates understanding of relationship between them
• Most concepts relating to topic were selected
• Arrangement of concepts demonstrates a complete understanding of relationship between them
• Most concepts and all significant concepts selected and they clearly relate to the topic
• Arrangement of concepts demonstrates complete and insightful understanding of relationship between them
Hierarchical Structure
• Some sense of hierarchical structure.
• Hierarchical structure used, but still some inconsistency.
• Most concepts connected in a hierarchical structure moving from major ideas to minor ideas.
• All concepts connected in a hierarchical structure leading to specific concepts.
Linkages
• Few relationships indicated by connecting lines
• Few lines labelled with linking words
• Linking words are simple and repetitive
• Some relationships indicated by connecting lines
• Some lines labelled with linking words
• Linking words show variety
• Most relationships indicated by connecting lines
• Most lines labeled with linking words
• Linking words are accurate and varied
• All relationships indicated by a connecting line
• All lines labelled with linking words
• Linking words are expressive and purposeful
Cross Links
• Cross links not used
• Few cross links are used to illustrate minimal connections
• Cross links used to reflect straightforward connections
• Cross links show complex relationships between two or more distinct segments of the concept map

Chapter lll IMPACT OF CLIMATE CHANGE ON RISING SEA LEVEL AND SEA TEMPERATURE
110
SEAMEO
Lesson 2
ACID OCEAN ALERT!
GRADE LEVEL: High School
SUBJECT: Physical Science (Chemistry)
TOPIC: Acid, Base and pH Scale
PREREQUISITE:
• Before the laboratory work, the students should already know the difference between acid and base and their characteristics.
DURATION: 2 sessions
LEARNING OBJECTIVES
Subject Matter Objectives: By end of session, students should be able to:
• determine common acids and bases using a pH paper or pH meter; and
• explain the relationship between pH and the strength of an acid and a base.
Climate Change Objectives:
• explain the cause of rising sea water acidity due to climate change;
• describe ways marine organisms (e.g., corals) are affected by sea/ocean acidification; and
• design an experiment on coral bleaching as it affects the food chain.
MAIN CONCEPTS AND SKILLS
• The ocean dominates the earth’s carbon cycle. Half the primary productivity on Earth takes place in the sunlit layers of the ocean and the ocean absorbs roughly half of all carbon dioxide added to the atmosphere.
• The ocean has had, and will continue to have, a significant influence on climate change by absorbing, storing, and moving heat, carbon, and water.
• The analogy between pH in the ocean and CO2 helps explain that rising atmospheric CO2 concentration leads to the lowering of pH in the ocean. Carbon dioxide from the atmosphere can cause a liquid to become more acidic. Hence, it is possible to acidify the ocean.
• The pH is a measure of acidity. Acids are characterised by their ability to give off H+ ions in aqueous solutions. pH is a mathematical function that indicates the amount of H+ present in the water. The smaller the pH value, the more acidic the sample. Acids have pH from 1 to 7, 7 is neutral, and bases have pH from 7 to 14.
Chapter lll IMPACT OF CLIMATE CHANGE ON RISING SEA LEVEL AND SEA TEMPERATURE
111
SEAMEO
• The strength of an acid or base is confused with its concentration. Dilute and concentrated are terms used to indicate the concentration of a solution. The concentration of the acid or base refers to the amount of acid or base dissolved in a solution. On the other hand, strong or weak refers to the ease with which an acid or base forms ions in solution.
• Emissions of CO2 arise mainly from fossil-fuel combustion, land-use practices, and concrete production since the industrial revolution. These emissions first enter the atmosphere, but a large proportion of them are then absorbed into the ocean by physical and biological processes that are normal parts of the natural carbon cycle. As carbon dioxide is being released into the ocean, the ocean chemistry drastically changes.
• Greater CO2 concentrations released into oceans create increased ocean acidity. Surface ocean pH has become more acidic by approximately 0.1 units since pre-industrial times. Ocean acidification describes the relative decrease in seawater pH that is caused by oceanic uptake of specific compounds from the atmosphere, where CO2 forms a weak acid (carbonic acid) making sea more acid. Ocean acidification affects calcium carbonate saturation in ocean waters, thereby making this building block of shells and skeletons less available which affects the health of corals and other marine organisms (e.g., crabs and clams). As sea acidity increases, phytoplankton is reduced. This results in less sea plants able to uptake greenhouse gases. Also, increased sea acidity threatens marine life, such as corals and shellfish, which may become extinct later this century from the chemical effects of CO2.
• The oceans are more acidic as a result of CO2 emissions associated with human activity. Humans affect the ocean in a variety of ways. Laws, regulations, and resource management affect what is taken out and put back into the ocean. Human development and activity lead to pollution and physical modifications (changes to beaches, shoals, and rivers) and removed most of the large vertebrates from the ocean.
• Everyone is responsible in caring for the ocean. The ocean sustains life on Earth and humans must live in ways that sustain the ocean. Individual and collective actions are needed to effectively manage the aquatic resources for all.
MATERIALS NEEDED
• common samples of acids and bases, pH paper or pH meter;
• pH indicator solution (ready-made or improvised like the red cabbage indicator), before doing this lesson the teacher may conduct a test if the red cabbage pH indicator may be used;
• samples of seawater, brackish water, or freshwater and coral skeleton; and
• student’s worksheet

Chapter lll IMPACT OF CLIMATE CHANGE ON RISING SEA LEVEL AND SEA TEMPERATURE
112
SEAMEO
PRESENTATION OF LESSON
Prerequisite: Prior to the conduct of the lesson, the teacher will conduct a research on a news article about the effects of rising sea acidity on aquatic organisms and their habitat which was published in a local newspaper. If this is not available visit this website www.oceana.org and download the ACID TEST report.
Scenario:
Distribute copies of the news article on ocean acidification to students. Give the students sufficient time to read the article. Afterwards, they have to answer the following questions:
• What is ocean acidification? • What causes it? • Who does it affect? • Why should it be studied and/or monitored?
Student Activities
• Activity A: The students will conduct an acid and base test using pH paper or pH meter. They will use this test to determine the pH level of common household acids and bases. Various solutions may include: vinegar, hydrogen peroxide, lemon juice, household cleaner such as muriatic acid, soda.
• Activity B: In addition, the students will determine the pH level of water samples from nearby bodies of water such as fresh water, salt water. In this experiment, the student will determine whether the water is still suitable for aquatic organisms such as fish.
• Activity C: In order to see how the dissolution of CO2 in water affects the pH, the students blow bubbles into a solution of water and pH indicator solution. As the bubbles of CO2 are introduced to the solution, pH drops. The simple analogy between pH in the ocean and CO2 helps students understand that rising atmospheric CO2 concentration leads to the lowering of pH in the ocean.
• Activity D: Students will design an experiment on coral bleaching using a solution.
Process Guide for Teachers
1. After doing the opening activity about the news article, conduct a short review about the characteristics of acid and base. Relate this short review to the news article presented earlier. Give emphasis to the effects of rising seawater acidity on the overall aquatic ecosystem. Extend the discussion up to the corrosive effect of seawater to shellfish and coral reefs.
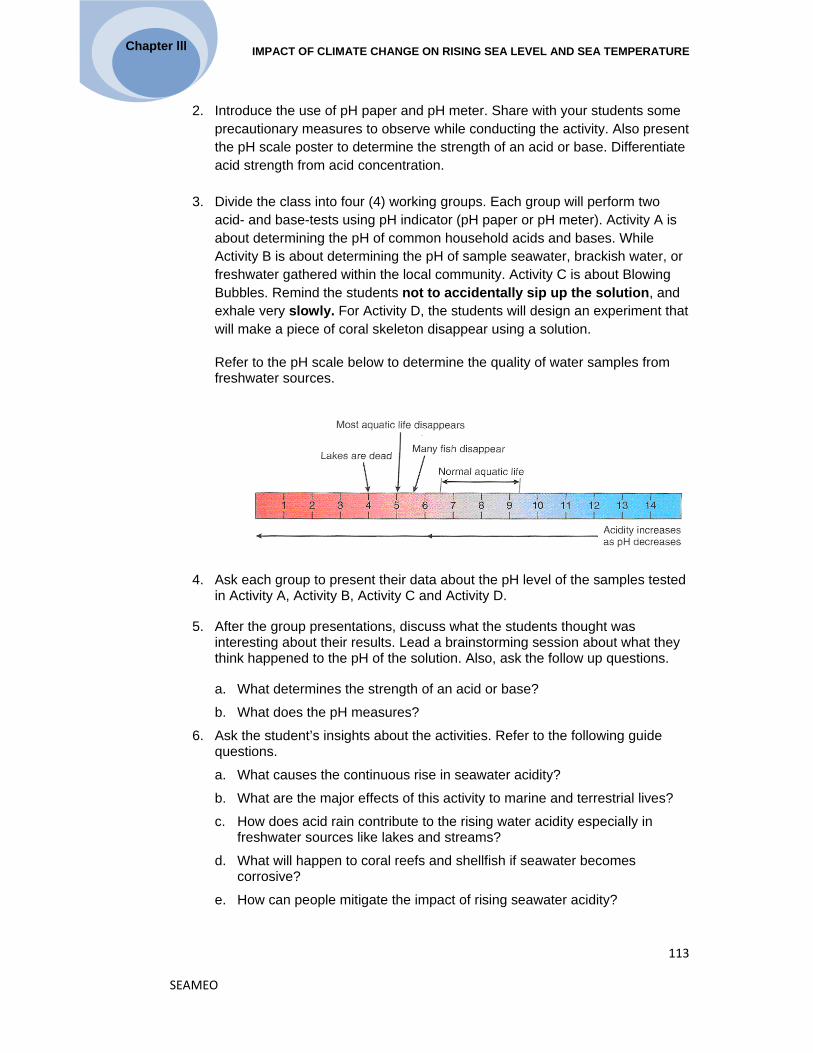
Chapter lll IMPACT OF CLIMATE CHANGE ON RISING SEA LEVEL AND SEA TEMPERATURE
113
SEAMEO
2. Introduce the use of pH paper and pH meter. Share with your students some
precautionary measures to observe while conducting the activity. Also present the pH scale poster to determine the strength of an acid or base. Differentiate acid strength from acid concentration.
3. Divide the class into four (4) working groups. Each group will perform two acid- and base-tests using pH indicator (pH paper or pH meter). Activity A is about determining the pH of common household acids and bases. While Activity B is about determining the pH of sample seawater, brackish water, or freshwater gathered within the local community. Activity C is about Blowing Bubbles. Remind the students not to accidentally sip up the solution, and exhale very slowly. For Activity D, the students will design an experiment that will make a piece of coral skeleton disappear using a solution.
Refer to the pH scale below to determine the quality of water samples from freshwater sources.
4. Ask each group to present their data about the pH level of the samples tested in Activity A, Activity B, Activity C and Activity D.
5. After the group presentations, discuss what the students thought was interesting about their results. Lead a brainstorming session about what they think happened to the pH of the solution. Also, ask the follow up questions.
a. What determines the strength of an acid or base?
b. What does the pH measures?
6. Ask the student’s insights about the activities. Refer to the following guide questions.
a. What causes the continuous rise in seawater acidity?
b. What are the major effects of this activity to marine and terrestrial lives?
c. How does acid rain contribute to the rising water acidity especially in freshwater sources like lakes and streams?
d. What will happen to coral reefs and shellfish if seawater becomes corrosive?
e. How can people mitigate the impact of rising seawater acidity?

Chapter lll IMPACT OF CLIMATE CHANGE ON RISING SEA LEVEL AND SEA TEMPERATURE
114
SEAMEO
Achieving the Objectives
Objective This is achieved by
Determine common acids and bases using a pH paper or pH meter.
Actual pH test of common household acids and bases
Explain the relationship between pH and the strength of an acid and a base.
Actual pH test and during classroom discussion.
Design an experiment on coral bleaching.
Actual pH test on coral bleaching
Explain the cause of rising sea water acidity due to climate change.
Analysing the news article about seawater acidity. Interaction and discussion with group mates.
Discuss the effects of rising sea water acidity to aquatic organisms and their habitat.
Class discussion and group activity.
Assessment
Performance assessment: This will be conducted during the performance of the assigned activity. The teacher will utilise a performance rubric (Experimental Design) used in the previous lesson. (Attachment 3.1.2)
• Formative assessment: In a clean sheet of paper, the students will answer the following questions:
1. The aromas of many fish are caused by compounds called amines. If the pH of a dilute solution of an amine is 11.4, infer whether the amine is an acid or a base.
2. What determines the strength of acid or base?
3. What does the pH of each of the solutions indicate about the solutions?
Rainwater, 5.9
Soda water, 3.0
Drain cleaner, 14.0
Seawater, 8.9
Pure water, 7.0
4. Draw a concept map on the impact of coral bleaching to our marine ecosystem and its impact to food chain and eventually to food security.

Chapter lll IMPACT OF CLIMATE CHANGE ON RISING SEA LEVEL AND SEA TEMPERATURE
115
SEAMEO
Closure Activity
• Option1) Tell the students to draw a concept map of pH values. They may start with three boxes labelled acidic, neutral and basic and indicate the pH range of each box. Below each box, they will give some examples of solutions that belong in each pH range.
• Option 2) Ask students to draw a poster showing the effects of rising seawater acidity to marine life particularly the fish population and coral reefs and shellfish. In groups, they will bring their posters to a particular community (chosen by your group) especially those located near water sources e.g. fishing village. They have to show the posters to the community, and ask permission from local authorities to post it in strategic places for public awareness and information dissemination.
RESOURCES
Acids, Bases, and pH. (n.d). Retrieved from www.chemistry.about.com/od/acidsbases/Acids_Bases_and_pH.htm
Andaya, C. V. (2008). Understanding the Earth through Environmental Science, C&E Publishing, Inc.
Boleman, C., Gravinese, P. & Muse, E. (n.d). Retrieved from http://fmsea.org/media/pdf/conference/2010/FMSEA2010_Boleman_Casey_Lesson_Ocean_Acidification.pdf
Conrad, L.S., Eubank, L. P., Middlecamp, C. H., Pienta, N. J. & Stratton, W. (2003). Chemistry in Context: Applying Chemistry to Society. 4th Edition. Mc Graw Hill Companies.
SEAMEO BIOTROP, (2010). Climate Change and Rising Sea level and Temperature. Teachers’ Guidebook Integrating Climate Change Issues in Southeast Asian Schools, 2010.

Chapter lll IMPACT OF CLIMATE CHANGE ON RISING SEA LEVEL AND SEA TEMPERATURE
116
SEAMEO
Attachment 3.2.1 Student’s Worksheet
DETERMINING WATER ACIDITY
Objectives:
• Determine common acids and bases using a pH paper or pH meter. • Determine whether the different water samples are suitable for aquatic
organisms. • Observe how the dissolution of carbon dioxide in water affects the pH through
blowing of bubbles. • Explain the relationship between pH and the strength of an acid and a base. Procedure:
• This laboratory activity is divided into three parts.
Activity A: First you will determine the pH level of common household acids and bases. Tabulate the results of your investigation.
Name of Common Household Solutions Acid or Base pH Level
Activity B: In this activity you will determine the pH of fresh water sample, a brackish water sample, and a sea water sample. Tabulate the results and determine whether the water from these sources is still suitable for aquatic organism
Water Sample Acidic or Basic pH Level

Chapter lll IMPACT OF CLIMATE CHANGE ON RISING SEA LEVEL AND SEA TEMPERATURE
117
SEAMEO
Guide Question:
• Using the pH scale below, which of the samples is suitable for aquatic organism?
Activity C: Blowing Bubbles
Materials: • Coral or shells • 50 ml water, beaker or clear plastic cup • Drinking straw, • pH indicator solution
Procedure: 1. Pour 50 ml water into beaker
2. Add 15 drops of pH indicator solution to the water in the beaker/cup and mix it with the straw a. Record colour of solution b. Record pH
3. Exhale SLOWLY into the water through the straw and record your
observations. c. Record colour of solution d. Record pH Guide Questions: 1. What gas are you exhaling into the solution? 2. What is happening to the pH of the solution?
4. Add some crushed coral or shells to the solution.
Guide Question: What happens to the pH of the solution?

Chapter lll IMPACT OF CLIMATE CHANGE ON RISING SEA LEVEL AND SEA TEMPERATURE
118
SEAMEO
Activity D: Coral Bleaching
Materials:
• Piece of coral skeleton • Solution of your choice
Instructions:
1. Design an experiment that will make a piece of coral skeleton disappear using the solution of your choice. Have your procedure approved by your teacher.
2. Write your hypothesis. 3. Write a clear, step by step procedure for your experiment. 4. Identify the independent and dependent variables.

Chapter lll IMPACT OF CLIMATE CHANGE ON RISING SEA LEVEL AND SEA TEMPERATURE
119
SEAMEO
Lesson 3
LET’S MEASURE IT!
GRADE LEVEL: Grade 7 (First Year High School)
SUBJECT: Mathematics
PREREQUISITE: Students should have prior knowledge on the concept of volume and temperature. DURATION: 1 session
LEARNING OBJECTIVES
Subject Matter Objectives: By the end of this lesson, students should be able to: • measure water displacement using different measuring devices; • measure heat using thermometer properly; and • identify change in volume and change in temperature using appropriate
mathematical operation.
Climate Change Related Objectives • discuss the causes and increase rate of sea temperature and sea level; • explain the significant effect of increasing sea level at 1mm per year by
the year 2030; and • explain the effects of rising sea temperature on coral reefs and the
depending biodiversity in marine ecosystem.
MAIN CONCEPTS AND SKILLS
• Sea level rise is caused by melting of ice glaciers (a perennial mass of ice which moves over land) due to global warming over centuries and expansion of sea water.
• The effects of rising sea level are erosion of coastline, coastal inundation, increase loss of wetlands and coastal habitats, change in surface water quality and ground water characteristics, and decrease in soil and water quality, flooding, an entry of seawater into freshwater areas and intrusion to groundwater.
• The impact of sea temperature rise also include: uneven storms, cyclones, migration of aquatic organisms, etc. High sea levels would submerge some coastal cities, small island nations, and other inhabited regions.
• Through global warming, the surface waters of the oceans could become warmer, increasing the stress on marine ecosystems, such as coral reefs. High water temperatures can cause a damaging process called coral bleaching. When corals bleach, they expel the algae that give them their colour and nourishment. The corals turn white and, unless the water
Chapter lll IMPACT OF CLIMATE CHANGE ON RISING SEA LEVEL AND SEA TEMPERATURE
120
SEAMEO
temperature cools, they die. Added warmth also helps spread diseases that affect sea creatures.
• Ice already in the oceans does not contribute to sea level rise but ice formations on land will cause a rise in sea level when they melt. Ice is less dense than water. Ice displaces water equal to the mass of the ice. Displacement is the forced relocation of water due to a submerged or partially submerged object occupying fluid space.
MATERIALS NEEDED
• Recent data on the coral reef ecosystem locally, nationally and globally • Video showing melting of ice in the North Pole or in the Antarctic
(http://www.youtube.com/watch?v=t7T7beACtQs) • Student’s Worksheet • Ice Cubes • Reading thermometer • 150 ml beaker or graduated cylinder
PRESENTATION OF THE LESSON Scenario:
Have a review about global climate change and its impact on sea level rise. Ask students where there is a lot of ice in the world. Is the ice on land or water? Does it matter whether the ice is on land or water? Will one or both cause sea level to rise when they melt? Allow the students to watch a movie clip or a video that shows melting of ice glaciers in the North Pole. The teacher will ask the students the following questions:
• What did you observe as the ice melts? • Why might we be concerned about sea level rise? • What does this mean for our future?
Briefly connect the cause of sea level rise to global climate change and discuss the effects of rising sea level such as - coastal areas will be flooded, people will lose their homes, some fresh water resources will become too salty to use and habitat loss will occur.
Student Activities
Students will explore how melting ice impacts sea level. This activity will help students see the application of measurement in sea level rise and sea temperature. In groups, the students will measure the temperature of the water with ice in the beaker and record it. For the second trial, the students will expose the water and ice in the beaker to the sunlight. The students will record their
Chapter lll IMPACT OF CLIMATE CHANGE ON RISING SEA LEVEL AND SEA TEMPERATURE
121
SEAMEO
measurements and write down their observations and results. They will include the answers to the guide questions in their conclusions on the worksheet.
In this exercise, students will be able to visualise differences in water volume and temperature and relate this to potential consequences of increased glacial melting.
Process Guide for Teachers
a. Use the information in the chapter introduction section to help students understand the results of their activity. Guide the students to see the relationship of temperature and the melting of ice which in turn increases the level of water in a particular container. The same is true to the environment. The increase in temperature due to global warming can cause the ice in the North Pole to melt, thus increasing the sea water level.
b. Connect the discussion about global climate change by asking the students: • Why might we be concerned about sea level rise and sea
temperature? • Why do you think this phenomenon happened?
c. The teacher will get some pictures showing increase in water level
temperature and will ask students to identify the consequences of an increased in sea water level and sea temperature to the coral reefs, freshwater, beaches, and even to small islands in the Mekong Delta in Vietnam, Bangladesh and small islands in the Pacific.
Achieving the Objectives
Objective This is achieved by Measure water displacement using different measuring devices Measure heat using thermometer properly Identify change in volume and change in temperature using appropriate mathematical operation
Performing the activity with the guide of the teacher. Group discussion on the guide questions for lesson activity.
Discuss the causes and increase rate of sea temperature and sea level
Sharing of reactions and insights on the movie clip or video on melting of ice in the North Pole.
Explain the significant effect of increasing sea level at 1mm per year by the year 2030 Explain the effects of rising sea temperature on coral reefs and the depending biodiversity in marine ecosystem.
Class discussion

Chapter lll IMPACT OF CLIMATE CHANGE ON RISING SEA LEVEL AND SEA TEMPERATURE
122
SEAMEO
Assessment
• Provide a short summary of the lesson by asking the students how to measure volume of water, irregular solids, and temperature.
• Ask the students to work in groups and ask them to answer the following:
1. What causes the increase of temperature in the environment? 2. What causes the rise in sea water level? 3. What are the consequences of an increase in sea water level and
temperature? 4. Draw a concept map or diagram or caricatures or cartoons showing the
amount of sea level increase and its impact to the coastal areas, low-lying areas and small islands in the pacific.
Closure Activity
• Ask the students to make a poster that will help make people informed about climate change and how it affects the rise in sea water level and temperature and its consequences to people.
• Ask the students to list down some activities that may minimise the impact of climate change on sea water level and temperature.
What can we do to help slow down the process of sea level rise and sea temperature? (Examples: Take public transportation instead of driving, eat local foods, turn off lights and electrical equipment when not in use, plant a tree, reduce, reuse and recycle.)
What can we do to reduce our risk by adaptation?
(Examples: knowing that typhoons will be stronger than before, we should revise our building code such that we build our homes strong enough to withstand winds of certain kilometers per hour. Those living in low-lying areas must be moved to higher and safer grounds such that hazards (e.g., excessive rainfall and sea level rise) do not become major disasters.

Chapter lll IMPACT OF CLIMATE CHANGE ON RISING SEA LEVEL AND SEA TEMPERATURE
123
SEAMEO
RESOURCES
Anytime Lesson Plan: Global Climate Change and Sea Level Rise. (n.d). Retrieved from http://www.calacademy.org/teachers/resources/lessons/global-climate-change-and-sea-level-rise/
Canonigo, A. (2009). Unpublished lesson activity guides.
Gozun, E. (July 2010). Global Warning on Global Warming. Kerygma Magazine. No. 242, Vol. 20.
Yee, L. P. (2008). Teaching secondary school mathematics. Singapore. M Graw-Hill Education (Asia).
You Tube video on ice melting. (http://www.youtube.com/watch?v=t7T7beACtQs)

Chapter lll IMPACT OF CLIMATE CHANGE ON RISING SEA LEVEL AND SEA TEMPERATURE
124
SEAMEO
Attachment 3.3.1 Student’s Worksheet
MEASURING WATER RISE AND TEMPERATURE
Objective:
Students will apply their skills in measurement using the concepts of sea level rise and sea temperature.
Materials:
• Laboratory apparatus (150 ml beaker, thermometer) • Ice cubes
Procedure:
a. Put a 150 ml of water in a beaker.
b. Put a small cube of ice in the water and observe.
c. Using the thermometer, measure the temperature of the water in the beaker and record it.
d. Measure the volume of the water in beaker.
e. This time, expose the beaker to the sunlight and wait for a few minutes.
f. Using the same thermometer, measure the temperature of the water in the beaker after exposing to heat.
g. Again, measure the volume of the water in beaker.
Temperature Volume Observation Without sunlight
With sunlight
Conclusion: Guide Questions:
• What happens to the ice? • What happens to the level of water in the beaker? • How does the melting of ice affect the volume of the water in the beaker? • By how much does the volume change? • By how much does it change its temperature? • Can you estimate the volume of the ice? How? • In which “situation” did the water level rise more? • How do the results compare with the phenomenon on sea level rise and sea
temperature?

125
CHAPTER IV: Climate Change and ENERGY EFFICIENCY [SEAMEO RECSAM]

CLIMATE CHANGE AND ENERGY EFFICIENCY
126
SEAMEO
Chapter IV
What is Energy?
Energy plays important roles in our lives. It is an essential input to a nation‟s
economic growth and development. Over the last 50 years, consumption of energy
has increased from year to year due to its demand where the trend has shown a
substantial growth of fossil fuel consumption (BP, 2009). Figure 4.1 shows the
world‟s energy consumption by types of fuel from 1965 to 2006, where oil remains
the world‟s dominant fuel.
Figure 4.1 World energy consumption by types of fuel from 1965 to 2006 Source: BP Statistical Research of World Energy (2009)
Electricity is a secondary energy source which is generated by burning fossil fuels
such as oil, coal and natural gas, which are non-renewable primary sources of
energy. For its graphical illustration, see Figure 4.2. It is an extremely flexible form of
energy, and has been adapted to a huge, and growing, number of uses (Wald, 1990).
The burning of these fuels however produces pollutants and greenhouse gases
which are often associated with greenhouse effect and climate change, an example
of which is shown in Figure 4.3.

CLIMATE CHANGE AND ENERGY EFFICIENCY
127
SEAMEO
Chapter IV
Figure 4.2 A scheme of electricity generation, supply and distribution Source: Wikipedia (2006)
Figure 4.3 Emission of Smoke by a Coal-fired Power Station Source: MyEcoProject (2009)

CLIMATE CHANGE AND ENERGY EFFICIENCY
128
SEAMEO
Chapter IV
What is the Greenhouse Effect?
Greenhouse gases (GHGs) are natural gases that keep the earth warm by trapping
heat in the earth‟s atmosphere. The main greenhouse gases in the earth's
atmosphere are water vapour, carbon dioxide (CO2), methane (CH4), nitrous oxide
(N2O), and ozone (O3). GHGs are present in the atmosphere, and help stabilise our
climate. The Greenhouse Effect is the natural process of the atmosphere letting in
some of the energy we receive from the sun (e.g., ultraviolet and visible light), and
stopping it from being transmitted back out into space (i.e., infrared radiation or heat).
This makes the earth warm enough to support life.
Figure 4.4 The Greenhouse Effect
Source: WHO (2010)
However, during the past century, humans have substantially added to the amount of
greenhouse gases in the atmosphere by burning fossil fuels to produce energy for
our use. The added gases, primarily CO2 and CH4, are enhancing the natural
greenhouse effect, and likely contributing to an increase in global average
temperature and related climate changes (EPA, 2009).
The United Nations Intergovernmental Panel on Climate Change (IPCC, 2007)
reported that there has been an increase in GHGs in the earth‟s atmosphere since
1970. This is shown in Figure 4.5. CO2, the most important GHG besides water
vapour, is marked in red. Carbon dioxide emissions have nearly doubled from 15
Gigatons (GT) per year in 1970 to about 30 GT per year in 2004. The biggest chunk
of CO2 emissions comes from the widespread use of fossil fuels. CH4 and N2O
emissions from agriculture have risen as well.

CLIMATE CHANGE AND ENERGY EFFICIENCY
129
SEAMEO
Chapter IV
Figure 4.5 Increase in Greenhouse Gases from 1970 - 2001
Source: IPPC (2007)
The greenhouse effect is a natural process that plays a major part in shaping the
earth‟s climate. It produces the relatively warm and hospitable environment near the
earth‟s surface where humans and other life-forms have been able to develop and
prosper. It is one of a large number of physical, chemical and biological processes
that combine and interact to determine the earth‟s climate.
The Greenhouse Effect and Climate Change
The relationship between the enhanced greenhouse effect and global climate change
is far from simple. Not only do increased concentrations of GHGs affect the
atmosphere, but also the oceans, soil and biosphere. These effects are still not
completely understood.
Any changes in the relative mix and atmospheric concentration of GHGs, whether
natural or human-induced, will lead to changes in the radiative balance of the
atmosphere, and hence the level of greenhouse warming. Studies on global climate
models have drawn clear links between increased concentrations of GHGs and
large-scale surface warming and other changes of climate. Serious concern at the
prospect of irreversible changes to climate as a result of human activities was found
on two closely linked considerations;
CLIMATE CHANGE AND ENERGY EFFICIENCY
130
SEAMEO
Chapter IV
the expectation that the burning of fossil fuels since the Industrial Revolution
would eventually lead to significant build-up of CO2 in the atmosphere; and
simple physical arguments which suggest that the greater the concentration
of CO2 in the atmosphere, the greater the surface warming.
As such, climate change will mean warmer temperatures that will change rainfall patterns, causes snow and ice to melt and affect the intensity of extreme weather such as storms and heat waves. We have already begun to experience some of these impacts and many other knock-on effects to the world (Met Office, 2009).
However, there are many approaches that can be taken to mitigate climate changes.
With regards to energy consumption, renewable energy (RE) and energy efficiency
(EE) are the potential approaches to contribute to a better environment that we live
in.
What is Renewable Energy (RE)?
RE is energy which comes from natural resources which are naturally replenished
(renewable) and cannot be depleted as compared to fossil fuels sources of energy
(non-renewable). Non-renewable energy sources are depleted and cannot be
recreated in a short period of time.
RE can be used repeatedly without depletion. It has no polluting emissions hence it
does not contribute to climate change. Above all, RE has a much lower
environmental impact than the conventional sources of energy. RE is an alternative
source of energy. The sources of RE include the sun, wind, tidal, wave, geothermal
and biomass.
Sun
The sun’s warmth and light produce solar energy. Passive use of solar energy
involves directly capturing its warmth and light through building design. Active use
happens by using technology to transform the sun‟s energy into electricity.
Photovoltaic cells or solar panels and solar hot water systems are examples of active
use. Figure 4.6 shows the method of transforming sun light into electricity using solar
panels.

CLIMATE CHANGE AND ENERGY EFFICIENCY
131
SEAMEO
Chapter IV
Figure 4.6 Conversion of sun light into electricity Source: Partha Das Sharma (2009)
Wind
Wind energy is the world‟s fastest-growing energy source. It is a form of solar energy
as weather processes that are influenced by the sun cause wind. Windmills have
been used for hundreds of years. Large and small wind turbines in many countries
now generate electricity for industry, homes and remote dwellings and villages. Wind
turbines can be situated on land or off-shore. Figure 4.7 shows the conversion
system of wind energy into electricity.

CLIMATE CHANGE AND ENERGY EFFICIENCY
132
SEAMEO
Chapter IV
Figure 4.7 Wind energy system Source: MyEcoProject (2009)
Wave
Wave energy is essentially stored, concentrated wind energy. The waves are created
by the progressive transfer of energy from the wind as it blows over the surface of the
water. The wave can then be used to create electricity applying one of the methods
as shown in Figure 4.8.

CLIMATE CHANGE AND ENERGY EFFICIENCY
133
SEAMEO
Chapter IV
Figure 4.8 System for utilisation of wave energy to produce electricity Source: California Energy Commission (2006)
Tidal
Tidal energy is energy that can be obtained from the changing sea levels. The tidal
process utilises the natural motion of the tides to fill reservoirs, which are then slowly
discharged through electricity-producing turbines. This is shown in Figure 4.9.
Figure 4.9 Production of tidal energy
Source: Wikipedia (2009)

CLIMATE CHANGE AND ENERGY EFFICIENCY
134
SEAMEO
Chapter IV
Electricity
Organic Humus
BIOMASS BIOMASS
DIGESTER
GENERATOR ELECTRICAL
TRANSFORMER
SLUDGE
Biomass
Biomass is biological material derived from living organisms. There are many
sources of biomass, including:
Agricultural crops (e.g., sugar cane, corn and rapeseed)
Agricultural residue
Paper mill residue
Urban wood waste
Forest residue
Animal waste and sewage
These sources of energy are renewable as their replacement is rapid compared to
that of fossil fuels. Figure 4.10 shows a simple diagram which summarises the
electricity generated from biomass.
Figure 4.10 Electricity generation from biomass
Geothermal
Geothermal energy is another kind of renewable energy. It is derived from heat that
is stored deep in the Earth's crust. Where this heat rises to the near-surface and
heats groundwater, hot water and steam are produced. It can be directly used for
domestic heating or for generation of electricity. Figure 4.11 shows the use of
geothermal energy to generate electricity.

CLIMATE CHANGE AND ENERGY EFFICIENCY
135
SEAMEO
Chapter IV
Figure 4.11 Conversion system of geothermal energy into electricity Source: MyEcoProject (2009)
Clean Energy Generation of Thailand (A Case Study)
Figure 4.12 Small hydroelectric power generation Source: USAID (2009)
Small-scale producers in Thailand are tapping alternative energy sources, including
water, to reduce air pollution and decrease the country's reliance on energy imports.
"Our outreach efforts
have led to at least 3
Mega Watts (MW) of
additional planned
installations in
Thailand - enough
electricity for 12,000
homes," says Palang
Thai's Chris Greacen.
"USAID's support
throughout has been
essential to our
efforts."

CLIMATE CHANGE AND ENERGY EFFICIENCY
136
SEAMEO
Chapter IV
Challenge
Thailand currently relies on imports, mainly crude oil, to satisfy about half of its
energy needs. With a view to reducing pollution and strengthening energy security
and competitiveness, the country is increasingly exploring ways to meet growing
consumer and industrial needs with domestic renewable resources. Water, solar,
wind, biomass and biogas generation are economically viable and could meet more
than a tenth of Thailand's demand. Adopting these technologies, however, has been
limited by various obstacles, including a lack of support for small-scale renewable
energy producers, who were not allowed to sell electricity to utilities due to concerns
about safety and compatibility.
Initiative
With assistance from USAID, a group of volunteers drafted the legislation in 2002 to
allow small community- or entrepreneur-owned renewable energy generators to
connect to the grid and sell excess electricity to utilities. Due in part to dialogue
sparked by a USAID-sponsored study tour to the United States and training course in
Bangkok for government representatives, the new regulations were approved later
that year. USAID helped supply expertise and guidance through a partnership with
California-based utilities with substantial experience in small-scale renewable energy.
USAID also supported the organization Palang Thai in ensuring smooth
implementation of the new regulations by supplying energy experts to work with the
government on policy, and helping small-scale generators resolve technical and
contractual barriers.
Results
The new legislation has encouraged the development of clean energy resources
while improving Thailand's environment, building local economies and reducing
reliance on imported fuels. Eight small-scale generators have started to sell power to
the national grid, while more than 40 others, with a combined generating capacity of
over 6 MW, have been given permission to connect to it. With this steady increase in
renewable energy sources coming on line, the Thai government is now expanding
the regulations to include larger renewable energy generators that can produce up to
5 MW (USAID, 2009).
What is Energy Efficiency (EE)?
EE or energy efficiency use means using less energy to provide the same level of
energy service. In other words, EE is the practice of reducing the amount of energy
used without reducing the end-use benefits enabled by that energy (EPRI, 2010). In
terms of electricity energy use, it means using electricity wisely in order to
accomplish the same task whether at home or at the workplace. EE can also be
defined as lesser energy we use to generate at power plants, which reduces GHGs
emission and improves the quality of our air (Energy Star, 2010).

CLIMATE CHANGE AND ENERGY EFFICIENCY
137
SEAMEO
Chapter IV
Conclusion
Our world is experiencing climate change. One of the main causes for this is the
burning of fossil fuels to produce energy for our use. Efforts should be made to
mitigate this issue such as the use of RE as an alternative to non-renewable energy
and EE practices. RE contributes to less dependency on fossil fuels energy sources
while EE contributes to less consumption of energy to achieve the same level of
quality of life. Both contribute to a better environment that we live in.

CLIMATE CHANGE AND ENERGY EFFICIENCY
138
SEAMEO
Chapter IV
REFERENCES
BP Statistical Review of World Energy. (2009). Retrieved on 24 October 2010 from
http://www.bp.com/liveassets/bp_internet/globalbp/globalbp_uk_english/reports_
and_publications/statistical_energy_review_2008/STAGING/local_assets/2009_d
ownloads/statistical_review_of_world_energy_full_report_2009.pdf
California Energy Commission. (2006). Energy story. Retrieved on 24 October 2010
from http://www.energyquest.ca.gov/story/chapter14.html
Electric Power Research Institute (EPRI). (2010). End-use energy efficiency and
demand response in a low-carbon future – program 170. Retrieved on 25
October 2010 from http://mydocs.epri.com/docs/Portfolio/PDF/2010_P170.pdf
Environmental Protection Agency (EPA) (2009). Endangerment and Cause or
Contribute Findings for Greenhouse Gases under Section 202(a) of the Clean Air
Act. Retrieved on 25 October 2010 from
http://epa.gov/climatechange/endangerment.html
Energy Star (2010). Why energy efficiency. Retrieved on 24 October 2010 from
http://www.energystar.gov/index.cfm?c=about.ab_learn_more
Hemming, D. (2010). Climate change -The evidence and the impacts. Retrieved on 22 October 2010 from http://www.metoffice.gov.uk/climatechange/guide/keyfacts/Climate%20change%20-%20the%20evidence%20and%20the%20impacts%20transcript.pdf
Met Office (2009). Retrieved on 25 October 2010 fromhttp://www.metoffice.gov.uk/
MyEcoProject (2009). Causes and Effects of Air Pollution. Retrieved on November
11, 2010 from http://myecoproject.org/get-involved/pollution/causes-and-effects-
of-air-pollution/
MyEcoProject (2009). Funds to Enhance Short-Term Wind Forecasting and
Accelerate Midsize Wind Turbine Development Retrieved on November 11, 2010
from http://myecoproject.org/tag/steven-chu/
Partha Das Sharma (2009). Keeping world environment safer and cleaner. Retrieved on 24 October 2010 from http://saferenvironment.wordpress.com/2009/02/02/solar-power-%E2%80%93- sustainable-green-energy-to-protect-our-economy-and-environment/, 2010
(IPCC) (2007). Climate change 2007: Fourth Assessment Report (AR4). Retrieved
on 24 October 2010 from
http://knowledge.allianz.com/en/globalissues/climate_change/global_warming_ba
sics/ipcc_report_facts.html

CLIMATE CHANGE AND ENERGY EFFICIENCY
139
SEAMEO
Chapter IV
USAID, (2009). Telling Our Story, Renewable Energy Boosts Economy; A Case
Study in Thailand. Retrieved on 26, 2010 from http://www.usaid.gov/stories/thailand/cs_th_renewable.html
Wald, M. L. (1990). Growing use of electricity raises questions on supply. New York
Times. Retrieved on 24 October 2010 from
http://query.nytimes.com/gst/fullpage.html?res=9C0CE6DD1F3AF932A15750C0
A966958260
Wikipedia. (2006). Transformer in the Power Grid; (Theresa Knott), Retrieved on Nov
10, 2010 from http://en.wikibooks.org/wiki/File:Transformers_in_the_power_grid.png
Wikipedia (2009). Production of Tidal Energy (Evopod Lighter). Retrieved on
November 11, 2010 from http://en.wikipedia.org/wiki/File:Evopod_lighter.jpg WHO, (2010). Weather and climate: changing human exposures. Retrieved on
November 11, 2010 from http://www.who.int/globalchange/summary/en/index1.html
CLIMATE CHANGE AND ENERGY EFFICIENCY
140
SEAMEO
Chapter IV
Lesson 1
CHOOSING A GREENER ENERGY
GRADE LEVEL: High School
SUBJECT(S): Integrated Science (General Science)
TOPIC: Renewable and Non-Renewable Energy
PREREQUISITE
Students should have prior knowledge about the forms of energy and sources
of energy.
Three days before the actual session, ask the students to search for news
articles and write-ups about the different energy sources available in their
community/country. Articles which are published online may also be used.
DURATION: 2 sessions
LEARNING OBJECTIVES
Subject Matter Objectives: By the end of this session, students should be able to:
differentiate renewable from non-renewable energy sources;
classify the sources of energy into renewable and non-renewable energy group; and
give practical ways to conserve energy.
Climate Change Objectives:
discuss how the massive production of greenhouse gases from fossil fuels
can cause global warming and climate change; and
cite practical measures to reduce the production of greenhouse gases which
cause global warming and climate change.
MAIN CONCEPTS AND SKILLS
Renewable energy is energy which is generated from natural sources like the
sun, wind, rain, tides and can be generated again and again as and when
needed. They are available in abundance and by far the cleanest sources of
energy available.

CLIMATE CHANGE AND ENERGY EFFICIENCY
141
SEAMEO
Chapter IV
Non-renewable energy is energy which is taken from sources that are available
on the earth in limited quantity. Non-renewable sources are not environment-
friendly and can have serious effects on living organisms. These are called non-
renewable because they can be re-generated within a short span of time. These
sources of energy exist in the form of fossil fuels, natural gas, oil and coal.
Greenhouse gases (GHGs) are natural gases that keep the earth warm by
trapping heat in the earth‟s atmosphere. The main greenhouse gases in the
earth's atmosphere are water vapor, carbon dioxide (CO2), methane (CH4),
nitrous oxide (N2O), and ozone (O3).
GHGs are present in the atmosphere, and help stabilise our climate.
Greenhouse effect is a natural process in the atmosphere. It makes the earth
warm enough to support life by letting in some of the energy in the form of
ultraviolet and visible light we receive from the sun and by stopping the infrared
radiation/heat from being transmitted back out into space.
Global warming is the increase of Earth's average surface temperature due to
the effect of GHGs, such as CO2 emissions from burning fossil fuels or from
deforestation, which trap heat that would otherwise escape from Earth.
Using text-analysis and consequence map, students could differentiate and
classify the energy sources into renewable and non-renewable.
MATERIALS NEEDED
Poster on global warming or a video on global warming
News articles and write-ups about energy sources
Flip chart sheets or kraft paper (Mahjong paper) and marker
PRESENTATION OF LESSON
Scenario
The teacher will present a poster on global warming or if available a video on
global warming. After the presentation, the teacher will lead the students‟
reflection on what they have observed and allow them to discuss the causes of
global warming. Highlight the excessive production of GHGs as the main cause
of global warming.
Guide Questions:
1. What caught your attention about this poster or video? What facts do we
know about this situation?
2. What seems the most critical part of the poster or video?
3. Which parts depicted global warming? What causes global warming?
CLIMATE CHANGE AND ENERGY EFFICIENCY
142
SEAMEO
Chapter IV
4. What is greenhouse effect? And, what are greenhouse gases?
5. What human activities contribute to the excessive production of
greenhouse gases?
6. Do you think that the sources of energy that we used to run our industries
and to provide comfort to our home and/or in the workplace also
contribute to the excessive production of greenhouse gases?
7. Is it possible to reverse global warming? Why?
8. Are there ways to lessen the production of greenhouse gases?
Student Activities
For this lesson, the teacher may choose to implement any of the following
activities depending on the level of abilities of the students.
Option 1) Develop a consequence map of the different sources of energy
which are renewable and non-renewable.
Option 2) Organise a debate about the advantages and disadvantages of
using alternative sources of energy.
Option 3) Draw a comic strip about the advantages of renewable energy sources compared to non-renewable energy.
Process Guide for Teachers
1. During class discussion about global warming and excessive production of
GHGs, capture the students‟ responses which may lead them in
understanding the energy sources. Ask the students to mention the sources
of energy that the country depends on to support industries and the
communities. Take note of these energy sources because these will be the
information materials that the students will work on in their group activity.
2. Organise the class into working groups and assign one source of energy for
each group.
3. Explain how to develop a Consequence Map by presenting the sample
diagram below:

CLIMATE CHANGE AND ENERGY EFFICIENCY
143
SEAMEO
Chapter IV
Risks or Disadvantages Benefits or Advantages
4. Distribute copies of the news articles and write-ups about the different energy
sources. These articles and write-ups will help the group in developing their
consequence map. Guide each group as they work on the map. Assess the
group‟s process using the attached Performance Rubric in Attachment 4.1.1.
5. Advise the class that after the completion of the consequence map, there will
be a plenary presentation of all the outputs. Assess the group‟s output using
the Performance Rubric.
6. After the presentation, ask the students to classify the energy sources into
two groups by utilising the information about energy sources.
7. Check how the students classify the energy sources and provide comments if
necessary.
8. Introduce the terms renewable energy and non-renewable energy. Ask the
students why the first group is called renewable and the other non-renewable.
9. Process the students‟ learning experiences using the following guide
questions:
a. What is the difference between renewable and non-renewable sources of
energy?
b. Which energy source generates lesser hazardous impact in our
environment?
c. What are the possible ways that we can adopt to effectively utilise the
available energy sources in our country?
d. Do you think it‟s about time for our country to explore alternative energy
sources? Why or why not?
If coal will be
used as the
major energy
source in the
country
air quality
maybe
affected
create more
health
problems in
the community
abundant
supply
less
expensive

CLIMATE CHANGE AND ENERGY EFFICIENCY
144
SEAMEO
Chapter IV
e. What can alternative energy sources do to mitigate or alleviate (ease) the
effects of global warming and climate change?
Closure
Summarise the students‟ learning insights by presenting a concept map about energy sources.
Achieving the Objectives
Objective This is achieved by
Differentiate renewable from non-
renewable sources of energy.
Students‟ participation in the
preparation of consequence map on the
different sources of energy and in the
group presentation.
Classify the sources of energy into
renewable and non-renewable
energy group.
Students‟ interaction during the
preparation of consequence map and in
the group presentation.
Give practical ways to conserve
energy.
Students‟ participation in class
discussion and group activity.
Discuss how massive production of
greenhouse gases from fossil fuels
can cause global warming and
climate change.
Reflection of students on human
activities and industries that contribute
to excessive production of greenhouse
gases in the scenario presentation.
Cite practical measures to reduce
the production of greenhouse gases
which causes global warming and
climate change.
Sharing of students‟ daily experiences
and ideas on the practical methods of
efficient use of energy during the
scenario presentation (e.g., energy
saving bulbs, hybrid car).
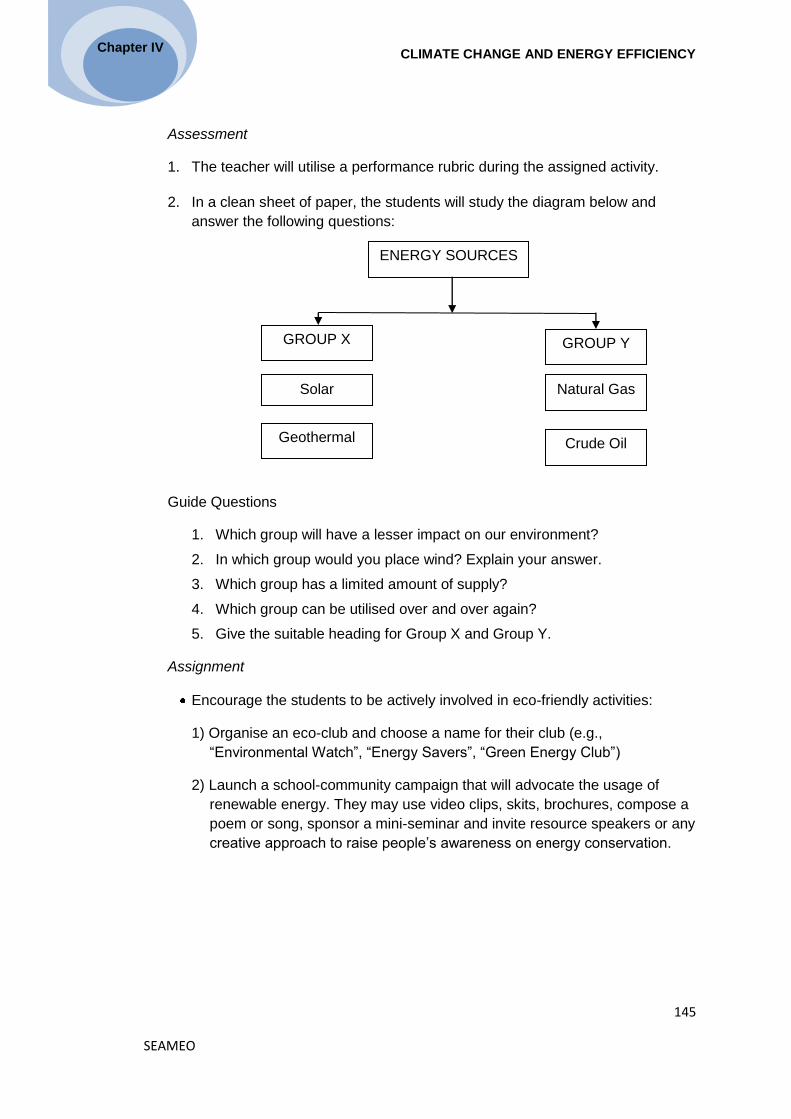
CLIMATE CHANGE AND ENERGY EFFICIENCY
145
SEAMEO
Chapter IV
Assessment
1. The teacher will utilise a performance rubric during the assigned activity.
2. In a clean sheet of paper, the students will study the diagram below and
answer the following questions:
Guide Questions
1. Which group will have a lesser impact on our environment?
2. In which group would you place wind? Explain your answer.
3. Which group has a limited amount of supply?
4. Which group can be utilised over and over again?
5. Give the suitable heading for Group X and Group Y.
Assignment
Encourage the students to be actively involved in eco-friendly activities:
1) Organise an eco-club and choose a name for their club (e.g.,
“Environmental Watch”, “Energy Savers”, “Green Energy Club”)
2) Launch a school-community campaign that will advocate the usage of
renewable energy. They may use video clips, skits, brochures, compose a
poem or song, sponsor a mini-seminar and invite resource speakers or any
creative approach to raise people‟s awareness on energy conservation.
ENERGY SOURCES
GROUP X GROUP Y
Solar
Geothermal
Natural Gas
Crude Oil

CLIMATE CHANGE AND ENERGY EFFICIENCY
146
SEAMEO
Chapter IV
RESOURCES
Andaya, C.V. (2008). Understanding the earth through environmental science. C&E Publishing, Inc.
Conserve Energy Future. (n.d.). What is Energy. Retrieved on 24 October 2010 from
http://www.conserve-energy-future.com/
Cubiodiesel.(2006). 5th Grade Introduction to Energy Resources : Renewable and
Nonrenewable Resources . Retrieved on 24 October 24, 2010 from
http://www.cubiodiesel.org/documents/5th%20Grade.pdf
Gibb, T. et al., (2006). Science and Technology 7.
Global Warming. (2010). Greenhouse gases and global warming. Retrieved on 24
October 2010 from http://www.globalwarming.org.in/green-house-gasses-
and- global-warming.php
Mendoza, E. et.al., (2003). Integrated Science Phoenix Science Series. Quezon City:
Phoenix Publishing House.
New Mexico Solar Energy Association. (2010). Global Warming FAQ. Retrieved on
24 October 24, 2010 from http://www.nmsea.org/Curriculum/Primer/Global_
Warming/fossil_fuels_and_global_warming.htm

CLIMATE CHANGE AND ENERGY EFFICIENCY
147
SEAMEO
Chapter IV
Attachment 4.1.1 Group Performance Rubric
Subject/Topic:________________________________________________________
Project/ActivityTitle:____________________________________________________
Date:_______________________________________________________________
Group Name:_________________________________________________________
Team Members:______________________________________________________
Group Process Below
Average Satisfactory Excellent
1. Has clear objective of final output
1, 2, 3 4, 5, 6 7, 8, 9
2. Properly organised to complete the task
1, 2, 3 4, 5, 6 7, 8, 9
3. Managed time wisely 1, 2, 3 4, 5, 6 7, 8, 9
4. Acquired needed information and knowledge base
1, 2, 3 4, 5, 6 7, 8, 9
5. Communicated efforts with teacher
1, 2, 3 4, 5, 6 7, 8, 9
Group Output Below
Average Satisfactory Excellent
1. Format of Output Presentation 1, 2, 3 4, 5, 6 7, 8, 9
2. Manner of communicating the output (i.e., speaking and writing)
1, 2, 3 4, 5, 6 7, 8, 9
3. Data organisation and structure 1, 2, 3 4, 5, 6 7, 8, 9
4. Creativity 1, 2, 3 4, 5, 6 7, 8, 9
5. Demonstrates knowledge on renewable and non-renewable energy sources
1, 2, 3 4, 5, 6 7, 8, 9, 10
6. Integrates concepts of renewable & non-renewable energy with climate change.
1, 2, 3 4, 5, 6 7, 8, 9
Source: http://www.teach-nology.com/cgi-bin/project_rub.cgi

CLIMATE CHANGE AND ENERGY EFFICIENCY
148
SEAMEO
Chapter IV
Lesson 2
SAVE ENERGY, SAVE THE EARTH
GRADE LEVEL: High School
SUBJECT: Physics
TOPIC: Measuring Electrical Energy
PREREQUISITE
Students should have prior knowledge about the concept of work, power and
energy.
They should also know how to measure current, voltage and resistance and
apply Ohm‟s law.
DURATION: 2 sessions
LEARNING OBJECTIVES
Subject Matter Objectives: By the end of this lesson, the students should be able to:
explain the concept of electric power;
calculate electrical energy; and
identify common household electrical devices that consume a lot of electricity.
Climate Change Objectives
cite ways to conserve electrical energy; and
explain how consumption of energy can affect climate change.
MAIN CONCEPTS AND SKILLS
Electric power is the rate of consuming energy. The unit of power is Watt
(W). One watt is the Power (P) generated by a current of 1 Ampere (A)
flowing due to a potential difference of 1 Volt (V).
Power = Voltage x Current
P = VI

CLIMATE CHANGE AND ENERGY EFFICIENCY
149
SEAMEO
Chapter IV
Electrical energy is sold in kilowatt-hours (kWh). The amount of electrical
energy consumed is equal to the power used multiply by the time it is
used. Note that electrical energy can also be expressed in Joule (kJ)
Energy = Power x Time
Energy (kWh) = (VI) t
All electrical devices or appliances are usually marked to show the
amount of power they consume and their operating voltage.
The electrical energy consumption of common household appliances or
devices like light bulbs can be measured using the Brightness Meter or
Data Logger.
MATERIALS NEEDED
Power pack, connecting wires, bulb holder, 3 different light bulbs (for each
group)
Flip chart sheets (Mahjong paper), marker pens (different colors)
Concept Cartoon sheets,
Brightness Meter or Data Logger[optional]
If the school has no Brightness Meters or Data Loggers, the teacher may
provide the brightness meter readings and change the instruction on the
Activity Worksheet.
PRESENTATION OF LESSON
Scenario
The teacher will present a video on the celebration of the “Earth Hour”. For
more information about the “Earth Hour” visit this website:
http://www.earthhour.org/
After the presentation of the video, ask the following questions.
1. What important events did you see?
2. What is the purpose of this world-wide project?
3. What form of energy is involved in this project?
4. Will this project help mitigate the effects of climate change? Why?

CLIMATE CHANGE AND ENERGY EFFICIENCY
150
SEAMEO
Chapter IV
Student Activities
Students will actively participate in a hands-on group activity to measure electrical energy using commercial light bulbs. They will analyse and present the results of this group work.
Process Guide for Teachers
1. Present a brief discussion about the concepts of electric power and electrical
energy and review the concepts of current, voltage and resistance.
2. Divide the class into working groups. Explain the procedure of the activity and
distribute the Students Worksheet to the students. (Attachment 4.2.1) You
can modify the Activity Worksheet based on classroom preference and
requirement.
3. While the students are working in groups, walk around to clarify possible
queries from the students to facilitate the activity.
4. Upon work completion, ask each group to present the results of their activity.
Provide comments on the quality of their outputs after each presentation.
5. Present ways to evaluate possible savings from changing the types of lamps
used. The efficiency of industrial lights varies based on how much light they
give off (in lumens) in relation to how much energy they consume (in watts).
The efficiency of lights range from under 20 lumens per watt for incandescent
lamps up to 185 lumens per watt for low pressure sodium lamps.
6. Distribute the Assessment Worksheet to students.(See Attachment 4.2.2)
7. Draw the connection between wastage of energy and climate change and
discuss its relationship using the Concept Cartoons. (Attachment 4.2.3)
Closure
1. Discuss with the students the connection between wastage of energy and
climate change by using the Concept Cartoon Sheet. Reiterate that most
power plants generate electricity by burning coal and other fossil fuels and
thus contribute to greenhouse gases. Emphasise the values and importance
of saving energy.

CLIMATE CHANGE AND ENERGY EFFICIENCY
151
SEAMEO
Chapter IV
2. Connect the concept of conserving electrical energy to mitigate the effects of
climate change as shown below:
3. Ask for suggestions from students on how to possibly reduce our GHG
releases. Examples:
Energy conservation (e.g., unplug appliances when not in use, do not overcharge your mobile phones).
Improve energy efficiency (e.g., shift from incandescent bulbs to compact fluorescent lights or better yet, shift to Light Emitting Diodes [LED]).
Promote and shift to alternative, renewable fuel (non-fossil fuel such as wind, solar and biomass).
Control urban sprawl (minimise dependence on motorised transport to move people, services and products).
Improve mass transport system.
Achieving the Objectives
Objective This is achieved by
Explain the concept of electric power.
Students‟ interaction during class discussion and performance in group activity.
Calculate electrical energy.
Observing and collecting information about the various light bulbs. Students calculate power using the formula: E = Power x Time
Identify common household electrical devices that consume a lot of electricity.
Students answer the Assessment Worksheet.
Explain how consumption of energy can affect climate change.
Students justify their ideas, in group discussion and student-teacher interaction.
Cite ways to conserve electrical energy.
Brainstorming for new possibilities, organising and launching a community-based “Earth Hour” project.
Less emission
of CO2
Reduce Global
Warming
Less generation
of energy
Less usage
of energy
CLIMATE CHANGE AND ENERGY EFFICIENCY
152
SEAMEO
Chapter IV
Assessment
1) During the lesson process:
Observe how the students carry out the task in the Student’s Worksheet
(Attachment 4.2.1), i.e., collection of information, discussion and debate.
Use the group activity rubric to evaluate their performance.
Check on the calculation of electrical energy using the three different light
bulbs.
Assess the groups‟ presentation and justification of their choice of light
bulb. Use the group presentation rubric to assess their performance.
2) After the lesson, review the students‟ responses from the Assessment
Worksheet.
Assignment
Ask the students to organise and launch a community-based Earth Hour
project. They will conduct an inventory of the amount of electrical energy
saved during the event.
RESOURCES
Chansigaud (2005) Retrieved on 11 April, 2011 from
http://en.wikipedia.org/wiki/File:Simple_chem_distillation.PNG
Chew, C. (2008). GCE „O‟ Level Physics Matters. Marshall Cavendish Education.
Ehow. (2010). How to calculate the energy efficiency of lighting in an industrial
facility. Retrieved on 25 October 2010 from http://www.ehow.com/how
_5723969_calculate-efficiency-lighting- industrial-facility.html
Ewen, D., et.al (2009). Applied Physics 9th Edition. Pearson Prentice Hall.
Lunar Accents. (2008). Electrical efficiency LED lighting. Retrieved on 24 October
2010 from http://www.lunaraccents.com/educational-Electrical-efficiency-LED-
lighting.html
Padlekas (2005) Retrieved on 11 April, 2011 from
http://en.wikipedia.org/wiki/File:Berlese.svg
Pico Technology. (2010). Investigating the efficiency of a light Bulb. Retrieved on 24
October 24, 2010 from
http://www.picotech.com/experiments/bulb_efficiency/index.html
Polimerik (2010): Retrieved on 11 April, 2011 from
http://en.wikipedia.org/wiki/File:Evaporating_dish.svg
West Side Systems. (2000). How do I light thee? Let me count the ways. Retrieved
on 24 October 24, 2010 from http://www.westsidesystems.com/rays.html

CLIMATE CHANGE AND ENERGY EFFICIENCY
153
SEAMEO
Chapter IV
Attachment 4.2.1 Student’s Worksheet
THE ENERGY SAVING BULB
Instructions:
1. Turn on the switch and observe the brightness of each bulb as shown below.
2. Use a Brightness Meter and record the brightness of the bulbs.
3. Gather some data about each bulb by inspecting the information on the
respective light boxes.
Sources: RTCNCA (2010) Armin Kübelbeck (2007) Adamantios (2007)

CLIMATE CHANGE AND ENERGY EFFICIENCY
154
SEAMEO
Chapter IV
Using the Brightness Meter or Data Logger, measure the brightness of each bulb and
record your readings in Table A below.
Table A
Type of
Light Bulb
Brightness Power *Energy Consumed after
1 hour
(Energy = Power x Time)
Cost of Usage
at 10 cents per
kJ
A
100 W
B 20W
C 18W
* Note: kilowatt-hour (kWh) may also be used as a unit of measure.
5. Refer to the packaging boxes of the bulbs. Record the power for each bulb in
Table A above. Then calculate the energy consumed by each bulb.
a. Which bulb consumes the highest energy?
………………………………………………………………………………………
………………………………………………………………………
b. What do you notice about the brightness of the bulbs?
………………………………………………………………………………………
………………………………………………………………………
c. Which bulb is energy saving?
………………………………………………………………………………………
……………………………………………………………………….

CLIMATE CHANGE AND ENERGY EFFICIENCY
155
SEAMEO
Chapter IV
6. Use the information in Table B and answer the following questions. This is just a sample data. You may use the actual data available in your community. Table B
Type of Light Bulb Feature *Price per Unit
(Convert currency
unit if necessary)
Life Span
A
Soft white RM 1.70 150 hours
B White RM 12.90
8000 hours
C White RM 13.93 5500 hours
Guide Questions
a. Which light bulb is the cheapest? ………………………
b. Which light bulb has the longest life span? ………………………
c. Which light bulb will you choose? Why? Explain. ……………..……
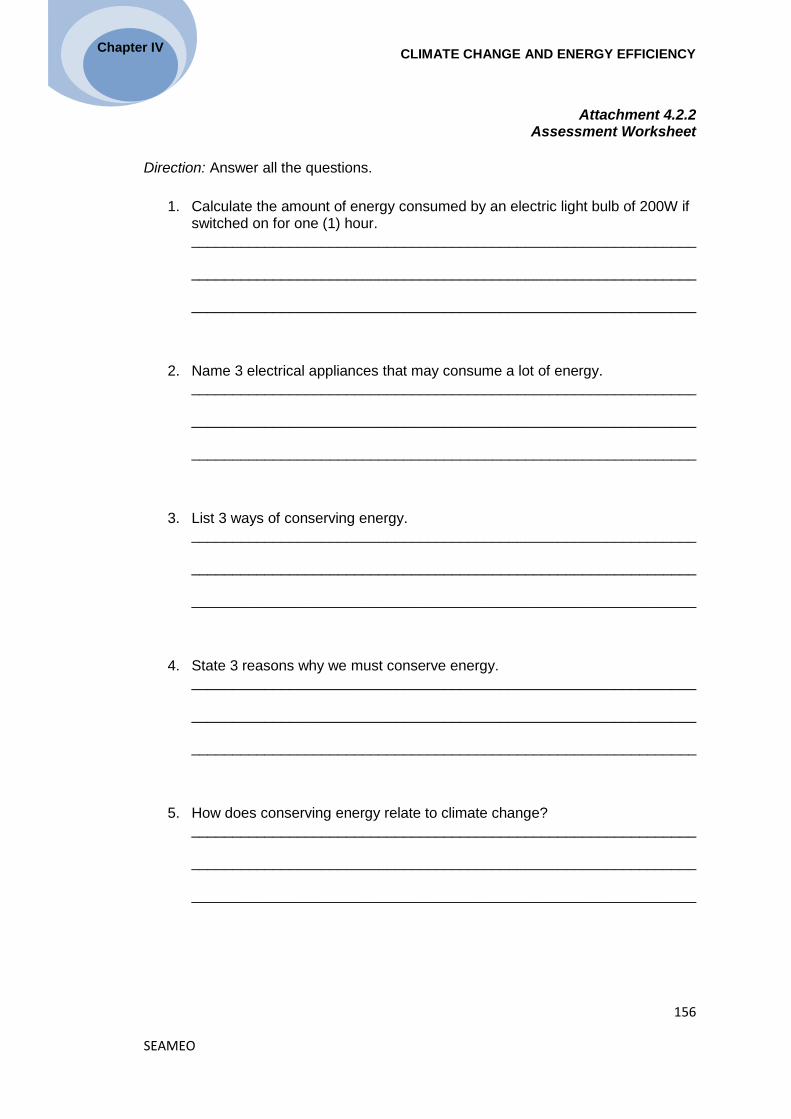
CLIMATE CHANGE AND ENERGY EFFICIENCY
156
SEAMEO
Chapter IV
Attachment 4.2.2 Assessment Worksheet
Direction: Answer all the questions.
1. Calculate the amount of energy consumed by an electric light bulb of 200W if switched on for one (1) hour. ______________________________________________________________
______________________________________________________________
______________________________________________________________
2. Name 3 electrical appliances that may consume a lot of energy. ______________________________________________________________
______________________________________________________________
______________________________________________________________
3. List 3 ways of conserving energy. ______________________________________________________________
______________________________________________________________
______________________________________________________________
4. State 3 reasons why we must conserve energy. ______________________________________________________________
______________________________________________________________
______________________________________________________________
5. How does conserving energy relate to climate change? ______________________________________________________________
______________________________________________________________
______________________________________________________________

CLIMATE CHANGE AND ENERGY EFFICIENCY
157
SEAMEO
Chapter IV
Attachment 4.2.3 The Concept Cartoon
WHAT DO YOU THINK?
Direction: Read the cartoon script carefully and answer the following guide questions:
Guide Question:
1. Does the size of the bulb determine the amount of energy it uses? 2. Does making the light dimmer prolong the life of a light bulb? 3. Do all bulbs of the same brightness use the same amount of energy? 4. Does a low wattage bulb give dimmer light?
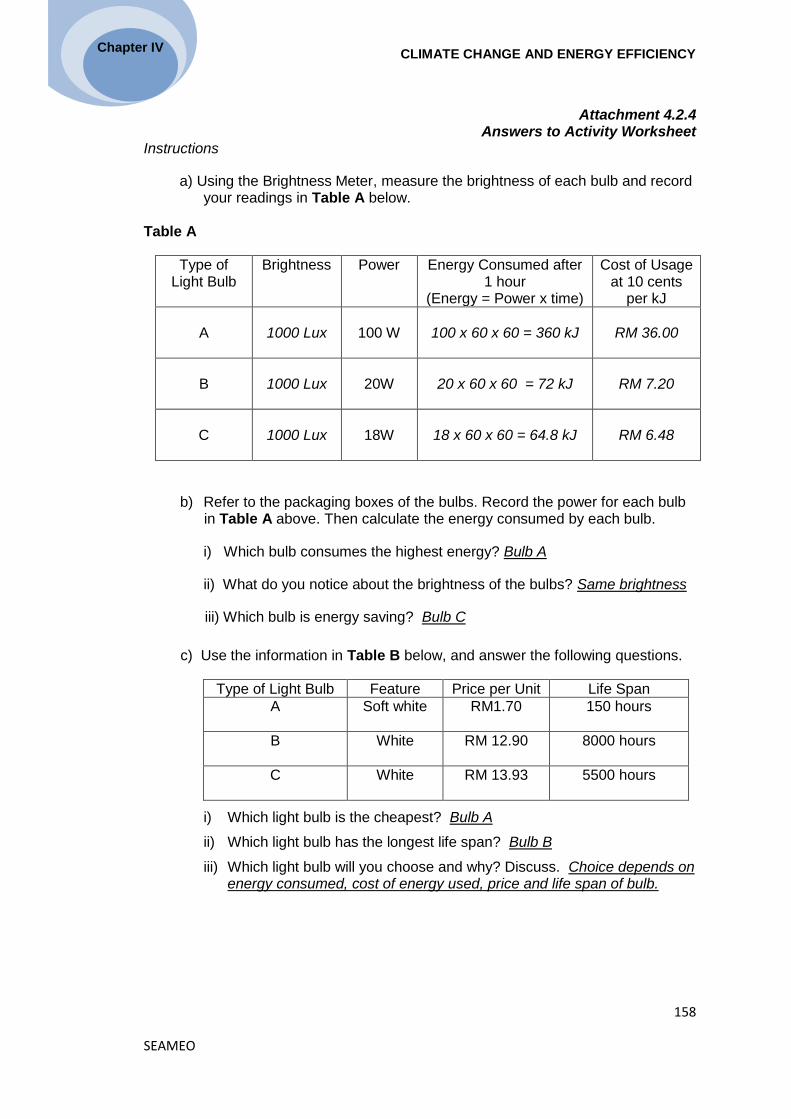
CLIMATE CHANGE AND ENERGY EFFICIENCY
158
SEAMEO
Chapter IV
Attachment 4.2.4 Answers to Activity Worksheet
Instructions
a) Using the Brightness Meter, measure the brightness of each bulb and record your readings in Table A below.
Table A
Type of Light Bulb
Brightness Power Energy Consumed after 1 hour
(Energy = Power x time)
Cost of Usage at 10 cents
per kJ
A
1000 Lux
100 W
100 x 60 x 60 = 360 kJ
RM 36.00
B
1000 Lux
20W
20 x 60 x 60 = 72 kJ
RM 7.20
C
1000 Lux
18W
18 x 60 x 60 = 64.8 kJ
RM 6.48
b) Refer to the packaging boxes of the bulbs. Record the power for each bulb in Table A above. Then calculate the energy consumed by each bulb.
i) Which bulb consumes the highest energy? Bulb A
ii) What do you notice about the brightness of the bulbs? Same brightness
iii) Which bulb is energy saving? Bulb C
c) Use the information in Table B below, and answer the following questions.
Type of Light Bulb Feature Price per Unit Life Span
A
Soft white RM1.70 150 hours
B White RM 12.90
8000 hours
C White RM 13.93 5500 hours
i) Which light bulb is the cheapest? Bulb A
ii) Which light bulb has the longest life span? Bulb B
iii) Which light bulb will you choose and why? Discuss. Choice depends on energy consumed, cost of energy used, price and life span of bulb.

CLIMATE CHANGE AND ENERGY EFFICIENCY
159
SEAMEO
Chapter IV
Attachment 4.2.5 Answers to Assessment Worksheet
1. What is the principle of conservation of energy?
In a closed system energy cannot be created nor be destroyed. It can be transformed into different forms.
2. Calculate the amount of energy used when an electric light bulb of 200W is
switched on for 1hour.
200 x 60 x 60 = 720 000 J (720 kJ) 3. Name 3 electrical appliances that may consume a lot of energy.
Example: water heater, oven, electric kettle, hot plate, air conditioner
4. List 3 ways of conserving energy.
i) Switch off the electrical appliance when not in use
ii) Use renewable energy such as solar energy
iii) Buy energy conserving electrical appliances
5. State 3 reasons why we must conserve energy.
i) Save money
ii) Reduce emission of CO2
iii) Reduce green house effect
6. How does conserving energy relate to climate change?
Resources
Reduce
Global
Warming
Less emission
of CO2
Less generation
of energy
Less usage
of energy

CLIMATE CHANGE AND ENERGY EFFICIENCY
160
SEAMEO
Chapter IV
Lesson 3
ELECTRICAL ENERGY AND CARBON FOOTPRINT:
WHICH FITS BEST?
GRADE LEVEL: Fourth Year High School (Grades 10 to 11)
SUBJECT: Advanced Mathematics, Statistics
TOPIC: Measures of Central Tendency and Line of Best Fit
PREREQUISITE
1. Students should have good background knowledge on Mean, Median, and
Mode.
2. Knowledge on how to draw a graph given a table of values using graphing
paper and using MS Excel.
3. Students should be given time to watch the Hollywood movie “2012‟‟ prior to
the lesson.
DURATION: 2 to 3 sessions
LEARNING OBJECTIVES
Subject Matter Objectives: By the end of this lesson, students should be able to:
identify the best measures of central tendency (i.e., mean, median, and
mode) that can be utilised to analyse a given data;
calculate the appropriate measures of central tendency given a set of data;
plot the line of best fit and calculate its slope (gradient) and give its
interpretation;
apply the concept of equation of straight lines through extrapolation and use it
to predict possible temperature change in the future; and
use the line of best fit to predict the amount of money the school has to pay
for energy consumption per month or per annum.
Climate Change Objectives:
identify the implications of a general increase in temperature over a period of
years;
determine the factors to consider when the earth‟s temperature is rising by a
certain amount of degrees using gradient (or slope) obtained;

CLIMATE CHANGE AND ENERGY EFFICIENCY
161
SEAMEO
Chapter IV
relate the increase in annual energy consumption with the general increase in
atmospheric temperature;
suggest ways to reduce energy consumption thus, reducing the carbon
footprint; and
take the initiative to reduce the energy consumption through sustainable
practices.
MAIN CONCEPTS AND SKILLS
Extreme weather will cause higher consumption and production of energy,
whereby energy use with emission of gases e.g., CO2 will contribute to
greenhouse effect with subsequent impact on global warming and climate
change.
The earth‟s temperature rises by a certain amount of degrees using gradient
(or slope) obtained. This is decided based on two (2) important data obtained:
a) The change in temperature colour shows an increase in temperature;
b) The straight line graph plotted by the students or from the Excel files
shows an average increase in temperature.
The students will experience firsthand application of statistics by studying the
temperature data.
The students will analyse and interpret the amount of electricity used by
the school for the past three years (e.g., 2007, 2008 and 2009). Using the
line of best fit, they will estimate the future energy consumption of the
school.
The slope or gradient in the equation which represents the data
determines how much is the increase on a given time interval.
The Mean, Median, and Mode are important measures of central
tendency that can be used to interpret data. The mean, shows what is
“typical” to the data; the median gives the information on median value
and; the mode gives the information on how much is the largest value.
Using their skills in interpreting graphs and presentation, the students will be
aware of their role and contribution in reducing electrical consumption in their
school and homes.
MATERIALS NEEDED
white board, laptop and LCD for presentation
three years monthly electric bills of the school
temperature data from meteorological department/government agency (See
the URL below)

CLIMATE CHANGE AND ENERGY EFFICIENCY
162
SEAMEO
Chapter IV
(i). http://www.TuTiempo.net
(ii) http://www.fightglobalwarming.com/carboncalculator.cfm
(iii) http://www.enviroduck.com/carbon_footprint_calculations.php
PRESENTATION OF THE LESSON
Scenario
Allow the class to view a portion of the Hollywood movie entitled “2012” which shows the damages after the catastrophe. After the video presentation, ask the students to recall the movie by answering the following questions:
What scenes caught your attention?
What do you think are the events that caused great damage to the
environment? Do you think it will happen in real life? Will it happen to
Earth in the future? Why or why not?
What could be the possible causes of these catastrophes in the movie?
What will you do differently to prevent those great catastrophes to
happen?
For the initial discussion, the students should be able to identify climate change as one of the key reasons for the changes on earth‟s temperature and to connect this phenomenon to energy consumption and the greenhouse effect. The teacher will then lead the students to understand and see the importance of data in relation to energy consumption and rising of Earths‟ surface temperature.
In this lesson, the students will use the school data on monthly electric
consumption for two or three consecutive years to predict how much energy can
be consumed in the next few years using the line of best fit. The line of best fit
can be generated using MS-EXCEL.
Student Activities
In this lesson, students will undergo three activities. Initially, they will study a
given graph that depicts the variations of the earth‟s surface temperature and
estimate the amount of “departure” (increase or decrease) in temperature.
Using these estimated values, they will identify the mean, median, and mode
and create their own “scatter plot” graph using MS EXCEL.
For the second activity, students will analyse another graph and identify the
given equations. Using the values behind the equation, they will determine
the average amount of change in temperature by year 2000. They will have to
explain how they arrive at their answer.
On the third activity, students will be given copies of the school‟s electric bill
consumption for the past three (3) consecutive years. If this is not available,
the teacher may ask the students to bring their home electric consumption bill
for the past two to three consecutive years. Using the given worksheet,

CLIMATE CHANGE AND ENERGY EFFICIENCY
163
SEAMEO
Chapter IV
students will analyse the pattern of electric consumption and make a
conclusion in relation to temperature. They will also brainstorm on how to
possibly reduce the consumption of electricity in relation to carbon footprint
Process Guide for Teachers
a. Show to the students a presentation related to change in climate which will
affect human lives and environment.
b. Organise the students in groups of five and ask the students to appoint a
leader for better coordination. Distribute the worksheet to each group.
(Attachment 4.3.1)
c. Seek the help of students in calculating the appropriate average and input
data to get an overall picture of temperature change.
d. Allow the students to interpret the data and answer the questions from the
worksheet.
e. Guide the students to the part in the worksheet which shows the school‟s
monthly electricity bills collected over a three-year period. Ask the students to
present the data and then interpret it.
f. Show to the students the correct data using the computer (Spreadsheet) for
their reference and discuss the issues (e.g., how to plot the line of best fit,
calculate the slope and interpret data).
g. Tell them to answer the questions in the worksheet in relation to electric
consumption and to suggest ways to reduce the electric bills/consumption.
h. Ask the students why electric consumption is related to carbon footprint.
i. Explain what carbon footprint is, if the students are not familiar with the
terminology.
j. Solicit ideas from students in finding ways to reduce electric energy usage.
k. Encourage students to make resolutions to become more responsible global
citizens and students of the school.
Closure (optional)
Allow each group to discuss among themselves for a few minutes and to present
their resolutions and summaries on what was learned in a creative way (e.g.,
poem, song, chant or slogan, others).
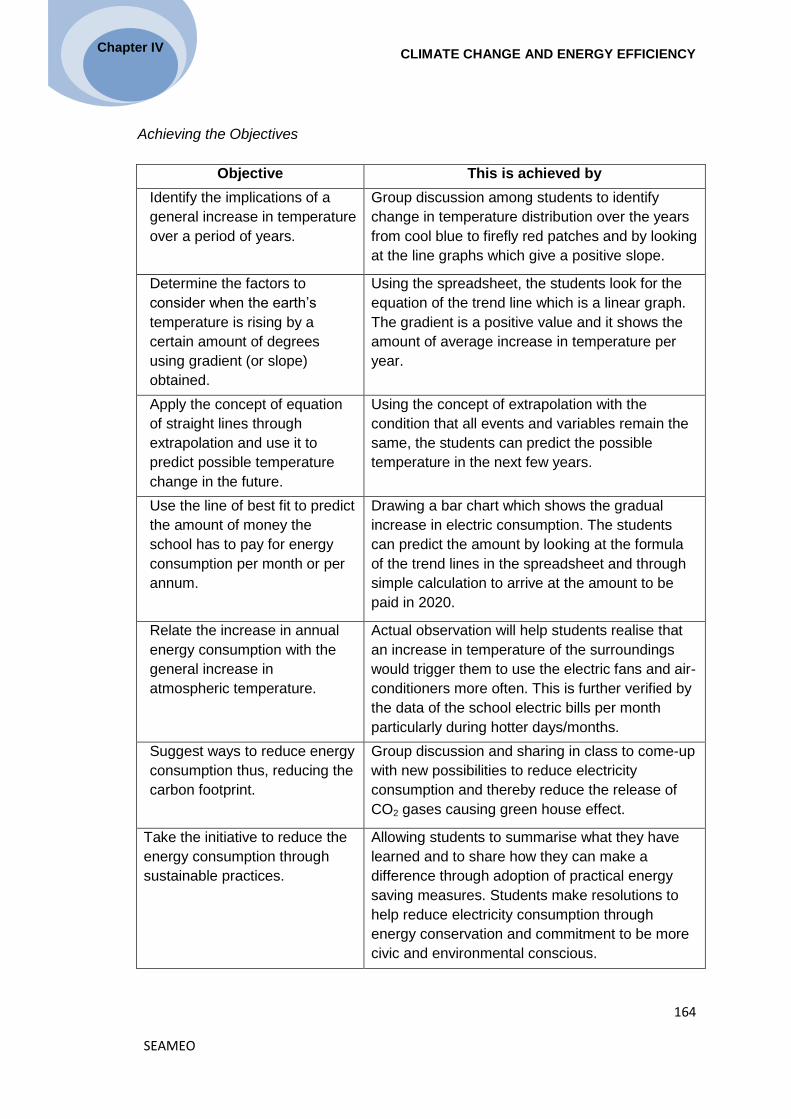
CLIMATE CHANGE AND ENERGY EFFICIENCY
164
SEAMEO
Chapter IV
Achieving the Objectives
Objective This is achieved by
Identify the implications of a
general increase in temperature
over a period of years.
Group discussion among students to identify
change in temperature distribution over the years
from cool blue to firefly red patches and by looking
at the line graphs which give a positive slope.
Determine the factors to
consider when the earth‟s
temperature is rising by a
certain amount of degrees
using gradient (or slope)
obtained.
Using the spreadsheet, the students look for the
equation of the trend line which is a linear graph.
The gradient is a positive value and it shows the
amount of average increase in temperature per
year.
Apply the concept of equation
of straight lines through
extrapolation and use it to
predict possible temperature
change in the future.
Using the concept of extrapolation with the
condition that all events and variables remain the
same, the students can predict the possible
temperature in the next few years.
Use the line of best fit to predict
the amount of money the
school has to pay for energy
consumption per month or per
annum.
Drawing a bar chart which shows the gradual
increase in electric consumption. The students
can predict the amount by looking at the formula
of the trend lines in the spreadsheet and through
simple calculation to arrive at the amount to be
paid in 2020.
Relate the increase in annual
energy consumption with the
general increase in
atmospheric temperature.
Actual observation will help students realise that
an increase in temperature of the surroundings
would trigger them to use the electric fans and air-
conditioners more often. This is further verified by
the data of the school electric bills per month
particularly during hotter days/months.
Suggest ways to reduce energy
consumption thus, reducing the
carbon footprint.
Group discussion and sharing in class to come-up
with new possibilities to reduce electricity
consumption and thereby reduce the release of
CO2 gases causing green house effect.
Take the initiative to reduce the
energy consumption through
sustainable practices.
Allowing students to summarise what they have
learned and to share how they can make a
difference through adoption of practical energy
saving measures. Students make resolutions to
help reduce electricity consumption through
energy conservation and commitment to be more
civic and environmental conscious.

CLIMATE CHANGE AND ENERGY EFFICIENCY
165
SEAMEO
Chapter IV
Assessment
Students are assessed using a performance rubric that captures the following
dimensions:
1. Accuracy of answers provided in the worksheet.
2. Level of enthusiasm on group presentation and sharing of outputs.
3. Level of participation in group/class discussion.
4. Resolutions/suggestions are relevant, rational, logical and up to date.
5. Correct and logical interpretation of graphs and data.
6. Use of appropriate measures of central tendency to interpret the given data.
7. Use of critical thinking based on the following criteria:
suggestions to reduce electric energy usage are logical/sensible and
are parallel to what the government is doing;
non-compromised idea yet diplomatic enough to be carried out in
school to indirectly contribute to the reduction of carbon footprint and
to work on resolutions towards reducing the electricity consumption in
school and at home (e.g., air conditioning, and electric fans);
ideas are acceptable to all school stakeholders and are sustainable
(e.g., planting more trees – green project, organising talks to promote
awareness of climate change and energy conservations);
able to carry out healthy debates and work together with school
authorities to achieve common goals;
able to predict sensibly and logically the future scenario based on the
mathematical and statistical data or graph plotted.
Assignment
Students will choose any of the following resolutions to address the impact of
climate change on energy efficiency:
design a poster of awareness and/or school website
write a suggestion or appeal letter to the school principal
present their ideas to reduce electric consumption and other energy
saving measures in a forthcoming school assembly (e.g., flag ceremony,
school programmes/special affairs)
Additional Notes
Suggested Enrichment and Integration
Introduce the concept of dispersion and how it reflects the data.

CLIMATE CHANGE AND ENERGY EFFICIENCY
166
SEAMEO
Chapter IV
Use graphing calculators, Geometer‟s Sketchpad Software, etc.
instead of Microsoft EXCEL.
Set-up a student website/webpage on climate change and energy to
enable them to apply what they have learned.
Use games to stimulate generation of ideas in energy conservation
practices.
Set-up an environment group to reduce the carbon footprint of the
school and initiate an energy saving campaign in school and the
community.
Integrate the concepts of climate change and energy in other subjects
like English, Geography, History, Moral Education, Civics, Chemistry
and Biology.
The average temperature of the years listed in the EXCEL files are not at
regular intervals because the temperatures of certain years are not complete
or not available.
The temperature colour using the conditional format in EXCEL needs to be
changed in accordance to specifications used by each country.
On the consumption of electricity, instead of using the amount of money paid
monthly by the school, another option would be to calculate the amount of
electricity based on the amount of wattage used monthly by the school.
The conditional format used in the module is Microsoft EXCEL 2003 and may
not show the same results as intended in Microsoft EXCEL 2007
(Compatibility is not guaranteed).
RESOURCES
Enviroduck. (2008). Carbon Footprint Calculator. TSI Inc. Retrieved on 29 October
2010 from http://www.enviroduck.com/carbon_footprint_calculations.php
Environmetal Defense Fund. (2009). Fight Global Warming. Retrieved on 29 October
2010 from http://www.fightglobalwarming.com/carboncalculator.cfm
NASA, (2009). Global The Change in Global Surface Temperature on October 25,
2010 from
http://en.wikipedia.org/wiki/File:NASA_global_temperature_since_1880.gif
TuTiempo.net. (2010). Statistics Data on Weather Worldwide. Retrieved on 30
October 2010 from (http://www.TuTiempo.net/en/

CLIMATE CHANGE AND ENERGY EFFICIENCY
167
SEAMEO
Chapter IV
Attachment 4.3.1 Student’s Worksheet
Activity 1) Instruction: Study the given graph below and answer the guide
questions.
Figure 1 Chart of Variations in the Earth's Surface Temperature Source: BBC/OU Open2.net-The World Around Climate Change, www.open2.net/coast/introducingclimate change.html
Guide Questions:
What information can be obtained from the graph?
In what year does the temperature start to increase?
Estimate the amount of increase or decrease of temperature for each
year and in between years. Make a table of values showing the years
and amount of “departure” in temperature.
Identify the median, mean and mode of the data. Discuss with your
group mates.
Using MS-EXCEL, generate your own a graph using “scatter plot” and compare with the graph above.
Variations of the Earth’s Surface temperature for the past 140 years
(global)

CLIMATE CHANGE AND ENERGY EFFICIENCY
168
SEAMEO
Chapter IV
Activity 2) Instruction: Study the graph below and answer the following questions.
Figure 2 The Change in Global Surface Temperature From Years 1880-2000 Average Temperatures Source: http://en.wikipedia.org/wiki/File:NASA_global_temperature_since_1880.gif
Guide Questions:
What information can be obtained in the graph above?
Can you determine the average amount of change in temperature after the year 2000? How?
Activity 3) Instruction
Draw a graph based on the school electric bills collected over the past 3
years.
Answer the following questions:
a. Which year has the biggest consumption of electricity? Discuss why.
b. What do you observe? What pattern do you see?
c. What can be concluded about electricity consumption in relation to the
temperature?
d. How is electricity consumption related to carbon footprint?
Identify new possibilities to reduce the consumption of electricity and/or
carbon footprint.

CHAPTER V:
Impact of Climate
Change on FOOD
SECURITY
[SEAMEO SEARCA]

IMPACT OF CLIMATE CHANGE ON FOOD SECURITY
170
SEAMEO
Chapter V
Introduction Will climate change wipe out our food supply and create an irreversible hunger
among all peoples of the earth? How much havoc will earth warming bring on our
food resources: crops, livestock, trees, and fishes? What are our chances of
surviving in a changing climate hostile to the ecosystems that host our crops,
livestock, trees, and fishes? This chapter makes a connection between climate
change and food shortage by discussing first and foremost, the basic principles that
enable the environment to nurture life. It explains how climate change disrupts the
environment’s natural cycles and hinders the ecosystem’s capacity to grow food
resources.
However, amidst the ill impacts of changing climate on food resources, this chapter
also paints a picture of hope by educating young minds on how to make earth a
friendly and food-secure place to live.
Basic Environmental Principles
Seven environmental principles govern the health and sustainability of our earth and
its resources (PEMSEA, 2010). These include: (1) Nature knows best; (2) All forms of
life are important; (3) Everything is interconnected to everything else; (4) Everything
changes; (5) Everything must go somewhere; (6) Ours is a finite earth; and (7) We
are stewards of this earth.
In order for us to understand better the link between climate change and food
production, we discuss only two environmental principles that will explain the close
connection between them.
Nature knows best. This is one of the basic environmental principles governing
planet Earth. For centuries, earth has hosted and sustained all living organisms
through the natural processes that occur above and down below its surface. These
natural processes transfer energy, chemical elements (nutrients), and water to
support all life forms. Examples of the natural processes occurring continuously are
the water, carbon, nitrogen, sulfur, and phosphorus cycles, (see Figure 5.1) which
are generally lumped as the biogeochemical cycle (California State University
Monterey Bay [CSUMB], n. d.).
Everything is interconnected. This principle explains why climate change
endangers the supply of food and fishes. To be able to reproduce, plants, animals,
and fishes need to thrive in a balanced ecosystem. In a balanced ecosystem, natural
processes such as the water, carbon, nitrogen, and phosphorus cycles (Green Facts,
n. d.) (or the nutrients’ cycle) seamlessly occur to deliver the nutrients living
organisms need for them to grow and reproduce. The balance in the ecosystem is
called homeostasis or the ability of the communities to interlink with each other,
whether plant or animal communities, to perform their roles and functions in a given

IMPACT OF CLIMATE CHANGE ON FOOD SECURITY
171
SEAMEO
Chapter V
niche; while simultaneously adjusting either internally or externally with the changes
in the climate patterns, food availability, and many others in the environment
(Morning Earth, n. d.). Carbon and water are key elements needed by farmers to
grow our food resources.
Carbon Cycle. Under the ―Nature knows Best” principle, we focus our attention on
the carbon cycle (Figure 5.1) and the water cycle (Figure 5.2) Carbon forms the
backbone of all organic molecules. Our genetic material (DNA and RNA) and
proteins, which are vital for life, are made up of carbon. Aside from being an essential
element, carbon is also special because it can bond to almost any other molecule. It
is the major element within our bodies (Oracle ThinkQuest, n. d.). Carbon, the key
element of all life on earth, has a complex biogeochemical cycle that is greatly
important to global climate change. Plants continuously remove carbon from the
atmosphere and use it to create carbohydrates and sugars to build up their tissues
through the process of photosynthesis (Life and Biogeochemical cycle, n. d.).
Figure 5.1 Carbon Cycle. Source: Windows to the Universe (2010)
From the air, carbon is moved to the plants through photosynthesis (Farabee, 2006)
which enables the plants to produce food for the plants to grow. O2, the byproduct of
this process, is released to the environment. By extracting CO2 to perform
photosynthesis and releasing O2 as a byproduct, the plants both purify and cool the
environment.

IMPACT OF CLIMATE CHANGE ON FOOD SECURITY
172
SEAMEO
Chapter V
After the plant has fixed the carbon, it transfers from the plants to animals through
ingestion. As animals consume the plants, they obtain carbon from their food as well.
The next destination for carbon is the soil—this time, when plants and animals die,
their bodies, wood, and leaves decay leaving carbon buried under the ground. After
millions of years, this carbon will turn into fossil fuels.
CO2 is a greenhouse gas and locks in heat in the atmosphere. Its absence and the
absence of other greenhouse gases will make the earth frozen. But humans have
burned so much fuel already. Today, there is about 30% more CO2 in the air than
there was about 150 years ago. The atmosphere has not held this much carbon for at
least 420,000 years according to data from ice cores. The recent increase in the
amounts of greenhouse gases such as CO2 significantly affects the warming of our
planet.
Water Cycle. One of the natural cycles that keeps the temperature of the earth, as
well as the growth and reproduction of plants and animals, is the water cycle, also
known as the hydrologic cycle. It is the constant movement of water on, above, and
below the surface of the earth (Wikipedia, n. d.). At different stages in the cycle,
water can change into liquid, vapour, or ice.
Figure 5.2. Water or Hydrologic Cycle Source: SA Water (2010)
Imagine for a moment the breadth, the length, and the height that water has to travel
from sky to land, and back and forth in a timeless dimension. What energy drives the
water to revolve back and forth from sky to land? It is the heat of the sun, which
makes the water evaporate from oceans, lakes, and plants. Water vapour condenses
and forms tiny droplets in the clouds. When the clouds meet cool air over land, rain,
sleet, or snow, precipitation occurs. With precipitation, water returns to the land or
sea again (Enchanted Learning, n. d.).

IMPACT OF CLIMATE CHANGE ON FOOD SECURITY
173
SEAMEO
Chapter V
As the water journeys from sky to land and back again, it brings forth life to all
organisms because they use water as a vital component to perform their bodily
functions. Take away water, and all of these food-producing organisms on earth will
perish. However, natural water cycling is disrupted because of many development/
man-made activities. What are the causes of water cycle disruptions?
Disruptions of Carbon and Water Cycles
Carbon Cycle Disruption. Burning of fossil fuels resulting in excessive CO2 tops the
list of man-made activities that disrupt carbon cycle. As CO2 is released daily into the
atmosphere, it accelerates the occurrence of climate change because of the overall
greenhouse or warming effect (Sacramento Municipal Utility, 2004). Burning of fossil
fuel by man alters the natural balance of carbon because ―trapped‖ carbon (unused
and stored beneath the ground, seas, oceans, and rivers) is being released.
In addition to burning of fossil fuels, agricultural activities, such as rice cultivation and
animal raising (enteric fermentation in livestock and manure management), result in
the production of significant quantities of methane (CH4). It is estimated that over
60% of global methane emissions are related to human-related activities. Natural
sources of methane include wetlands, non-wetland soils, gas hydrates, permafrost,
oceans, freshwater bodies, termites, and other sources such as wildfires (IPCC,
2001).
Water Cycle Disruption. Forests serve as sink for CO2. Hence, more trees would
mean greater sink area; cleaner and cooler environment; more stable water supply in
the watershed areas; firmer soils where the roots of these trees are anchored; and
less occurrence of soil erosion and water runoff. In contrast, fewer trees would result
in higher volume of CO2, more air pollution, more intense heat, and higher chances
of water runoff and soil erosion.
Deforestation. It disrupts the water cycle, which could bring about flooding and
drought to communities. The forest is like a sponge. It soaks up rainfall carried by
tropical storms while anchoring soils and regularly releasing water. This regulating
feature of tropical rainforests can help control destructive flood and drought cycles
that can take place when forests are cleared (Mongabay.Com, 2010). Deforestation
upsets the water cycle by altering weather patterns, which may trigger excess rainfall
in one area of the world, or drought in another.
Business Creation. Converting forests and agricultural lands into commercial
centres surrounded with completely cemented roads increases runoff. Runoff
consists of precipitation (all forms of water that fall from the sky) that does not
evaporate, transpire, or penetrate the surface to become groundwater. Even the
smallest streams are connected to larger rivers that transport billions of litres of water
into oceans worldwide.

IMPACT OF CLIMATE CHANGE ON FOOD SECURITY
174
SEAMEO
Chapter V
Excess runoff can cause flooding, which occurs when there is too much precipitation
(University of Illinois, 2010). Thus, instead of rainfall being stored underneath the
ground (aquifer), this rainfall directly flows to the rivers and seas causing an overflow
of water (flooding) in areas near these bodies of water. In contrast, drought in some
areas occurs because runoff prevents water from being stored in the aquifers. Empty
underground aquifers cannot provide the water needs of humans, plants, and
animals.
Since ―everything is interconnected‖, deforestation in the uplands disrupts the water
cycle, which also leads to a negative impact on the water supply, i.e., some areas
with drought and other areas with flooding. Drought or flooding disrupts the nutrient
cycle from sky, land, and sea, and hinders this natural process in delivering the right
chemical elements essential for the growth of living organisms. Thus, an imbalance
or a deterioration of the system occurs (PEMSEA, 2010).
Climate Change and Food Security
In Asian, African, and Latin American countries, well over 500 million people are
living in what the World Bank calls ―absolute poverty.‖ Yearly, 15 million children die
of hunger (Oracle ThinkQuest, 2010). A majority of those who will go to bed hungry
will comprise the farmers’ and fishermen’s families who live in marginal lands that are
fragile, with low rainfall, sloping terrains, and poor market access.
With extreme temperature stress on crops and fishes as a result of climate change,
more people are expected to be underfed or not fed at all. In essence, climate
change directly threatens agricultural productivity and food security. It disrupts the
following:
Growing Patterns of Crops. Crop maturity and bearing of fruits are either
hastened or delayed. Increase in temperature will lengthen the growing
season in areas where agricultural potential is currently limited by cold
temperature stress (Abrol & Ingram, 1996).
Availability of Water. There will be more intense rainfall or absence of rainfall
for long periods of time. Livestock will be affected, as the grassland
productivity will be reduced due to increase in temperature. Increased
desertification due to lack of water will correspondingly decrease livestock
population.
Soil Fertility. More soil will be eroded during times of heavy rains and flooding
(EPA, 2010).
Pests and Diseases. More crops and trees will be damaged due to increased
outbreak and damaging effects of pests, plant pathogens and parasites, and
weeds (invasive species). Increase in soil moisture will increase soil-borne
diseases and nematodes (Pulhin, 2009).

IMPACT OF CLIMATE CHANGE ON FOOD SECURITY
175
SEAMEO
Chapter V
According to the International Rice Research Institute (IRRI) crop modeller John
Sheehy (IRRI, 2007), as a general rule, for every 75 ppm (parts per million) rise in
CO2 concentration, rice yield will increase by 0.5 ton per hectare. However, food
crops will decrease in yield by 0.6 ton per hectare for every 1°C increase in
temperature. The weather extremes climate change brings directly affect the
agriculture sector and put farm productivity at risk. While ample carbon dioxide
contributes to greater crop productivity through photosynthesis, its contribution to
increasing global heat, (which would translate to more floods, droughts, and heat
waves) bring serious problems to farmers and fishermen.
The Intergovernmental Panel on Climate Change (IPCC, 2007) as cited in the United
States Environmental Agency (EPA), 2010 states that: ―Recent studies indicate that
increased frequency of heat stress, droughts and floods negatively affect crop yields
and livestock beyond the impacts of mean climate change, creating the possibility for
surprises, with impacts that are larger, and occurring earlier than predicted using
changes in mean variables alone. This is especially the case for subsistence sectors
at low latitudes. Climate variability and change also modify the risks of fires, pest and
pathogen outbreak, negatively affecting food, fiber and forestry.‖
Fishes at Risk
Some 42 million people work directly in the fishery sector, and the great majority, are
in developing countries. This sector, adding those who work in associated
processing, marketing, distribution, and supply industries, supports several hundred
million livelihoods (FAO, 2008).
Aquatic foods have high nutritional quality. It contributes 20% or more of average per
capita animal protein intake for over 2.8 billion people, again mostly in developing
countries. Fish is also the world’s most widely traded foodstuff. Additionally, it is a
major source of export earnings for many poorer countries.
In coastal waters, the increase in temperature caused by El Niño after the
explanation will hurt the corals and the sea grasses and their corresponding fish
borders. The ongoing warming of the world’s oceans is likely to continue, but with
geographical differences and some variability by the decade. Changes in fish
distribution in response to climate variations have already been observed. Such
changes generally involve pole-ward expansions of warmer-water species and pole-
ward contractions of colder-water species.
In addition to increasing seawater temperature, which the fishes have to contend with
to survive, they also have to adjust to the change in salinity. Other seawater areas
that receive melted snow water and/or high precipitation have also changes in their
salinity.

IMPACT OF CLIMATE CHANGE ON FOOD SECURITY
176
SEAMEO
Chapter V
How Can Farmers Boost Food Production?
Farmers need to learn how to use sustainable land and water management
technologies and combine these with green innovative agricultural technologies so
they could adapt to climate change impacts (Dar, 2009).
Green agricultural technologies include using adaptive plant breeding, pest
forecasting, rainwater harvesting, and fertiliser micro dosing (giving small amounts of
fertiliser to each seed). Planting dates can be revised and be timed with the delayed
onset of rainy or hot seasons, longer dry spells, and earlier plant maturity that are
already being observed in Africa and Asia. Many more technologies can be explored
to help crops and animals cope with the extreme temperature and water stresses
brought about by climate change.
What Can Farmers Do to Create a More Climate-Friendly Environment?
Farmers can create a friendlier environment by doing the following:
recycle, reuse, and reduce agricultural wastes;
save electricity in the farm by turning off equipment when not in use;
save water;
plant trees;
help arrest deforestation;
avoid burning of farm wastes (e.g., dry leaves), plastics, and wastes;
minimise wasting feed and food;
educate themselves on how they can contribute to community-wide climate
change-related activities.

IMPACT OF CLIMATE CHANGE ON FOOD SECURITY
177
SEAMEO
Chapter V
REFERENCES Abrol, Y. P., & Ingram, K. T. (1996). Effects of higher day and night temperatures on
growth and yields of some crop plants. Rome, Italy: Food and Agriculture
Organization of the United Nations. Retrieved on October 25, 2010 from
http://www.fao.org/docrep/w5183e/w5183e08
.htm#extreme%20temperature%20effects%20on%20crops
CSUMB (California State University Monterey Bay), (2010). Retrieved from
http://essp .csumb.edu/esse/climate/climatebiogeo.html
Dar, W. D. (2009). Agriculture can adapt to climate change. Retrieved on 25 October
2010 from http://www.scidev.net/en/opinions/agriculture-can-adapt-to-climate-
change.html
Enchanted Learning, (2010). The water cycle. Retrieved on 26 October 2010 from
http://www.enchantedlearning.com/subjects/astronomy/planets/
earth/Watercycle.shtml
FAO Newsroom. (2008,). Climate change will have strong impact on fisheries.
Retrieved from http://www.fao.org/newsroom/en/news/2008/1000876/index.html
Farabee, M. J. (2006). Photosynthesis. Retrieved on 20 October 2010 from
http://www.emc.maricopa.edu/faculty/farabee/BIOBK/BioBookPS.html
Green Facts. (n.d.). Nutrients. Retrieved on 20 October 2010 from
http://www.greenfacts .org /glossary/mno/nutrients.htm
IPCC, (2001). Climate Change 2001: The Scientific Basis. Retrieved on November 6,
2010 from
http://www.grida.no/publications/other/ipcc_tar/?src=/climate/ipcc_tar/wg1/index.htm
IRRI. (2007). Coping with climate change. Rice Today. 6(3). Retrieved on 27 October
2009 from http://beta.irri.org/news/images/stories/ricetoday/6-
3/feature_coping%20with %20climate%20change.pdf
Life and Biogeochemical cycle. (2010). Retrieved on 20 October 2010 from
http://essp.csumb .edu/esse/climate/climatebiogeo.html
Mongabay.Com. (2010). Rainforests. Retrieved from
http://rainforests.mongabay.com
Morning Earth (2010). Carbon cycle. Retrieved from http://www.morning-
earth.org/graphic-E/Bal-Commun.html

IMPACT OF CLIMATE CHANGE ON FOOD SECURITY
178
SEAMEO
Chapter V
Oracle ThinkQuest Education Foundation. (n.d.). World hunger. Retrieved on 26
October 2010 from http:// library.thinkquest.org/C002291/high/present/stats.htm
Oracle ThinkQuest Education Foundation. (n.d.). The carbon cycle. Retrieved on 20
October 2010 from http:// library.thinkquest.org/11353/carbon.htm
PEMSEA, 2010. Seven environmental principles. Retrieved on 20 October 2010 from
http://pemsea.org/easy-hub/young-environmentalists-101
Pulhin, J. M. (2009). Climate Change and its Impact on Agriculture and Forestry
[Lecture]. Laguna, Philippines: SEARCA College.
Sacramento Municipal Utility District and Pacific Gas & Electric Company. (2004).
Carbon cycle disruption white paper. Retrieved on 20 October 2010 from
http://hydrorelicensing.smud.org/docs/reports/carbon_white_paper/Carbon%20
White%20Paper.pdf
U.S. Environmental Protection Agency (EPA). (2010). Agriculture and food supply.
Retrieved on 20 October 2010 from
http://www.epa.gov/climatechange/effects/agriculture.html
U.S. Environmental Protection Agency (EPA). (2010). Sources and Emissions.
Retrieved on 20 October 2010 from http://epa.gov/methane/sources.html
University of Illinois. (2010). Photosynthesis. Retrieved on 20 October 2010 from
http://ww2010.atmos.uiuc.edu/(Gh)/guides/mtr/hyd/run.rxml
Wikipedia. (2010). The Water cycle. Retrieved on 26 October 2010 from
http://www.sawater.com.au/SAWater/Education/OurWaterSystems/The+Water+
Cycle.htm
Windows to the Universe. (2010). The carbon cycle. Retrieved on 27 October from
http:// www.windows.ucar.edu/tour/link=/earth/Water/co2_cycle.html&edu=high

IMPACT OF CLIMATE CHANGE ON FOOD SECURITY
179
SEAMEO
Chapter V
Lesson 1
WE’RE MESSING UP THE FOOD CHAIN!
GRADE LEVEL: High School
SUBJECTS: Biology and Environmental Science
TOPIC: Food Chains and Food Web
PREREQUISITE
Students should have prior knowledge about the biotic and abiotic
components of the ecosystem.
DURATION: 2 sessions
LEARNING OBJECTIVES
Subject Matter Objectives: By the end of this lesson, students should be able to:
describe a food chain and a food web; and
explain the energy relationship among organisms in an ecosystem.
Climate Change Objectives
explain how climate change affects the food chain and food web; and
cite specific ways to minimise carbon emission on food production activities
and to prevent greenhouse gases (GHGs) build up in the atmosphere which
lead to global warming.
MAIN CONCEPTS AND SKILLS
Food chain can be shown by a sequence of organisms, whereby, one
organism feeds on the one preceding it. It begins with a producer and ends
with a decomposer.
A food chain is one way of showing the energy relationships among
organisms in an ecosystem. The energy transferred from one trophic level to
the next is decreasing. As the energy goes farther from the producer, the
organism receives lesser energy. In most cases, humans occupy the last
trophic level in a food chain.
Food web consists of several food chains joined together. Realistically, most
organisms depend on more than one species for food. Many species occupy
more trophic levels in a food web.
Climate change modifies temperature and precipitation patterns. These both
affect crop production and irrigation water availability. Livestock are also

IMPACT OF CLIMATE CHANGE ON FOOD SECURITY
180
SEAMEO
Chapter V
directly and indirectly affected by climate modification. Abnormal increases in
temperature affect the metabolism of animals. Likewise, extreme weather
conditions are threats to their lives.
The direct and indirect effect of climate change on agriculture play out
through the economic system through altering prices, food production and
productivity. Climate change affects food demand, food consumption and
ultimately the human well-being.
Chemical fertilisers and toxic pesticides contribute about 15-20 % of GHGs.
MATERIALS NEEDED
downloaded from the internet or cut-out pictures of plants, animals, long line people lining-up buying, art materials and tools, old issues of magazines about nature or ecosystem, pens and markers.
PRESENTATION OF LESSON
Scenario
1. The teacher will show several pictures of people lining-up to receive
rations. These pictures will be the springboard of class discussion about
the scarcity of food particularly in the poor and economically depressed
areas or sector in your community and how climate change affects the
human food chain.
(Note: Preferably the pictures must be taken from your community or a
familiar place in your country.)
2. Ask the following guide questions:
What do you see in the pictures?
What do you think causes these events?
What do think will happen if the food supplies continue to decrease?
What are the factors that affect the supplies of food in your
community?
Student Activities
Students to visit a school garden or a pond. They will identify the
organisms living in it and they will construct a food chain that contains all
these organisms. (Note: This depends on the availability of the garden or
a pond.)
The students will create their own posters of food chains and food webs.
They will analyse how climate change affects the food chain and food web

IMPACT OF CLIMATE CHANGE ON FOOD SECURITY
181
SEAMEO
Chapter V
Process Guide for Teachers
1. (Optional) After the students have analysed the pictures, conduct a short
review of the biotic and abiotic components in an ecosystem. Ask the
students to (a) explain the interaction between these two components and
(b) predict what will happen when the temperature increases?
2. Teacher divides the class into working groups and orients the groups
about the task that they are going to perform (e.g., field visit to an
ecosystem and creating a poster).
3. Teacher presents the guidelines to create posters of a food chain and a
food web out of the given materials. The food chain and food web should
include human beings as one of the consumers.
Box 5.1.1
Guidelines in Creating the Food Chain and Food Web
Use some old issues of magazines about nature.
Cut-out 9 to 10 pictures of plants, animals, and or decomposers that could
be living together in one ecosystem. (If the pictures of decomposers are
not available, make your own drawing)
Paste the pictures on a sheet of poster paper. Draw arrows connecting
the plants and animals to show feeding relationships. Be sure your arrows
are pointing in the direction of the energy flow.
Label each organism as a producer, herbivore, carnivore, or omnivore
4. Supervise each working group during the activity.
5. Ask each group to present their posters in front of the class.
6. During the presentation and class discussion, inject issues related to climate
change and its impact to the human food web.
7. Process the students’ learning experiences. Ask the following guide
questions:
What is the difference between the food chain and food web?
What happens to the energy possessed by an organism from one
trophic level to another?
Which organism in the food chain receives the greatest and the least
amount of energy?
What other external factors can affect the food chain? (e.g., increase
in temperature and CO2 may impact on climate change and affect
human activities)
How does climate change affect the food chain and food web?

IMPACT OF CLIMATE CHANGE ON FOOD SECURITY
182
SEAMEO
Chapter V
What are some activities that might lessen the impact of climate
change on food production and security? (e.g., avoid burning of farm
wastes, avoid use of toxic pesticides and fertilisers which contribute
about 15-20% of GHGs)
Closure
Rat infestation in farms and households are common occurrence in most
urban and rural communities. Explain this event in connection with
breaking the food chain and endangering the organisms that interplay on
it.
Achieving the Objectives
Objective This is achieved by
Describe a food chain and food web.
Creating a poster and conducting a
presentation in front of the class.
Explain the energy relationship among organisms in an ecosystem.
Class discussion and interaction
between students and teacher during
the presentation of the food chain and
food web posters.
Explain how climate change affects the food chain and food web.
Using the poster as a medium to
explain the externals factors (i.e.,
climate change) that affect the food
chain and food web.
Cite ways how to minimise carbon
emission on food production and how
to prevent GHGs build up in the
atmosphere which lead to global
warming.
Class discussion on how to maintain a
climate-friendly environment.
Assessment
The teacher will utilise an oral presentation rubric (Attachment 5.1.1) and a poster (food chain and food web) rubric (Attachment 5.1.2) to assess student’s performance.
On a clean sheet of paper, ask the students to answer the following questions:
What is a food chain? What is a food web?
Why do you think producers receive the greatest amount of
energy?
Explain why an organism that occupies the last trophic level
receives the least amount of energy?

IMPACT OF CLIMATE CHANGE ON FOOD SECURITY
183
SEAMEO
Chapter V
How does climate change affect the feeding relationship in an
ecosystem?
What possible measures should be done to mitigate the effects of
climate change on food production and security?
Assignment
If the school has provision for computer and Internet connection, ask the
students to log on to www.myfootprint.org. Advise them to take the
Ecological Footprint Quiz, and to relate the results of their quiz to the
domino effect that happens when organisms are endangered in the food
chain due to massive utilisation of the earth’s natural resources.
RESOURCES
Andaya, C.V. (2008). Understanding the earth through environmental science. C&E Publishing, Inc.
Asian Development Bank. (2009). Building climate resilience in the agriculture sector
of Asia and the Pacific. Retrieved on 30 October 2010 from http://www.adb.org/Documents/Books/Building-Climate-ResilienceAgriculture-Sector/Building-Climate-Resilience-Agriculture-Sector.pdf
Deauna, M. C. & Dorado, S.L. (1998). Environmental science for Philippine schools.
Quezon City: Phoenix Publishing House. Inman, M. (2008, 31 January).Warming may cause crop failures, food shortages by
2030. National Geographic News. Retrieved on 30 October 2010 from
http://news.nationalgeographic.com/news/2008/01/080131-warming-crops.html
Fish,B. (2004). Teacher Page. Retrieved on 30 November 2010 from
http://www.beverlyschools.org/schools/exploringecosystems/Teacher's%20Page
.html

IMPACT OF CLIMATE CHANGE ON FOOD SECURITY
184
SEAMEO
Chapter V
Attachment 5.1.1 Oral Presentation Rubric
Traits Presented
4 Exceeds Standard
3 Meets
Standard
2 Progressing to Standard
1 Below
Standard
Content Focus
Purpose of
presentation is
clear.
Supporting
ideas maintain
exceptional
focus on the
topic
Topic of the
presentation
is clear.
Content
consistently
supports the
purpose.
Presentation
lacks clear
direction.
No clear
focus.
Organisa
-tion
Information/
ideas are
presented in a
consistently
logical
sequence.
Transition/
connections are
eloquent. A
strong sense of
wholeness is
conveyed.
Conclusion
leaves the
audience with a
strong sense of
closure.
Important
ideas and
information
are identified
for the
audience.
Information/
ideas are
presented in
a logical
sequence
with few
lapses.
Transitions
and
connections
are made.
Closing
effectively
summarises
the
presentation.
Irrelevant,
unnecessary
information
detracts. Big
ideas are not
specifically
identified.
There are
significant
lapses in the
order of
ideas.
Transitions
are
inconsistent
and weak or
missing.
Closing
demonstrates
an attempt to
summarise.
No clear
organisation.
Ideas do not
connect with
one another.
There are no
clear
transitions.
No closing is
evident.
Presen-
tation
Question
& Answer
Speaker
expands upon
previous
statements.
Cites additional
examples to
answer
question.
Thoughtful,
concise
response.
Conveys
knowledge of
subject.
Response not
clear or did
not add to
comprehen-
sion of the
listener.
Could not
answer
questions or
answers are
irrelevant.

IMPACT OF CLIMATE CHANGE ON FOOD SECURITY
185
SEAMEO
Chapter V
Attachment 5.1.2 Food Chain and Food Web Rubric
CATEGORY 4 3 2 1
Characters(Role
of organism)
All
organisms
are
described
appropriately
in the food
chain and
food web.
Most organisms
are
described appropri
ately in the food
chain and food
web.
Some
organisms
are
described
appropriately
in the food
chain and
food web.
Organisms
are not
described
appropriately
in the food
chain and
food web.
Neatness and
Attractiveness
Exceptionally
well
designed,
neat, and
attractive.
Colours that
go well
together are
used to
make the
posters more
legible.
Neat and relatively
attractive.
Characters
are neatly
arranged or
drawn but
the poster
appears
quite plain.
Appears
messy and
"thrown
together" in
a hurry.
Accuracy of
Presentation(Se
quence of
feeding
relationship)
All
organisms
are
positioned
correctly and
noted on the
food chain
and food
web. Direct
connections
and flow are
easily seen.
All organisms are
positioned
correctly and
noted on the food
chain. Connection
s and flow of
poster is easily
legible.
All
organisms
are
positioned
correctly and
noted on the
food chain
and food
web.
No
organisms
are
positioned
correctly or
noted for a
food chain
and food
web.
Source: http://www.beverlyschools.org/schools/exploringecosystems
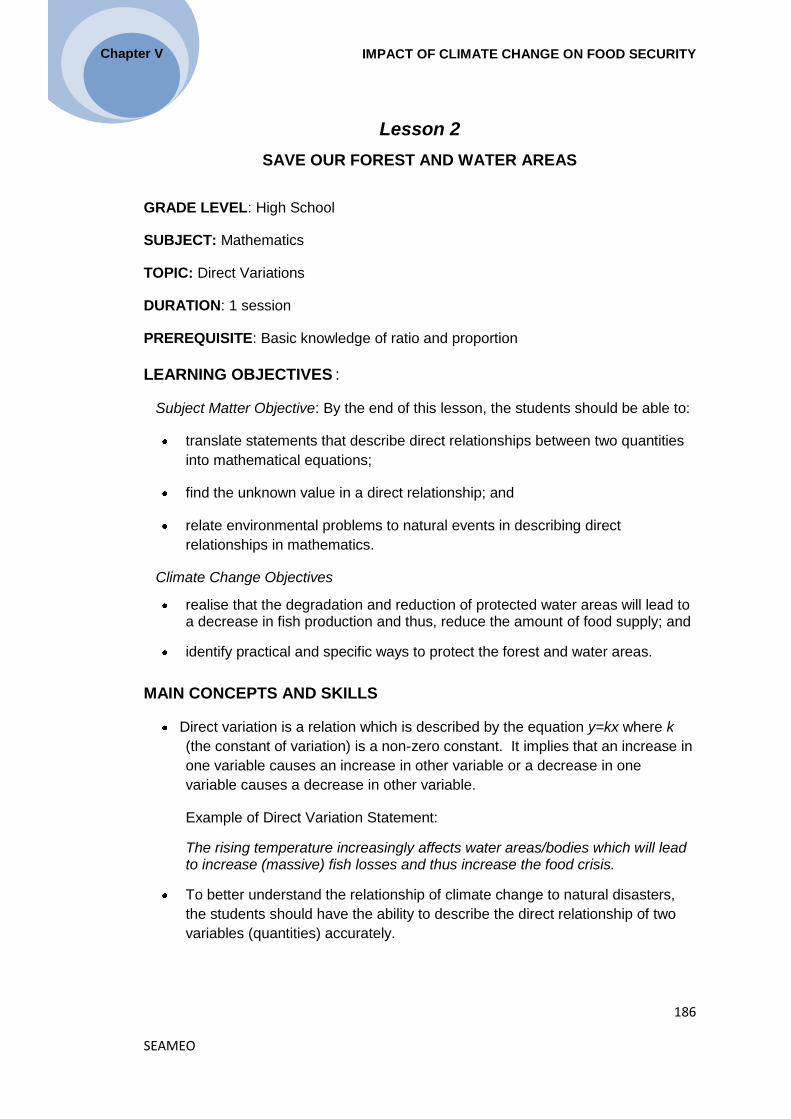
IMPACT OF CLIMATE CHANGE ON FOOD SECURITY
186
SEAMEO
Chapter V
Lesson 2
SAVE OUR FOREST AND WATER AREAS
GRADE LEVEL: High School
SUBJECT: Mathematics
TOPIC: Direct Variations
DURATION: 1 session
PREREQUISITE: Basic knowledge of ratio and proportion
LEARNING OBJECTIVES :
Subject Matter Objective: By the end of this lesson, the students should be able to:
translate statements that describe direct relationships between two quantities
into mathematical equations;
find the unknown value in a direct relationship; and
relate environmental problems to natural events in describing direct
relationships in mathematics.
Climate Change Objectives
realise that the degradation and reduction of protected water areas will lead to a decrease in fish production and thus, reduce the amount of food supply; and
identify practical and specific ways to protect the forest and water areas.
MAIN CONCEPTS AND SKILLS
Direct variation is a relation which is described by the equation y=kx where k
(the constant of variation) is a non-zero constant. It implies that an increase in
one variable causes an increase in other variable or a decrease in one
variable causes a decrease in other variable.
Example of Direct Variation Statement:
The rising temperature increasingly affects water areas/bodies which will lead to increase (massive) fish losses and thus increase the food crisis.
To better understand the relationship of climate change to natural disasters,
the students should have the ability to describe the direct relationship of two
variables (quantities) accurately.

IMPACT OF CLIMATE CHANGE ON FOOD SECURITY
187
SEAMEO
Chapter V
MATERIALS NEEDED
video footage of the effects of global warming (global 101 video from www.youtube.com/watch?v=oJAbATJCugs)
powerpoint slides on direct variation
PRESENTATION OF THE LESSON
A. (Optional) Conduct a review of ratio & proportion.
We have discussed about ratio and proportion and on how to find the
unknown term in a proportion. Let us have a review of the concepts of ratio
and proportion.
1. What is a ratio?
A ratio is the comparison of two quantities.
2. Can you give examples of ratio?
The ratio of boys to girls in a classroom (e.g., 20:21)
The ratio of books to magazine in a shelf (e.g., 15:4)
3. How about a proportion, what is a proportion?
Proportion is the equality of two ratios.
4. Can you give examples of proportions?
1:2 = 5:10; 3:4 = 12:16; 4:1 = 20:5
B. Board Exercise: Ask the students to solve for the missing term on the board.
How about if we have this proportion, 2:7 = x:21 what is the value of x?
Answer : x = 6
Scenario
Show a video footage of the effects of global warming to the class.
Student Activities
The students will analyse the video presented in the scenario. They will perform an
activity on Protected Fishing Areas after a lecture on direct variation.
Activity 1. Video Footage Analysis
1. What natural phenomena did you observe?
Phenomena: drought, increase in temperature, strong typhoons, fish kills,
pollution, forest denudation.
2. Can you see any relationship among these phenomena? (i.e., environmental

IMPACT OF CLIMATE CHANGE ON FOOD SECURITY
188
SEAMEO
Chapter V
reaction to human activities-anthropogenic)
Relationships involve:
an increase of temperature will also increase the amount of rainfall and
drought;
incidences of fish kills will increase when water temperature increases;
water pollution will result in health hazards for humans (e.g., illnesses);
an increase in the use of chlorofluorocarbon (CFC) will also hasten the
destruction of the ozone layer;
an increase of temperature in the bodies of water will increase the risk of
fish losses, thus will increase the incidence of food shortage;
as the population increases, the amount of food supply also increases
hence, the incidence of food shortage will dramatically increase.
Activity 2. Protected Fishing Areas
1. Students will perform the activity and answer the questions in the worksheet
(Attachment 5.2.1).
2. Each group will present their answers in front of the class and discuss their
conclusion.
3. Class discussion will follow as the groups present their observations and
analysis.
Process Guide for Teachers
1. Teacher shows video footage of the effects of global warming and conducts
video analyses after viewing.
2. Teacher discusses direct variation through PowerPoint presentation.
3. Direct variation means that if one value increases, the other value will also increase, or if one variable decreases, then the other will also decrease.
Give examples of direct variation using what you have observed in the video.
An increase in temperature will also increase forest denudation and
drought.
Fish kills will also increase if water temperature increases.
An increase in the use of CFCs will also hasten the destruction of the
ozone layer.
From the examples given, can you give your own definition of direct variation?

IMPACT OF CLIMATE CHANGE ON FOOD SECURITY
189
SEAMEO
Chapter V
Mathematically, if y varies directly as x, then y = kx where k is the
constant of variation. Another way of writing it is k = y/x. This formula is
used in finding the constant of variation
Going back to the examples that you cited a while ago, which of those exhibit direct variation?
4. Teacher facilitates group activity and provides the following instructions.
You will be divided into four (4) groups. Each group will be given a
worksheet (See Attachment 5.2.1). Answer the questions in the activity
sheet and generate your conclusion.
5. Facilitate the processing of students’ learning experiences and discoveries.
Let us apply the principle of direct variation in the real world. Can you give examples of direct variations that are actually happening in our environment? Examples of Direct Variation:
Increase in population will increase the food consumption.
Higher temperatures will result in more droughts in the rice fields and
cornfields, which will eventually result in food shortage.
A decrease in rainfall will result to decrease in the amount of water
reserved.
Imagine what will happen to our Mother Earth if we are not going to take care
of it. So let us start saving our earth. As a student, what can you do to save
our environment?
Things we can do to save the environment:
Learn how to segregate garbage.
Stop using products with CFC.
Be disciplined.
Join in the campaign of saving mother earth and be vigilant.
Save electricity.

IMPACT OF CLIMATE CHANGE ON FOOD SECURITY
190
SEAMEO
Chapter V
Achieving the Objectives
Objective This is achieved by
To translate statements that describe direct
relationships between two quantities into
mathematical equations
Discussion on direct variation
through PowerPoint presentation
about direct variation
To find the unknown value in a direct
relationship
Discussion on direct variation
through PowerPoint presentation
To relate environmental problems to natural
events in describing direct relationships in
mathematics
Analysis of the video footage
presentation
To realise that the degradation and
reduction of protected areas will lead to a
decrease in fish production and thus
reduce the amount of food supply
Performing the activity on
Protected Fishing Areas
To identify practical and specific ways to
protect the forest and water areas
Performing the activity on
Protected Fishing Areas
Assessment
1) The following table shows the relationship between the number of protected
water areas and the number of species of fish living in that area. Solve for k
and complete the table.
Number of protected water areas by hectare (x) 4 10 15
Number of species of fish (y) 32 50 76
2) Develop a concept map on the direct relationship of increasing temperature to flooding (La Niña) and drought (El Niño).

IMPACT OF CLIMATE CHANGE ON FOOD SECURITY
191
SEAMEO
Chapter V
Assignment
The students will be asked to conduct an experiment on the mortality rate of fish
living in two different conditions: one living under high temperature (exposed to
sunlight) and the other in normal conditions.
RESOURCE
Global Warming 101. Retrieved on 30 November 2010 from
www.youtube.com/watch?v=oJAbATJCugs

IMPACT OF CLIMATE CHANGE ON FOOD SECURITY
192
SEAMEO
Chapter V
Attachment 5.2.1 Student’s Worksheet
PROTECTED FISHING AREAS
Name: _________________________________________________________
Grade Level and Section: __________________________________________
Topic: Direct Variation
1. The table below shows the relationship between the number of protected water
areas and the number of species of fish living in that area. Based on the data given, solve for k.
Number of protected water areas by hectare (x)
2 5 10
Number of species of fish (y) 16 20 56
2. Observations and Analysis
What is the constant of variation?
____________________________________________________________
____________________________________________________________
How did you obtain the constant of variation?
____________________________________________________________
____________________________________________________________
3. Conclusion/Integration to Real Life
As a student, what should you do to help lessen the impact of climate
change?
____________________________________________________________
____________________________________________________________
____________________________________________________________
With the observed changes in our environment, what do you think will
happen in the next ten years if people will not protect the bodies of water?
____________________________________________________________
____________________________________________________________
____________________________________________________________

IMPACT OF CLIMATE CHANGE ON FOOD SECURITY
193
SEAMEO
Chapter V
Lesson 3
MEA CULPA, MOTHER EARTH
GRADE LEVEL: High School
SUBJECT: English, Values Education
TOPIC: Perceiving Relationships/ Cause-Effect Relationships
PREREQUISITE
Knowledge of prevailing conditions in the local community brought about by
accelerated climate change. It may include records of previous weather
conditions that brought calamities or drastic changes in the community.
Pre-activity:
A day before this lesson, the teacher should have done the following:
Assigned the class to read the article: ―Mea Culpa, Mother Earth‖ adapted
from ―A Day for Mother Earth ―by Jamil Flores, Philippine Panorama, April 2,
1990 (Attachment 5.3.1).
Group the students (maximum of 6 per group). Random selection of group members is encouraged to give more opportunities for spontaneous exchange of ideas.
DURATION: 1 to 2 sessions
LEARNING OBJECTIVES
Subject Matter and Climate Change Objectives: At the end of this lesson, students
should be able to:
determine the effects of accelerated climate change on the supply of rice,
other agricultural products, fisheries, and forest resources;
build their vocabulary of ecological terms using context clues;
exchange views with other members of the class on local issues regarding
climate change;
describe the role played by man in accelerating climate change;.
identify common practices that contribute to the production of greenhouse
gases (GHG), pollution, and other environmental problems; and
suggest specific ways on how each individual could help lessen the negative
effects of accelerated climate change.

IMPACT OF CLIMATE CHANGE ON FOOD SECURITY
194
SEAMEO
Chapter V
MAIN CONCEPTS AND SKILLS
The Earth’s average global temperature has increased by 0.6 0C in the past
100 years. Four main factors are believed to have affected the processes that
can affect the Earth’s climate. Two of these, small aerosol particles from
volcanic eruptions and changes in solar luminosity, occur naturally. The other
two, namely, sulfate aerosols and greenhouse gases (e.g. carbon dioxide) are
due to increasing industrialisation, particularly the burning of forests and fossil
fuels (coal, oil and natural gas).
It is during this time in human history that people are changing Earth’s climate
rapidly through the emission of the so-called greenhouse gases (GHGs)
brought about by the dramatic increase in the use of fossil fuels since the
Industrial Revolution. The more we produce and consume, the more we affect
the environment around us. We are creating environmental problems that are
not only local but also global. One of these global environmental problems is
human induced man-made climate change, an offshoot of global warming.
Climate change occurs because of increased CO2 emissions. Researches
show that increase in CO2 in the environment favors plants because they are
able to yield more. But while increased CO2 emissions favour food crop
yields, its presence in large quantities, together with other GHGs in the
atmosphere, trap more heat from the sun, which correspondingly increases
global temperature. Consequently, this increased global temperature alters
climate patterns and results in weather extremes, such as droughts, floods,
and severe storms. These weather conditions directly affect the agricultural
sector and put farm productivity at risk. While ample CO2 contributes to
greater crop productivity through photosynthesis, its contribution to increasing
global heat, which translates to more droughts, floods, and heat waves,
brings in more serious problems to farmers.
In essence, agricultural productivity and food security are directly threatened
by changing climate because it disrupts the following:
Growing patterns of crops – by hastening or delaying crop maturity
and bearing of fruits.
Availability of water – more intense rainfall and increased drought
Soil fertility – more soil erosion occurring during times of heavy rains
and flooding
As responsible citizens of the Earth, the students should develop the abilities
to discuss relevant issues about climate change; discern, analyse, and

IMPACT OF CLIMATE CHANGE ON FOOD SECURITY
195
SEAMEO
Chapter V
evaluate common practices that lead to accelerated climate change; and offer
and execute solutions to problems brought about by climate change in the
community.
MATERIALS NEEDED
Student Worksheets A, B, C, D, E
pictures, broad sheets of paper, meta cards, pentel pens, scotch tape
scissors, ruler
if available: LCD projector, computer laptop
PRESENTATION OF THE LESSON
Scenario
Students will view these two pictures carefully. Use the following guide
questions for discussion:
1. What specific differences do you see between the two pictures?
2. Which picture shows an industrial site? An agricultural site?
3. Cite some specific examples of places you know of that are
undergoing the same changes as shown in the pictures.
A. Pre-industrial revolution B. Industrial revolution
Source: Kartapranata (2010) Source: http://myecoproject.org
Student Activities
Students will have a group activity as described in Worksheets A, B, C, D,
E. (Note: the Teacher may divide the tasks into two sessions if it is not
manageable in one session.)
Process Guide for Teachers
1. Distribute Student Worksheet A ( Eco-Vocabulary). Allow the students to analyse the sentences and pick the word/s or phrase/s that gives the clues to the meaning of the italicised word. Answers may be given orally or written.

IMPACT OF CLIMATE CHANGE ON FOOD SECURITY
196
SEAMEO
Chapter V
2. Divide the class into 4 groups with 5-8 members each. Using the
article ―Mea Culpa, Mother Earth‖ as basis for discussion, each group
will be assigned to do particular activities, as follows:
Group 1 - Concept Mapping
Group 2 - Cause and Effect Chart
Group 3 - Graphic Organiser
Group 4 - Bubble Making
3. Each group will think of a name that will represent them. The teacher
should provide a sheet of paper large enough for the whole group to
write their outputs.
4. Each group will present their output in class in the most creative way
that they could think of. Examples of presentations are news reporting,
role-playing, pantomime, panel discussion etc. As each group share
their ideas, the teacher will post on the board the rubric on their
presentation.
Closure
Ask the students to formulate a one-sentence generalisation of the things
they learned in the session. The students will orally recite their
generalisations. The teacher will then give a summary of the discussions
and inject some values on the importance of protecting Mother Earth.
Achieving the Objectives
Objective This is achieved by
Describe the role played by man in accelerating climate change.
Discussion of the article ―Mea
Culpa Mother Earth‖
Identify common practices that contribute to production of GHGs pollution, and other environmental problems.
Enumeration of what could be
observed as common practices.
Determine the effects of accelerated
climate change on the supply of rice
and other agricultural products.
Students perform activities in
Worksheet B and C.
Suggest specific ways of how each individual could help lessen the negative effects of accelerated climate change.
Students perform activities in
Worksheet D and E.
Define vocabulary of ecological Students perform group activity in

IMPACT OF CLIMATE CHANGE ON FOOD SECURITY
197
SEAMEO
Chapter V
Objective This is achieved by
terms using context clues. Worksheet A.
Exchange views with other members
of the class about local issues
involving accelerated climate
change.
Students perform activities in
Worksheets B and E.
Assessment
A. Open-Ended Assessment
Instruction: Complete the open-ended statements.
1. I am concerned with our environment because___________________
2. Climate change can affect food supply if _______________________
3. Our forest resources such as _______________________________
will also be affected by climate change.
4. Climate change will also affect our fisheries if bodies of water will
_______________________________________________________
5. I can protect Mother Earth by ________________________________
6. We need to act now because ________________________________
7. I can give my share for our continued existence by _______________
B. Performance-based Assessment
Student’ performance will be assessed using the rubrics (Attachment 5.3.7)
and (Attachment 5.3.8).
Assignment
The students will be given a take home exercise. They will be asked to
express their thoughts on the phrase ―Think Globally, Act Locally,‖ in
whatever creative forms they like such as: write a one-page essay or
poem, compose a song, do a poster, among others.

IMPACT OF CLIMATE CHANGE ON FOOD SECURITY
198
SEAMEO
Chapter V
RESOURCES
ESPERE-ENC. (2010). Man-made Climate Change. Retrieved on 30 October 2010
from http://www.atmosphere.mpg.de/enid/basics/1__Man-
made_climate_change__1od.html
MyEcoProject (2009). Causes and Effects of Air Pollution. Retrieved on November
11, 2010 from http://myecoproject.org/get-involved/pollution/causes-and-
effects-of-air-pollution/
New Horizon for Learning English, pp. 7 – 11.
Institute of Physics (IOP). (1999). Has man cause climate change? Retrieved on 30
October 2010 from http://physicsworld.com/cws/article/news/3025
Kartapranata (2010), Rural Rice Farm Indonesia, Retrieved on April 11, 2011 from
http://upload.wikimedia.org/wikipedia/commons/3/33/Rice_plantation_in_Jav
a.jpg

IMPACT OF CLIMATE CHANGE ON FOOD SECURITY
199
SEAMEO
Chapter V
Attachment 5.3.1
MEA CULPA, MOTHER EARTH
Adapted from "A Day for Mother Earth" by Jamil Flores Philippine Panorama, April 2, 1990
On the third planet from the sun, the largest of the inner planets of the solar system, human life has found a cozy home. That home, in which man has emerged as the most successful species of fauna for 2 or 3 million years now, is composed of an atmosphere, a hydrosphere and a lithosphere. Air, oceans and terra firma – all of them are heavily polluted in the course of man's inexorable conquest and ruthless exploitation of his environment. That is the reason the earth is an endangered planet. Its most successful tenant seems determined to destroy it and destroy himself as well.
How has man endangered the earth on which he lives? By sheer fecundity, in the first place. There are over 5.1 billion human beings on earth today (most of them in Asia) all of them in need of food and shelter that are often extracted directly from nature, all of them producing waste and garbage every day.
For about 200 years now, chimneys of industry have been sending up billowing clouds of toxic gases into the atmosphere while pouring noxious effluents into rivers, lakes and marine shores that are already poisoned by the fertilizers and pesticides of agriculture. That is perhaps why red tide blooms are more frequent, more virulent and more toxic than they have ever been – a super abundance of nutrients that find their way into the oceans. Whole forests, the lungs of the earth, that produce the oxygen without which human lives would not be possible, have been obliterated in the name of progress. That is why this country's mountain ranges are badly eroded, and aquifers here run dry. For the past several decades, the human race has been sending up chlorofluorocarbons (CFCs) out of spray cans, refrigerators, air conditioners, and hamburger boxes into the atmosphere where they attack the only defense that the earth has against the sun's ultraviolet bombardment – layer of ozone cells 10 to 30 miles up in the atmosphere. Without that defense, we get a lot of problems: skin cancers, eye cataract effect, the heating of the earth that could melt the polar caps and drown whole coastal cities and many more social ills.
How much more abuse can the earth take? No scientist in the world today will claim that he knows, but reason says that, in spite of the Ecclesiastes, given man's constant assaults against it, the earth cannot abide forever. During an earlier age, the land, the sea and the air had an effective defense against man – their sublime immensity. Man looks puny in the bowels of the jungle; adrift at sea, he is but a dot in eternity of marine and sky blue. But today, against 5.1 billion human beings that are reproducing at a tremendous velocity, a jungle is less awesome, and the sea becomes vulnerable. Forests are burned and converted into something else (agricultural land, industrial plan sites, for example) at the rate of an area the size of a football field per second. And whole oceans are smothering in the garbage and oil spillages of human civilization. There are, indeed, big patches of dead coastal waters in various parts of the world, incapable of supporting marine life.
No. The earth does not abide forever. And the only way for her to abide a bit longer is
for man to convert from being her attacker into being her protector.

IMPACT OF CLIMATE CHANGE ON FOOD SECURITY
200
SEAMEO
Chapter V
Attachment 5.3.2 Student Worksheet A
ECO-VOCABULARY
Name: ____________________________________________________
Grade and Section: __________________________________________
Instruction: Read and analyse the sentences carefully. Choose the meaning of
italicised words. Answers may be given orally or in written form.
1. The planet is now heavily polluted because of man's ruthless exploitation of his
environment.
a. cruel utilisation c. useless production
b. crude transformation d. careless habitation
2. With 5.1 billion human beings on earth today, man has endangered this planet
through sheer fecundity.
a. passion c. fertility
b. habit d. sterility
3. Forests have been obliterated in the name of progress. Thus, we have constant
erosions and floods.
a. neglected c. purchases b. destroyed d. forgotten
4. Oceans are smothering in the garbage and oil spillages of human civilization.
a. shining c. roaring b. shivering d. dying
5. With constant assault against earth, it cannot abide forever.
a. wait c. exist
b. move d. obey
6. Chimneys of industry poured noxious effluents into rivers, lakes and marine
shores.
a. liquid waste c. poisonous waste
b. harmful waste d. solid waste

IMPACT OF CLIMATE CHANGE ON FOOD SECURITY
201
SEAMEO
Chapter V
Attachment 5.3.3 Student Worksheet B
GROUP 1: CONCEPT MAP CREATOR
Instruction: From the issues presented in the article ―Mea Culpa, Mother Earth,‖ fill in
the concept map below.
a. Cite practices mentioned in the article that your group consider as causes of
climate change. Your group may identify other causes not mentioned in the
article.
b. Enumerate the impacts of climate change to agriculture, forest resources, and
fisheries that were cited in the article.
c. Your group could still cite other effects not included in the article. You may
include the observations from your own community.
Concept Map on Climate Change Impact to the Rural Community

IMPACT OF CLIMATE CHANGE ON FOOD SECURITY
202
SEAMEO
Chapter V
Attachment 5.3.4 Student Worksheet C
GROUP 2: CAUSE AND EFFECT ANALYST
Instruction:
Work on the Cause and Effect Chart below.
Boxes on the left should contain the causes of climate change, while boxes
on the right should contain the corresponding effects of climate change on
agriculture, forest resources and fisheries.
CAUSES EFFECTS
Cause and Effect Chart of Climate Change on Food Resources
on Agriculture
on Forest Resources
on Fisheries

IMPACT OF CLIMATE CHANGE ON FOOD SECURITY
203
SEAMEO
Chapter V
Attachment 5.3.5 Student Worksheet D
GROUP 3: THE GRAPHIC ORGANISER
Instruction: Do the Graphic Organiser by coming up with suggestions and
recommendations on how to mitigate and lessen the adverse effects of accelerated
climate change on agriculture, forest resources and fisheries.
Climate Change Mitigation Measures
ADVERSE EFFECTS OF CLIMATE
CHANGE
RECOMMENDATIONS
(Individual Level)
1. On Agriculture
2. On Forest Resources
3. On Fisheries

IMPACT OF CLIMATE CHANGE ON FOOD SECURITY
204
SEAMEO
Chapter V
Attachment 5.3.6 Student Worksheet E
GROUP 4: THE BUBBLE MAKER
Instruction:
Do the Bubble Making. Inside the bubbles are different elements being
affected by the accelerated climate change.
Write down suggestions on how you can lessen or mitigate the adverse
effects of climate change on each of the elements inside the bubble. Your
suggestions should be directed at the community level.
The Bubble Map
Fisheries______
______________
______________
______________
______________
______________
____
Barren
lands___________
________________
________________
________________
_______________
Livestock and poultry
animals____________
___________________
___________________
___________________
___________________
___________________
__
Human health
and
wellness_____
____________
____________
____________
____________
__
Forests_____
____________
____________
____________
____________
____________
________
Rice, corn,
other
crops_________
______________
______________
______________
______________

IMPACT OF CLIMATE CHANGE ON FOOD SECURITY
205
SEAMEO
Chapter V
Attachment 5.3.7 Sample Rubric on Group Performance Output
Subject/Topic:_______________________________________________________
Project/ActivityTitle:__________________________________________________
Date:_______________________________________________________________
Group Name:_________________________________________________________
Team Members:______________________________________________________
Group Output Below
Average Satisfactory Excellent
1. Grammatically correct 1, 2, 3 4, 5, 6 7, 8, 9
2. Concise 1, 2, 3 4, 5, 6 7, 8, 9
3. Clear 1, 2, 3 4, 5, 6 7, 8, 9
4. Relevant 1, 2, 3 4, 5, 6 7, 8, 9
5. Effective 1, 2, 3 4, 5, 6 7, 8, 9
(Adapted from http://www.teach-nology.com/cgi-bin/project_rub.cgi)

IMPACT OF CLIMATE CHANGE ON FOOD SECURITY
206
SEAMEO
Chapter V
Attachment 5.3.8 Sample Rubric on Group Presentation
Subject/Topic:________________________________________________________
Project/ActivityTitle:____________________________________________________
Date:_______________________________________________________________
Group Name:_________________________________________________________
Team Members:______________________________________________________
Indicators 5 4 3 2 1
1. All group members contributed.
2. Ideas were well-organised.
3. Materials used were attractive.
4. Group finished the task on time.
5. Group presented with confidence.
Use Rating Scale of 1 to 5 where:
5 - all five conditions were met
4 – four conditions were met
3 – three conditions were met
2 – two conditions were met
1 – only one condition was met
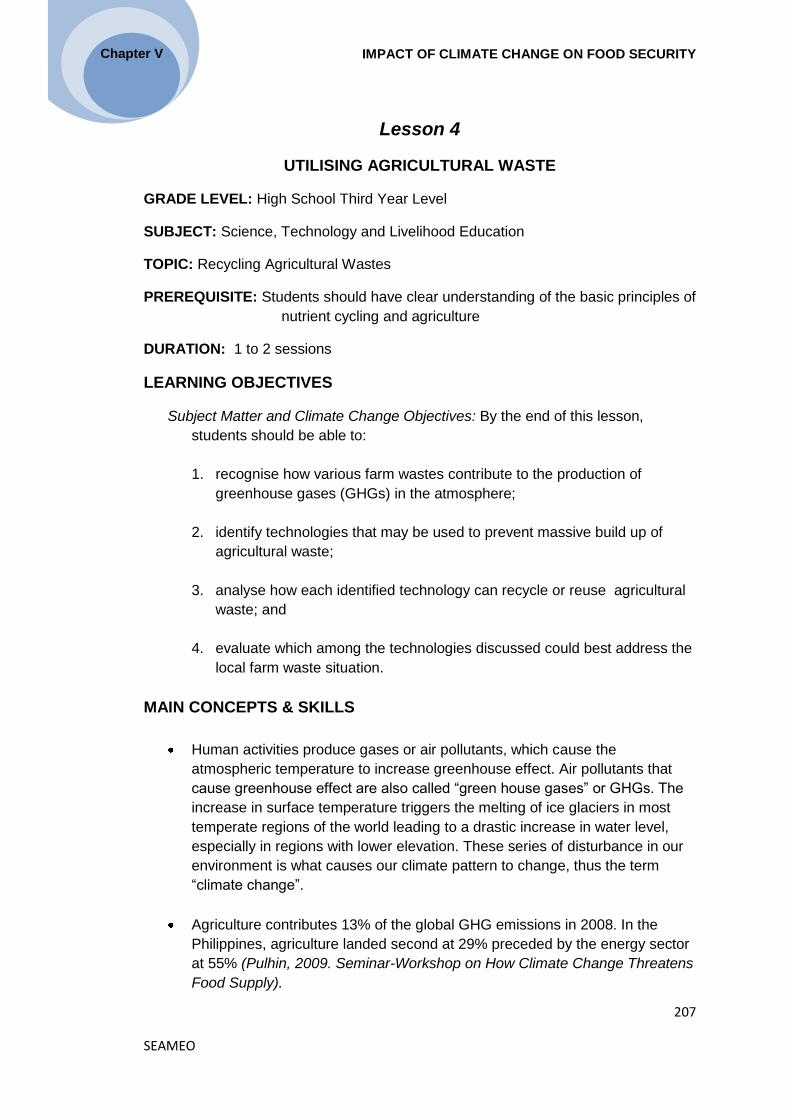
IMPACT OF CLIMATE CHANGE ON FOOD SECURITY
207
SEAMEO
Chapter V
Lesson 4
UTILISING AGRICULTURAL WASTE
GRADE LEVEL: High School Third Year Level
SUBJECT: Science, Technology and Livelihood Education
TOPIC: Recycling Agricultural Wastes
PREREQUISITE: Students should have clear understanding of the basic principles of
nutrient cycling and agriculture
DURATION: 1 to 2 sessions
LEARNING OBJECTIVES
Subject Matter and Climate Change Objectives: By the end of this lesson,
students should be able to:
1. recognise how various farm wastes contribute to the production of
greenhouse gases (GHGs) in the atmosphere;
2. identify technologies that may be used to prevent massive build up of
agricultural waste;
3. analyse how each identified technology can recycle or reuse agricultural
waste; and
4. evaluate which among the technologies discussed could best address the
local farm waste situation.
MAIN CONCEPTS & SKILLS
Human activities produce gases or air pollutants, which cause the
atmospheric temperature to increase greenhouse effect. Air pollutants that
cause greenhouse effect are also called ―green house gases‖ or GHGs. The
increase in surface temperature triggers the melting of ice glaciers in most
temperate regions of the world leading to a drastic increase in water level,
especially in regions with lower elevation. These series of disturbance in our
environment is what causes our climate pattern to change, thus the term
―climate change‖.
Agriculture contributes 13% of the global GHG emissions in 2008. In the
Philippines, agriculture landed second at 29% preceded by the energy sector
at 55% (Pulhin, 2009. Seminar-Workshop on How Climate Change Threatens
Food Supply).

IMPACT OF CLIMATE CHANGE ON FOOD SECURITY
208
SEAMEO
Chapter V
Vermicomposting is a technology that utilizes agricultural (i.e. crop waste and
animal manure) and kitchen wastes (i.e. spoiled food) as substrate for
earthworms. Earthworm castings are then dried and used as soil conditioner
and fertiliser in crop production. Earthworms produced in vermicomposting
are also used as vermimeal in aquaculture. Vermimeal consist of sun dried
chips of earthworm that offers a good protein source for aquaculture.
Biodynamic agriculture is an advanced practice of organic farming wherein it
looks upon the farm elements as living entity. For a soil (a major component
of crop production) to become productive for generations, there is a need to
treat its maintenance as a basic necessity. Therefore, agricultural practices
that will be applied to the soil should allow it to regain the resources lost
during crop production.
Fuel and Charcoal Briquettes are blocks of compressed materials suitable for
burning. Materials used for making briquettes may cost little or nothing at all
because it only requires partially decomposed plant wastes as materials for
pressing and molasses, starch or manure as binders. The only requirement is
that materials should have the capability to burn for a longer period. Lastly,
briquettes are very cost effective compared to ordinary charcoal or firewood
especially for industrial operation since it produces higher heat level and
longer heat duration (heat efficiency).
Biogas Production pertains to manufacturing biofuel through anaerobic
decomposition of organic matter. Anaerobic decomposition happens when
organic matter decays with the help of microorganisms in an oxygen-free
environment. Gas produced has relatively low carbon output making it a
better substitute for fossil fuel as energy source for combustion and transport.
Students need to appreciate how agricultural technologies could help recycle
or reuse farm wastes and determine the cost-effectiveness of different
technologies.
MATERIALS NEEDED
Websites, articles, research publications, video clips of various farms and
their waste products
Posters and meta cards
Links to websites
www.agricultureinformation.com
www.biodynamics.com
www.osist.dost.gov.ph/technologies/overview/9/3
www.villagevolunteers.org
http://www.biodynamics.com/biodynamics.html

IMPACT OF CLIMATE CHANGE ON FOOD SECURITY
209
SEAMEO
Chapter V
PRESENTATION OF THE LESSON
Scenario
Cite statistical data showing the contribution of agricultural sector on GHG
emissions.
Student Activities
Students will enumerate possible agricultural technologies that may utilise
farm by-products and discuss the key components of each technology
and its underlying principles.
Guide Questions:
1. How do farms and other methods of agricultural practices increase the
production of GHGs?
2. Which of the technologies described may be used to lessen these
adverse effects?
3. Enumerate the agricultural commodities being produced in your
locality/community.
a. What are the agricultural wastes brought about by these
productions?
b. Given the local agricultural condition, which is most appropriate
technology to use that will make use of the wastes?
c. Why do you think this is the most appropriate technology?
Process Guide for Teachers:
1. The whole class will be divided into groups, each group with at least 4
members. Each group will discuss a given agricultural/farming technology.
They will answer the following guide questions for discussion.
How does the technology make use of agricultural waste?
How efficient is the technology in recycling or reusing the waste?
Which technology will be most appropriate to use in your locality?
Assess the technology as to its cost effectiveness and possibility of
commercial production.
2. Each group will present the result of their discussions. Other members of
the class will ask questions after each presentation.

IMPACT OF CLIMATE CHANGE ON FOOD SECURITY
210
SEAMEO
Chapter V
Achieving the Objectives
Objective This is achieved by
To create awareness on the adverse
impact of various farm waste in the
environment.
Websites, articles, research
publications or video clips of various
farms and their waste products
To identify technologies that may be
used to prevent massive build up of
agricultural waste.
Students discuss about the various
technologies available that may be used
to recycle or reuse agricultural waste
products.
To analyse how each identified
technology can solve the issues
related to agricultural waste.
Students do group activity focusing on
the need for technological gadgets,
machineries in order to solve the
problem of agricultural wastes.
To evaluate which among the
technologies discussed could best
address the local farm waste
situation.
Students compose a write-up containing
their analysis and recommendations of
the best technology to use to address
the problem.
Assessment
Use the attached rubric to assess the oral presentation of each group
(Attachment 5.4.1).
Assignment: (Extension Ideas)
Make a case study of your own community. You may conduct interviews with
farmers or even visit their farms which revolve around the following issues:
1. What are the farm products in your community or the locality nearest
to your place?
2. How are these products used? What are the wastes produced by
these products?
3. How are theses wastes being disposed?
4. Which among the discussed technologies will you recommend to the
farmers or the users of the farm products?
5. Give some suggestions on how income could be generated further
from the wastes that could be recycled or reused.
6. Submit the results of your case study.

IMPACT OF CLIMATE CHANGE ON FOOD SECURITY
211
SEAMEO
Chapter V
RESOURCES
Agricultural Training Institute. Biogas Production: Alternative Pig Waste Management
System. Video Presentation. Pulhin, J. M. (2009). Seminar-workshop on how climate change threatens food
supply: Agriculture and forestry sector. UPLB:SEARCA.
SRA-La Granja Research and Extension Center. Vermicomposting sugarcane trashes. Leaflet.
TESDA. Charcoal Briquetting. Video Presentation
TESDA. Vermiculture and Vermicompost Production. Video Presentation

IMPACT OF CLIMATE CHANGE ON FOOD SECURITY
212
SEAMEO
Chapter V
Attachment 5.4.1 Oral Presentation Rubric
Traits Presented
4 Exceeds Standard
3 Meets
Standard
2 Progressing to Standard
1 Below
Standard
Content Opening Opening captivates the audience with interest and/or intrigue.
Interesting opening; engages audience.
Opening is minimally engaging.
Opening is not engaging.
Focus Purpose of
presentation is
clear.
Supporting
ideas maintain
exceptional
focus on the
topic
Topic of the
presentation
is clear.
Content
consistently
supports the
purpose.
Presentation
lacks clear
direction.
No clear
focus.
Organisa
-tion
Information/
ideas are
presented in a
consistently
logical
sequence.
Transition/
connections are
eloquent. A
strong sense of
wholeness is
conveyed.
Conclusion
leaves the
audience with a
strong sense of
closure.
Important
ideas and
information
are identified
for the
audience.
Information/
ideas are
presented in
a logical
sequence
with few
lapses.
Transitions
and
connections
are made.
Closing
effectively
summarises
the
presentation.
Irrelevant,
unnecessary
information
detracts. Big
ideas are not
specifically
identified.
There are
significant
lapses in the
order of
ideas.
Transitions
are
inconsistent
and weak or
missing.
Closing
demonstrates
an attempt to
summarise.
No clear
organisation.
Ideas do not
connect with
one another.
There are no
clear
transitions.
No closing is
evident.

IMPACT OF CLIMATE CHANGE ON FOOD SECURITY
213
SEAMEO
Chapter V
Traits Presented
4 Exceeds Standard
3 Meets
Standard
2 Progressing to Standard
1 Below
Standard
Presen-tation
Speech Commands
audience
politely using
eye contact,
making sure
audience is
ready. Can be
heard by all
members of
audience
without
assistance.
Uses visual aid
as guide or
outline for
speaking.
Consistently
maintains eye
contact.
Makes sure
audience is
ready before
starting. May
need
reminders
from
audience to
speak up;
generally
consistent,
maintains
eye contact,
minimises
reliance on
notes.
Makes
occasional
eye contact,
makes few
attempts to
command
audience;
may start
speaking
before
audience is
ready. Needs
reminders
from audience
to speak up.
Mostly reads
from notes.
Audience
hears with
great
difficulty.
Reads
notes and
seldom
establishes
eye contact.
Visual Aid Visual aid can
be seen and
attractive from
all parts of the
room. Graphic
is clear and
professional
looking,
enhancing the
message.
Visual aid
can be seen
from all parts
of the room.
Graphic is
neat.
Appropriate
subject
chosen to
depict
message.
Visual aid is
not
completely
accessible to
all audience
members.
Graphic may
be messy.
Visual may
not be most
appropriate to
support
presentation.
Visual aid
undecipher-
able.
Graphic
detracts
from
message.
Messy or
inappro-
priate
visual.
Question
& Answer
Speaker
expands upon
previous
statements.
Cites additional
examples to
answer
question.
Thoughtful,
concise
response.
Conveys
knowledge of
subject.
Response not
clear or did not
add to
comprehension
of the listener.
Could not
answer
questions or
answers are
irrelevant.
CHAPTER VI: Impact of Climate Change on HEALTH AND NUTRITION [SEAMEO TROPMED Philippines, SEAMEO TROPMED Indonesia and SEAMEO RECSAM]

IMPACT OF CLIMATE CHANGE ON HEALTH AND NUTRITION
215
SEAMEO
Chapter VI
INTRODUCTION
Extreme weather events causing destructive floods and droughts never before experienced in the past years provide telling evidence of climate change. The poor almost always bear the brunt of the impact to health and safety of climate change by virtue of their very limited access to economic and social capital such as education, private savings and mobility.
The effect of climate change on health can be direct or indirect. Figure 6.1 shows these effects.
Ways in which climate change can affect human and health
MEDIATING PROCESS HEALTH OUTCOMES
DIRECT EFFECTS
Exposure to thermal extremes Heat and cold-related illness and deathAltered frequency and /or intensity of other weather extremes
Deaths, injuries, and psychological disorders, damage to public health
infrastructure
INDIRECT EFFECTS
Effects on range and activity of vectors and infective parasites
Changes in geographic ranges and incidence of vector-borne diseases
Altered local ecology of water-borne and food borne infective agents
Changes in incidence of diarrhoeal and certain other infectious diseases
Altered food productivity due to changes in climate, weather, pests and diseases
Regional malnutrition and hunger, consequent impairment of growth and
developmentSea level rise: with population displacement and damage to infrastructure
Injuries, increased risks of various infectious diseases, psychological
disordersAir pollution: including pollen and spores Asthma, allergic disorders: other acute
and chronic respiratory disorders and deaths
Social, economic and demographic disturbance
Wide range of public health consequences (e.g., civil strife, nutritional impairment) economic, and demographic
disturbance Figure 6.1 Ways in which Climate Change can Affect Human Health Source: McMichael et al (1995) Thermal extremes such as heat waves and extremely cold spells have caused huge mortalities and casualties among the poor, the homeless, the elderly, infants and those in ill health. The frequency and intensity of extreme weather events such as

IMPACT OF CLIMATE CHANGE ON HEALTH AND NUTRITION
216
SEAMEO
Chapter VI
super typhoons alternating with prolonged periods of drought do not only leave people dead and injured but also permanently scar survivors psychologically and emotionally. In addition, these cause population displacements creating conditions that favour epidemics.
The relationship between climate change and human health involves multiple pathways and their relationship is schematically presented in Figure 6.2 below:
Figure 6.2 Relationship between Climate Change and Human Health Source: WHO (2003) in Rahman (2008)
Published evidences so far indicate that:
climate change is affecting the seasonality of some allergenic species as well as the seasonal activity and distribution of some disease vectors;
climate plays an important role in the seasonal pattern or temporal distribution of malaria, dengue, tick-borne diseases, cholera and some other diarrhoeal diseases;
heat waves and flooding can have severe and long-lasting effects.
Influence of Climate Change on Disease Triad
Diseases in the human hosts result when a specific agent, such as persistent unfavourable environmental conditions (e.g., climate change) or the activity of a pathogen disrupts physiological functions causing the human to deviate from normal behaviour. The word “persistent” is used to distinguish a disease which develops over time from an injury which usually occurs instantaneously.
Climate Change
Human Exposure Regional
Weather Change Heat Waves
Extreme Weather
Temperature Precipitation
Sea Level Rise Salinity Intrusion
Contamination Pathways
Transmission Dynamics
Changes in Agro-ecosystem, Hydrology
Socioeconomic & Demographic Distribution
Health effects Temperature related
illness and death
Extreme weather related health effects
Air pollution related health effect
Water-food borne diseases
Vector-borne & Rodent borne diseases
Effects on food and water shortage
Mental, nutritional, infectious & other
health effects

IMPACT OF CLIMATE CHANGE ON HEALTH AND NUTRITION
217
SEAMEO
Chapter VI
Noninfectious diseases, more appropriately called disorders, do not spread from person to person. Disorders often result from the host’s exposure to environmental factors such as unfavourable weather due to high temperature (heat wave) or extreme low temperature and, undernourishment. An infectious disease results when a microbial pathogen lives in close association with the host (e.g., human). The pathogen functions as a parasite as this relationship usually benefits the pathogen at the host’s expense. Three critical factors must be present for a disease and/or disorder to occur:
• Pathogen • Vulnerable Host (e.g., human), and • Environment (e.g., climate change)
Humans are vulnerable to disease if factors such as these are present: insufficient or improper nutrition, inaccessible clean water due to flooding, the strain of the pathogen is virulent and favourable environmental factors (climate change i.e.; high temperature and flooding) that enhance the growth and propagation of the pathogen but which may be detrimental to the host (human). The disease triad concept as shown in Figure 6.3 helps us understand how a particular disease develops and it explains the factors affecting its development.
Figure 6.3 Disease Triad Concept Vector-Borne Diseases
The indirect effects are seen on vector-borne diseases such as malaria, dengue, filariasis and schistosomiasis which are jointly affected not only by climatic conditions but also by population movement, forest clearance, land-use pattern, biodiversity losses, freshwater surface configuration and human population density. Changing weather patterns may favour the ecology of mosquito or snail vectors of malaria/filariasis and schistosomiasis, respectively and expand the range of distribution of these diseases. Movement of environmental refugees from endemic to

IMPACT OF CLIMATE CHANGE ON HEALTH AND NUTRITION
218
SEAMEO
Chapter VI
non-endemic areas could spread these diseases too. The loss of forests, improper land use patterns and biodiversity losses could destroy natural habitats of vectors forcing them to seek other favourable places in the process of spreading the diseases.
Gubler, Reiter, Ebi, Yap, Nasci & Patz (2001) proposed the following association between climate change and transmission pattern of vector- and rodent-borne diseases.
Climate change (natural and human-caused) regional weather changes (temperature, precipitation and humidity) vector longevity, vector development, pathogen development, natural vertebrate host distribution and abundance, vector and rodent habitat disease transmission dynamics altered length of transmission season, altered intensity of transmission, altered distribution of diseases and increased or decreased disease risk(disease-specific).
The worldwide effect of climate change is expected to lead to increased latitudinal and altitudinal warming. Given this, Githeko (2009) warned that Southern Africa will be more suitable for malaria transmission and the east African highlands will become warmer thus intensifying malaria transmission. In Australia, although malaria was eradicated in 1981, the mosquito vector was not. Increase in temperature and precipitation may favour conditions for breeding of the malaria vector increasing the populations of the vector. GIS surveillance of schistosomiasis in China showed the slow northward expansion of the disease as the temperature and precipitation increase in this part of the country.
The two destructive typhoons that inundated Metro Manila in September 2009 resulted in an outbreak of leptospirosis, a disease spread through contact with water contaminated with urine of rats, dogs and other animals. With 160,000 people living in unhygienic conditions in evacuation centres and 1.4 million people living in flooded suburbs, the inevitable results were 175 deaths from the disease and 2000 showing symptoms of the disease.
The Third Assessment Report of the Intergovernmental Panel on Climate Change in 2001 as cited by WHO (2003) stated that “overall, climate change is projected to increase threats to human health, particularly in lower income populations, predominantly within tropical/subtropical countries.” The vulnerability of these populations depend on such factors as population density, level of economic development, food availability, income level and distribution, local environmental conditions, pre-existing health status and quality and availability of public health care.

IMPACT OF CLIMATE CHANGE ON HEALTH AND NUTRITION
219
SEAMEO
Chapter VI
Waterborne Diseases Waterborne diseases are illnesses brought about by drinking water contaminated by human and animal faeces which may contain microorganisms that can cause disease. In developing countries, several diseases are brought by contaminated water and diarrhoea is the leading cause of illness and death among children.
What Impact Will Climate Change Have On Water Quality? Climate change is expected to increase the severity of weather. This means that some regions will experience an increase in rainfall and flood risk, while regions that are prone to droughts may experience more extreme droughts. Warmer temperatures and increased precipitation will raise the risk of flooding. Floods cause sewage and drinking water to mix and if that water is ingested, the risk of contracting diarrhoea is great. The lack of sanitation in developing countries will even make the problem worse. IPCC (2007) predicted an increase in illnesses and deaths in Southeast Asia due to diarrhoeal diseases, primarily associated with climate change. The occurrence of water-borne diseases in the region is likely to increase with global warming due to precipitation changes, contamination of fresh water supplies, and sea level intrusion into freshwater areas. Floods contaminate shallow groundwater and stream waters, which in some areas are the main source of drinking water. During drought periods, sea water advances inland, which leads to contamination of groundwater resources.
McMichael (2004) commented that the risk of deaths and illnesses due to climate change (attributable to diarrhoea and malnutrition) in some parts of Southeast Asia is already the largest in the world. He further predicts that this would remain so up to 2030. Flooding and rising sea levels could result in poor water quality leading to more water-related infectious diseases such as gastrointestinal diseases. Examples of gastrointestinal epidemic diseases that could be transmitted by poor sanitation and contaminated water supplies are amoebiasis, cholera, giardia, shigellosis, and typhoid fever. Pascual, Bouma & Dobson (2002) found that phytoplankton blooms are excellent habitats of infectious bacterial diseases such as cholera. These phytoplankton blooms are projected to benefit from warmer sea surface temperatures along the coastlines of Southeast Asian countries.
Several incidents were documented showing the effect of climate change (excessive precipitation) on water quality leading to cases of waterborne diseases. The outbreak of E. coli in Walkerton, Ontario, Canada is a good example of how excessive precipitation can increase the probability of water contamination. On May 8, 2000, a heavy rainfall began in Walkerton. On each of the first four days, the community received 10 to 20 millimeters of rainfall. On May 12, 70 millimeters of rain fell. This amount of rainfall was unusual, and could be expected once every 60 years. It is believed that the heavy rain overburdened the groundwater aquifers, and, through runoff, animal wastes contaminated the water supply with the E. coli

IMPACT OF CLIMATE CHANGE ON HEALTH AND NUTRITION
220
SEAMEO
Chapter VI
bacteria. Aside from E. coli, there are other waterborne microorganisms that cause diarrhoea such as vibrio cholera, campylobacter, amoeba, hepatitis and salmonella, salmonella, rotavirus and norovirus. Several incidents like what happened to Canada also happened in several Southeast Asian countries (IPCC 2007). From the World Health Organisation (WHO-SEARO, 2008.), Figure 6.4 shows that diarrhoeal diseases contribute the largest fraction in the total burden of world diseases.
Figure 6.4 Diseases with the Largest Water, Sanitation and Hygiene Contribution Source: WHO-SEARO (2008)
Figure 6.5 Link between a climate signal and diseases Source: WHO-SEARO (2008) The impact of climate change in the occurrence of diarrhoeal diseases is best understood if the disease pathway is presented. The diarrhoeal disease pathway is

IMPACT OF CLIMATE CHANGE ON HEALTH AND NUTRITION
221
SEAMEO
Chapter VI
Hidden Hunger is micronutrient malnutrition. It is called “hidden hunger” because it is not readily apparent from clinical signs of a body. Even if a person consumes enough calories, this does not guarantee adequate intake of essential micronutrients (vitamins, minerals and trace elements such as vitamin A, iron, zinc, iodine, calcium, etc). This condition may happen due to low quality of food consumed. Micronutrient deficiency can have far greater consequences than insufficient macronutrient intake, as follows (Cohen, Tirado, Noora & Thompson, 2008):
Iron deficiency can lead to anaemia which may have impact to maternal mortality during childbirth delivery. Anaemic mothers are more likely to deliver prematurely, low birth weight baby and to have babies who die as newborns. Anaemia among children can impair health and development, limit learning capacity, and impair immune systems. Iron deficiency in adult can reduce work performance.
Lack of adequate iodine in maternal diets can lead to spontaneous abortion and stillbirths. Children who have iodine deficiency could have cretinism and retardation.
Insufficient vitamin A intake among children causes blindness and impairs immune system which contributes to infections and death.
Inadequate dietary zinc can lead to stunting (i.e., lower than expected height for one’s age) and greater susceptibility to infections.
Deficiency in calcium intake increases the risk of osteoporosis and bone deformities occurrence during growth years.
Main source of iron comes from meat; vitamin A source food is liver, carrot, etc.; zinc can be taken from seafood; iodine usually from iodine fortified-salt; source of calcium are milk and milk products, egg yolks, grains, legumes, nuts, and green vegetables. Reduction in livestock production, food crops yield, and higher food prices due to food scarcity as a result of climate change could worsen the existing hidden hunger in communities because there will be decline in the availability and accessibility to food rich in iron, zinc, vitamin A, iodine, calcium, etc. that makes people consume less micronutrient (Cohen et al., 2008).
best exemplified by Figure 6.5. This flow chart from WHO-SEARO (2008) illustrates the points that provide the link between a climate signal and a disease. While we are interested in the human health end points (at the far right of the chart), many of these diarrhoeal diseases are zoonotic (transmitted from animals) and, therefore, transmission pathways must include both human and animal contamination. The pathogens can be transmitted from person to person (in some cases), or indirectly through contamination of food products, groundwater, and surface water.
What are the Impacts of Climate Change on Nutrition?
Climate change will definitely have impacts on our nutrition as shown in Figure 6.6. A change in climate may increase undernutrition cases which may result from improper or inadequate consumption, poor absorption or excessive loss of nutrients from the body (WHO-SEARO, 2008).

IMPACT OF CLIMATE CHANGE ON HEALTH AND NUTRITION
222
SEAMEO
Chapter VI
Figure 6.6 Impacts of climate change on nutrition
1. Starvation and hunger
An increase in temperature and reduced rainfall may lead to water shortages (drought). Climate change will also make crop pests thrive thereby disturbing the growth of cereal crops (WHO-SEARO, 2008). We must realise that cereal crops, the source of carbohydrate and our energy, are the staple food among the Southeast Asian population.
Droughts also have an impact on the decrease in food production from livestock (Bartlett, 2008) which will have consequences for the availability of meat and dairy products (Back & Cameron, 2008), and also affect fisheries which will decrease the supply of animal-protein source food (WHO-SEARO, 2008) and increase micronutrients deficiency problem (Cohen et al., 2008). During food shortages people will suffer from starvation and hunger (WHO-SEARO, 2008) due to inadequate food consumption that would lead to widespread undernutrition (UNICEF, 2007 & 2008).

IMPACT OF CLIMATE CHANGE ON HEALTH AND NUTRITION
223
SEAMEO
Chapter VI
2. Low nutritional status
Studies show that children born during drought years are significantly more likely to be stunted (Bartlett, 2008; UNICEF, 2008) while children exposed to floods also experience interruption in linear growth and remain shorter than the children unexposed to floods (Yoko, Goodman & Parker, 2009). When children are raised in dirty flood surroundings, calories that should go for their growth are spent instead of supporting their challenged immune systems (Bartlett, 2008). 3. Undernutrition due to diseases
Many important diseases are very sensitive to changing temperatures and precipitation caused by climate change. These include common diseases such as malaria, dengue fever, worm infestation, diarrhoea, water and sanitation related illnesses, and other communicable and non communicable disease (WHO-SEARO, 2008; Bartlett, 2008).
The relationship between nutrition and diseases is bi-directional, not only does disease bring undernutrition, but undernutrition also predisposes its sufferers to diseases. In other words, people who have disease may become undernourished even when there is sufficient food intake. When they are undernourished, their vulnerability to infections is increased (UNICEF, 2008).
People, who suffer from diseases, have increased caloric demand and metabolic requirements. While their nutritional needs increase during illness, on the other hand they cannot fulfill their nutrient requirement. For example, people who are chronically ill from parasitic infections such as worm infestations are unable to absorb nutrients, because the nutrients were taken by the parasites. Or, people who suffer from frequent , may restrict food intake because they are losing appetite, and they also experience impair nutrient absorption and nutrient losses during diarrhoea (Bartlett, 2008).
Diseases may also impair nutrient transport to target tissues which then will lower the body’s capacity to utilise food effectively. At the end, people will end up in undernourished condition (Yoko et.al., 2009).
Undernourished condition, especially in infants and young children, makes infections worse and more frequent because undernourished people have low protection to disease. Inadequate food consumption also heightens vulnerability to infectious diseases because of the impaired immune function (Cohen et al., 2008). Food Contamination Heavy precipitation events and intense tropical cyclone will raise the risk of flooding. Flood water can be contaminated by pathogenic microorganisms derived from human or animal faeces, and runoff from fields (pesticides), septic fields, gutter,

IMPACT OF CLIMATE CHANGE ON HEALTH AND NUTRITION
224
SEAMEO
Chapter VI
residential and industrial waste. Flood water may wash away or drown the facility in the house such as stove, cooking fuel, eating utensils, cooking utensils, including clean water to be cooked. These hamper people to prepare and store food hygienically and force people to drink unsafe water. In this dirty environment and minimised-facility, the risk of food contamination increases (WHO-SEARO, 2008). When drought occurs, water shortage increases. Children’s bodies, food, eating utensils, floors, cooking surfaces are all less likely to be kept clean when water supplies are inadequate and difficult to reach. When water supplies become scarce and difficult to access, families are more likely to store their water, a practice that greatly increases the potential for drinking water contamination. For instance, contamination can take place through children’s grubby hands reaching into pails for drinking water. People may be touching food without previously washing their hands since there is no water or they try to lessen the use of water. These conditions may contribute to diarrhoea disease outbreaks that may lead to undernutrition (Bartlett, 2008).
Climate change and variability also influences food contamination with non-infectious hazards such as biotoxins (e.g. mycotoxins or marine toxins) and chemicals, which may have an impact on food utilisation. Chemical food contamination may lead to recommendations to limit consumption of locally produced food in order to protect human health, thus reducing the dietary options and compromising people traditional diets. For example, high contamination with dioxins associated with severe droughts has led to recommendations that poor rural communities limit the consumption of locally produced foods. Higher ocean temperatures are leading to increased levels of methyl mercury in fish and marine mammals, prompting recommendations to limit the intake of fish and marine fats by pregnant women and indigenous people (Cohen et al., 2008).
Nutrition and Quality of Caring Practices
Intense weather events (cyclones, storms), sea level rise and coastal storms cause loss of life, injuries, life-long handicaps, and loss of property and land that will force massive migration and displacement. Migrated families will face hunger, unemployment, insecurity and famine. These will bring about psychosocial stress which causes potential social conflict that will affect mental health (WHO-SEARO, 2008).
The burdens faced by caregivers become more challenging. Overstretched and exhausted caregivers are more likely to leave children unsupervised and to cut corners in all the chores that are necessary for healthy living (Bartlett, 2008).
During crisis and emergency situation when health and nutrition of mother are usually diminished, the production of breast-milk will be disturbed. Therefore, mothers will provide the children with other food which need further preparation as substitutes for the breast milk. But the preparation and storage of the food, especially in unsanitary environments can present real health risks to children, since there is opportunity for

IMPACT OF CLIMATE CHANGE ON HEALTH AND NUTRITION
225
SEAMEO
Chapter VI
food contamination. Mothers may also be unaware about the quantities to be mixed in the food, which may place children at risk of undernourishment because of the lack of nutrients in their food (Bartlett, 2008; Yoko et al., 2009).
What Needs To Be Done?
How great the health impacts will be are strongly dependent on local environmental conditions and socio-economic circumstances and the range of social, institutional, technological, and behavioural adaptations taken to reduce the full range of threats to health. Every system has a particular adaptive capacity which is its ability to adjust to climate change (including climate variability and extremes) to moderate potential damages, to take advantage of opportunities or to cope with consequences.
What is seen as the “most important, cost-effective and urgently needed” adaptation strategy is the rebuilding and maintaining of public health infrastructure. This includes public health training, more effective surveillance and emergency response systems, and sustainable prevention and control programmes.
While it is incumbent upon vulnerable populations to put in place the above adaptation strategy to cushion the impact of climate change, the need for education of the population especially the youth whose future is severely compromised by the effects of climate change cannot be overemphasised. As early as elementary school, children should be taught in simple terms and mechanisms the whys and the hows of climate change and how this could be abated or how its impact could be mitigated. By the time these students enter high school, they are prepared to take on certain responsibilities and better still stand side by side with adults in the crusade against activities that aggravate climate change. There are no better spokespersons than the group whose future is endangered by the very activities of adults who profess to protect their welfare and future.
What can the students do to make a difference?
• Balanced diet, in variation and proportion, and no excess consumption. Reduce average daily meat consumption but may increase meat consumption accordingly for those under- consumers.
• Take exchangeable food in one category (staple food: rice, cassava, corn, etc)
• Local food utilisation, cheap but nutritious. It will lessen the GHG emissions caused by transportation.
• School gardening activities.
• Promote exclusive breastfeeding. Mothers are encouraged to continue breastfeeding even while their supplies are depleted in order to maintain and stimulate their supply.

IMPACT OF CLIMATE CHANGE ON HEALTH AND NUTRITION
226
SEAMEO
Chapter VI
• Promote healthy lifestyles. Use public transportation, ask parents to leave the
car at home or share car journey with friends. For short trips and local shopping, try walking or use a bicycle. It will encourage physical exercise and thus reduce obesity. It keeps you fit and is fun too!
• Build anti-hunger alliances or join an environmental groups, express your concerns and solutions and stay informed
• Create, write, and disseminate information related to mitigating impact of climate change on health and nutrition to your friends, families, and communities.
• Prevent and prepare for emergency situations
• AND TAKE ACTION NOW!!!!!
To raise students’ awareness and develop their resiliency to climate change impact on health and nutrition, this chapter includes exemplars on vector-borne diseases (e.g., filariasis and dengue infections) and water-borne diseases (e.g., cholera) to show the effects of climate change on human health and nutrition.

IMPACT OF CLIMATE CHANGE ON HEALTH AND NUTRITION
227
SEAMEO
Chapter VI
REFERENCES Back, E., & Cameron, C. (2008). Our climate, our children, our responsibility: The
implications of climate change for the world’s children. UNICEF UK Climate Change Report. Retrieved on 11 February 2010 from http://www.childreninachangingclimate. org/docs/UNICEF_our%20responsibility.pdf.
Bartlett, S. (2008). Climate change and urban children: Impacts and implications for
adaptation in low- and middle-income countries. London , UK: Human Settlements Programme International Institute for Environment and Development (IIED). Retrieved on 11 February 2010 from http://www.iied.org/pubs/pdfs/10556IIED.pdf.
Cohen, M.J., Tirado, C., Noora, L.A., & Thompson, B. (2008). Impact of climate
change and bioenergy on nutrition. Retrieved on 26 October 2009 from http://www.fao.org/ag/agn/ agns/files/HLC2_Food_Safety_Bioenergy_Climate_Change.pdf
Githeko A. (2009). Malaria and climate change. Commonwealth Ministers Update
2009, pp. 40-43. Gubler, D.J., Reiter, P., Ebi, K.L., Yap, W., Nasci, R., & Patz, J.A. (2001). Climate
variability and change in the United States: Potential impacts on vector and rodent-borne diseases. Environmental Health Perspectives, Vol. 109 (2), pp. 223-233.
IPCC (Intergovermental Panel on Climate Change). (2007). Climate Change 2007:
Synthesis report. Contribution of working groups I, II and III to the fourth assessment report of the Intergovernmental Panel on Climate Change. Retrieved on 26 October 2010 from http://www.ipcc.ch/publications_and_data/ar4/syr/en/contents.html
McMichael, A. (2004). Climate change. In Ezzati, M., Lopez, A.D., Rodgers, A., &
Murray. C.J.L. (eds.). Comparative quantification of health risks: Global and regional burden of disease due to selected major risk factors, Vol 2. Geneva: World Health Organisation.
Pascual, M., Bouma, M. J., & Dobson, A. P. (2002). Cholera and climate: revisiting
the quantitative evidence. Microbes and Infection, 4, pp. 237– 45. Rahman, A. (2008). Climate change and its impact on health in Bangladesh.
Regional health forum, Vol. 12 (1), pp. 16-26. Retrieved on 25 October 2010 from http://www.searo. who.int/LinkFiles/Regional_Health_Forum_Volume_12_No_1_Climate_change_and_its_impact.pdf

IMPACT OF CLIMATE CHANGE ON HEALTH AND NUTRITION
228
SEAMEO
Chapter VI
UNICEF (United Nations Children’s Fund). (2007). Climate change and children. New
York: UNICEF. Retrieved on 11 February 2010 from http://www.unicef.org/ publications/files/Climate_Change_and_Children.pdf
UNICEF (United Nations Children’s Fund). (2008). Climate change and children: A
human security challenge. A Policy Review Paper. Retrieved on 26 October 2009 from http://www.unicef .irc.org/ publications/pdf/ climate_change.pdf.
WHO, 2003. Climate change and human health-risks and responses, A Summary.
Retrieved on October 25, 2010 from http://www.who.int/globalchange/summary/en/print.html
WHO-SEARO, (2008). How is climate change affecting our health? A manual for
teachers. Retrieved on 18 November 2009 from http://www.searo.who.int/LinkFiles/World_Health_Day_2008_TeacherManual.pdf.
WHO-SEARO (World Health Organisation- South East Asia Region). (n.d.). Training
course for public health professionals on protecting our health from climate change. Retrieved on 18 September 2009 from http://www.searo.who.int/en/ Section260/ Section2468_14932.htm
Yoko, A., Goodman, D., & Parker, D. (2009). Global climate change and child health:
A review of pathways impacts and measures to improve the evidence base. Florence, Italy: UNICEF Innocenti Research Centre. Retrieved on 11 February 2010 from http:// www.unicef.at/fileadmin/ medien/pdf/Climatechange_Childhealth.pdf

IMPACT OF CLIMATE CHANGE ON HEALTH AND NUTRITION
229
SEAMEO
Chapter VI
Lesson 1
CONTAMINATED WATER AND WATERBORNE DISEASES
GRADE LEVEL: High School
SUBJECT: Biology
TOPIC: Diarrhoea as a Digestive Disorder
PREREQUISITE
• Students should have prior knowledge about the parts and functions of the digestive system and how the digestive system works.
DURATION: 2 sessions
LEARNING OBJECTIVES
Subject Matter Objective: By the end of this lesson, students should be able to:
• explain how waterborne diseases (e.g., cholera) can affect the human digestive system.
Climate Change Objectives
• discuss how diarrhoea becomes virulent as influenced by climate change such as high temperature and flooding;
• explain how humans become vulnerable to infectious disease when there is drastic change in the environment such as temperature and climate; and undernourishment;
• analyse how climate change affects the spread of waterborne diseases like diarrhoea through the environment; and
• cite different measures to prevent the spread of waterborne diseases.
MAIN CONCEPTS AND SKILLS
• Three critical factors must be present for a disease and/ or disorder to occur namely, pathogen (e.g., virus, bacteria, protozoa, fungi); vulnerable host (e.g., human); and environment (e.g., climate change). Humans are vulnerable to disease due to improper/insufficient nutrition; contaminated water due to flooding; virulent strain of the pathogen; and unfavourable environmental factors (e.g., climate change such as high temperature and flooding) that enhance the growth and propagation of pathogens which may be detrimental to the host (human).
• Due to climate change, warmer temperatures and increased precipitation will raise the risk of flooding. Floods cause sewage and drinking water to mix and if contaminated water is ingested; the risk of contracting waterborne diseases

IMPACT OF CLIMATE CHANGE ON HEALTH AND NUTRITION
230
SEAMEO
Chapter VI
(e.g., cholera) is more likely. The lack of sanitation will even make the problem worse.
• An infected person or animal may pass pathogens through waste into the water supply. Some microorganisms (e.g., bacteria) are indigenous to water environments and are naturally occurring in some bodies of water. These cannot be seen, smelled, or tasted. Hence, contaminated water often appears fresh and clear.
• Waterborne diseases like diarrhoea occurs because more fluid passes through the large intestine (colon) than the organ can absorb. Rapid transit of stool is one of the most common causes of diarrhoea. For stool to have normal consistency, it must remain in the large intestine for a certain amount of time. Stool that leaves the large intestine too quickly is watery due to waterborne disease.
• Alternative energy production, carbon sequestration, water reuse, and recycling are some of the mitigation and adaptation options that could have the greatest implications for human health. Increased hydroelectric power generation will have significant impact on local ecologies where dams are built, often resulting in increased or decreased incidence of waterborne disease. Shifting to wind and solar power will reduce demand on surface waters and therefore, limit impacts on local water ecosystems and potentially reduce risks of waterborne diseases.
• Adaptation strategies such as protecting wetlands to reduce damage from severe storms have beneficial impact on water quality and on the ecology of waterborne infectious disease. Also, for any novel mitigation technology, thorough health and environmental impact assessments are necessary prior to its implementation and widespread adoption.
MATERIALS NEEDED
• Recent picture of flooding incident in the area.
• Pictures taken from magazines, newspapers and the internet showing ill-effects of flooding on human health
• Newspaper clips or videos emphasising climate change effects on human health
• Recent data/statistics on burden of waterborne diseases with emphasis on diarrhoeal diseases
• Visual aid on “Disease Triad Concept”
• Art materials to be used in developing the comic strip.

IMPACT OF CLIMATE CHANGE ON HEALTH AND NUTRITION
231
SEAMEO
Chapter VI
PRESENTATION OF LESSON
Scenario
The teacher will present any recent pictures of a flooding incident in the community and then ask the class to mention the effects of this incident in the community. Take note of the different responses provided by the students and highlight those that are related to health issues particularly on waterborne diseases.
Guide Questions:
1. What struck you most in these pictures?
2. What are the possible effects of flooding in our community?
3. What do you think will happen if flooding incidents will occur more often in our place?
4. What are the possible health problems due to frequent flooding?
Student Activities
1. The student will develop a comic strip about the causes of diarrhoea as a waterborne disease and its effects in the digestive system.
2. Make a research on why severe flooding in Pakistan had caused the mass death of children from July to August 2010 (i.e. due to cholera, dehydration and malnutrition).
Process Guide for Teachers
1. Conduct a short review on how the digestive system works. Use a digestive system poster.
2. Present a short lecture about waterborne diseases and some related digestive disorder like diarrhoea.
3. Divide the class into groups. Distribute the information materials about climate change and waterborne diseases and the art materials. If the classroom has access to computer with internet connection, provide a list of websites pertaining to climate change and its effect to human health particularly on waterborne diseases.
4. Present a scoring rubric for the comic strip (Attachment 6.1.1) and group presentation rubric (Attachment 6.1.2) before the activity starts to guide the students on how they will perform their project/activity properly.
5. Conduct a comic strip presentation.
6. Process student’s learning experiences in doing their research project. Solicit insights about the impact of climate change on human health particularly the spread of diarrhoea as a waterborne disease.

IMPACT OF CLIMATE CHANGE ON HEALTH AND NUTRITION
232
SEAMEO
Chapter VI
Guide questions
1. How does diarrhoea become virulent as a result of climate change?
2. Why do people become vulnerable to infectious disease when there is a drastic change in the environment (e.g., temperature, climate) and undernourishment?
3. How do waterborne diseases like diarrhoea affect the welfare of the community particularly those living in depressed areas?
4. What measures can we do to mitigate the effects of climate change on our health condition?
Discussion Points
Floods contaminate shallow groundwater and stream waters, which in some areas are the main source of drinking water. During drought periods, sea water advances inland, which leads to contamination of groundwater resources. The risk of deaths and illnesses due to climate change (attributable to diarrhoea and malnutrition) in some parts of Southeast Asia is already the largest in the world and this would remain to up to 2030 (McMichael 2004).
Flooding and rising sea levels could result in poor water quality leading to more water-related infectious diseases such as gastrointestinal diseases. Examples of gastrointestinal epidemic diseases that could be transmitted by poor sanitation and contaminated water supplies are amoebiasis, cholera, giardia, shigellosis, and typhoid fever.
Pascual, Bourna, and Dobson (2002) found that phytoplankton blooms are excellent habitats of infectious bacterial diseases such as cholera. These phytoplankton blooms are projected to benefit from warmer sea surface temperatures along the coastlines of Southeast Asian countries.
Achieving the Objectives
Objective This is achieved by Explain how waterborne diseases like cholera affect the human digestive system
Developing comic strip about waterborne diseases and digestive system.
Discuss how diarrhoea becomes virulent as influenced by climate change such as high temperature and flooding
Group presentation of comic strip in class.

IMPACT OF CLIMATE CHANGE ON HEALTH AND NUTRITION
233
SEAMEO
Chapter VI
Objective This is achieved by Explain how humans become vulnerable to infectious disease when there is a drastic change in the environment such as temperature, climate, and undernourishment
Presentation of research findings on Pakistan flooding
Students’ interaction while working in groups and during the class presentation.
Analyse how climate change affects the spread of waterborne diseases like diarrhoea through the environment
Class discussion about their learning experiences and insights.
Cite different measures to prevent the spread of waterborne diseases
Class discussion on mitigating the effects of climate change.
Assessment
• Performance assessment: This will be conducted during the performance of the assigned activity. The teacher will utilise a performance rubric.
• Formative assessment: In a clean sheet of paper, the students will answer the following questions.
1. How is diarrhoea affecting the human digestive system?
2. Explain how climate change contributes to the spread of waterborne diseases?
3. List at least two ways to mitigate the effects of climate change on waterborne diseases which could endanger human health.
Closure
1. To provide a brief summary of the lesson, the teacher will present the following schematic diagram which describes the effects of climate change on human health.

IMPACT OF CLIMATE CHANGE ON HEALTH AND NUTRITION
234
SEAMEO
Chapter VI
Source: Climate Change and Human Health - Risks and Responses (WHO, 2002)
Increases in water temperature, precipitation frequency and severity, evaporation-transpiration rates, and changes in coastal ecosystem health could increase the incidence of water contamination with harmful pathogens and chemicals, resulting in increased human exposure. Hence, mitigation studies and measures should focus on understanding where changes in water flow will occur, how water will interact with sewage in surface and underground water supplies as well as drinking water distribution systems, what food sources may become contaminated, and how to better predict and prevent human exposure to waterborne and ocean-related pathogens and biotoxins.
2. To integrate the lesson in real life, ask the students to reflect on the following guide questions:
What is the importance of maintaining proper sanitation in our school, at home and in the community?
In our own way, how can we help mitigate the effects of climate change on water-borne diseases that could severely affect human health?
Schematic diagram pathways by which climate change affects health
Climate change • Gradual change
o Global warming o Change in rainfalls
• Extreme events o Storms and floods
Affected factors • Contamination of water and
foods by bacteria • Increase in number and
activation of mosquitoes • Expansion of infected areas
Project effects • Increase in water-borne
diseases • Increase and expansion of
vector-borne diseases

IMPACT OF CLIMATE CHANGE ON HEALTH AND NUTRITION
235
SEAMEO
Chapter VI
RESOURCES Cavinta, L., et al. (2010).Climate change and health and nutrition. SEAMEO
TROPMED and SEAMOLEC.
Health- cares.net. (2005). What causes diarrhoea? Retrieved on 30 October 2010 from http://digestive-disorders.health-cares.net/diarrhoea-causes.php
Johnson, M. D. (2009). Human biology: Concepts and current issues. Benjamin Cummings; 5th edition.
McMichael, A. (2004). Climate change. Comparative Quantification of Health Risks: Global and Regional Burden of Disease Due to Selected Major Risk Factors Volume 2. M. Ezzati, A. Lopez, A. Rodgers and C. Murray, Eds. World Health Organisation, Geneva.
Pascual, M., Bourna, M.J., and Dobson, A.P. (2002). Cholera and climate: revisiting
the quantitative evidence. Microbes Infect, 4, 237-245. Portier C.J, Thigpen T.K., Carter S.R., Dilworth C.H., Grambsch, A.E., Gohlke ,J.,
Hess J., Howard S.N., Luber, G., Lutz ,J.T, Maslak T, Prudent N, Radtke M, Rosenthal JP, Rowles T, Sandifer, P.A., Scheraga, J., Schramm, P.J, Strickman, D., Trtanj, J.M., Whung, P.Y. (2010). A Human Health Perspective On Climate Change: A Report Outlining the Research Needs on the Human Health Effects of Climate Change. Research Triangle Park. NC:Environmental Health Perspectives/National Institute of Environmental Health Sciences. doi:10.1289/ehp.1002272. Available: www.niehs.nih.gov/climatereport
The University of Arizona . (2009) . Waterborne diseases. Retrieved on 30 October 2010 from http://pulse.pharmacy.arizona.edu/10th_grade/disease_epidemics/science/waterborne_diseases.html
WHO (2002). Climate change and human health- Risks and responses.

IMPACT OF CLIMATE CHANGE ON HEALTH AND NUTRITION
236
SEAMEO
Chapter VI
Attachment 6.1.1 Sample Comic Strip Rubric
Criteria
4
Exemplary
3
Proficient
2
Needs Improvement
1
Incomplete
Content of the Story
A full story of the causes of waterborne diseases and how it affects the human digestive system is given. All topics are addressed.
A full story of the causes of waterborne diseases and how it affects the human digestive system is given. Not all topics are addressed.
Two or more topics were not addressed. The story is not complete.
Story has little or nothing to do with the main topic. All the topics are not addressed.
Captions
Captions are related to the scenes, and the connections are easy to understand.
Captions are related to the scenes, and most connections are easy to understand.
Captions are related to the scenes, but the connections are less obvious.
Captions do not relate well to the scenes. There seems to be no connection or connections are very general.
Character
The main characters are clearly identified, and their actions and dialogue are well-suited for the story.
The main characters are clearly identified, and their actions and dialogue suit the story.
The main characters are identified, but actions and dialogue are too general to show their relationship to the story.
It is hard to tell who the main characters are.
Scenery
Scenes are directly related to the story and enhance the reader’s understanding of the topic.
Scenes are directly related to the story.
Scenes are generally related to the story.
Scenes seem randomly chosen and sometimes distract the reader.

IMPACT OF CLIMATE CHANGE ON HEALTH AND NUTRITION
237
SEAMEO
Chapter VI
Attachment 6.1.2 Sample Rubric for Group Presentation
Criteria
4 Exceeds Standard
3 Meets
Standard
2 Progressing to
Standard
1 Below
Standard Opening Opening
captivates the audience with interest and/or intrigue.
Interesting opening; engages audience.
Opening is minimally engaging.
Opening is not engaging.
Focus
Purpose of presentation is clear. Supporting ideas maintain exceptional focus on the topic
Topic of the presentation is clear. Content consistently supports the purpose.
Presentation lacks clear direction.
No clear focus.
Organisation
Information/ ideas are presented in a consistently logical sequence. Transitions and connections are eloquent. A strong sense of wholeness is conveyed.
Important ideas and information are identified for the audience. Information/ ideas are presented in a logical sequence with few lapses. Transitions and connections are made. Closing effectively summarises the presentation.
Irrelevant, unnecessary information detracts. Big ideas are not specifically identified. There are significant lapses in the order of ideas. Transitions are inconsistent and weak or missing. Closing demonstrates an attempt to summarise.
No clear organisation. Ideas do not connect with one another. There are no clear transitions. No closing is evident.

IMPACT OF CLIMATE CHANGE ON HEALTH AND NUTRITION
238
SEAMEO
Chapter VI
Lesson 2
LET’S FIGHT DENGUE!
GRADE LEVEL: High School
SUBJECT: Biology
TOPIC: Dengue Hemorrhagic Fever: How it affects the Circulatory System?
PREREQUISITES
• Students should have prior knowledge on blood circulatory system, water cycles, and insects.
• Search for locally produced short film or video documentary in your country about climate change and vector-borne diseases prior to the lesson proper.
DURATION: 2 sessions
LEARNING OBJECTIVES
Subject Matter Objectives: By the end of this lesson, students should be able to:
• identify which part of the circulatory system is affected by dengue; and
• explain how dengue hemorrhagic fever affects the human circulatory system.
Climate Change Objectives
• discuss how dengue vectors become active as influenced by climate change such as high temperature and more rains;
• analyse how humans become vulnerable to infectious diseases when there is a drastic change of environment such as temperature and climate; and undernourishment; and
• identify different measures to prevent the spread of vector-borne diseases.
MAIN CONCEPTS AND SKILLS • Dengue fever is caused by a type of arthropod-borne virus (arbovirus). The
virus is carried by a mosquito named "Aedes aegypti" which transmits the virus to humans through its bite. The virus travels in the blood stream and then starts multiplying itself in the whole body. Aedes aegypti works as a vector for transmitting the disease. Disease risk may increase as a result of climate change due to related expansions in vector ranges, shortening of pathogen incubation periods, and disruption and relocation of large human populations.

IMPACT OF CLIMATE CHANGE ON HEALTH AND NUTRITION
239
SEAMEO
Chapter VI
• The dengue virus' main effect is on the platelet production. Normally the
platelets in our body last for about 4 days and the body replenishes them when required. This virus destroys the body’s capacity to produce new platelets. A fall in platelet count prevents the formation of clots and may lead to hemorrhage which results into both internal and external bleeding.
• Climate change mitigation strategies focused on alternative energy sources such as nuclear power may influence local ecologies by increasing water demands, temperature, and currents.
This, in turn, might alter the life cycles of
certain mosquitoes. Increased reliance on hydroelectric power, which typically requires construction of dams, also may change local vector-borne disease ecologies and alter transmission cycles.
• Mitigation activities focused on preservation of forests and wetlands are likely to reduce the incidence of these vector-borne diseases. For instance, changes to wetlands may affect mosquito burden in certain areas by altering the breeding area size and the incidence of malaria, dengue, or other mosquito-borne diseases.
MATERIALS NEEDED
• Video presentation of a locally produced short film or video documentary in your country about climate change and vector-borne diseases.
• Visual Aid on Disease Triad Concept
• Information materials about dengue hemorrhagic fever.
• If the classroom has access to computer with internet connection, provide a list of websites pertaining to climate change and vector-borne diseases such as dengue.
• Writing materials and instruments
• Art materials for poster making
PRESENTATION OF LESSON
Scenario
The teacher will present a short film or a video documentary about climate change and the spread of vector-borne diseases particularly dengue. After viewing, the teacher will ask the students to share their personal experiences or stories about dengue and how it affects human health.
Student Activities
1. Construct a graphic organiser about the different parts and function of the human blood.

IMPACT OF CLIMATE CHANGE ON HEALTH AND NUTRITION
240
SEAMEO
Chapter VI
2. Conduct a walk tour of the school campus to investigate possible breeding ground of mosquitoes carrying the dengue virus. They will conduct a clean-up drive around the school campus for dengue prevention.
3. Develop an information poster about the effects of the dengue virus to the human circulatory system.
Process Guide for Teachers
1. Assign the students into their respective working groups.
2. Provide each group the Information Sheet about the parts and functions of blood.
3. Instruct the group to create a graphic organiser about the parts and function of blood. Utilise computer with Internet connection, if available.
4. Determine how much time is needed to develop the graphic organiser. When all the groups are ready, tell them to post their work in a designated area. Allow them to spend some minutes for gallery viewing.
5. Discuss with the students the importance of maintaining a healthy circulatory system. Ask them about the possible external threats to a healthy circulatory system. Based on their responses, lead the discussion on vector-borne diseases such as dengue.
6. Conduct a short lecture about vector-borne diseases. Discuss how climate change contributes to the worsening cases of vector-borne diseases especially dengue in Southeast Asia.
7. Allow students to return to their respective groups and ask them to develop a plan for a walk tour and clean-up drive around the school campus. They will conduct an area survey of possible breeding ground of mosquitoes and a clean-up drive around the campus.
8. Reconvene the class to discuss the students’ learning experiences and insights.
Achieving the Objectives
Objective This is achieved by Discuss how dengue vectors become active as influenced by climate change such as high temperature and more rains.
Film show or video presentation and analysis.
Analyse how humans become vulnerable to infectious diseases when there is a drastic change of environment such as temperature and climate; and undernourishment
Class discussion after the short lecture on vector-borne diseases.

IMPACT OF CLIMATE CHANGE ON HEALTH AND NUTRITION
241
SEAMEO
Chapter VI
Objective This is achieved by Identify which part of the circulatory system is affected by dengue
Interaction among students during gallery viewing of graphic organisers about the parts and functions of the blood.
Explain how dengue hemorrhagic fever affects the human circulatory system.
Students’ interaction while working in groups.
Cite different measures to prevent the spread of vector-borne diseases.
Walk tour around the school campus to investigate possible breeding ground of mosquitoes and conducting a clean-up drive.
Developing information posters about the effects of dengue and mitigating climate change impact on human health.
Assessment • Conduct a performance based assessment for the following activities:
Developing a graphic organiser
Planning a walk tour within the school campus
Developing an information poster
• Formative assessment: Identification of terms
______1. It is the protein in the blood the carries oxygen.
______2. It is the component of blood that fights diseases that enters the blood stream.
______3. When blood is exposed to air, this blood component become sticky and form internal and external “scabs” to catch the blood cells and plasma, thereby stopping bleeding.
______4. It serves as the main transportation component in the body since it is the liquid part of the blood.
______5. It is the component of the blood that is adversely affected by the dengue virus.

IMPACT OF CLIMATE CHANGE ON HEALTH AND NUTRITION
242
SEAMEO
Chapter VI
Closure Activity
1. Ask the students to develop an Information Poster about the effects of the dengue virus to the human circulatory system.
Firming-up Questions:
• How does dengue virus affect the human circulatory system?
• In our own way, how can we help in mitigating the effects of climate change on vector-borne diseases that can cause danger to human health?
2. Provide the students some practical tips to fight dengue. The acronym "DENGUE” would help them easily remember the steps to monitor the disease. (Source: http://www.abs-cbnnews.com)
D- daily monitoring of patient's status
E- encourage intake of oral fluids
N- note for any warnings or signals (persistent vomiting, severe abdominal pain, restlessness, irritability, platelet count, bloated abdomen)
G- give paracetamol to bring down fever (avoid aspirin)
U- use bed/mosquito screens, insect sprays, repellant
E- early consultation is advised if you have doubts
Homework/Assignment
• Ask students to conduct an action research on how unpredicted rainfall creates more favourable environment to the vectors and to determine its impact on human health. (Note: install a rain gauge to monitor rainfall in the school grounds).
RESOURCES
Cavinta, L., et al. (2010).Climate change and health and nutrition. SEAMEO TROPMED and SEAMOLEC.
Howard, C.J. (2010, 01 September). DOH urges public to step up dengue monitoring. Abs-cbn news.com. Retrieved on 30 November 2010 from http://w ww.abs-cbnnews.com/-depth/08/30/10/doh-urges-public-step-dengue- onitoring
Johnson, M. D. (2009). Human biology: Concepts and current issues. Benjamin
Cummings; 5th edition. Lesson Plans Inc. (2010). Human body lesson plans. Retrieved on 30 October 2010
from http://www.lessonplansinc.com/biology_lesson_plans_human_body _systems.php

IMPACT OF CLIMATE CHANGE ON HEALTH AND NUTRITION
243
SEAMEO
Chapter VI
Portier C.J, Thigpen T.K., Carter S.R., Dilworth C.H., Grambsch, A.E., Gohlke ,J.,
Hess J., Howard S.N., Luber, G., Lutz ,J.T, Maslak T, Prudent N, Radtke M, Rosenthal JP, Rowles T, Sandifer, P.A., Scheraga, J., Schramm, P.J, Strickman, D., Trtanj, J.M., Whung, P.Y. (2010). A Human Health Perspective On Climate Change: A Report Outlining the Research Needs on the Human Health Effects of Climate Change. Research Triangle Park. NC:Environmental Health Perspectives/National Institute of Environmental Health Sciences. doi:10.1289/ehp.1002272. Available: www.niehs.nih.gov/climatereport

IMPACT OF CLIMATE CHANGE ON HEALTH AND NUTRITION
244
SEAMEO
Chapter VI
Lesson 3
UNDERSTANDING FILARIASIS
GRADE LEVEL: High School
SUBJECT: Biology
TOPIC: Phylum Nematoda (Filarial Parasitic Worm)
PREREQUISITE
• Students should have prior knowledge on the classification of organisms and organ system.
• Before the conduct of this session, the teacher must prepare information sheets about phylum Nematoda and filaria for distribution to students.
DURATION: 2 sessions
LEARNING OBJECTIVES
Subject Matter Objectives: By the end of this lesson, the students should be able to: • discuss the characteristics of nematodes; • explain the life cycle of nematodes particularly the filarial parasites; and • explain the effects of filarial parasites to the human organ system.
Climate Change Objectives • analyse how nematode vectors become active as influenced by climate
change such as high temperature and flooding; • analyse how humans become vulnerable to infectious diseases when there
is a drastic change of environment such as temperature and climate; and undernourishment; and
• identify different measures to prevent the spread of the filariasis disease.
MAIN CONCEPTS AND SKILLS
• Nematodes (filarial parasitic worm) are the most speciose phylum after the arthropods. A handful of soil can contain up to thousands of microscopic worms which range from 0.3 mm to 8 meters in size. They have digestive, nervous, excretory, and reproductive systems but do not have a respiratory system.
• Nematodes are the most abundant multi-cellular animal on earth. They live in a vast variety of habitats except in dry places. They can be divided into free living forms and parasitic forms. Free living forms have a simple life cycle involving four (4) juvenile instars (developmental stages) on the path from egg to adult.
• Parasitic worms are parasitic to insects, plants, and animals. They have developed a wide range of variations i.e., whether there is a secondary host,

IMPACT OF CLIMATE CHANGE ON HEALTH AND NUTRITION
245
SEAMEO
Chapter VI
the amount of time spent in one or either hosts and the way that they move from one host species to another. Thus, many species lay eggs that pass out of the primary host with the faeces where they are eaten by the secondary host which gets eaten in turn by the primary host after the nematodes have developed. Because it is not totally reliable that the secondary host will be eaten just as the nematode larvae have developed into the infective stage (penetrates human skin & causes infection) many species have the ability to encyst (enclose) themselves in the muscle/cuticle of their secondary hosts.
• The life cycle of filarial worms start with an infected fly or mosquito - it bites a human and deposits larvae of the filarial worm into the feeding site. The larvae reach adulthood, mate, and the females produce offspring. The young worms, called microfilariae, reside in the bloodstream during peak times for human-biting insect activity. At this stage, they may be consumed when a mosquito or fly lands and feeds. The cycle continues as the insect lands on a new human host and transmits the larvae. It may be several months and often years before an individual exhibits symptoms of having been infected with filarial worm larvae.
• There are eight known species of filarial worms that infect humans which is divided into three categories: worms that invade tissue and skin, those that reside in the lymphatic system and those that thrive in areas around the stomach, lungs, and heart.
• Transmission of vector-borne diseases can be reduced by avoiding mosquito bites in endemic areas through personal protective measures like repellents, use of bed nets and insecticides. Mosquito vectors often breed in stagnating polluted water bodies, such as blocked drains and sewers. Aside from drug administration, good sanitation and rigorous hygiene practices are essential to reduce mosquito breeding places.
MATERIALS NEEDED
• Visual Aid on Disease Triad Concept
• Pictures of the effects of filarial worm in human health (e.g., elephantiasis)
• Information materials about phylum Nematoda and filariasis.
• If the classroom has access to computer with Internet connection, provide a list of websites pertaining to climate change and vector-borne diseases like Filariasis.
• Writing materials and instruments
• Drawing materials

IMPACT OF CLIMATE CHANGE ON HEALTH AND NUTRITION
246
SEAMEO
Chapter VI
PRESENTATION OF LESSON
Scenario
• Show pictures of filariasis cases in human beings to students and ask them about the possible causes of this disease.
• Show pictures of how vectors and pathogens move in flooded water and how the nematode vectors migrate from unsuitable habitat and increase its population because the natural enemies of the nematode vectors are gone.
Guide Questions:
1. How can human beings contract the filariasis disease?
2. What do you think are the possible causes of filariasis?
3. What are the environmental problems which may lead to the spread of filariasis?
Student Activities
• Students will create a poster showing the characteristics of nematodes and their life cycle. The students will differentiate different kinds of nematodes.
• Students will develop a concept map showing how the nematode vectors move over flooded water or migrate due to unsuitable habitat wherein they spread the disease in the process.
• They will develop an information brochure about filariasis.
Process Guide for Teachers
1. Conduct a short review about the concept and classification of organisms.
2. Present a short lecture about phylum Nematoda.
3. Divide the class into working groups, and then pass out the prepared information sheets about phylum Nematoda and filaria (as shown in the main concepts)
4. Instruct the students to develop a poster depicting the characteristics of organisms under phylum Nematoda.
5. Each group will present their poster for critiquing. If there is time constraint, the class may opt to conduct a gallery viewing of all posters inside the classroom. Facilitate the class discussion on nematodes using the guide questions below:
What are the characteristics of nematodes?
How do they survive?
How do nematodes affect human beings like us?

IMPACT OF CLIMATE CHANGE ON HEALTH AND NUTRITION
247
SEAMEO
Chapter VI
6. Ask students to draw a concept map showing how the vectors move over flooded water or migrate due to unsuitable habitat wherein they spread the disease in the process.
7. Present and discuss the filariasis poster to the class as shown in the sample below. Ask the students to identify various types of nematodes
Figure 1 Filariasis Poster Source: http://commons.wikimedia.org/wiki/File:Filariasis_01.png
8. Discuss the relationship between climate change and filariasis. Ask the students this question: “What stage within the life cycle of nematodes is affected by climate change?”
9. Advise the students to return to their respective working groups and instruct them to develop a brochure about filariasis and climate change.

IMPACT OF CLIMATE CHANGE ON HEALTH AND NUTRITION
248
SEAMEO
Chapter VI
Achieving the Objectives
Objective This is achieved by
Discuss the characteristics of nematodes.
Explain the life cycle of nematodes
Group interaction during the development of poster.
Exchanging ideas during the Gallery viewing of posters.
Explain the effects of nematode parasite to the human organ system
Class discussion and short lecture.
Analyse how the nematodes become active as influenced by climate change such as high temperature and flooding;
Presentation of concept map on vector transmission as a result of climate change
Presentation of posters on filariasis and students’ interaction.
Analyse how humans become vulnerable to infectious diseases when there is a drastic change of environment such as temperature and climate, and undernourishment.
Sharing of learning experiences and insights on the effects of climate change to infectious diseases.
Cite different measures to prevent the spread of filariasis disease.
Developing a brochure to describe the effects of climate change in the spread of filariasis and the mitigation measures.
Assessment
A. Using rubrics, (Attachment 6.3.1 & 6.3.2) conduct performance-based assessment among students for the following activities:
Developing a poster and group presentation. Developing a concept map on vector transmission/migration. Developing a brochure about filariasis.
B. Conduct formative assessment through Multiple Choice:
1. Which of the following are NOT characteristic of nematodes?
a. unicellular c. free living form and parasitic b. no circulatory system d. unsegmented
2. Nematodes feeds on
a. bacteria c. other nematodes
b. fungi d. all of them

IMPACT OF CLIMATE CHANGE ON HEALTH AND NUTRITION
249
SEAMEO
Chapter VI
3. Filariasis is a
a. vector-borne disease c. air-borne disease
b. water-borne disease d. communicable disease
4. Which of the following transmits the filarial larvae to a human host?
a. rodents c. worms
b. mosquitoes d. snail
5. Nematode-parasites can live only in human and animal hosts?
Give your reasons.
Closure Activity
Draw out the students’ overall learning insights on phylum Nematoda in relation to climate change using the following guide questions:
1. What is the importance of phylum Nematoda in understanding, treating and preventing parasitic diseases like filariasis?
2. In our own way, how can we help in mitigating the effects of climate change on filarial parasitic diseases which could threaten human health?
RESOURCES
Altec-The University of Kansas. (2003). Making a poster- poster rubric. Retrieved on 30 October 2010 from http://www.teacherweb.com/ME/JALeonardMiddleSchoolOldTown/Ecologywebquest/page3.htm
Cavinta, L., et al. (2010).Climate change and health and nutrition. SEAMEO TROPMED and SEAMOLEC.
Filariasis. Retrieved on 30 October 2010 from http://www.sciencedaily.com/images/2007/09/070920145417-large.jpg
Johnson, M. D. (2009). Human biology: Concepts and current issues. Benjamin Cummings; 5th edition.
Lesson Plans Inc. (2010). Human body lesson plans. Retrieved on 30 October 2010 from http://www.lessonplansinc.com/biology_lesson_plans_human_body _systems.php
Make worksheets.com. (2010). Brochure rubric sample. Retrieved on 30 October 2010 from http://www.makeworksheets.com/samples/rubrics/brochure.html
Ramel, G. (n.d.) Phylum nematoda. Retrieved on 30 October 2010 from
http://www.earthlife.net/inverts/nematoda.html

IMPACT OF CLIMATE CHANGE ON HEALTH AND NUTRITION
250
SEAMEO
Chapter VI
Attachment 6.3.1
Sample Brochure Rubric Group Name_________________________________________________________
CRITERIA 4 3 2 1 VALUE
Display All parts are not clearly labeled.
Some parts are clearly labeled.
Many parts are clearly labeled.
All parts are clearly-labeled.
10
Mechanics and Spelling
There are many mistakes in mechanics and/or spelling.
There are several mistakes in mechanics and/or spelling.
There are minor mistakes in mechanics and/or spelling that do not detract from the presentation
There are no mistakes in mechanics/or spelling.
30
Presentation The brochure is presented as difficult for the audience to hear and little or no eye contact is made.
The brochure is presented with a choppy voice, and an attempt is made to make eye contact.
The brochure is presented with a fluent voice, and occasional eye contact.
The brochure is presented with an expressive and fluent voice and good eye contact.
25
Layout Layout is confusing. Components are inconsistent and information is missing.
Layout is somewhat organised. Most of the components are not consistent. Partial information can be located.
Layout is organised. Most components are consistent within the publication. Information can be located.
Layout is well organised. There is consistency in its components that allows the reader to easily locate information.
35
TOTAL 100
Source: http://www.makeworksheets.com/samples/rubrics/brochure.html)

IMPACT OF CLIMATE CHANGE ON HEALTH AND NUTRITION
251
SEAMEO
Chapter VI
Attachment 6.3.2 Sample Poster Rubric
Group Name:_________________________________________________
Category 4 3 2 1 ValueRequired Elements
The poster includes all required elements as well as additional information.
All required elements are included on the poster.
All but 1 of the required elements are included on the poster.
Several required elements were missing.
10
Labels All items of importance on the poster are clearly labelled that can be read from at least 1 m away.
Almost all items of importance on the poster are clearly labelled that can be read from at least 1 m away.
Many items of importance on the poster are clearly labelled that can be read from at least 1 m away.
Labels are too small to view OR no important items were labelled.
30
Relevance of Graphics
All graphics are related to the topic and easier to understand. All borrowed graphics have a source citation.
All graphics are related to the topic and most are easy to understand. Some borrowed graphics have a source citation.
All graphics relate to the topic. One or two borrowed graphics have a source citation.
Graphics do not relate to the topic OR several borrowed graphics do not have a source citation.
25
Attractive-ness
The poster is exceptionally attractive in terms of design, layout, and neatness.
The poster is attractive in terms of design, layout and neatness
The poster is acceptably attractive though it may be a bit messy.
The poster is distractingly messy or very poorly designed. It is not attractive. 35
Grammar There are no grammatical/ mechanical mistakes on the poster.
There are 1-2 grammatical/ mechanical mistakes on the poster.
There are 3-4 grammatical/ mechanical mistakes on the poster.
There are more than 4 grammatical/ mechanical mistakes on the poster.
Total 100 Source: http://www.teacherweb.com/ME/JALeonardMiddleSchoolOldTown/Ecologywebquest/page3.htm,2003-07-28

CHAPTER VII:
Impact of Climate
Change on POVERTY
[SEAMEO SPAFA]

IMPACT OF CLIMATE CHANGE ON POVERTY
253
SEAMEO
Chapter VIl
Introduction
In Southeast Asia, poverty incidence remains high. As of 2005, about 93 million or
18.8% of Southeast Asians lived below the USD1.25-a-day poverty line and 221 million
(44.6%) below the USD2-a-day-poverty line. For this large group of people, poverty
means lack of access to food, housing, education, health care and basic human rights.
So it is not just about economics. Whether we talk about USD1.25 or USD2 per day, it is
important to ask if this is enough for survival or not. Overall, being poor means a poor
state of well-being.
Poverty is also relative. “In wealthy societies, the concept of poverty is relative. People
feel poor because many of the good things they see advertised on television are beyond
their budget, but they do have a television (TV). In the United States, 97% of those
classified by the Census Bureau as poor own a coloured TV. Three quarters of them
own cars, have air-conditioning, a VCD or DVD player. All have access to healthcare”
(Singer, 2009).
What is Poverty?
Extreme or absolute poverty indicates deprivation
that kills and this affects 1.4 billion people around
the world. This means that nearly 30,000 people
die every day, that is, one death every 3 seconds.
However, one does not have to die to be poor. How can one person be poor? The most
commonly used way to measure poverty is based on standard of living and incomes. A
person whose income level falls below the poverty line or some minimum level
necessary to meet basic needs is considered poor. What is necessary to satisfy basic
needs varies across time and societies. Therefore, poverty lines vary in time and place,
and each country uses lines which are appropriate to its level of development, societal
norms and values (The World Bank, n.d.).
Absolute Poverty means not having enough income to meet the most basic human needs for adequate food, water, shelter, clothing, sanitation, health care, and education (The World Bank, n.d.)

IMPACT OF CLIMATE CHANGE ON POVERTY
254
SEAMEO
Chapter VIl
NONGKRAAN’S STORY…
Nongkraan teaches in a two-room preschool on the corner of Bangkok‟s major
garbage dump. The students are mostly children of garbage pickers and factory
workers. Nongkraan says she took in about 20 new students last year who migrated
with parents from northern areas where farming had become too costly and who
came to Bangkok looking for factory jobs.
At the end of the day, she sends a container of milk home with each child. She fears
it may be the only thing a few of them will consume that evening. Lately, some
students have not been coming to class because they don‟t have the 10 baht
(USD0.36) daily school fee. Nongkraan also thinks not having 5 baht for an ice
cream from the trolley that rolls to a stop in front of the bright blue preschool around
2:00 pm might be keeping some students away. Not being able to buy what others
can, makes them “feel different, unequal,” she says. And if they don‟t come to
preschool, she worries they will go out into Bangkok‟s streets to pick-up garbage.
Also, if they miss preschool, they will find it more difficult to succeed in primary
school classes.
The Story of Teacher Nongkraan provides a clear picture of what poverty is:
What is the Relationship between Climate Change and Poverty? Climate Change affects everyone everywhere. Two of the most urgent crises facing the
world, climate change and extreme poverty do offer an example of
interconnectedness. By understanding how the two crises and the people they affect are
connected, we can begin to understand how and what actions we need to take to deal
with these crises.
Climate change and poverty are connected in many ways. For example, as temperature
changes, the frequency and intensity of severe-weather events around the world, also
increases. The poor countries which often lack infrastructural needs like storm walls and
water-storage facilities will divert resources (e.g., people and money) away from fighting
poverty in order to respond to immediate disasters.
Warmer climates will also increase the spread of diseases like malaria and make it more
difficult for poor countries to respond adequately. Perhaps most severely, changed
rain patterns will increase the prevalence of droughts and floods leaving populations
without food or enough food. The links between these issues are shown in Figure 7.1.

IMPACT OF CLIMATE CHANGE ON POVERTY
255
SEAMEO
Chapter VIl
Severe Weather Outcomes Impact on Poverty
Figure 7.1 The Impact of Climate Change on Poverty
Just as climate change will contribute to make poverty worse, poverty is also contributing
to climate change. Most poor people around the world lack access to reliable energy
sources and through necessity are forced to mainly use oil, coal and wood. These
significantly increase the world‟s greenhouse emissions. These greenhouse gases
(GHGs) are the natural and industrial gases that trap heat from the earth and warm the
surface. Experts believe that the steady rise in global average temperatures in recent
decades, known as global warming, is one aspect of climate change.
In fighting poverty, we can at the same time address climate change issues because the
two are linked. For example, less dependence on oil, coal and wood will help reduce
GHGs. Biofuel, which is a fuel derived from renewable, biological sources, including
crops such as maize and sugar cane, and some forms of waste can be used instead.
This will reduce GHG emissions while helping to reduce poverty because it provides a
reliable renewable energy option. Bio-fuel energy production from coconut shells in the
Philippines is a good example that provides cost effective access to an energy source
that reduces GHG emissions.
More Frequent
and intense
floods
Rising sea levels
More frequent
and intense
storms/cyclones
/typhoons
More frequent
and intense
droughts
Less land to use
Loss of coastlines
Loss of delta areas
which are major
sources of food
production
Spread of disease
Increase in migration
(population
movement)
Increase in poverty
because there will be:
Less food & less safe
water
Less land for living &
agriculture
Loss of livelihoods
Decline in health
Diversion of
resources (e.g.,
people and money)
away from fighting
poverty to respond to
disasters

IMPACT OF CLIMATE CHANGE ON POVERTY
256
SEAMEO
Chapter VIl
The link between climate change and poverty effectively shows that the solutions to
address both of them can be the same. The story below depicts that the struggles
against poverty and climate change are inseparable and inextricably linked (Kumi,
2009).
AN UNUSUAL STORY
In November 2009, Kumi Naidoo, a life-long human rights activist,
became the International Executive Director of Greenpeace.
In South Africa he was involved with the liberation struggle against
white supremacy rule until 1987 when he had to flee the country.
He returned after the release of Nelson Mandela. In 2003, he was one
of the founders of the “Make Poverty History” campaign.
He explains why becoming head of Greenpeace is not such a strange
or unusual move to make:
I see a need to bring together the poverty movement and the
environmental movement as we face up to the greatest challenge of
our time - Climate Change
Climate change is real and happening now.
It already accounts for over 300,000 deaths throughout the world each
year, according to the Global Humanitarian Forum.
Whilst some may wonder what a „poverty activist‟ is doing, moving to
an environmental organisation, I do not view my role at Greenpeace
as an abrupt detour. I believe the struggles against poverty and
climate change are inextricably linked, while the solutions are the
same.
Climate Change and Poverty in Southeast Asia
Southeast Asia is widely considered one of the world‟s most vulnerable areas to climate
change. By vulnerable we mean being less able to anticipate or predict, cope with,
resist, and recover from, a climate change induced impact.
Southeast Asia is home to 563 million people. The population is rising almost two
percent annually, compared with the global average of 1.4%. It has long coastlines with
high concentrations of population and economic activities in coastal areas. Indeed, about
80% of the population lives within 100 kilometers (km) off the coast - leading to an over-
concentration of economic activity and livelihoods in coastal mega cities. There is heavy
reliance on agriculture for providing livelihoods especially those at/or below the poverty
lines and a high dependence on natural resources and forestry in many of its countries.

IMPACT OF CLIMATE CHANGE ON POVERTY
257
SEAMEO
Chapter VIl
Climate change is already affecting Southeast Asia and impacting many sectors. It has
affected the quantity and quality of water resources. Extreme weather events such as
droughts, flooding, and tropical cyclones are increasing in frequency and intensity, and
have contributed to a decline in the production of grains and industrial crops, fish supply,
and forest harvests.
The region is struggling against the loss of its arable lands
and coastal areas due to a rise in sea levels, more
frequent storm surges, heightened coastal erosion, and
soil salinisation. A significant proportion of the population
has been affected by the outbreak of malaria and dengue.
All these impacts are predicted to worsen due to increased
warming, changes in precipitation patterns, and sea level
rise.
It is the poor who are affected most by climate change and many of the region‟s poor live
in coastal areas and in the low-lying deltas. Most often, these are smallholder farmers,
fishermen, and poor households that are most vulnerable to risk of climate change as
their marginal income provides little or no access at all to health services or other safety
nets to protect them against the threats posed by changing conditions.
We can see that for Southeast Asia, climate change and poverty are linked by the issue
of vulnerability. Geographically, climate change impacts on the region because of its
long coastlines and dependence on agriculture amongst other factors; and with the high
incidence of poverty of the people living in these areas working as farmers or fishermen,
they are made more vulnerable to the impacts of climate change. Moreover, it becomes
more difficult for people to escape what is known as the „poverty trap‟ when they are
caught up in the „poverty cycle‟.
Soil Salinisation – where
by the soil becomes
highly concentrated in
salt and thus unusable
for crops.

IMPACT OF CLIMATE CHANGE ON POVERTY
258
SEAMEO
Chapter VIl
The Poverty Cycle
The poverty cycle can be described as a continuing situation whereby poor families
become trapped in poverty for generations. The limited access to essential resources,
such as education, means that the family‟s children will remain poor because they are
unable to improve their skills and thus lose the opportunity to make a better life.
Figure 7.2 The Stages of Poverty Cycle
The simplistic diagram (Figure 7.2) above illustrates the „cyclical‟ effect of the poverty
trap. This is an inter-generational cycle showing parental poverty that leads to the
childhood poverty of their offspring and so on. In this example, lack of education is
shown as the driver in continuing the cycle. But other factors such as lack of access to
clean water and enough food that in turn can lead to malnutrition and disease could also
be a cycle. In fact, there are many cycles that are happening at the same time and
indeed overlap and contribute to each other.
People living in poverty often show incredible courage and work long hours day after day
on inadequate diets. As a result, some suffer indignity and a loss of self-worth. Feelings
of inadequacy and failure can cause severe psychological damage. So when we talk of
the poverty cycle, in fact, there are many cycles and it is important to note that they are
not all based on economics. We must also consider how people feel and value
themselves and their ability to provide for their families and contribute to their
communities. When they feel a sense of helplessness, they are less able to help
themselves. This is a very real feeling as people living in poverty are marginalised and

IMPACT OF CLIMATE CHANGE ON POVERTY
259
SEAMEO
Chapter VIl
more often than not are not listened to. Their ability to express their needs through local
government channels is limited.
A Summary on Continuing Poverty
Many things contribute to make poverty worse and climate change is one factor among
many others. It is difficult to lift oneself out of poverty because its causes and effects are
also interlinked. For example:
People living in poverty do not have enough food to eat. Without a good diet,
people suffer malnutrition and are weak.
When people are weak they are more likely to become sick.
Sick people do not have the energy to work well or to seek help.
People living in poverty are also unable to afford medical care and so their poor
health will continue to worsen. This is because they are already living in poor
quality housing that more than likely lacks adequate access to safe clean water,
disposal of sewerage, electricity supply. What little savings a family has may be
spent, and as a result they are more at risk if there is a disaster.
People living in poverty are primarily found in remote rural areas or in slums on
the outskirts of big cities. This contributes to continuing poverty because the
people are isolated and not so easy to reach for help re: basic social services.
The people have limited access to basic services to enable them to help
themselves. For instance, lack of transportation service makes movement of
people and goods difficult, lack of jobs where they are living results in little or no
income, lack of medical services, lack of education opportunities.
The areas where people are living in poverty, especially the rural and coastal
areas, are more at risk from severe weather conditions as a result of climate
change. The resources to deal with possible disasters like flooding or drought are
lacking and the impacts of such disasters (e.g., loss of arable land, destroyed
crops etc.,) make an already bad situation much worse as people have to try and
survive with even less than they had before.
Because of all these factors, people living in poverty are described as being
vulnerable or the most easily and immediately affected group of people that will
suffer the most from the impacts of climate change. Their vulnerability and isolation
lead to a sense of powerlessness or helplessness i.e., they feel as if everything is
beyond their control and that they are indeed trapped or unable to improve their

IMPACT OF CLIMATE CHANGE ON POVERTY
260
SEAMEO
Chapter VIl
circumstances and living conditions as described in the following quote from a
woman farmer:
“Every day I feel as if there is a water buffalo standing in front of me. The
future feels dark and hopeless and I have no alternative, I just have to keep
going day in day out”.
Climate Change, Poverty, and Women
The poor are the most affected by
climate change and as many as 70
per cent of these poor people are
women. This means that the worst
impacts of climate change will affect
poor women and children the most.
Not only will climate change affect
women the most because there are
more poor women than poor men
but as the quote from WHO shows,
women are also most vulnerable
because of gender issues.
Gender refers to the socially
constructed norms, roles and
relations that a given society
considers appropriate for men and women. Gender determines what is expected,
permitted and valued in a woman or a man in a determined context (World Health
Organisation, n.d.).
Therefore, the role of women - as generally assigned by society as a whole, shapes
what is expected of them and how they should behave.
A report from the United Nations Population Fund (UNFPA, 2009) affirms that:
Women are indeed among the most vulnerable to climate change, partly
because in many countries they make up a larger share of the agricultural
workforce and they tend to have lesser access to income-earning
opportunities than men.
“Women and men‟s vulnerability to the impact of extreme climate events is determined by differences in their social roles and responsibilities. Among women, an expectation that they fulfill their roles and responsibilities as carers of their families often places extra burdens on them during extreme climate events. For men, their expected role as the economic provider of the family often places extra burdens on them in the aftermath of such events. As women constitute the largest percentage of the world‟s poorest people, they are most affected by these changes. Children and youth – especially girls – and elderly women, are often the most vulnerable” (World Health Organisation).

IMPACT OF CLIMATE CHANGE ON POVERTY
261
SEAMEO
Chapter VIl
Women manage households and care for family members, which often limits
their mobility and increases their vulnerability to sudden weather-related
natural disasters.
Drought and erratic rainfall force women to work harder to secure food, water
and energy for their homes.
Girls drop out of school to help their mothers with these tasks.
The report refers to this as a “cycle of deprivation, poverty and inequality”
which undermines the social capital needed to deal effectively with climate
change.
In addition, women also:
Have less access to resources and services.
Have less liberty of migration.
Suffer low visibility, especially in any decision-making
We can conclude from this information that women suffer disproportionately as a
consequence of climate change and that we must address gender issues in climate
change adaptation and mitigation strategies if they are to be successful.
We need women to participate if the efforts made to combat climate change are to be
effective and sustainable and so women‟s knowledge, priorities and strategies have to
be integrated in climate change adaptation, mitigation and disaster management. This
will enable them to fully contribute to all three areas as well as build resilience to climate
change.
Climate Adaptation refers to the ability to adjust to climate change to
moderate/limit potential damage, to take advantage of opportunities, or
to cope with the consequences.
Climate Mitigation is any action taken to permanently eliminate or
reduce the long-term risk and hazards of climate change to human life
and property (e.g., reduce carbon emissions)
Disaster Management means having a plan to deal with and minimise
the impact of natural disasters e.g., flooding, drought, tsunami. The
purpose of the plan is to coordinate the actions of the government, local
leaders and the people to:
a. prepare in advance;
b. know what to do during a disaster;
c. manage the situation after a disaster.

IMPACT OF CLIMATE CHANGE ON POVERTY
262
SEAMEO
Chapter VIl
Build Resilience means to strengthen or to make less vulnerable.
In most Southeast Asian countries, efforts in this area are taking place. For example, in
addressing the issue of climate change, the Indonesian government has been
conducting gender mainstreaming strategies in relation to the environment, disaster
relief, and social conflict supported by running gender-responsive programs. Women‟s
and environmental NGOs in Indonesia have also been working together in facilitating
women to manage local resources in their regions by providing technical assistance.
Breaking the Poverty Cycle
There are three dimensions of poverty that can be summed up as lack of income, lack
of access, and lack of power. Understanding what the consequences of these three
“Lacks”, helps identify where interventions must be made to break the cycle of poverty.
Table 7.1 shows what the lack of income, access, and power, results in.
Lack of Income Limited and inadequate availability of food, land, housing
Lack of Access Limited or no access to education, health, safe water, credit
Lack of Power Limited or no participation in decision-making, loss of dignity and
respect
Table 7.1 Outcomes Resulting from Lack of Income, Access, and Power
Intervention in the areas of food, housing, education, basic health, agricultural inputs,
safe water, transport and communications, and credit, are clearly seen as necessary.
But there are other issues, namely gender inequality, that need to be addressed within
all three areas of income, access, and power.
Changing unequal gender relations to increase ownership and control of property and
women‟s effective participation in community management is cited as a key strategy by
the International Fund for Agricultural Development (IFAD, n.d.) to help reduce and
break the cycle of poverty. However, strategies will have to vary according to the
differences in the degree of dependency on agriculture. The International Labour
Organisation (ILO, n.d.) estimates that the percentage of women workers in agriculture
in Malaysia is 15%, whereas in Thailand and Indonesia it is between 50-60%.
According to the World Bank (n.d.), "the region accounts for approximately half of the
world‟s poor", the possibilities for intervention and action are numerous. Southeast Asia
also has one of the highest illiteracy rates in the world, and so, reducing illiteracy would
be a strategy to help lift people out of poverty as literate people have more opportunities
to improve their lives.

IMPACT OF CLIMATE CHANGE ON POVERTY
263
SEAMEO
Chapter VIl
There are many ways in which interventions have been made on poverty alleviation and
as a result families have successfully risen above the poverty level. Some examples
include:
1. Education of girls and boys
Where girls have completed their education alongside boys there have been
dramatic improvements in health and well being of communities. Girls marry
later, have smaller families and this means that there is more food to go around
and there are resources to treat diseases. Educated girls also provide good role
models for the next generation as they encourage their children to study hard
and attend school regularly.
2. Availability of micro credit loans
A small loan enables the poor to take an initiative e.g., buying an extra chicken
and selling surplus eggs in markets and reinvesting profits. This leads to greater
access to basic needs such as food. Provided that the interest rates are small,
loans may be paid back easily.
3. Literacy and numeracy education of adults (especially women) linked to business
This strategy is especially effective if literacy and numeracy classes are linked to
real world activities such as:
formation of small local cooperatives to share smallest surpluses;
basic accounting and management of small loans.
4. Access to medicine and medical care
Many common infections can be treated with the right
medicines, as long as they are available. This can save lives,
keep people working productively and strengthen the local
economy. Thousands of cataract operations have been
performed at little or no cost to the poor in Southeast Asia and
this has meant that family members become independent and
productive again.
Cataract is
a film which
grows over
the eye lens
and causes
blindness.

IMPACT OF CLIMATE CHANGE ON POVERTY
264
SEAMEO
Chapter VIl
Our Future
It is often said that children are our future and their welfare is a major key to breaking the
poverty cycle, as noted by Emmons (2009):
“When children begin and end their day without proper nutrition, or
miss vital vaccinations, or are taken out of school to work, or cannot
afford the books and pencils or even the ride to school, their long-term
potential, as well as their country’s economic and social development,
suffers.”
Climate change induced disasters force people further into poverty and poverty forces
people to exploit the environment even further. For example, illegal logging causes the
loss of forest, its animals and birds and increased soil erosion. This inseparable and
inextricable link between climate change and poverty means that the measures needed
to combat both are thus the same.
Addressing the issues of poverty and climate change is urgent and concerns all of us.
The lesson plans that follow are designed for you, the teacher, to raise awareness in
your classroom about climate change, poverty and environment-friendly ways of living.
Educated on these issues, the youth of Southeast Asia can make a valuable contribution
now and in the future. By advocating environment-friendly projects, they will be more
informed and able to make a significant difference to make our world clean and green
once again.
REFERENCES Emmons, K. (2009, April). Economic crisis hits Asia‟s children hard. Development Asia:
Can Asia unite to weather the storm?, No.3, pp. 4-42. IFAD (International Fund for Agricultural Development). (n.d.). International Day for the
eradication of poverty. Retrieved on 21 October 2010 from http://www.ifad.org/ ILO (International Labour Organisation). (n.d.). Retrieved on 21 October 2010 from
http://www.ilo.org Kumi, N. (2009, 16 November). Climate: A question of justice. BBC News. Retrieved on
19 October 2010 from http://news.bbc.co.uk/2/hi/science/nature/8362831.stm Singer, P. (2009). The life you can save. United Kingdom: Picador. The World Bank. (n.d.). Retrieved on 21 October 2010 from http://www.worldbank.org

IMPACT OF CLIMATE CHANGE ON POVERTY
265
SEAMEO
Chapter VIl
UNFPA (United Nations Population Fund Agency). (2009). State of world population 2009- Facing a changing world: Women, population and climate. New York, USA: UNFPA
WHO (World Health Organisation). (n.d.). What do we mean by “sex” and “gender”.
Retrieved on 19 October 2010 from http://www.who.int/gender/whatisgender/en/index.html

IMPACT OF CLIMATE CHANGE ON POVERTY
266
SEAMEO
Chapter VIl
Lesson 1
A LIFE BEHIND EVERY STATISTIC
GRADE LEVEL: 16 to 17 years of age (Grades 10 to 11)
SUBJECT: Mathematics, Social Science
TOPIC: Data Collection, Organisation and Interpretation
PREREQUISITE
Students should have prior knowledge on graphing by plotting points.
Pre-assigned Activity: Prior to this lesson, students will conduct a survey in
their community to gather basic information on the socio-economic situation
which may include: total population, number of males, number of females,
number of households, average annual income of households, number of
population who are of school age, number of out-of-school youth, working
population (labour force), number of unemployed and underemployed, number of
older people who need care and support, number of people living below poverty
line, etc.
DURATION: 2 to 3 sessions
LEARNING OBJECTIVES
Subject Matter Objectives: By the end of this session, students should be able to:
gather, organise, and present data systematically;
use appropriate graphs in presenting data;
make predictions based on existing data; and,
estimate the ratio of the people living below poverty line to that of the rest.
Climate Change Objectives
define poverty;
describe why climate change will have more impact on poor communities in the
poverty cycle;
identify the different ways in which men, women and children are affected by
extreme weather events and climate change; and,
identify ways to minimise the impact of climate change on the poor.
IMPACT OF CLIMATE CHANGE ON POVERTY
267
SEAMEO
Chapter VIl
MAIN CONCEPTS AND SKILLS
Absolute Poverty means not having enough income to meet the most basic
human needs for adequate food, water, shelter, clothing, sanitation, health care,
and education.
The three dimensions of poverty can be summed up as lack of income, lack of
access, and lack of power. A person whose income level falls below the poverty
line is considered poor.
Climate change and poverty are interconnected. Climate change will increase the
spread of diseases, the prevalence of droughts and floods leaving populations
without enough food, making it more difficult for poor countries to alleviate
poverty in order to respond to immediate disasters.
The poverty cycle is a continuing situation whereby poor families become
trapped in poverty for generations. Family‟s limited access to education means
that school-age children will remain poor because they are unable to improve
their skills and thus lose the opportunity to make a better life.
People living in poverty are the most vulnerable group that will suffer the most
from the impacts of climate change which can lead to a sense of powerlessness
or helplessness as they are trapped in the vicious cycle of poverty.
There are many interventions to break the poverty cycle which includes
education of girls and boys, availability of micro credit loans, literacy and
numeracy education of adults and women linked to business, access to medicine
and medical care.
MATERIALS NEEDED
Strips of paper, pens, envelope
PRESENTATION OF THE LESSON
Scenario
The teacher will show some current data about the population of the country, the
annual gross income of the country, number of people living below poverty line, and
the average annual income of the middle income group. The data can be shown in
graphs and tables.
Then ask the following:
Describe the data by comparing the quantities.
What do you think are its implication to us? What does it show?

IMPACT OF CLIMATE CHANGE ON POVERTY
268
SEAMEO
Chapter VIl
How do you know that this is our current condition in terms of population,
annual income, and number of people living below poverty line?
What do you think can you do to help the government in poverty alleviation?
Student Activities
In this lesson, students may participate in any two or more activities below:
1. Playing the Poverty Statistics Bingo (Motivational)
2. Defining Poverty and Organising Data (Motivational)
3. Relating Poverty Cycle and Climate Change
4. Collecting, Organising, Presenting and Interpreting Data
Process Guide for Teachers
The teacher may choose one or two motivational activities before proceeding to the
Data Organisation and Interpretation activity
Activity 1: Poverty Statistics Bingo
1. To stimulate the students‟ attention, the teacher will ask students to do the
following:
Draw a square about 6 x 6 cm.
Divide the square into 3 equal size columns.
Again, divide the square to have 3 equal size rows.
Color in any 3 of the small squares.
2. Copy all the numbers from the number checklist on to the board as found in
Attachment 7.1.1.
3. Tell the students to select any six of these numbers and to write one number
in each of the blank squares in the grid.
4. Explain that they will hear all these numbers as part of a sentence (Use
data from Attachment 7.1.2 for sample Poverty Statistics Sentences). If they
hear the number that they have included in their grid, instruct them to draw a
cross through that number. Remind the students that a sentence may contain
more than one number, so they must pay attention.
5. Statistics Sentences from Attachment 7.1.2 should be printed/written on a
piece of paper. Cut into strips and fold it. All folded strips must be placed in a

IMPACT OF CLIMATE CHANGE ON POVERTY
269
SEAMEO
Chapter VIl
box or a hat and mix together. Randomly pick one paper containing one
sentence at a time and read it out to the class.
6. Explain that as soon as a student succeeds in crossing out all the numbers
on their card, the student should shout “BINGO!” If this happens, cross check
against the teacher‟s number checklist and ask the student to read the
numbers on his/her card, one by one. If all the numbers have been called
then that student is the winner.
Before closing this motivational activity, tell students, “Poverty statistics
sentences were used in our Bingo Game, what are the significance and
implications of these statistics to poverty? What is poverty, anyway?
Tell the students, that the next activity will give them deeper understanding
of the concept of poverty and the indicators typically used to measure
poverty.
Activity 2: Defining Poverty and Organising Data
1. Divide the class into small groups of between 5 and 6 members.
2. Give each group an envelope containing the Poverty Statistics Sentences
from Attachment 7.1.2 cut up into separate strips.
3. Ask them to sort the Poverty Statistics Sentences into sub-groups
according to the kind of information provided.
4. Ask them to give a heading to each of their sentence sub-groups (e.g. work/
employment, health, education, nutrition, sanitation).
5. Invite students to add other ways of measuring poverty that they think should
be included.
6. Elicit feedback from other groups on the headings chosen.
7. Rank according to what they consider to be the most serious problems in
their own country, city, or community.

IMPACT OF CLIMATE CHANGE ON POVERTY
270
SEAMEO
Chapter VIl
8. Ask students to think about the poorest person they have ever seen and ask
students to write their own definitions of poverty beginning with the words
“Poverty is….”
9. Allow each group to read their definition. Provide comments on their
definitions with reference to the levels of poverty as described in this Chapter
and briefly highlight the difference between “basic needs” and “wants”.
Activity 3: Poverty Cycle and Climate Change
1. Draw a chicken and next to it an egg on the board.
2. Pose the question “Which came first the chicken or the egg?”
3. Elicit some responses – try to get students to think laterally.
4. Assuming it is an actual chicken egg, draw a circle on the board or in a
poster/flipchart. Point out that the discussion will go round and round. Explain
that it is one example of circular cause and consequence and that for people
living in poverty, this cycle can also be seen.
5. Below are samples of poverty cycle data sets, which can be cut into individual
cards. Distribute the poverty cycle cards to each of the groups. You may wish
to change the group membership from the previous activity. Ask them to
place the individual cards in the cycle.
low income
no funds for school low education
lack of qualifications
low paid work no money for education
low income
poor diet sickness
perform badly in
school
low qualifications low paid work

IMPACT OF CLIMATE CHANGE ON POVERTY
271
SEAMEO
Chapter VIl
6. Make a table as shown below and ask students to respond to each of the
following questions:
WHERE WHO WHAT
In which region(s) of
the country is there a
high incidence of
poverty?
Who are some of the
poorest people in
this/these regions?
(occupations could
serve as a prompt )
Identify examples of
climate change
phenomena.
7. Ask the groups to imagine how specific climate change phenomena might affect
the poor farmers and fishermen and to illustrate this in a poverty cycle diagram.
8. Display the poverty cycles identified by each group on the walls of the classroom
for gallery viewing and elicit comments from the group.
9. Summarise the main message and collective insights generated from the activity
by saying that: “The impact of climate change will be an added burden for the
poor - the most vulnerable group which can lead to a sense of powerlessness or
helplessness as they are trapped in the vicious cycle of poverty.
Activity 4: Collecting, Organising, Presenting and Interpreting Data
1. Ask the students to work in small groups. Then, introduce the next activity to the
students by saying that:
“Now that you have fully grasped the definition of poverty and its relationship
to climate change, we will use these concepts as a context for data collection,
organisation and interpretation.
Prior to this lesson, I requested you to conduct a survey in your
community to gather basic information on the socio-economic situation
which may include:
total population, number of males, number of females, number of
households, average annual income of households, number of population
who are of school age, number of out-of-school youth, working population
(labour force), number of unemployed and underemployed, number of
older people who need care and support, number of people living below
poverty line, etc.” (This assignment is to be given in advance).
IMPACT OF CLIMATE CHANGE ON POVERTY
272
SEAMEO
Chapter VIl
2. Ask the students to present the results of their community survey which include
an organised data using graphs and tables.
3. Students will interpret the data collected and predict what would happen in the
socio-economic life of the people in the community if the trend will continue in the
absence of any intervention.
4. Discuss how to organise a systematic data and how to use available data to
make predictions and identify the appropriate interventions.
Closure
Plan of action for the students: Based on the information you have collected (i.e.,
from community survey) and shared, each group will think of three (3) things that
each of the following key stakeholders must do to alleviate poverty:
Government
International or Regional Organisations, like SEAMEO
Non-Government Organisations
Individuals (e.g., students)
Achieving the Objectives
Objective This is achieved by
Gather, organise, and present
data systematically
Class discussion on Poverty Statistics
Sentences sorted into sub-groups according
to the kind of information provided and
ranking the most serious problems in a
community.
Use appropriate graphs in
presenting data
Class discussion on the results of community
survey which include an organised data using
graphs and tables.
Make predictions based on
existing data
Class interaction on the interpretation of data
collected and predictions on what would
happen in the socio-economic life over time.
Estimate the ratio of the people
living below poverty line to that of
the rest
Class discussion on where, who and what to
identify the regions with a high incidence of
poverty and the poorest people in the region.
Define poverty Students writing the definition and levels of
poverty and highlighting the difference
between “basic needs” and “wants”.
Describe why climate change will
have more impact on poor
Illustrating the diagram on poverty cycle and
making a conclusion that “Climate change

IMPACT OF CLIMATE CHANGE ON POVERTY
273
SEAMEO
Chapter VIl
Objective This is achieved by
communities in terms of the
poverty cycle
effects will be an added burden for the poor.”
Identify the different ways in which
men, women and children are
affected by extreme weather
events and climate change
Group brainstorming and discussion on
climate change phenomena
Identify ways to minimise the
impact of climate change on the
poor
Writing an essay on how students can help
break the vicious cycle of poverty which is
linked to climate change.
Assessment
Using their own words, students will write their answers on the following questions.
How do I define poverty?
What problems do poor people encounter in their daily lives?
What is meant by poverty cycle?
How does climate change add to these problems?
How does your knowledge on data collection, organisation, and
interpretation help you understand the vicious cycle of poverty?
What kind of interventions are needed and by whom?
How can we break the vicious poverty cycle?
To assess team performance, the teacher may adopt the sample rubric (See
Attachment 7.2.1) or design a new performance rubric in terms of the following
criteria: planning, data gathering, brainstorming, data organisation and analysis,
output presentation, level of knowledge, creativity and integration of subject matter
concepts to real life.
RESOURCES
Save the Children UK Teachers‟ Resources: Saving Lives Bingo.
SEAMEO SPAFA (2010). Climate Change and its Impact to Poverty. Integrating
Climate Change Issues in Southeast Asian Schools, A Teachers‟ Guidebook.
SEAMEO.
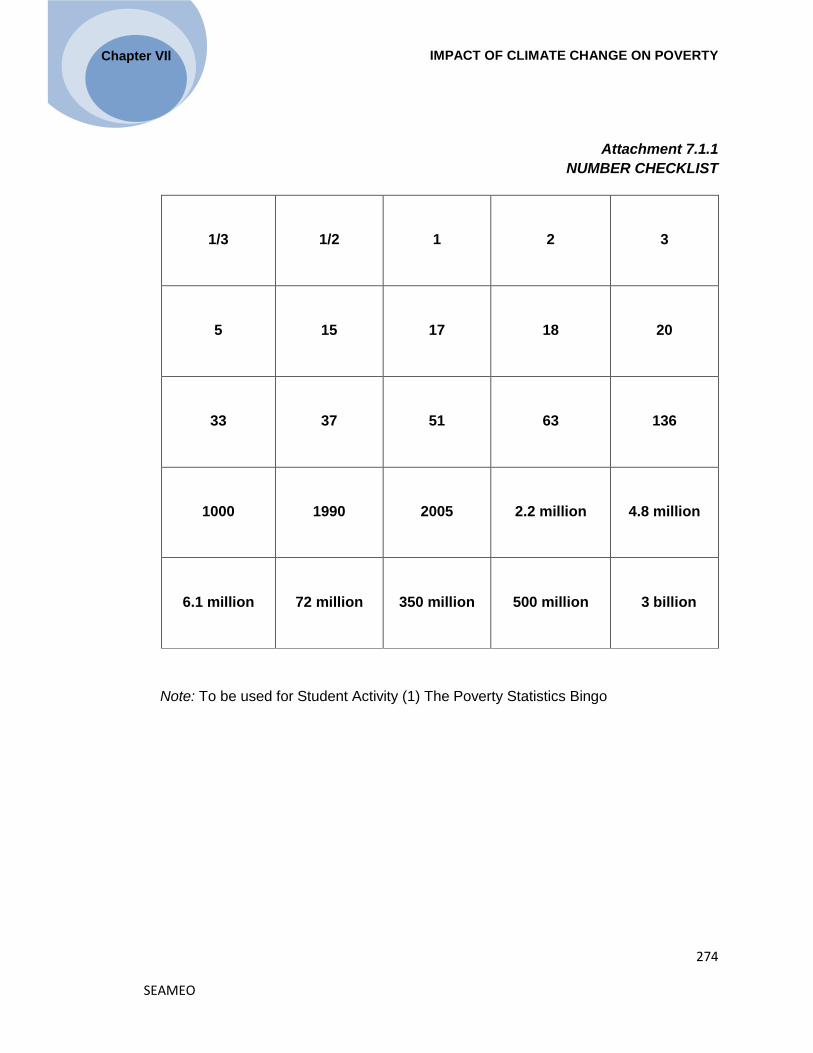
IMPACT OF CLIMATE CHANGE ON POVERTY
274
SEAMEO
Chapter VIl
Attachment 7.1.1
NUMBER CHECKLIST
1/3
1/2
1
2
3
5
15
17
18
20
33
37
51
63
136
1000
1990
2005
2.2 million
4.8 million
6.1 million
72 million
350 million
500 million
3 billion
Note: To be used for Student Activity (1) The Poverty Statistics Bingo

IMPACT OF CLIMATE CHANGE ON POVERTY
275
SEAMEO
Chapter VIl
Attachment 7.1.2
SAMPLE POVERTY STATISTICS SENTENCES
In 2005, about 72 million children of primary school age in the developing world
did not attend school.
About 33% of children in the developing world are without adequate shelter.
About 20% of children in the developing world do not have access to safe water.
About 15% of children in the developing world have no access to health services.
An estimated 2.2 million children die each year because they are not
immunised.
Every year, there are between 350 million and 500 million new cases of
malaria.
Half the world or nearly 3 billion people live on less than USD 2 a day.
In 2005, over 30% of people living in cities were living in slum conditions.
There are still an estimated 6% of children living in Thailand who do not receive
an education.
It has been estimated that 6.1 million Thais live below the national poverty line.
An estimated 18% of Indonesians are officially poor.
According to statistics, 17% of Vietnamese children are malnourished.
The Philippines has the third highest rate of inequality between rich and poor in
the Asia Pacific.
Around 4.8 million Cambodians live on less than USD 1 per day.
In Laos, only 37% of children are educated beyond grade 5 in school.
In Timor Leste, 136 out of 1000 children die before the age of 5.
Between 1990 and 2005, the percentage of people living in urban areas in
Malaysia rose from 51% to 63%.
Note: To be use for Student Activity (2) Defining Poverty and Organising Data

IMPACT OF CLIMATE CHANGE ON POVERTY
276
SEAMEO
Chapter VIl
Lesson 2
LIFE STORIES
GRADE LEVEL: Fourth Year High School (Grades 10 to 11)
SUBJECT: English
TOPIC: Narratives
DURATION: 1 session
LEARNING OBJECTIVES
Subject Matter Objectives: By the end of this lesson, students should be able to:
describe what information they can see about a character in a picture;
formulate questions about things they cannot see from a picture;
write a short story about a picture being shown; and,
create different media to heighten awareness on climate change and poverty.
Climate Change Objectives
describe the effects of climate change on poor people;
describe the feelings behind a story (i.e., show empathy with poor people who
are often at the mercy of external events)
identify particular problems faced by men, women and children; and,
identify the issues linking climate change and poverty.
MAIN CONCEPTS AND SKILLS
Extreme weather events such as typhoons (cyclones), floods, drought, etc. will
have significant short and/or long term effects on people, the environment,
livelihoods, as well as national development. It affects everyone on the planet in
some way but will be an added burden for the poor.
Women are the most vulnerable to climate change because they make up a
larger share of the agricultural workforce and they have lesser power and access
to income-earning opportunities than men.
Women‟s knowledge, priorities and strategies have to be integrated in climate
change adaptation, mitigation and disaster management. This will enable them to
fully contribute as well as build resilience to climate change.

IMPACT OF CLIMATE CHANGE ON POVERTY
277
SEAMEO
Chapter VIl
To mitigate the impact of climate change requires action-intervention at all levels
in the areas of food, housing, education, basic health, agricultural inputs, safe
water, transport and communications, and credit. Other issues such as gender
inequality need to be addressed to improve the quality of life of poor people in
terms of income, access, and power.
PRESENTATION OF THE LESSON
Scenario: Who is it?
1. As a motivational and opening activity, the teacher will find or draw a suitable
picture for the main character of the story. Show to the class the picture of a
famous character in a story, a stage play, or a movie. In here, students will
describe what information they can see about a character in a picture and also
discover things that they cannot see from a picture.
2. Lead the discussion by asking students to answer the following questions:
Who is it? (Note: Obviously they don‟t know)
What do you know about him/her?
What is it that you don‟t know, but would like to know?
3. Make a list of five questions that the students would ask on the board.
4. Summarise the lesson from this activity by saying,
“Based on this picture, you were able to visualise and describe the
personality of a famous character and raised questions to disclose the
mystery behind the subject or character in the picture. In this lesson, you will
again visualise and use critical thinking in analysing life stories that depict
climate change impact on poverty.”
Student Activities
The students will participate in the main activity which involves Story Telling and
Role Play. Students in groups will describe the effects of climate change on poor
people. They will share their feelings behind a story about poor people who are often
at the mercy of external events (e.g., natural calamities due to global warming). They
will also identify particular common problems faced by men, women and children as
narrated in the given story.
Process Guide for Teachers
Together with the students, review the poverty cycle and read Episode 1 of the
sample story on Climate Change and Poverty for adaptation. Show Figure A to
provide an illustration of the story.

IMPACT OF CLIMATE CHANGE ON POVERTY
278
SEAMEO
Chapter VIl
EPISODE 1
This is Lek. She‟s 15 years old and comes from a village in the North East of
Thailand. For many generations her family has been farmers. Before Lek was born,
her parents had some land where they grew tapioca and rubber. But their land was
taken away for a regional development project. Plantations of imported eucalypts
(drought resistant trees) were planted and paper pulp factories established instead.
Lek‟s parents moved to a new site, on the Mekong Delta, where Lek was born.
Despite being near the river, every year they faced water shortages. Some said
it‟s because of new dams further upstream which blocked the flow of water. Others
said that couldn‟t be true because the water in the dams was used to generate
electricity so it had to be released from the dams to do that. They blamed the lack
of water on global warming and the effects of El Niño which brings a much longer
and hotter dry season and also sudden storms and flash floods.
Last year there was a terrible storm. Most of the rice Lek‟s family had planted
was destroyed so there was nothing to sell at the market. Lek‟s father needed to
borrow money for seed so that they could try for a second harvest in the off season
when the price of rice would be higher.
Figure A

IMPACT OF CLIMATE CHANGE ON POVERTY
279
SEAMEO
Chapter VIl
Activity 1
1. Ask students: Where can the family of Lek borrow money? Draw out the options
and list them on the board.
2. Briefly discuss some of the advantages and disadvantages of each option.
3. Get students to vote for which option they think the family will choose.
EPISODE 2
Lek‟s father went to the local money lender. He bought the seedlings, but
there wasn‟t enough water to keep the young plants alive and the crop died. The
local authorities were afraid the drought would be very long and had decided to
save what they had in the reservoirs so people would have enough for their
personal needs later. With no crop to sell, there was no money to repay the
money lender. Lek‟s father had to sell their small piece of land.
Activity 2
1. Ask students to read Episode 2 of the Story. Show Figure B to illustrate the
scenario.
2. Ask students what happened next. List the possibilities on the board.
3. Tell the students to listen to Episode 2 and confirm which possibilities on the list
are mentioned.
Figure B

IMPACT OF CLIMATE CHANGE ON POVERTY
280
SEAMEO
Chapter VIl
Activity 3
1. Ask the students to identify the links with poverty cycle as discussed in Lesson 1
of this Chapter.
2. Elicit any other factors they think should be added (e.g., power of authorities to
take away land without adequate compensation; and to withhold water flow)
3. Divide the class into groups of between 5 and 6 members.
4. Ask students to read Episode 3 of the Story. You may show Figure C to the
class to symbolise the scenario of migration from the village to the city.
5. Tell students to identify all the characters from Episodes 1 to 3 which may
include the following:
Lek
Lek‟s brother
Lek‟s mother and father
Lek‟s grandmother and grandfather
Other farmers, families in the community
The money lender
The construction site employer
The authorities in charge of dams and water supply
Other labourers
Teachers
EPISODE 3
With no land to farm, Lek‟s father had to leave the village to look for work. Since
other farmers had been affected too, there wasn‟t much work for them in the area.
Eventually, he decided to try his luck in the city. There he sometimes found work on
the big construction sites. At first, Lek‟s mother stayed in the village and tried to make
money by doing laundry, but later she joined her husband so they could earn more
money to take care of the family. Lek and her little brother went to live with their
grandparents in the village, but when the grandparents died they had to join their
parents in the city. Lek got a job as a maid for a rich family. Her brother moved with
her parents from site to site and rarely stayed anywhere long enough to go to school.

IMPACT OF CLIMATE CHANGE ON POVERTY
281
SEAMEO
Chapter VIl
Figure C
6. Tell students that Lek‟s story is to be used as basis for the next activity which
involves a mini TV series and that they will perform as scriptwriters. Half of the
class will focus on a particular female character in the story and half will focus on
a male character. Divide the class by drawing an imaginary line. Divide each half
again into smaller sub-groups. Try to limit the number to 4 groups only.
7. Explain that each group is to produce and act out a 2 to 3 minute scene in which
the particular problems faced by the main character are highlighted. Assign each
group their main character to portray.
8. Allow time for students to think about the problems the main character has and to
decide on the scenario to take on.
9. Set the time limit for writing and rehearsing in fifteen (15) minutes.
10. Allow each group to present their mini TV series.

IMPACT OF CLIMATE CHANGE ON POVERTY
282
SEAMEO
Chapter VIl
Closure: A Public Exhibit: The A-Z of Poverty
1. Write the letters A to Z on the board.
2. Based on the scenes they have acted out and what they know already, ask
students to identify key problems and issues linked to climate change and
poverty, beginning with each of the letters. This doesn‟t have to be done in any
particular order. Elicit an example.
3. If they work in sub-groups this could be set up as a race to see how many ideas
they can generate in a given time. The group with the most ideas wins and starts
the feedback.
4. When they have given their ideas, invite the other groups to add anything they
have for letters where there is no example.
Achieving the Objectives
Objective This is achieved by
Describe what information they
can see about a character in a
picture
Picture observation and interpretation
Formulate questions about things
they cannot see from a picture.
Critical thinking and analysis of a character
in a picture.
Write a short story about a picture
being shown.
Acting as scriptwriters of a mini TV series to
portray the problems faced by each
character in the story of Lek.
Create different media to
heighten awareness on climate
change and poverty.
Working on the assignment to highlight the
different stories of people affected by climate
change in Southeast Asia through:
a. Poster Making
b. Collection of Pictures depicting
Diorama
c. Mime show
d. School Exhibit inviting the community
and other people who should be
informed about Climate Change
Describe the effects of climate
change on poor people.
Story telling on the impact on climate change
to poor farmers.
Describe the feelings behind a
story (i.e., show empathy with
poor people who are often at the
mercy of external events).
Students analysing the story of the family of
Lek and sharing of feelings and reactions
about the plight of poor farming
communities.

IMPACT OF CLIMATE CHANGE ON POVERTY
283
SEAMEO
Chapter VIl
Objective This is achieved by
Identify the issues linking climate
change and poverty.
Group Contest on listing key problems and
issues linked to climate change and poverty,
beginning with letters A to Z.
Identify particular problems faced
by men, women and children.
Essay writing on how the most vulnerable
men, women and children are affected by
climate change.
Assessment
1) After the closure activity, ask the students to write a narrative (an essay or
article) using not more than 150 key words. The essay will focus on the following
questions:
Who is most vulnerable to climate change?
How are men and women, the old and the young affected by climate
change?
2) To assess team performance, the teacher may adopt the sample rubric in this
Chapter (See Attachment 7.2.1) or design a new performance rubric in terms of
the following criteria: planning, data gathering, brainstorming, data organisation
and analysis, output presentation, level of knowledge, creativity and integration of
subject matter concepts to real life.
Assignment
Divide the class into working groups and assign each group to do one of the creative
tasks below that depict different stories of people affected by climate change in
Southeast Asia:
Poster
Collection of Pictures depicting Diorama
Mime show
Organise a Public Exhibit in your school inviting the community and other
people who should be informed about climate change
RESOURCE
SEAMEO SPAFA, (2010). Climate Change and Poverty, Integrating Climate Change
Issues in Southeast Asian Schools, A Teachers‟ Guidebook. SEAMEO

IMPACT OF CLIMATE CHANGE ON POVERTY
284
SEAMEO
Chapter VIl
Attachment 7.2.1
Sample Rubric on Group Performance
Subject/Topic__________________________________________________________
Project/Activity Title____________________________________________________
Date_________________________________________________________________
Group Name__________________________________________________________
Team Members________________________________________________________
Group Process Below Average Satisfactory Excellent
1. Has clear objective of final output 1, 2, 3 4, 5, 6 7, 8, 9
2. Properly organised to complete the task (presence of team work)
1, 2, 3 4, 5, 6 7, 8, 9
3. Managed time wisely 1, 2, 3 4, 5, 6 7, 8, 9
4. Acquired needed information and knowledge base
1, 2, 3 4, 5, 6 7, 8, 9
5. Communicated efforts with teacher 1, 2, 3 4, 5, 6 7, 8, 9
Group Output Below Average Satisfactory Excellent
1. Format of output presentation 1, 2, 3 4, 5, 6 7, 8, 9
2. Manner of communicating the output (i.e., speaking and writing)
1, 2, 3 4, 5, 6 7, 8, 9
3. Data organisation and structure 1, 2, 3 4, 5, 6 7, 8, 9
4. Creativity 1, 2, 3 4, 5, 6 7, 8, 9
5. Knowledge on basic concepts (e.g., lifestyles and consumerism)
1, 2, 3 4, 5, 6 7, 8, 9, 10
6. Awareness on current issues affecting climate change and poverty
1, 2, 3 4, 5, 6 7, 8, 9, 10
7. Ideas and suggestions to combat climate change and poverty
1, 2, 3 4, 5, 6 7, 8, 9, 10
8. Integration of subject matter concepts and values (e.g., consumerism and social responsibility/commitment) to climate change and poverty.
1, 2, 3 4, 5, 6 7, 8, 9

IMPACT OF CLIMATE CHANGE ON POVERTY
285
SEAMEO
Chapter VIl
Lesson 3
TIME FOR ACTION
GRADE LEVEL: Fourth Year High School (Grades 10 to 11)
SUBJECT: Social Studies
TOPIC: Consumerism
DURATION: 2 to 3 sessions
PREREQUISITE: Students should have basic knowledge of the law of supply and
demand; and basic understanding of needs and wants.
LEARNING OBJECTIVES
Subject Matter Objectives: By the end of this session, students should be able to:
define consumerism;
explain the factors influencing consumerism;
identify symbols of prosperity;
choose what they hope for in their own future; and
write an essay about what they want to be in the future.
Climate Change Objectives
identify links between lifestyles, consumption and climate change;
describe their responsibilities as consumers in lessening the negative impacts of climate change; and
develop a plan and commit to support the desired behaviour change.
MAIN CONCEPTS AND SKILLS
Consumerism is a social and economic order that is based on the systematic
creation and fostering of a desire to purchase goods or services in ever greater
amounts.
The factors influencing consumerism includes poverty and backwardness,
population, unemployment, illiteracy, unable to understand technical complexity,
imbalanced distribution of the income and wealth
Climate change induced disasters force people further into poverty and poverty
forces people to the exploit of the environment even further. This inseparable and

IMPACT OF CLIMATE CHANGE ON POVERTY
286
SEAMEO
Chapter VIl
inextricable link between climate change and poverty means that the measures
needed to combat both are thus the same.
The youth of Southeast Asia, educated on these issues, can make a valuable
contribution now and in the future. By raising their environmental awareness,
they will be more open to change, more informed and able to make a significant
difference in saving mother earth.
MATERIALS NEEDED
Sample pictures/images of contrasting economic conditions in different
communities.
PRESENTATION OF THE LESSON
Scenario
The teacher will show two contrasting pictures – one shows an extremely
poor/disadvantaged economic conditions and the other shows a progressive
community. Then ask the following questions:
What do you see in the pictures?
How do the sets of picture differ from each other?
Which pictures show a desirable place to live? Why?
If you were to make a choice which pictures would you like? Why?
Student Activities
Students will perform three main activities. First they will talk about the opposite
of living in poverty and imagine a life in “prosperity”. Then they will interpret a
cartoon on consumerism and reflect on their own lifestyles as consumers that
contribute to climate change. Thirdly, they will commit to change their behaviours
that are not supportive of protecting the environment from the negative effects of
climate change.

IMPACT OF CLIMATE CHANGE ON POVERTY
287
SEAMEO
Chapter VIl
Process Guide for Teachers
Activity 1: “Defining Prosperity”
1. Begin by saying, “What is the opposite of poverty? We focused on poverty in the
previous lessons, but this time we will talk about a more positive image of life
which is “prosperity.”
2. Ask students, “What are the symbols or objects that describe “prosperity?” List
them on the board.
3. Using the symbols written on the board, ask students to write sentences to
describe prosperity e.g., Prosperity is driving your own BMW car.
4. Clarify with students if this is what they hope for their own future.
5. Using the different sentences on prosperity, instruct students to write a 50-word
paragraph on what they want to be in the future and to give their own title.
Activity 2: “Faces of Consumerism”
1. Ask students to carefully observe the cartoon below:
Figure 1: Don't Blame Me, I Don't Have Enough! Source: SEAMEO SPAFA (2010)
2. Lead the discussion with students to analyse the three people in the cartoon by
asking the following questions:
Describe what you see in the picture.
Examine the piles of rubbish and list what‟s there.
Explain why the piles differ in size.
Identify what happens to rubbish in your country/ community
State the problems caused by the different items to our environment/to us.

IMPACT OF CLIMATE CHANGE ON POVERTY
288
SEAMEO
Chapter VIl
Which cartoon do you associate yourself with? Why?
Activity 3: Commitment to Change
1. Write the following quote on the board:
“Each one of us is a cause of global warming, but each one of us
can make choices to change that. The solutions are in our hands
we just have to be determined to make it happen.”
2. Write 3 letter Rs on the board, one below the other, and ask the class what the 3
Rs stand for – Reduce, Reuse, Recyle.
3. Ask the class members to think about: “How does your current lifestyle and
behaviour as a consumer contribute to climate change?” Divide the class
into sub groups and ask each group to focus on one of three topics: food, drinks,
and entertainment or travel. Set a time limit of 10 minutes.
4. Elicit feedback from the groups.
5. From these “confessions”, ask students “If you were to make a commitment to
change the environment by changing one of your “bad” behaviors, which do you
think you should change?”
6. Draw a line on the board. Write “easy” at one end and “hard” at the other. Ask the
groups how easy they think it will be for them to make this change by indicating a
point on the line.
7. Warn them not to underestimate the behaviour change they are committing to.
8. Explain that in the next 20 minutes they need to develop a plan. In that plan,
each group should:
Identify the desired change (e.g., create a zero-waste self-sustaining
school)
Consider what factors, people or events can help and those who could
prevent them from being successful.
Develop a group strategy to overcome the identified obstacles – this
might involve actual ways to prepare you for change or to offer
encouragement or support to each other.
Decide how are you going to measure your achievement and over what
period of time.
9. Monitor the progress of the groups.

IMPACT OF CLIMATE CHANGE ON POVERTY
289
SEAMEO
Chapter VIl
Closure
Explain that it is their job now to put the plan into action. Advise them that
they will be expected to report back to the class on how their project is going
in two weeks and to observe the changes in their lifestyles that support a
cleaner and greener environment in the future.
Achieving the Objectives
Objective This is achieved by
Identify symbols of prosperity. Listing on the board the symbols and
objects of prosperity
Choose what they hope for in their
own future.
Writing sentences to describe prosperity
and clarifying if this is what the students
hope for their own future.
Write an essay about what they
want to be in the future.
Writing a 50-word paragraph on what the
students want to be in the future and to
give their own title.
Identify links between lifestyles,
consumption and climate change.
Students‟ observation and interpretation of
the cartoon on consumerism and lifestyles
and relating its contribution to climate
change negative impact on people and
environment
Describe their responsibilities as consumers in lessening the negative impacts of climate change.
Working in groups, students focus on one
of three areas which they need to change
their lifestyles: food, drinks, entertainment
or travel.
Develop a plan and commit to
support the desired behaviour
change.
Group discussion and individual reflection
on how they will change their lifestyles by
identifying the desired change, helping
factors, strategy, timeframe and how they
will monitor their progress. Also, signing of
commitments.
Assessment
1) Answer the following questions:
What is consumerism?
What are the factors influencing consumerism?
IMPACT OF CLIMATE CHANGE ON POVERTY
290
SEAMEO
Chapter VIl
Cite one factor that influence consumerism and explain its effect on the
economic situation of the family.
2) Ask students to write a commitment statement individually by reflecting on the
following:
How does my behaviour affect climate change?
Do I want to change?
How can I change?
Do I have a plan?
Assignment: Environmental Awareness Begins at Home
Advise the students to encourage and involve their respective families in the
advocacy work to reduce climate change.
1. Share your learning experience in this session with your own families.
2. Write a Family Commitment Statement indicating the desirable behaviours
that your family wants to change. (e.g., to breathe fresher air and live in a
cleaner environment we commit to be actively involved in eco-friendly: clean
and green activities starting within our own homes and beyond.)
3. Ask every member of the family to sign this commitment form.
RESOURCES
SEAMEO SPAFA (2010). Climate Change and Poverty, Integrating Climate Change
Issues in Southeast Asian Schools: A Teachers‟ Guidebook. Lesson Plan on Time
for Action

CHAPTER VIII:
Impact of Climate
Change on CONFLICT
[SEAMEO SPAFA]

IMPACT OF CLIMATE CHANGE ON CONFLICT
292
SEAMEO
Chapter VIII
Introduction
Conflict means disagreement between individuals or groups of people over ideas or
interests. Conflict is a normal part of life. In itself it is neither good nor bad; it is how it is
managed that is important. If it is managed well it may lead to new and/or different ways
of doing things. We need to know the potential causes of conflict so that it may be either
prevented and/or managed effectively.
There are many different sources of conflict. It may be caused by one or more of the
following:
relationships e.g., between family members, cultural groups which may include
distrust, prejudice, personality clashes, abuse, and violence
territory or space, which involves
physical space e.g., land, fishing and/or hunting rights and territories;
cutting down protected forests
psychological space e.g., areas of responsibility, personal space, privacy,
status, personal identity
resources e.g., land, water, money, goods, objects, buildings
principles, values and beliefs e.g., cultural and religious values, beliefs and
rituals; political beliefs, personal and/or family reputation and pride.
There are different scales of conflict. We may have arguments at home, at school or at
the workplace. This is a form of conflict. Larger forms of conflict between groups of
people within a country or between countries may lead to breakdown of negotiations or
could lead to violent conflict such as war.
What is the relationship between climate change and conflict?
The changes in climate that lead to rising sea levels, flooding or droughts might force
people to move (temporarily or permanently) to another safer place where there is
access to shelter (housing), water, and food. These population shifts mean that there are
more people seeking access to or use of the land, water and food to be found in other
places. This can be seen as competition over resources such as land, food, and water.
The relationship between climate change and conflict is complicated and difficult to
clearly determine and explain. This is because when conflict happens there are many
underlying reasons for it. The environmental impacts or results associated with climate
change are never likely to be the only cause of conflict. However, climate change
certainly can contribute to the conditions that make conflict more likely to happen.

IMPACT OF CLIMATE CHANGE ON CONFLICT
293
SEAMEO
Chapter VIII
More severe
floods
Rising sea levels
More frequent
severe weather
storms,
cyclones/typhoons
Higher winds
More severe
droughts
Higher rises in
temperatures
towards the poles
Less land to use
Loss of coastlines, salination of ground water in coastal areas, water logging
Flooding and/or loss of delta areas which are major sources of food production
Loss of trees
Increase in and/or more intense bush/forest fires
Less food, less safe water, less land for living and agriculture
Increase and spread of
disease
Increase in poverty
Decline in health
Loss of livelihoods
Increase in migration
(population shifts)
Increase in social
tension because there
will be more people
trying to use fewer
resources
Competition over
resources could lead
to conflict
Climate change and Southeast Asia Changes in climate will have different impacts all over the world, some positive, some
negative. But some regions are more vulnerable than others. Southeast Asia, as a
geographical area, faces major or severe consequences due to climate change mainly
because a majority of the people lives very near the coastlines and because of its
dependence on agriculture for food production.
Figure 8.1 below illustrates the links between climate change and conflict and why
climate change impacts greatly on Southeast Asia.
Physical Impacts Outcomes Impact on People
Figure 8.1 Links between Climate Change and Conflict
Southeast Asia is home to about 563 million people. About 80% of this population live
within 100 kilometers of the coast, leading to an over-concentration of economic activity
and livelihoods in coastal mega cities. Altogether Southeast Asia has more than 173,251
kilometers of coastline and tens of millions live in rapidly growing coastal cities and delta
areas which are vulnerable to rising seas (ADB, 2009).
It is this combination of rising sea levels, with the majority of the population living near
the coasts, and a dependence on agriculture that makes Southeast Asia one of the
regions in the world to be worst affected by climate change.

IMPACT OF CLIMATE CHANGE ON CONFLICT
294
SEAMEO
Chapter VIII
Rising sea levels can flood farmlands and disrupt and harm fish populations. Severe or
extreme weather events can disrupt and harm agriculture, for instance:
Increased heavy rains lead to soil erosion (loss of soil) and can make land infertile
hence, not good for planting crops;
Increased temperatures can advance grain sterility and disrupt and harm agricultural
processes;
Access to clean water is affected by the shifts in rainfall and salination (to make
salty) of ground water in coastal areas. Together, a shortage of clean water and
increased temperatures may also spread disease.
There is a notion that the effects of climate change will be unevenly felt throughout the
world and that the social and economic impacts on developing countries will be greater
even though a majority of these countries contribute the least to climate change. A report
by the economist, Stern (2007) concludes that developing countries are most vulnerable
to climate change because of the following factors:
● Topical geography
● High population growth
● Dependence on agriculture
● Rapid urbanisation
● Weak infrastructures
● Lack of resources
Therefore, there is a need for:
early warning systems;
disaster management plans and education especially for vulnerable
communities;
strong and organised governance in times of disaster.
This report, along with many other studies, conclude that the effects of climate change
that lead to food and water shortages and poor health will increase poverty and
migration and in doing so could possibly increase the chances of conflict happening.

IMPACT OF CLIMATE CHANGE ON CONFLICT
295
SEAMEO
Chapter VIII
“The interaction between climate change and conflict
started as early as 35,000 years ago!” (ADB, 2009)
History of Climate Change and Conflict
Today some people still argue that there is no link between climate change and
conflict. It is true that climate change alone is not the cause of conflicts, but it is a
contributing factor. History shows us that the effects of climate change in the past
contributed to conflicts and social collapse. Think of the Neanderthals, Vikings, and
Mayans as examples. There are others too. What really happened to the
civilisations on Easter Island and at Angkor in Cambodia? The changing climate has
certainly influenced how, when, and where people live and migrate to. Climate
change is continuous, and over time events such as a rise in temperature by a few
degrees can gradually contribute to the risk of conflict.
It is easier to understand the link between climate change and conflict when we look
at it as a cause and effect situation. However, the reality is much more complicated.
Although we know that we cannot blame conflicts only on climate change, we must
not underestimate the impact of climate change. By analysing climate change, we
can try to avoid conflict by adapting to and mitigating the effects of climate change.
Climate adaptation as an action that helps
cope with the effects of climate change could
be the construction of barriers (e.g., levees)
to protect against rising sea levels, or
conversion to crops capable of surviving high
temperatures and drought or planting
mangroves in coastal areas to protect the
coastline.
Climate mitigation as an action that will
reduce man-made climate change includes
steps to reduce GHG emissions or absorb
GHG in the atmosphere for e.g., reducing the
use of coal oil and gas; reducing deforestation
and illegal logging.
This is important as GHGs are the natural and industrial gases that trap heat from
the Earth and warm the surface. We need to use more sustainable energy sources
like solar, hydro, wind, and geothermal power.
Climate Adaptation refers to the
ability to adjust to climate change
to limit its potential damage, to
take advantage of opportunities,
and to cope with the
consequences.
Climate mitigation is any action
taken to permanently eliminate or
reduce the long-term risk and
hazards of climate change to
human life and property (ADB,
2009)

IMPACT OF CLIMATE CHANGE ON CONFLICT
296
SEAMEO
Chapter VIII
What Should We Do Globally?
A peace building organisation reported that poorer countries are at risk of falling
victim to climate related conflict (Smith & Janani, 2009). Unless there is a change in
approach, 3.9 billion people in 102 countries around the world i.e., more than half
the world's population is at a high risk of political instability as a consequence of
climate change where 2.7 billion people face a high risk of violent conflict as a result
(Smith & Janani, 2009). So what should we do?
1. Think About the Whole Picture
Some measures already taken to mitigate climate change could actually have
increased the risk of conflict such as the push to produce bio-fuels (Smith &
Janani, 2009).
Biofuels are derived from renewable, biological sources, including crops such
as maize and sugar cane, and some forms of waste e.g., manure. Land that
had been used for food production was switched to the production of low
carbon energy sources, and the change has been blamed for contributing to a
30% rise in food prices in 2008. This had caused violence and unrest in
some 30 countries around the world and estimated that bio-fuel production
pushed about 30 million people into poverty.
Therefore, climate change adaptation and mitigation strategies need to take
into account the whole picture i.e., the impact locally and globally in a "conflict
sensitive" manner. Smith & Janani (2009) concluded that there must never be
a repeat of the rapid move to bio-fuels and that:
"Shifts towards a low-carbon economy must be supportive of
development and peace."
The report calls for climate change and development to be integrated, rather
than seen as separate issues. This makes sense and is also the suggestion of
the ADB.
2. Build Awareness and Adaptation and Mitigation Strategies into Development Work.
Raising awareness alone does not change behaviour. Southeast Asia is situated
among the regions with the greatest potential for mitigating CO2 by reducing
deforestation and improving land management practices e.g., discouraging shifting
cultivation and illegal logging (ADB, 2009).

IMPACT OF CLIMATE CHANGE ON CONFLICT
297
SEAMEO
Chapter VIII
So with Southeast Asia having such potential to
mitigate climate change, the future outlook need
not be all „doom and gloom‟.
In fact, Southeast Asia has untapped
opportunities for energy efficiency improvements
and resources for increasing the use of
renewable energy including biomass, solar,
wind, hydro, and geothermal.
Southeast Asian countries need to treat climate
change adaptation as a key part of development
polices, such as adapting agricultural practices
to changes in temperature and precipitation and
adapting water management to greater risk of
floods and droughts (ADB, 2009).
3. Engage Women Actively on Climate Change Plans and Action
It is vital to involve women actively in development and climate change planning
and implementation.
Gender norms, roles and relations are
important factors in determining both
vulnerability and adaptive capacity to the
impacts of climate change.
The role of women as generally assigned by society as a whole shapes what is
expected of them and how they should behave. As an example, in many societies
it is not considered appropriate for young girls to be taught how to swim, but this is
an essential and potentially life-saving skill (WSM, 1986).
Changing unequal gender relations through the greater participation of women is
necessary in any efforts made to combat climate change if they are to be effective
and sustainable. This is especially when we consider that the poor are the most
affected by climate change where as many as 70% are women. This means that
the worst impact of climate change will affect poor women the most. Therefore, it is
only logical that women‟s knowledge, priorities, and strategies have to be
integrated in climate change adaptation, mitigation and disaster management.
Gender refers to the socially
constructed norms, roles and
relations that a given society
considers appropriate for men
and women (ADB, 2009).
Carbon dioxide (CO2) is a
gas in the Earth's
atmosphere. It occurs
naturally and is also a by-
product of human activities
such as burning fossil
fuels. It is the principal
greenhouse gas produced
by human activity.
Deforestation is the
permanent removal of
standing forests that can
lead to significant levels of
carbon dioxide emissions.

IMPACT OF CLIMATE CHANGE ON CONFLICT
298
SEAMEO
Chapter VIII
How Should We Help Locally? As teachers your role in the classroom is vital to:
educate youth about the effects of climate change;
engage youth actively in adaptation, mitigation and disaster management
schemes where possible;
ensure that youth realise there are “choices” to be made for e.g., in affluent areas
“shopping” as a major pastime is not the ultimate source of happiness;
ensure youth channel their immense creative and resourceful energies
productively so that they have realistic “hope” in their future and that of their
children.
The concept of Gross National Happiness (GNH) was coined in 1972 by Bhutan's
former King. It measures quality of life or social progress as compared to Gross National
Product or Gross Domestic Product (GDP). GDP depends on continued economic
“growth”. As a result, many countries encourage spending and consumerism for its own
sake, but this is unsustainable. The four pillars of GNH are the promotion of:
sustainable development
preservation and promotion of cultural values
conservation of the natural environment
establishment of good governance
These and the earlier messages are built into the lesson plans that follow this
introduction and are designed especially for young people to engage their interest and
commitment.
i. Make Learning Relevant to Youth
“Think globally, act locally”
One way to ensure the interest of students on climate change relies on is to
make it relevant to their lives. As a developing region, Southeast Asia still faces
many socio-economic challenges. Thus, concern over climate change is not a
high priority on the government‟s action agenda. This is understandable when we
consider that in the year 2000, the whole region was responsible for just 12% of
mankind‟s GHG emissions.

IMPACT OF CLIMATE CHANGE ON CONFLICT
299
SEAMEO
Chapter VIII
However, as explained earlier, Southeast Asia is one of the regions in the world
that will be worst affected by climate change. To emphasise the relevance of
climate change for Southeast Asia, consider the following facts and statistics
(ADB, 2009):
Climate change is already affecting Southeast Asia, with higher
temperatures, decreasing rainfall, rising sea levels, greater frequency and
intensity of extreme weather events leading to massive flooding, landslides
and drought.
Climate change is also making worse the problem of water stress, affecting
agricultural production, triggering forest fires, damaging coastal marine
resources, and increasing outbreaks of infectious diseases.
Rice yield could decline by up to 50% on average by 2100 compared to 1990
in four countries namely, Philippines, Vietnam, Thailand and Indonesia; and a
large part of the dominant forest/woodland could be replaced by tropical
savanna and shrub with low or no carbon sequestration (storage) potential.
Food insecurity and loss of livelihood are likely to get more worse by the loss
of arable land and fisheries to inundation and coastal erosion in low-lying
areas. More people will be at risk of hunger and malnutrition. Hence, the
possibility of local conflicts may increase.
ii. Engage Students in Small, Active School and Local Community Projects
These are described in the lesson plan exemplars of this Chapter and in the
Chapter on Poverty.
iii. Engage All Education Stakeholders in Climate Change Education
When students undertake projects it is always useful to engage other
education stakeholders (e.g., teachers, parents, local government, business
and industry, health practitioners, farmers and other members of the
community) as climate change is such a multi-disciplinary concept.
In an emergency, schools are often used to shelter people temporarily and/or
for community meetings and the distribution of food and supplies. It may be
useful to discuss this with the school-community and develop a school
“Disaster Management Plan”.

IMPACT OF CLIMATE CHANGE ON CONFLICT
300
SEAMEO
Chapter VIII
Education and
awareness raising
about climate change,
adaptation, and
mitigation built into
development work
plans
Behaviour change
campaigns
help/support people to
adapt by providing
subsidies and
information
Mitigation schemes
Disaster prevention
and disaster
management planning
Development of early
warning systems
Involvement and
training of women as
disasters impact
women the most
Preparation by schools
as they often function
as meeting, sleeping
and distribution centres
in times of crisis
Cooperation and
effective use of
existing
resources
Building up of
levee banks
New buildings
sited on higher
and/or more
protected land
especially
schools,
hospitals, police
and fire stations,
radio transmitter
towers
More educated
and skilled
people able to
cope with climate
change
Poor people are less
vulnerable, better
educated and better
prepared
Planned migration
linked to education
would result in “climate
change migrants”
instead of “climate
change refugees”
Such migration bestows
dignity and respect for
the people which is
important for their self-
esteem and enables
them to become
productive members of
society
Enhanced cooperation
and more effective and
efficient use of
resources
iv. Large Scale Changes
There are many things that individuals can do to help combat climate change.
It is always preferable to talk about possible solutions (e.g., prevention,
adaptation and mitigation measures successfully done in the past) and not
just the problems, otherwise we feel helpless and unable to cope. Figure 8.2
illustrates a possible action plan that could lessen the chance of conflict
occurring from climate change.
Action Planning Outcomes Positive Impacts
Figure 8.2 Action Planning Leading to Positive Impacts

IMPACT OF CLIMATE CHANGE ON CONFLICT
301
SEAMEO
Chapter VIII
Addressing the issue of climate change is urgent and concerns us all. The lesson plans
that follow are designed for you, the teacher, to raise students‟ awareness in your
classroom about climate change and how its impact can be a contributing factor to
conflict. By understanding this, students and the school-communities can be better
prepared to manage the conflict or lessen its likelihood of occurring. The youth of
Southeast Asia are one of its greatest resources. By educating them on these issues,
you will be helping mobilise a whole generation that will be better informed and thus able
to apply their knowledge and skills constructively for the benefit of society.
REFERENCES
ADB (Asian Development Bank). (2009). The economics of climate change in Southeast
Asia: A regional review. Philippines: Asian Development Bank.
Stern, N. (2007). The economics of climate change: The Stern review. Cambridge:
Cambridge University Press.
Smith, D., & Janani, V. (2009). Climate change, conflict and fragility: Understanding the
linkages, shaping effective responses. London, UK: International Alert.
WSM, (1986). Women and Socialism. Retrieved on October 31, 2010 from
http://www.worldsocialism.org/spgb/pdf/was.pdf

IMPACT OF CLIMATE CHANGE ON CONFLICT
302
SEAMEO
Chapter VIII
Lesson 1
HOW MUCH DO I GET?
GRADE LEVEL: 12 to 14 years of age (Grades 6 to 7)
SUBJECTS: Mathematics
TOPIC: Ratio and Proportion
PREREQUISITE
Students should have good background knowledge on collecting, tabulating and comparing data.
DURATION: 1 session
LEARNING OBJECTIVES
Subject Matter Objectives: By the end of this lesson, students should be able to:
compare two quantities using ratios;
use ratio and proportion to represent and describe quantitative relationships; and
solve problems on ratio and proportion.
Climate Change Objectives
use ratio to determine the relationship of a certain population and the amount
of available resources in a local community;
realise the importance of sharing available resources to minimise conflict;
suggest ways to improve access to resources in order to avoid conflict; and
discuss the causes of conflict.
MAIN CONCEPTS AND SKILLS
Rising sea levels can flood farmlands and disrupt or harm fish populations.
Severe or extreme weather events can disrupt and harm agriculture in the
following ways:
increased heavy rains leads to soil erosion (loss of soil) and can make
land infertile hence, not good for planting crops;
increased temperatures can advance grain sterility, disrupt and harm
agricultural processes; and

IMPACT OF CLIMATE CHANGE ON CONFLICT
303
SEAMEO
Chapter VIII
access to clean water is affected by the shifts in rainfall and salination of
ground water in coastal areas. Together, a shortage of clean water and
increased temperatures may also spread disease.
Food insecurity and loss of livelihood are likely to be made worse by the loss of
arable land and fisheries to inundation and coastal erosion in low-lying areas.
More people will be at risk of hunger and malnutrition. As such, the possibility of
local conflicts may increase.
There are many sources of conflict. It may be conflict on relationships, territory or
space, resources, and principles, values and beliefs.
Some possible ways to minimise conflicts include thinking about the whole
picture, building awareness, integrating adaptation and mitigation strategies into
development work and engaging women actively on climate change plans and
action. Schools have a vital role in educating the youth about the effects of
climate change; engaging them to be actively involved in adaptation, mitigation
and disaster management programmes where possible; ensuring that youth
realise there are “choices” to be made e.g., in affluent areas, “shopping” as a
major pastime is not the ultimate source of happiness, and ensuring that youth
channel their immense creative and resourceful energies productively so that
they have realistic “hope” in their future and that of their children.
MATERIALS NEEDED
Movie clip or pictures showing
o overcrowded people in a particular evacuation area; or
o war between two groups over a dispute of land or resources (e.g., as
portrayed in the “AVATAR” movie).
Picture of people (Attachment 8.1.1)
o Living in conflict situation; and
o In an evacuation area
Data as inputs to determine the following:
o how much rice could a community produce in a year and how much a
community could consume;
o how much water a particular dam could supply in cubic meters and the
number of persons in the community; and
o in case of a calamity, data on number of evacuees and total land area of
evacuation.

IMPACT OF CLIMATE CHANGE ON CONFLICT
304
SEAMEO
Chapter VIII
PRESENTATION OF THE LESSON
Scenario
1) The class views a portion of the movie “AVATAR” where the people from earth
wanted to exploit the natural resources of the other planet. (Note: If the movie
clip is not available, as an alternate activity, the teacher can show a picture
depicting war between two groups over a dispute of land or resources.)
2) The teacher poses the following questions:
What do you think is the message of the movie (or picture)?
Why do humans try to go outside of earth to exploit other resources?
What was the source of conflict in the movie (or picture)?
What can you suggest to avoid such conflict?
Student Activities
Activity 1: Identifying the Possible Causes of Conflict
1) The teacher will present to the class two pictures – the first one shows people
living in a conflict situation in a community and another picture showing people in
an evacuation area (Attachment 8.1.1).
2) To facilitate the class-discussion, students will answer the following questions:
Which of the two pictures can possibly lead to conflict? Why?
What do you think can be the source of conflict?
What causes people to evacuate from their homes?
Suppose that in a big community, there are about 300 people and the total
land of the community is 400,000 square meters. How many square meters
can be allotted to each person assuming that there will be equal distribution
of land?
Suppose that in an evacuation area, there are 100 persons that are placed in
each room with an area of 56 square meters, how many people should
occupy each square meter of area? If 20 more people are added in the same
room, how many people can occupy a square meter of the floor area?
What are some of the implications if the ratio of the number of people to that
of the area they are occupying becomes less?

IMPACT OF CLIMATE CHANGE ON CONFLICT
305
SEAMEO
Chapter VIII
Activity 2: Group Project on Community Survey
The students will be organised into two working groups. They will conduct a
community survey to investigate the issues on rice production and water supply:
How much rice could a community produce in different seasons of the year
and how much could be consumed by the community?
How much water (in cubic meters) a particular dam could supply in different
seasons of the year and how many persons could be served in the
community or city?
Using the concept of ratio, the students are asked to compare two quantities in
each of the following cases:
At what time of the year is the ratio highest or lowest in terms of rice
production (i.e., in kilograms) and the amount a community can consume?
What can you suggest to increase the ratio during this particular time?
At what time of the year is the ratio highest or lowest in terms of the amount
of water supply (in cubic meters) and the number of population in the
community?
What can you suggest to increase the ratio during this particular time of the
year?
What are the possible causes of a decreasing amount of water supply or rice
production? Can these phenomena be avoided? How?
Process Guide for Teachers
1. Lead the discussion with students to identify the possible causes of conflict over
certain resources (e.g., land, water) for survival.
2. Help the students understand that people are forced to evacuate due to
unforeseen calamities like typhoon and flood. An evacuation incident can cause
people to compete for limited resources such as food, space, water, and other
basic needs.
3. The students will be given time to present their project report in groups.
4. Ask each group to identify the possible causes of conflict and how to minimise
them.

IMPACT OF CLIMATE CHANGE ON CONFLICT
306
SEAMEO
Chapter VIII
Closure
OPTION 1
Students will make posters about climate change awareness and how it can
cause environmental stress and thus could become a potential cause of future
conflicts.
OPTION 2
As a group, they will write a letter to the community youth leaders and civic
organisations and cause-oriented groups to help in addressing climate change
issues that directly affect any existing conflict situation in the community involving
the use of basic resources for human survival (e.g., agricultural land, fishing
ground, watershed, forest, mining industry).
Achieving the Objectives
Objective This is achieved by
Solve problems on ratio and
proportion
Working in groups to solve problems on ratio
and proportion.
Student-teacher interaction on how to solve
problems related to Activity 1.
Use ratio to determine the relationship
of number of persons and the amount
of available resources in the
community.
Using data obtained in the survey on food
consumption and amount of water supply
while performing Activity 2.
Realise the importance of sharing
available resources to those in need
to minimise conflict.
Watching a portion of the movie AVATAR.
Students will answer the guide questions and
exchange ideas with one another.
Suggest ways to improve access to
resources in order to avoid conflict.
Designing a poster to increase people‟s
awareness on conflicts with regard to
resource inequities.
Assessment
To assess the level of performance of each group, the teacher will utilise a poster
rubric and a group presentation rubric (Attachments 8.1.2 and 8.1.3).
Formative assessment: On a clean sheet of paper, the students will answer the
following questions:

IMPACT OF CLIMATE CHANGE ON CONFLICT
307
SEAMEO
Chapter VIII
1. The head of the Disaster Coordinating Council in a city is planning to use the
schools as their evacuation centre during the incoming typhoon. He estimates
that there are 25,000 people including children who need to be evacuated. If
each classroom can accommodate 27 people, approximately, how many
classrooms are needed for the evacuation?
2. The city government has a total of 2,500 cavans of rice in the warehouse.
The City Mayor plans to distribute the rice equally to the families living in the
slum areas which were affected by the typhoon.
a. If there are 300 families, and each family has an average of 5 members,
what is the ratio of the number of persons to that of the number of
kilograms of rice assuming that each cavan contains 45 kilograms?
b. How many days would the rice supply last if each family consumes 2
kilograms of rice a day?
c. How should the government ensure that every family will receive their
share of rice equally without conflict during the distribution to the overall
population in the slum area?
RESOURCES
Canonigo, Allan (2010). “How Much Do I Get? Lesson Plan on Ratio and Proportion,
Ateneo de Manila University.
SEAMEO SPAFA, (2010). Climate Change Impact on Conflict, Integrating Climate
Change Issues in Southeast Asian Schools, A Teachers‟ Guidebook. SEAMEO.

IMPACT OF CLIMATE CHANGE ON CONFLICT
308
SEAMEO
Chapter VIII
Attachment 8.1.1
Sample Picture 1
EVACUATION CENTER
Half a million people in evacuation centres after Typhoon Ondoy–DSWD, Philippines
Source: The Associated Press
Photo by AP/Aaron Favila
Sample Picture 2
IMAGES OF CONFLICT
Source: SEAMEO SPAFA
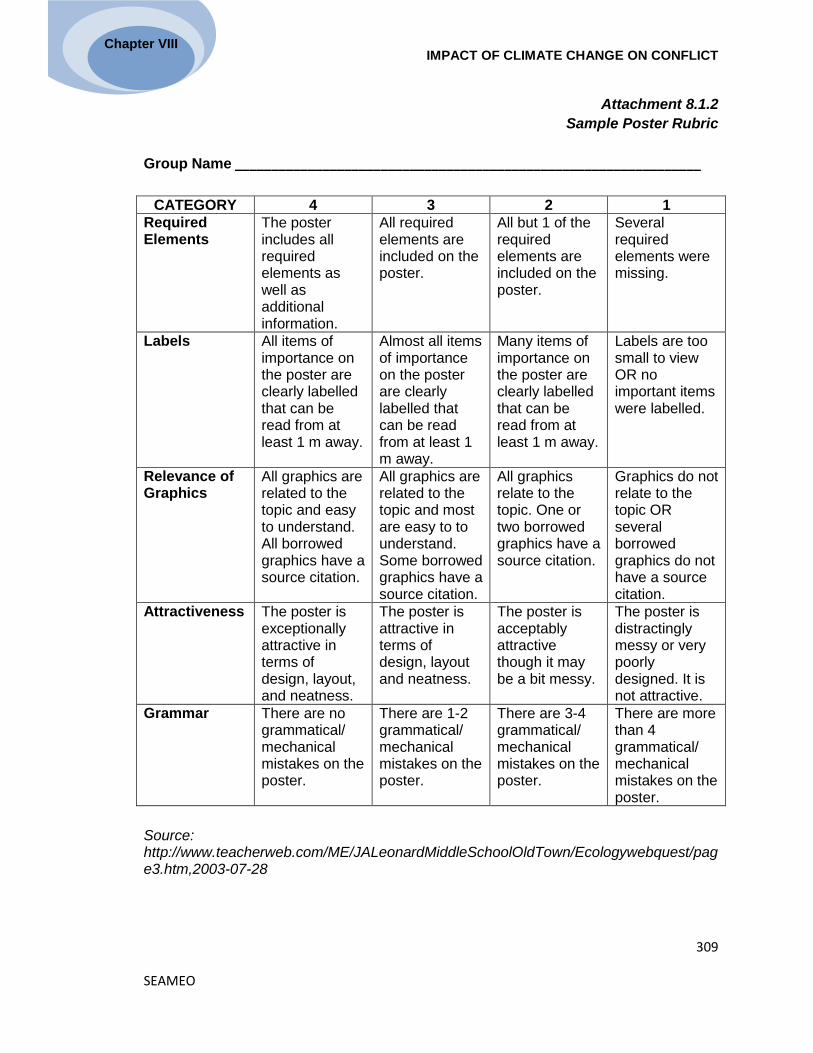
IMPACT OF CLIMATE CHANGE ON CONFLICT
309
SEAMEO
Chapter VIII
Attachment 8.1.2
Sample Poster Rubric
Group Name ________________________________________________________________
CATEGORY 4 3 2 1
Required Elements
The poster includes all required elements as well as additional information.
All required elements are included on the poster.
All but 1 of the required elements are included on the poster.
Several required elements were missing.
Labels All items of importance on the poster are clearly labelled that can be read from at least 1 m away.
Almost all items of importance on the poster are clearly labelled that can be read from at least 1 m away.
Many items of importance on the poster are clearly labelled that can be read from at least 1 m away.
Labels are too small to view OR no important items were labelled.
Relevance of Graphics
All graphics are related to the topic and easy to understand. All borrowed graphics have a source citation.
All graphics are related to the topic and most are easy to to understand. Some borrowed graphics have a source citation.
All graphics relate to the topic. One or two borrowed graphics have a source citation.
Graphics do not relate to the topic OR several borrowed graphics do not have a source citation.
Attractiveness The poster is exceptionally attractive in terms of design, layout, and neatness.
The poster is attractive in terms of design, layout and neatness.
The poster is acceptably attractive though it may be a bit messy.
The poster is distractingly messy or very poorly designed. It is not attractive.
Grammar There are no grammatical/ mechanical mistakes on the poster.
There are 1-2 grammatical/ mechanical mistakes on the poster.
There are 3-4 grammatical/ mechanical mistakes on the poster.
There are more than 4 grammatical/ mechanical mistakes on the poster.
Source: http://www.teacherweb.com/ME/JALeonardMiddleSchoolOldTown/Ecologywebquest/page3.htm,2003-07-28

IMPACT OF CLIMATE CHANGE ON CONFLICT
310
SEAMEO
Chapter VIII
Attachment 8.1.3 Sample Group Presentation Rubric
Traits Presented
4 Exceeds Standard
3 Meets
Standard
2 Progressing to Standard
1 Below
Standard
Content Opening Opening captivates the audience with interest and/or intrigue.
Interesting opening; engages audience.
Opening is minimally engaging.
Opening is not engaging.
Focus
Purpose of
presentation is
clear.
Supporting
ideas maintain
exceptional
focus on the
topic
Topic of the
presentation
is clear.
Content
consistently
supports the
purpose.
Presentation
lacks clear
direction.
No clear
focus.
Organisation Information/ide
as are
presented in a
consistently
logical
sequence.
Transition/
connections
are eloquent.
A strong sense
of wholeness
is conveyed.
Conclusion
leaves the
audience with
a strong sense
of closure.
Important
ideas and
information
are identified
for the
audience.
Information/
ideas are
presented in
a logical
sequence
with few
lapses.
Transitions
and
connections
are made.
Closing
effectively
summarises
the
presentation.
Irrelevant,
unnecessary
information
detracts. Big
ideas are not
specifically
identified.
There are
significant
lapses in the
order of
ideas.
Transitions
are
inconsistent
and weak or
missing.
Closing
demonstrates
an attempt to
summarise.
No clear
organisa-
tion. Ideas
do not
connect with
one
another.
There are
no clear
transitions.
No closing
is evident.

IMPACT OF CLIMATE CHANGE ON CONFLICT
311
SEAMEO
Chapter VIII
Traits Presented 4
Exceeds Standard
3 Meets
Standard
2 Progressing to Standard
1 Below
Standard
Presen-tation
Speech Commands
audience politely
using eye
contact, making
sure audience is
ready. Can be
heard by all
members of
audience without
assistance.
Uses visual aid
as guide or
outline for
speaking.
Consistently
maintains eye
contact.
Makes sure
audience is
ready before
starting.
May need
reminders
from
audience to
speak up;
generally
consistent,
maintains
eye contact,
and
minimises
reliance on
notes.
Makes
occasional
eye contact,
makes few
attempts to
command
audience;
may start
speaking
before
audience is
ready. Needs
reminders
from audience
to speak up.
Mostly reads
from notes.
Audience
hears with
great
difficulty.
Reads
notes and
seldom
establi-
shes eye
contact.
Visual
Aid
Visual aid can
be seen and
attractive from
all parts of the
room. Graphic
is clear and
professional
looking,
enhancing the
message.
Visual aid
can be seen
from all parts
of the room.
Graphic is
neat.
Appropriate
subject
chosen to
depict
message.
Visual aid is
not
completely
accessible to
all audience
members.
Graphic may
be messy.
Visual may
not be most
appropriate to
support
presentation.
Visual aid
undeci-
pherable.
Graphic
detracts
from
message.
Messy or
inappropri-
ate visual.
Question
& Answer
Speaker
expands upon
previous
statements.
Cites additional
examples to
answer question.
Thoughtful,
concise
response.
Conveys
knowledge of
subject.
Response not
clear or did
not add to
comprehen-
sion of the
listener.
Could not
answer
questions
or answers
are
irrelevant.
IMPACT OF CLIMATE CHANGE ON CONFLICT
312
SEAMEO
Chapter VIII
Lesson 2
THE TWO GOATS
GRADE LEVEL: 12 to 14 years of age (Grades 6 to 7)
SUBJECT: English
TOPIC: Cause and Effect Relationships
DURATION: 1 session
LEARNING OBJECTIVES
Subject Matter Objectives: By the end of this lesson, students should be able to:
identify cause and effect relationships;
discuss the causes of a conflict; and
write a short essay about resolving a conflict at home or in the community.
Climate Change Objectives
compare the differences between “lose-lose”, “win-win”, “win-lose” conflict
resolution strategies;
suggest creative solutions to a conflict in a story;
identify different conflicts they have observed at home, school or in their
community;
give examples of the main types of conflict; and
describe how the results of climate change might exacerbate some conflicts.
MAIN CONCEPTS AND SKILLS
Climate change is continuous, and over time events such as a rise in
temperature by a few degrees can gradually contribute to the risk of conflict.
It is easier to understand the link between climate change and conflict when we
look at it as a cause and effect situation. By analysing climate change, we can try
to avoid conflict by adapting to and mitigating the effects of climate change.
Conflict is a normal part of life and unavoidable. There are different levels of
conflict from disagreement, to verbal and physical abuse to full scale physical
violence and war.
There are many causes of conflict. It may involve one or more of the following:
1) relationships e.g., between family members, cultural groups which may
include distrust, prejudice, personality clashes, abuse, and violence
2) territory or space, which involves

IMPACT OF CLIMATE CHANGE ON CONFLICT
313
SEAMEO
Chapter VIII
physical space e.g., land, fishing and or hunting rights and territories;
cutting down protected forests
psychological space e.g., areas of responsibility, personal space, privacy,
status, personal identity
3) resources e.g., land, water, money, goods, objects, buildings
4) principles, values and beliefs e.g., cultural and religious values, beliefs and
rituals; political beliefs, personal and/or family reputation and pride.
Thinking before acting, empathy, compassion, cooperation to find creative
solutions and forgiveness are all important factors in conflict resolution.
There is power for peace and good in everyone, which can transform our
relationships and enable us to manage and/or resolve conflict.
PRESENTATION OF THE LESSON
Scenario
Option 1) Invite students to join in on a
story telling entitled, “The Two Goats”.
Explain that you will say a
phrase and they must repeat it
exactly altogether (this
improves their listening and
concentration skills).
Use first and second fingers of
each hand in the air to
represent the horns of each
goat and move them up and
down the imaginary mountain
and over the bridge like
puppets. Ask students to imitate
your hand movements.
Tell the first story which ends in
a confrontation. Then
immediately tell the second
story, and then lead the
discussion. Remind them to join
in after you altogether.
Source: SEAMEO SPAFA

IMPACT OF CLIMATE CHANGE ON CONFLICT
314
SEAMEO
Chapter VIII
Option 2) Role Play: Students will be divided into two groups. Each group will act out a
short story entitled, “The Two Goats”, (Source: Unknown but similar concept with Aesop
Fable).
Discussion Ideas
What were the causes of conflict in the first story? (e.g., lack of space, a narrow
bridge i.e., territory; stubbornness i.e., relationships; lack of communication and
listening; bullying and lack of problem solving skills)
Story 1 Story 2
Once upon a time there were two goats... Northern goat, Southern goat
Lived in the mountains Every day, Northern goat, came down the
mountain Crossed the bridge
Ate the grass “Nim nim nim nim” (eating sounds)
Went home Every day, Southern goat, came down the
mountain Crossed the bridge
Ate the grass “Nim nim nim nim” (eating sounds)
Went home... One day ...
Both goats came down the mountain Crossed the bridge
“Oh!!!” (Southern goat) (rudely) “Oh!!!” (Northern goat) (rudely)
“You!...Get out of my way” (aggressively) “I want to go eat the grass over there”
“You!!! ...Get out of my way” (aggressively) “I want to go eat the grass over there”
“No!” (louder) “No!” (louder)
“Bah!” (louder, really angry) “Bah!” (louder, really angry)
End of Story
Once upon a time there were two goats Northern goat, Southern goat
Lived in the mountains Every day, Northern goat, came down
the mountain Crossed the bridge
Ate the grass “Nim nim nim nim” (eating sounds)
Went home Every day, Southern goat, came down
the mountain Crossed the bridge
Ate the grass “Nim nim nim nim” (eating sounds)
Went home... One day ...
Both goats came down the mountain Crossed the bridge
“Oh, hello, what are you doing here?” (Southern goat)
“I‟m going to eat grass over there” (Northern goat)
“And you, what are you doing here?” “I‟m going to eat grass over there”
“Uuumm we have a problem” “Maybe... we can squeeze past?”
“Let‟s try that” “Eek, eek eek eek eek”
Ah!!!!! “We did it” (smiling)..... They both ate the grass They both went home,
End of Story

IMPACT OF CLIMATE CHANGE ON CONFLICT
315
SEAMEO
Chapter VIII
What were the results of Story 1? (e.g., aggression, stalemate i.e., “lose-lose”). Write
“lose-lose” on the board.
What were the results of Story 2? (e.g., questioning, listening, creative & cooperative
problem solving i.e., “win-win”). Write “win-win” on the board.
In how many different creative ways can you solve the problem to get to the other
side of the river? (e.g., fly, swim across, go across one at a time in turn, cross on
alternative days)
Student Activities
Based on the central theme, “Climate Change Contribution to Conflict,” students will
share their opinions, ideas, and experiences about conflict, and cite examples of
conflict situations.
Process Guide for Teachers
1. Discuss the main concepts of conflict, including the levels of conflict, factors affecting
conflict, managing and resolving conflicts.
2. Ask students to sit down in small groups of 4 to 5 members. Each group will write
examples of conflict they have seen at home, school or in their community (one
example per piece of paper).
3. Students will present their outputs to the class.
4. The teacher will guide the students in clustering the examples and ask them to give
headings for each cluster (or type of conflict) e.g., “an argument with my sister” and
“my parents arguing” would go under the heading “relationships.”
5. Each group representative will write the headings on the board. The teacher will
explain the four types of conflict namely: (1) relationships (2)territory or space
(3)resources and 4) principles, values and beliefs. Allow students to identify other
types of conflict, if they have any. Note that some conflict may fall under two or more
categories.
Closure
To provide a summary of lessons learned, ask students to review the types of conflict
identified by the class based on the guide questions below:
What are the causes of conflict?
What are the different conflict resolution strategies?
How might climate change make a conflict worse?

IMPACT OF CLIMATE CHANGE ON CONFLICT
316
SEAMEO
Chapter VIII
For example:
Relationships: disasters, migration and/or living in refugee camps may
increase the pressure on family members and in some cases lead to
arguments or even violence
Territory: erosion by the sea or flooding may lead to land disputes or make
them worse
Resources: less safe water and less food, as “salt” from the rising sea levels
kills crops and make water undrinkable
Principles, values and beliefs: migration may lead to conflict as people learn
to resettle in new and different communities.
Achieving the Objectives
Objective This is Achieved by
Identify cause and effect
relationships.
Story telling about the Two Goats, where
students discussed the causes of conflict in
Story 1.
Discuss the causes of a conflict.
Student-teacher interaction and analysis of
the story on Two Goats.
Write a short essay about resolving
a conflict at home or in the
community.
Students sharing their own story by writing a
short essay about resolving a real-life conflict
situation at home or in the community.
Compare the differences between
“lose-lose”, “win-win”, “win-lose”
conflict resolution strategies.
Class discussion on the results of Story 1 and
Story 2 and students writing on the board the
conflict resolution strategies.
Suggest creative solutions to a
conflict in a story.
Using students‟ critical thinking, they will
suggest creative ways to solve the problem in
the story i.e., how to get to the other side of
the river.
Identify different conflicts they have
observed at home, school or in their
community.
Give examples of the main types of
conflict.
Students working in groups to share their
experiences and examples of conflict
situations
Students clustering the examples that they
gave for each type of conflict.
Describe how the results of climate
change might exacerbate some
conflicts.
Summarising the lessons, students will recall
the types of conflicts, its causes and different
conflict resolution strategies. They will give
their opinions and share ideas on how might
climate change make conflict worse.

IMPACT OF CLIMATE CHANGE ON CONFLICT
317
SEAMEO
Chapter VIII
Assessment
1) Use a group participation rubric to assess students‟ performance.
2) For formative assessment, ask students to:
Write a short essay about resolving a real-life conflict situation at home or in
the community which you may or may not be directly involved.
RESOURCES
SEAMEO SPAFA, (2010). Climate Change Impact on Conflict, Integrating Climate
Change Issues in Southeast Asian Schools, A Teachers‟ Guidebook. SEAMEO
Aesopica, (2008). The Two Goats. Retrieved October 31, 2010 from mythfolklore.net

IMPACT OF CLIMATE CHANGE ON CONFLICT
318
SEAMEO
Chapter VIII
Lesson 3
WHERE DO I BELONG?
GRADE LEVEL: 12 to 14 years of age (Grades 6 to 7)
SUBJECT: Social Studies
TOPIC: Climate Change Migration
DURATION: 2 sessions
LEARNING OBJECTIVES
Subject Matter Objectives: By the end of the lesson, students should be able to:
describe some of the feelings generated when families are forced to leave their
homes, communities, cultures due to rising seas and/or disasters;
describe the feelings of newcomers to their school and/or community;
explain why it is important to show understanding to people who may have to
move their homes as a result of natural disasters due to climate change;
state phrases from different cultures which encourage us to put things off until
tomorrow;
state phrases from different cultures which encourage us to act; and
give clear reasons why we all have to act NOW to make changes in our life styles
to adapt to climate change.
Climate Change Objectives
explain that natural disasters like typhoons are already being made worse by
climate change (i.e., warmer seas lead to more heating of the ocean, more
evaporation which intensifies the typhoon);
describe the impacts of natural disasters on affected people;
identify the many different ideas, power sources and contributions different
groups can make to tackle climate change; and
explain the need for people from different disciplines (areas of knowledge) to
work cooperatively to combat climate change.
MAIN CONCEPTS AND SKILLS
Climate change will affect everyone on the planet in some way; we are all in this
together.

IMPACT OF CLIMATE CHANGE ON CONFLICT
319
SEAMEO
Chapter VIII
Climate change is a very complex problem which requires people from physical
and social sciences, politics, industry and communities from different countries to
cooperate.
“Saving the planet” is a “mega goal” that is complex and needs many different
groups to cooperate in order to achieve it. We can achieve this if we all
cooperate.
The changing climate has influenced how, when, and where people live and
migrate to. Climate change is continuous, and over time events such as a rise in
temperature by a few degrees can gradually contribute to the risk of conflict. By
analysing climate change, we can avoid conflict by adapting to and mitigating the
effects of climate change.
Adaptation helps cope with the effects of climate change e.g.,
construction of barriers to protect against rising sea levels, or conversion
to crops capable of surviving high temperatures and drought or planting
mangroves in coastal areas to protect the coastline.
Mitigation helps reduce man-made climate change which involves
reducing GHG emissions through lesser use of coal oil and gas; reducing
deforestation and illegal logging and using more sustainable energy
sources like solar, hydro, wind, and geothermal power.
To avoid the risk of conflict as a result of climate change, we should:
1) Think about the whole picture. Think about the impact of climate change
locally and globally in a "conflict sensitive" manner. Any shift towards a low-
carbon economy must be supportive of development and peace.
2) Build awareness and adaptation and mitigation strategies into development
work. Tap opportunities for energy efficiency improvements and increase the
use of renewable energy such as biomass, solar, wind, hydro and
geothermal. Treat climate change adaptation as a key part of development
policies, such as adapting agricultural practices to changes in temperature
and precipitation and adapting water management to greater risk of floods
and droughts.
3) Engage women actively on climate change plans and action. Gender norms,
roles and relations are important factors in determining people‟s vulnerability
and adaptive capacity to the impact of climate change. The worst impact of
climate change will affect women, because 70% of the poor are women.
Hence, women‟s knowledge, priorities, and strategies have to be integrated in
climate change adaptation, mitigation and disaster management.

IMPACT OF CLIMATE CHANGE ON CONFLICT
320
SEAMEO
Chapter VIII
PRESENTATION OF THE LESSON
Scenario
1. Announce to the students that they are going to take part in a group simulation
activity, but first they have to stay still with their eyes closed. (Note: Closing eyes
requires trust and feeling safe. If any students have been involved in any
traumatic recent events they may not wish to close their eyes. If so, ask students
to face the wall so they cannot see what you are doing.)
2. Tell them using these exact words: “I am going to come around to each of you
and I am going to put a dot on your forehead” (or on the back of their right hand if
this is culturally more appropriate). Do not say anything else.
3. If there are 40 students in the class you need to distribute dots as follows:
Ensure that you give the one green dot to a strong, popular student who is not
normally left out and who has many friends.
4. When you have finished tell them “Open your eyes, and form a group without
speaking”. Do NOT tell them to form a group by colour. (Note: It is important
they do this in silence.)
5. Students tend to assume that they need to group according to colour. The
student with the green dot may try to join in with other groups but is often
rejected.
6. Let the exercise go on for a little while. Sometimes students in a group would
realize the need to let the “green” student join them.
7. In some classes, the students would link together to form one group (though this
does not happen often).
8. Some de-briefing questions you may use include:
What did it feel like to be in the big brown group?
What did it feel like to be in the group of two (2)?
What did it feel like to be the green person all alone? What was it like to
be rejected by a group?
x 25 brown
x 7 blue
x 5 red
x 2 yellow
x 1 green

IMPACT OF CLIMATE CHANGE ON CONFLICT
321
SEAMEO
Chapter VIII
Why did that group reject the green student?
9. Remind students that this was a simulation only. Now ask the students to think
about this in real life. Ask:
Are there times when some students are left out by the others?
Why does this happen?
What does it feel like to be left out?
What should you do?
Student Activities
Students will work on two activities, namely:
1) Case study about the “Impact of Typhoon Ketsana”
2) Story telling on “Monkeys in the Rain”
Process Guide for Teachers
Activity 1) “Moved out by Ketsana Disaster”
1. Tell students to read out a short case study about Typhoon Ketsana, then
ask:
What is a typhoon?
What are other names for a typhoon in other countries?” (cyclone,
hurricane, “bagyo” in Philippines).
Do any of you remember anything about Typhoon Ketsana?

IMPACT OF CLIMATE CHANGE ON CONFLICT
322
SEAMEO
Chapter VIII
2. Read out the following case study.
Case Study: TYPHOON KETSANA
Hundreds of people were killed and millions affected when Typhoon Ketsana tore
through the Philippines, Thailand, Vietnam, Cambodia and Laos, causing
massive flooding in September 2009. Whilst typhoons occur naturally in nature,
the intensity of these storms will be increased as the seas become warmer due
to climate change.
Typhoon Ketsana brought the worst rainfall to Metro Manila among recorded
typhoons since the start of rainfall record keeping producing only moderate
winds, but hours of extremely heavy rain. President Gloria Arroyo declared a
"state of calamity" encompassing most of Luzon after at least 86 people were
initially reported dead in landslides and other incidents. Flood water levels
reached a record 20 feet high in rural areas. As of October 24, 2009, at least 464
deaths were officially reported from the typhoon in the Philippines.
Typhoon Ketsana also hit southern Laos, causing flooding, strong winds and
heavy rainfall.
Aid agencies focused on providing access to safe water, emergency food
supplies and livelihood support. Now, months later the onset of the colder
weather presents a threat to the most vulnerable survivors. Aid agencies are
providing blankets and jackets to help ward off the cold.
3. Divide the class into two groups. Ask them to sit in parallel lines facing each
other. Label one row “Group A” and the other “Group B”.
4. Ask Group A students to “Imagine you are a member of a family whose home,
fields and animals have been swept away by floods. You have come to this
school in your community and it is your first day. Think about what you want to
say about what has happened to you in the past weeks”.
5. Ask Group B students to “Imagine you have been at this school all your life and
you are meeting the newcomers for the first time. Think about different ways of
introducing yourselves and talking to these strangers”.
6. Let everyone think for a couple of minutes. Then ask students to talk for 5
minutes.
7. Ask the Groups to exchange roles so members of Group A will now talk to
newcomers and Group B will share about their flooding experience.

IMPACT OF CLIMATE CHANGE ON CONFLICT
323
SEAMEO
Chapter VIII
8. Next lead a discussion with the class around feelings and thoughts of newcomers
and locals.
Discussion Questions
What will be the impact of extreme weather events e.g., droughts, floods,
typhoons on the physical landscape?
What impact will these events have on families?
Explain why it is important to show understanding to people who may have to
move their homes as a result of natural disasters and/or sea level rise.
Describe the variety of feelings of communities who take in people who have
been displaced by natural disasters and/or climate change.
Explain the meaning of empathy i.e., (listening with the head to information
and with the heart to feelings), compassion, etc.
Activity 2) “Monkeys in the Rain”
1. Tell students the story of the “Monkeys in the Rain” or preferably a story from
your culture that has the same message (i.e., if something is wrong you need to
take action to try to improve things).
MONKEYS IN THE RAIN: A BRAZILIAN FOLK TALE
Once there were five little monkeys
In the morning the sun was shining
The monkeys woke up and said
“Let‟s play”
do actions: hand over hand over hand over hand, it‟s fun”
everyone “hand over hand over hand over, it‟s fun”
“ooohhh, let‟s play chase”
“are you ready? if you are caught, you must come out”
“oooh caught yer”
“oooh rain...” everybody (shivering)
“rain..., ra...in..., ra...in...” (sound sad, cold, shivering and miserable)
Little monkeys were wet; little monkeys were cold
“What shall we do?”
“Let‟s build a house”
everybody “let‟s build a house”
one more time

IMPACT OF CLIMATE CHANGE ON CONFLICT
324
SEAMEO
Chapter VIII
“Let‟s build a house”
“to-morrow... tomorrow”.
“ahhh...” (sigh and yawn) little monkeys went to sleep
In the morning, the sun was shining
Everyone woke up
Little monkeys were happy
They said “Let‟s play”
“Hand over hand it‟s fun”
“Oooo let‟s play another game let‟s play chase” ...yes
“Ok oooooooooo” “caught you”
“Caught you”, ooooo caught you”
“Rain..., ra...in..., ra...in...” (sound sad, cold and miserable)
Little monkeys were wet, little monkeys were cold
“What shall we do?”
“Let‟s build a house”
everybody “Let‟s build a house”
“To-morrow... tomorrow”.
“Ahhh...” (sigh and yawn) little monkeys went to sleep
In the morning, the sun was shining
Everyone woke up
Little monkeys were happy
They said “Let‟s play”
“Hand over hand it‟s fun”
“Oooo let‟s play another game let‟s play chase” ...yes
“Ok oooooooooo” “caught you”
“Caught you”, ooooo caught you”
“Rain..., ra...in..., ra...in...” (sound sad, cold and miserable)
Little monkeys were wet, little monkeys were cold
“What shall we do?”
“Let‟s build a house”
Stop! (hold palm of hand up, and speak seriously)
Don‟t be like the monkeys!
Everyone
Don‟t be like the monkeys
Do it today, do it now
That’s the story

IMPACT OF CLIMATE CHANGE ON CONFLICT
325
SEAMEO
Chapter VIII
Discussion Questions
What happened to the monkeys?
(Answers: They repeatedly got wet; they didn‟t learn from their mistakes; they
were stupid and only thought in the short term; all talk and no action.)
Why didn‟t they take action to build a shelter from the rain?
(Answers: Lazy, mañana: leave it until tomorrow, lack of forward planning,
live for today, they failed to link cause and effect i.e., rain led to being cold
and miserable and if they build a house this was avoidable.)
What phrases have you heard that may stop people taking action about climate
change?
[Answers: “Bo pen yang” (It will be ok, don‟t do anything in Lao PDR). “Ke
garne” (What to do in Nepal). “It‟s the will of God/Allah”, “She‟ll be right” in
Australia].
What phases have you heard that advise action?
(Answers: “Never put off until tomorrow what you need to do today”, “Do it
now. God helps those who help themselves.”)
Why do we need to act now regarding climate change?
(Answers: The trends are already happening, we must all take action
otherwise the changes will be irreversible)
Closure Activity: “International Conference on Climate Change and Disaster
Management.”(Source: UNICEF: Heat Up Over Climate Change,
Resources for Peer Teaching)
1. Explain that traditional folk tales often have survived because they teach us
valuable lessons. First introduce students to the model below as shown in the
figure below.
2. Ask students to consider the outcomes of the four basic choices using the visual
below. Draw the four basic choices on the board.
3. Ask if they can see where the monkeys in the story would fit (i.e., if we ignore
Climate Change Box 2, “Take no Action”)

IMPACT OF CLIMATE CHANGE ON CONFLICT
326
SEAMEO
Chapter VIII
Box 1. Take Action, but Climate Change does not Happen
The “Climate Change deniers” (i.e., those who think climate change is not caused by
human activity and those that think it is happening naturally and that we are
powerless) warn that spending money on adaptation and mitigation will lead to:
rises in taxes
burdens on industry
new government regulations
cut backs
lay offs
In the worst case scenario they claim that this money spent would lead to a world
recession. However, others argue that if the money is well spent and the environment
will be improved, new jobs involving sustainable energy (solar wind and wave power)
will be created. Oil and gas are running out anyway so developing sustainable energy
sources like solar, wind, geothermal, etc make sense.
Box 2. No Action Taken and Climate Change does not Happen
We continue as usual. We use up the fossil fuels (coal, oil, gas, wood) until they run
out. Continue the pollution caused by fossil fuels, etc.
Four Basic Choices Regarding Global Climate Change
A B
Global Climate Change
YES: Take Significant Action NO: Take No Action
FALSE Climate Change does not happen
1. Take action, but Climate Change does not happen
2. No action and Climate Change does not happen
TRUE Climate Change happens
3. Take action and Climate Change happens
4. No action taken and Climate Change happens
4. Explain the consequences of the four basic choices (see explanation in the box
below).

IMPACT OF CLIMATE CHANGE ON CONFLICT
327
SEAMEO
Chapter VIII
Choice
Each choice we make in life has a range of consequences ranging from positive
to negative. Column A is the only logical choice. We cannot afford the risk. The
most illogical thing to do is nothing.
(Source http://www.youtube.com/watch)
Box 3. Take action and Climate Change Happens
Money was well spent on:
awareness raising and education about climate change
behaviour change strategies
adaptation
mitigation
disaster management plans
The impacts of climate change will be less intense. It will be a different world, but it will be liveable. There will be less loss of life.
Box 4. No Action Taken and Climate Change Happens
If we sit back and take no action, the results globally could be horrendous. In the worst case scenario it could lead to catastrophes in the areas of:
economic downturn
political upheaval
social upheaval
environmental degradation
health
Lack of preparedness could lead to:
conflict over scarce resources
epidemics
forced movements of refugees
armed conflict, etc.
Some point out that humans may be eventually wiped out; the earth will still exist but in a very different form. Extinctions have happened before. It would be the height of arrogance to think that we humans are here forever.

IMPACT OF CLIMATE CHANGE ON CONFLICT
328
SEAMEO
Chapter VIII
5. Emphasise that each choice we make in life has a range of consequences
ranging from positive to negative. Column A in the Four Basic Choices figure
earlier is the only logical choice. We cannot afford the risk. The most illogical
thing to do is nothing.
6. Set the scene for the Climate Superhero Auditions by explaining that they are
going to explore what different groups can do regarding climate change
adaptation, mitigation and disaster management.
7. Ask the class to imagine they are interviewing potential candidates to join the
climate change superhero dream team and explain that there are only four
places (slots) given on the team to attend the “International Conference on
Climate Change & Disaster Management”.
8. The entire class is the interviewing panel, but divide the class into seven smaller
groups. Each group should be given a character card. See Attachment 8.3.1.
The group will represent that character and will try to convince the interview
panel (the rest of the class) why they should join the Climate Change (CC)
Dream Team
9. If the group decided to represent the young people, they will represent Ms.
Severn Suzuki. See Attachment 8.3.2 entitled “The Twelve–Year Old Girl Who
Silenced The World For 5 Minutes”. The group will watch her video on U-tube or
read her speech to understand her character and appreciate her own views
about climate change and explain why should Ms. Suzuki (as voice of the youth)
be part of the “CC Dream Team
10. Once everyone in the sub-group is familiar with the character described on the
character card, they should decide together why that character is essential to
combat climate change.
11. Tell them they have 2 minutes to convince the interview panel and they can do
this in whatever way they choose – it may be through a drama, speech,
drawings, song or presentation. Each group is then invited to state and defend its
case.
12. After the presentations, the whole class could vote to say who joins the team.
Having established the CC Dream Team, ask:
“Can just one team of people deal with climate change?”
“Is there a chance of a better outcome if everyone in the world is part of
the CC Dream Team?” Explain.
13. As they are part of the team to save the earth ask them:

IMPACT OF CLIMATE CHANGE ON CONFLICT
329
SEAMEO
Chapter VIII
“What are you doing already?”
“What can you do in the future?”
Achieving the Objectives
Objective This is Achieved by
Describe the impacts of natural
disasters on affected people.
Analysing the case study of Typhoon
Ketsana.
Describe some of the feelings
generated when families are forced to
leave their homes, communities,
cultures due to rising seas and/or
disasters.
Students sharing their experience and
personal insights while acting out on roles
where members of Group A will talk to
newcomers in school which were affected by
disaster and Group B will share about their
flooding experience.
Describe the feelings of newcomers to
their school and/or community.
Class discussion around feelings and
thoughts of newcomers and locals after the
role play.
Explain why it is important to show
understanding to people who may have
to move their homes as a result of
natural disasters due to climate
change.
Students‟ interaction and sharing of ideas
and opinions based on the Guide Questions
for discussion.
State phrases from different cultures
which encourage us to put things off
until tomorrow.
State phrases from different cultures
which encourage us to act.
Give clear reasons why we all have to
act now to make changes in our life
styles to adapt to climate change.
Review and analysis of the story of the
“Monkeys in the Rain” which talk about the
phrases encouraging others to put things off
until tomorrow and taking action if something
is wrong to improve things.
Class discussion and interaction based on
the discussion questions used on the story
of “Monkeys in the Rain”
Identify the many different ideas, power
sources and contributions different
groups can make to tackle climate
change.
Students performing the activities on Four
Basic “Choices regarding Global Climate
Change” and “International Conference on
Climate Change and Disaster Management.”
Explain the need for people from
different disciplines (areas of
knowledge) to work cooperatively to
combat climate change.
Students doing the Climate Superhero
Auditions and exploring what different
groups can do regarding climate change
adaptation, mitigation and disaster

IMPACT OF CLIMATE CHANGE ON CONFLICT
330
SEAMEO
Chapter VIII
Objective This is Achieved by
management.
Class discussion on challenges and
opportunities to combat climate change after
analysing the speech or video of Ms. Severn
Suzuki at the Earth Summit.
Assessment
Use a group participation rubric to assess students‟ performance. For the
formative assessment, ask students to get a clean sheet of paper and write their
answers on the following questions:
1. Why is doing nothing about climate change considered be dangerous?
2. Why will climate change adaptation and mitigation require cooperation
from people from different countries and different groups (e.g., physical &
social sciences, politics, industry and communities)?
3. What do you recommend needs to be done by community leaders,
journalists, scientists, young people, politicians, business leaders,
women‟s groups, development workers, etc.?

IMPACT OF CLIMATE CHANGE ON CONFLICT
331
SEAMEO
Chapter VIII
Assignment: “Interview of Community Elders on Conflict Experience” (Suggested follow-
up project activity)
Procedure
1. Ask students in two‟s or three‟s (or if necessary with an adult) to interview a
relative or respected elder that they know about their personal experience where
a disagreement or conflict was well managed and resolved.
2. Explain that first they must:
introduce the “purpose of the interview” (i.e., “we are conducting interviews to
learn from the experience of our elders about successful conflict resolution
methods”)
ask if the respondent or interviewee (elder) would like to change his/her name
and the names of the people in the story to maintain anonymity.
Distribute Attachment 8.3.3 to each group to guide them.
3. Explain the different types of questions and ask students to give their own
examples:
Open Question: “Could you tell me about your childhood please?
Closed Question: “What is your name; where did you live as a child?
Clarifying Question: “Could you explain to me what you meant by the term
“xxxx”
Probing Question: “Can you tell me more about”
4. Ask students to form groups of three students and to name themselves: A, B & C,
where: A = interviewer, B = interviewee, C = observer
5. Allow students to practice in conducting interviews with each other. Ask them to
recall a story in their lives where a conflict has been resolved successfully. At the
end of the story they must try to summarise “The Positive Strategies Used” in 10
minutes.
6. Remind the student-interviewer to use each of the four types of questioning: open,
closed, clarifying, and probing.
7. Ask the student-observer to check whether all four types of questions have been
used.
8. Explain the concept of “confidentiality” (i.e., elders may say some things to the
student-interviewer that they would NOT want to be written in the story).
9. Explain that a story has:

IMPACT OF CLIMATE CHANGE ON CONFLICT
332
SEAMEO
Chapter VIII
a beginning in which the era (date) place, people are introduced
a middle in which the story takes place
an end where the key learning may be pointed out.
10. You may wish to give an example from your personal experience to the students.
11. Stories could be put together to make small booklets of local history to go into the
school library as a positive community development project.
Variations
This exercise could also be applied to an environmental project to research
behaviour adaptation to find out from elders how they used to survive hardship
through self sufficiency, thrift, mending, reduce, reuse, recycle.
RESOURCES AVP, (2009) “Alternatives to Violence Project – International” Retrieved on October 31,
2010 from http://avpinternational.org/index.html Cornelius, H. & Faire, S. (1989), Everyone Can Win: How to Resolve Conflict, Simon
and Schuster, East Roseville, NSW, Australia. Severn Suzuki, (2008). The Twelve Year Girl Who Silenced The World for 5 minutes at
the Rio Earth Summit Conference, Brazil. Retrieved on October 31, 2010 from http://www.youtube.com/watch?v=TQmz6Rbpnu0
UNICEF, (2010). Heat Up Over Climate Change, resources for peer teaching. Retrieved
on October 31, 2010 from http://www.tagd.org.uk/Document.ashx?ID=343

IMPACT OF CLIMATE CHANGE ON CONFLICT
333
SEAMEO
Chapter VIII
Attachment 8.3.1
CHARACTER CARDS FOR SUPERHERO AUDITIONS
Instructions for Students
Each group will be given a Character Card.
The group will represent that character and will try to convince the interview
panel why they should join the Climate Change Dream Team.
Decide together why the character assigned to your group is essential to combat
climate change.
If your group decided to represent the young people, you will represent Ms.
Severn Suzuki. Your teacher will provide Ms Suzuki‟s speech entitled “The
Twelve-Year Old Girl Who Silenced the World for 5 Minutes”. Watch her video on
U-tube or read her speech to understand her character and appreciate her own
views about climate change and explain why Ms. Suzuki (as voice of the youth)
should be part of the “CC Dream Team”.
Each group is given 2 minutes to convince the interview panel. Do this in a
creative way. It may be through a drama, speech, drawings, song or
presentation.
Journalists
Young People
(Ms. Severn Suzuki)
Community Leaders
Politicians
Scientists
Business Leaders
Activists / Campaigners
Development Workers

IMPACT OF CLIMATE CHANGE ON CONFLICT
334
SEAMEO
Chapter VIII
Attachment 8.3.2 Students’ Worksheet
“THE TWELVE YEAR-OLD GIRL WHO SILENCED THE WORLD
FOR 5 MINUTES”
Ms. Severn Suzuki (daughter of David Suzuki) at the age of 12 spoke at the Earth
Summit in Brazil in 1992. She received a standing ovation. Her video on U tube is very
inspirational. The speech of Ms. Suzuki is shown below for those without access to
Internet.
Hello, I'm Severn Suzuki speaking for E.C.O. - The Environmental Children's organisation. We are a group of twelve and thirteen-year-olds from Canada trying to make a difference: Vanessa Suttie, Morgan Geisler, Michelle Quigg and me. We raised all the money ourselves to come six thousand miles to tell you adults you must change your ways. Coming here today, I have no hidden agenda. I am fighting for my future. Losing my future is not like losing an election or a few points on the stock market. I am here to speak for all generations to come. I am here to speak on behalf of the starving children around the world whose cries go unheard. I am here to speak for the countless animals dying across this planet because they have nowhere left to go. We cannot afford to be not heard. I am afraid to go out in the sun now because of the holes in the ozone. I am afraid to breathe the air because I don't know what chemicals are in it. I used to go fishing in Vancouver with my dad until just a few years ago we found the fish full of cancers. And now we hear about animals and plants going extinct every day - vanishing forever. In my life, I have dreamt of seeing the great herds of wild animals, jungles and rainforests full of birds and butterflies, but now I wonder if they will even exist for my children to see. Did you have to worry about these little things when you were my age? All this is happening before our eyes and yet we act as if we have all the time we want and all the solutions.

IMPACT OF CLIMATE CHANGE ON CONFLICT
335
SEAMEO
Chapter VIII
I'm only a child and I don't have all the solutions, but I want you to realise, neither do you!
You don't know how to fix the holes in our ozone layer. You don't know how to bring salmon back up a dead stream. You don't know how to bring back an animal now extinct. And you can't bring back forests that once grew where there is now desert.
If you don't know how to fix it, please stop breaking it! Here, you may be delegates of your governments, business people, organisers, reporters or politicians - but really you are mothers and fathers, brothers and sister, aunts and uncles - and all of you are somebody's child. I'm only a child yet I know we are all part of a family, five billion strong, in fact, 30 million species strong and we all share the same air, water and soil - borders and governments will never change that. I'm only a child yet I know we are all in this together and should act as one single world towards one single goal. In my anger, I am not blind, and in my fear, I am not afraid to tell the world how I feel. In my country, we make so much waste, we buy and throw away, buy and throw away, and yet northern countries will not share with the needy. Even when we have more than enough, we are afraid to lose some of our wealth, afraid to share. In Canada, we live the privileged life, with plenty of food, water and shelter - we have watches, bicycles, computers and television sets. Two days ago here in Brazil, we were shocked when we spent some time with some children living on the streets. And this is what one child told us: "I wish I was rich and if I were, I would give all the street children food, clothes, medicine, shelter and love and affection." If a child on the street who has nothing, is willing to share, why are we who have everything still so greedy? I can't stop thinking that these children are my age, that it makes a tremendous difference where you are born, that I could be one of those children living in the Favellas of Rio; I could be a child starving in Somalia; a victim of war in the Middle East or a beggar in India. I'm only a child yet I know if all the money spent on war was spent on ending poverty and finding environmental answers, what a wonderful place this earth would be! At school, even in kindergarten, you teach us to behave in the world. You teach us:
not to fight with others to work things out

IMPACT OF CLIMATE CHANGE ON CONFLICT
336
SEAMEO
Chapter VIII
to respect others to clean up our mess not to hurt other creatures to share - not be greedy
Then why do you go out and do the things you tell us not to do? Do not forget why you're attending these conferences, who you're doing this for - we are your own children. You are deciding what kind of world we will grow up in. Parents should be able to comfort their children by saying "everything‟s going to be alright', "we're doing the best we can" and "it's not the end of the world". But I don't think you can say that to us anymore. Are we even on your list of priorities? My father always says "You are what you do, not what you say." Well, what you do makes me cry at night. You grown-ups say you love us. I challenge
you; please make your actions reflect your words. Thank you for listening.
(Source: U tube http://www.youtube.com/watch?v=TQmz6Rbpnu0)

IMPACT OF CLIMATE CHANGE ON CONFLICT
337
SEAMEO
Chapter VIII
Attachment 8.3.3
SUCCESS STORIES OF CONFLICT
(Assignment/Alternative Project)
Objectives
In this project, the students will be able to:
gather stories of elders on conflict prevention, management, resolution from the
stories of elders;
identify key lessons so as not to repeat the same mistakes;
celebrate innovation to maintain harmony in the family or community;
develop the attitude of maintaining confidentiality when required.
Materials
paper and coloured pencils
thread or staplers to bind stories together
cardboard for book covers
Procedure
1. Each member of the group will be given separate tasks. Members A, B and C
will perform the following roles: A = interviewer, B = interviewee, C = observer
2. Prepare an interview guide using the different types of questions: For example:
Open Question: “Could you tell me about your experience in handling
conflicts?
Closed Question: “What is your position or designation in this community?
Clarifying Question: “Could you explain to me what you meant by the term
conflict mediation?”
Probing Question: “Can you tell me more about your strategy in resolving
conflicts?”
3. Your group can invite an adult to assist during the interview of a relative or
respected elder in your community.
4. Before the interview, introduce yourselves and the purpose of the interview (e.g.,
“we are conducting interviews to learn from your experience about successful
conflict resolution methods”). Be ready to answer clarifying questions by
interviewees about the project.
IMPACT OF CLIMATE CHANGE ON CONFLICT
338
SEAMEO
Chapter VIII
5. Ask if the interviewee (elder) would like to change his/her name and use different
names of the people in the story to maintain anonymity.
6. Begin by asking the interview to recount an experience where a dispute or
conflict was well managed and resolved.
7. Take notes and collect stories.
8. Write up stories including the moral or learning from the story.
9. Develop small books for the school library about the local community.

CONCLUSION

CONCLUSION
340
Conclusion
Azhar is a fisherman from Balikukup island, Berau, East Kalimantan, Indonesia. This is his story (WWF, 2010);
“The weather is increasingly uncertain and unpredictable. I do not understand the causes, but clearly, the condition is bringing changes to my life as a sea cucumber fisherman. In the old days, we fishermen could predict the weather. But not anymore. The elders on our island also mentioned the same thing. Since 2002, Atang, one of the elders whom we regard as an expert in predicting the weather in Balikukup, said that the weather was getting unpredictable. Before, Atang could produce a very good prediction, even for the course of a full year.
One example of unpredictable weather is the lost phenomena of ‘bulan janda’, or ‘widow month’. It is the called widow-month because when the fishermen go to sea during that month, they rarely come home safely. Thus, their wives become widows. Widow month is an annual event when the wind blows very strongly for 44 days from the south. This wind stops for a short period of time (half an hour), and then goes back to blowing very hard. During that time it is impossible for fishermen to go at sea.
Fishermen who have saved enough money and food supply do not need to go to sea during the ‘widow month’ because the conditions are too dangerous. However, other fishermen have no option but to go to sea during that time.
The phenomenon of ‘widow month’ does not exist anymore. The last time it happened was in 1991. After 1991, during the supposedly ‘widow-month’, there could be calm periods for up to 2 weeks. None of the fishermen understands why the ‘widow month’ phenomenon has slowly disappeared.
The unpredictable weather is a disadvantage for us fishermen because we no longer know when we can go fishing. It is difficult for us to predict when we will make money. Before, we could estimate when was the right time to make income and put some money aside, as we could predict when we can go fishing. Now, whenever we have good weather, we just go fishing. We can no longer make financial plans”.
Disasters coming from changing climate are very real. They make the lives of Southeast Asian countries more unbearable. These countries are usually lacking in funds to educate their people, build strong roads, bridges, school building, and many others. They are also most likely to suffer in terms of diseases, malnutrition, conflict, and poverty when cyclones, floods, and droughts unpredictably strike.
Although the rich countries emit more CO2 and other GHGs, the fast-growing populations of Southeast Asian countries equally contribute a significant share to the destruction of natural resources through continued deforestation, unregulated chemical use in farming and overfishing and coral mining to meet their daily food and income requirements.
CONCLUSION
341
Conclusion
Now is the time to adapt and mitigate, and to educate ourselves with what can be done to reduce CO2 and GHGs. Although we have a long way to go to educate the peoples of Southeast Asia, we hope this Guidebook will be a good start for teachers to introduce to our young people what climate change is all about.
We urge you to act now!! REFERENCE WWF-Indonesia, (2010). Climate Witness: Pak Azhar, Indonesia, Witness Stories.
Retrieved on October 24, 2010 from http://wwf.panda.org/about_our_earth/aboutcc/problems/people_at_risk/personal_stories/witness_stories/index.cfm?uNewsID=193564&uLangID=1

CONTRIBUTORS

CONTRIBUTORS
SEAMEO
343
Contributors
Introduction Chapter Authors Ng Khar Thoe Chokalingam Annamalai SEAMEO RECSAM SEAMEO RECSAM [email protected] [email protected] Dr. Leong Chee Kin Baharulnizam B. Baharum SEAMEO RECSAM SEAMEO RECSAM [email protected] [email protected] Devadason Robert Peter Dr. Lorna L. Calumpang SEAMEO RECSAM Freelance Writer [email protected] [email protected] Dominador D. Mangao Julito C. Aligaen SEAMEO RECSAM SEAMEO RECSAM [email protected] [email protected]
Chapter 1: Impact of Climate Change on BIODIVERSITY AND ECOSYSTEM Chapter Authors
Dr. Ulfah Juniarti Siregar Julito C. Aligaen SEAMEO BIOTROP SEAMEO RECSAM [email protected] [email protected] Dr. Lorna L. Calumpang Freelance Writer [email protected] Lesson Plan Writers Indah Sulistio Drs. Mukhlis SEAMEO BIOTROP SEAMEO BIOTROP [email protected] [email protected] Mulyadi Irdam SEAMEO BIOTROP SEAMEO BIOTROP Syukur Eko Raharjo SEAMEO BIOTROP [email protected]

CONTRIBUTORS
SEAMEO
344
Contributors
Chapter 2: Climate Change and FRESH WATER RESOURCES Chapter Authors
Dina Mustafa Dr. Lorna L. Calumpang SEAMEO SEAMOLEC Freelance Writer [email protected] [email protected] Muhammad Andriansyah Julito C. Aligaen SEAMEO SEAMOLEC SEAMEO RECSAM [email protected] [email protected] Lesson Plan Writers Ria Irmawati Tjeppy Suhanaedy SEAMEO SEAMOLEC SEAMEO SEAMOLEC goya [email protected] Drs. Hartono SEAMEO SEAMOLEC [email protected]
Chapter 3: Impact of Climate Change on RISING SEA LEVEL AND SEA TEMPERATURE Chapter Authors
Dr. Ulfah Juniarti Siregar Julito C. Aligaen SEAMEO BIOTROP SEAMEO RECSAM [email protected] [email protected] Kevin Charles Kettle SEAMEO SPAFA [email protected] Lesson Plan Writers
Indah Sulistio Drs. Mukhlis SEAMEO BIOTROP SEAMEO BIOTROP [email protected] [email protected] Mulyadi Irdam SEAMEO BIOTROP SEAMEO BIOTROP Syukur Eko Raharjo SEAMEO BIOTROP [email protected]

CONTRIBUTORS
SEAMEO
345
Contributors
Chapter 4: Climate Change and ENERGY EFFICIENCY Chapter Authors
Dr. Mohd Rodzi Ismail Julito C. Aligaen Universiti Sains Malaysia SEAMEO RECSAM [email protected] [email protected] Lesson Plan Writers
Ch’ng Yeang Soon Dr. Arunasala Pandy a/l Karuppusamy Penang Free Secondary Tanjong Bunga Secondary School, School, Malaysia Penang, Malaysia [email protected] [email protected] Vijaya Arjunan Linda Toh Penang Free Secondary School, SMKA Al-Mashoor (L), Penang, Malaysia Malaysia [email protected] [email protected] Ling Jia Yi Wan Mohammad Zulkifli bin Wan Husin Penang Free Secondary School, Malaysia SMKA Al-Mashoor (L), Penang, Malaysia [email protected] [email protected] Loo Say Leng Faezah Bt Ahmad Ridzuan Tanjong Bunga Secondary School, SMKA Al-Mashoor (L), Penang, Penang, Malaysia Malaysia [email protected] [email protected] Muhammad Mawardi Ismail Tanjong Bunga Secondary School, Penang, Malaysia [email protected]

CONTRIBUTORS
SEAMEO
346
Contributors
Resource Persons
Marmon A. Pagunsan (Coordinator) Dr. Warabhorn Preechaporn SEAMEO RECSAM SEAMEO RECSAM (until 12th Feb 2010) [email protected] [email protected] Devadason Robert Peter (Team Leader) Lee Shok Mee SEAMEO RECSAM SEAMEO RECSAM [email protected] [email protected] Foo Lay Kuan (Team Leader) Dominador D. Mangao SEAMEO RECSAM SEAMEO RECSAM [email protected] [email protected] Teoh Boon Tat (Team Leader) Dr. Wahyudi Yososutikno SEAMEO RECSAM SEAMEO RECSAM (until 9th May 2010) [email protected] [email protected] Dr. Leong Chee Kin Chockalingam Annamalai SEAMEO RECSAM SEAMEO RECSAM [email protected] [email protected] Dr. Cheah Ui Hock Kyaw Ahr Kar Nyunt SEAMEO RECSAM SEAMEO RECSAM (until 31st May 2010) [email protected] [email protected]
Chapter 5: Impact of Climate Change on FOOD SECURITY Chapter Authors
Dr Lorna M Calumpang Dr. Maricel Cadiz Freelance Writer SEAMEO SEARCA Dr. Mariliza V. Ticsay Claudia Cabrera SEAMEO SEARCA SEAMEO SEARCA Lesson Plan Writers
Rowena V. Posa Bernadette Joven UP Rural High School SEAMEO SEARCA Michelle A. Atanacio Ranell Dedikatoria Lopez Elementary School SEAMEO SEARCA

CONTRIBUTORS
SEAMEO
347
Contributors
Resource Persons
Dr. Sheila Vergara Dr. Violy Quintana SEAMEO SEARCA SEAMEO SEARCA Dr. John Pulhin Raphael V. Quintana SEAMEO SEARCA SEAMEO SEARCA Arlene Nadres Dione Baracol SEAMEO SEARCA SEAMEO SEARCA
Chapter 6: Impact of Climate Change on HEALTH AND NUTRITION Chapter Authors
Lina Rospita Julito C. Aligaen SEAMEO TROPMED – Indonesia SEAMEO RECSAM [email protected] [email protected] Lolita Cavinta Dr. Lydia R. Leonardo SEAMEO TROPMED – Philippines SEAMEO TROPMED – Philippines [email protected] [email protected] Lesson Plan Writers
Sri Rohayati Abdul Hamid SEAMEO TROPMED – Indonesia SEAMEO TROPMED – Indonesia [email protected] Surata SEAMEO TROPMED – Indonesia [email protected]
Chapter 7: Impact of Climate Change on POVERTY Chapter Authors
Kevin Charles Kettle Libby Saul SEAMEO SPAFA SEAMEO SPAFA [email protected] Dr. Christine Hogan Sakulchat Chatrakul Na Ayuddhaya (Artist) SEAMEO SPAFA SEAMEO SPAFA

CONTRIBUTORS
SEAMEO
348
Contributors
Chapter 8: Impact of Climate Change on CONFLICT Chapter Authors
Kevin Charles Kettle Libby Saul SEAMEO SPAFA SEAMEO SPAFA [email protected] Dr. Christine Hogan Sakulchat Chatrakul Na Ayuddhaya (Artist) SEAMEO SPAFA SEAMEO SPAFA
Project Coordinator
Julito C. Aligaen SEAMEO RECSAM [email protected]
Centre Coordinators
Julito C. Aligaen Dr. Ulfah Juniarti Siregar SEAMEO RECSAM SEAMEO BIOTROP [email protected] [email protected] Dr. Lorna L. Calumpang/ Lina Rospita Dr. Mariliza Ticsay SEAMEO TROPMED – Indonesia SEAMEO SEARCA [email protected] [email protected]/[email protected] Yolanda de Las Alas Prof. Lolita Cavinta SEAMEO INNOTECH SEAMEO TROPMED – Philippines [email protected] [email protected] Kevin C. Kettle Dina Mustafa SEAMEO SPAFA SEAMEO SEAMOLEC [email protected] [email protected]
Editors
Dr. Azian T.S. Abdullah (Chief) Yolanda de Las Alas SEAMEO RECSAM SEAMEO INNOTECH [email protected] [email protected] Dr. Lorna L. Calumpang Shanti Jagannathan Freelance Writer Asian Development Bank (Education Section) [email protected] [email protected]

CONTRIBUTORS
SEAMEO
349
Contributors
Reviewers
Yolanda de Las Alas Dr. Hazura Ab. Bakar SEAMEO INNOTECH SEAMEO RECSAM [email protected] [email protected] Prof. Allan Canonigo Marmon Pagunsan Ateneo de Manila University SEAMEO RECSAM [email protected] [email protected] Agustin Owen Pena Dr. Cheah Ui Hock San Pedro Relocation Center High School SEAMEO RECSAM [email protected] [email protected] Julito C. Aligaen Dr. Sheila Oyao SEAMEO RECSAM SEAMEO RECSAM [email protected] [email protected] Devadason Robert Peter Chin Chern Far SEAMEO RECSAM SEAMEO RECSAM [email protected] [email protected] Dominador Mangao Bhavani a/p P. Ramasamy SEAMEO RECSAM SEAMEO RECSAM [email protected] [email protected] Ng Khar Thoe Lina Rospita SEAMEO RECSAM SEAMEO TROPMED – Indonesia [email protected] [email protected]
Publication Team
Wong Lai Cheng Shaneem Kamarudin SEAMEO RECSAM SEAMEO RECSAM [email protected] [email protected] Leong Yik Chin SEAMEO RECSAM [email protected]
