teacher guide nutrients in an estuary3 • water quality parameters such as temperature and...
TRANSCRIPT
Activity Summary
In this activity, students model estuaries, artificially enriching freshwater and saltwater samples with different amounts of nutrients and observing the growth of algae over several weeks. Students relate their results to the phenomenon of algae blooms in estuaries. They then analyze data for different sites at the Guana Tolomato Matanzas National Estuarine Research Re-serve (GTM NERR) in Florida to discover the relation-ships between nitrogen, chlorophyll, and dissolved oxy-gen. Finally, they study how nutrients cycle through an estuary and suggest recommendations for reducing nu-trient inputs to estuary waters.
Learning Objectives
Students will be able to:
1. Understand how water quality and nutrientparameters in an estuary can indicate disruptions toecological processes in estuaries.
2. Interpret data from an experiment to explain theeffects of over-enrichment on water quality andliving things; and relate this lab experience to thephenomenon of algae blooms and eutrophication inan estuary.
3. Explain the phenomena of algae blooms andeutrophication in terms of total nitrogen,chlorophyll-a, and dissolved oxygen.
4. Describe the effects of eutrophication on thenitrogen cycle.
5. Explain how nutrients cycle in an estuary and hownatural processes and human impacts affect thiscycle.
6. Identify sources of nitrogen inputs to estuaries andidentify some ways to limit them.
Grade Levels
9-12
Teaching Time
1 (55 minute) class session, plus periodicobservations every 2-3 days overthree weeks (Part 1)
3 (55 minute) class sessions (Parts 2and 3)
Featured NERRS Estuary: Guana Tolomato Matanzas National Estuarine Research Reserve, Florida
https://coast.noaa.gov/nerrs/reserves/gtm.html
Teacher Guide Nutrients in an Estuary

2
habitats, and deplete oxygen to the extent that organisms die or move out. The conditions created by these blooms may encourage only species that can tolerate eutrophic conditions (e.g., blue-green algae). In addition, the appearance of the cloudy water and decay-ing algae mats, unpleasant odors, and loss of estuarine species can diminish the recreational value of estuaries.
Algal blooms may result from natural conditions, but they are often linked to excess nutrients coming from human activities. Excess nutrients may come from septic tanks, wastewater treatment plants, point source dis-charges from sewage and industry, exhaust from cars, emissions from industry, fertilizers from lawns, golf courses, farms, and animal waste (especially from livestock). Sources of nitrogen that do not enter estuar-ies directly from point sources are transported to estuar-ies by stream flows, rain, leaching, groundwater, storm water, and as emissions carried through the air.
Algae blooms usually occur seasonally. In the northern hemisphere, they typically occur between May and October. Heavy use of fertilizers in the spring combined with spring rains can introduce excess nutrients to an estuary. Other conditions that favor algal blooms come into play in the months from summer to fall: bright sun-light, still water, and sharp temperature gradients that keep warmer surface water and colder bottom water from mixing.
Algal and phytoplankton blooms can be tracked by measurements of chlorophyll-a. Chlorophyll-a is a pigment found in phytoplankton that is involved in photosynthesis. Concentrations of chlorophyll-a are used as an indirect measurement to determine phyto-plankton abundance. Concentrations are measured in units of µg/L (micrograms per liter).
Algal Blooms and Nutrient Residence Time
The chance that particular sites within estuaries will experience algal blooms depends on a number of conditions. These include:
• The amount of nutrient input.
Organization of the Activity
This activity consists of 3 parts which help deepen understanding of estuarine systems:
Nutrients in an Estuary
Using Data to Study Eutrophication and Conditions in an Estuary
Eutrophication and the Nitrogen Cycle
Background Eutrophication and Algal Blooms
An overload of nutrients, called eutrophication (Greek for “good-nutrition”), can be harmful to estuaries. This phenomenon is also referred to as “over-enrichment,” or “nutrient pollution.” The consumption and recycling of nutrients tend to keep nitrogen levels balanced because bacteria release nitrogen back to the atmosphere at a greater rate than the natural flow of nitrogen into the estuary and the rate of nitrogen fixation.
Over-enrichment often causes “algal blooms” (or sometimes HAB “harmful algal blooms” in cases where the phytoplankton are toxic to marine organisms or humans) in estuaries. The influx of high nutrient levels causes excessive growth of algae. Too much phytoplankton in the water column can cause the water to become cloudy, reducing the amount of sunlight available for underwater plants to photosynthesize. Large algal mats floating on the surface can block the light that underwater plants such as seagrasses need. Disturbances to seagrass communities can be harmful to other organism like fish and crabs that depend on the grasses for food, shelter, and nursery areas. On sunny days, the algae’s photosynthesis pumps abnormally high levels of oxygen into the water. When algae die, it sinks to the bottom where it is decomposed by bacteria. This process removes oxygen from the water. As bacteria de-compose algae, more oxygen is consumed. If too much oxygen is removed from deep waters, the small organ-isms feeding fish and crabs will die off. Fish and other predators may die themselves or move to other areas in search of more oxygen.
Algae blooms can disrupt food webs, damage estuarine
3
• Water quality parameters such as temperature andsalinity.
• Weather and seasonal conditions.
• The residence time of nutrients in the estuary. Thisis determined by factors such as stream flow, tidalflushing, winds, water depth, and water stratification.These determine whether nutrients will stay in theestuary long enough to alter the nitrogen cycleenough to instigate an algal bloom.
From May 2002 to August 2003, researchers at the Gua-na Tolomato Matanzas National Estuarine Research Re-serve (GTM NERR) in Florida studied how water chem-istry and the hydrodynamic factors that govern residence time affect plankton abundance in the lagoons of East Florida. Over a sixteen-month period, they measured nutrient levels and plankton abundance (chlorophyll-a concentrations) at eight sites in the reserve. (A Compari-son of Water Quality and Hydrodynamic Characteristics of the Guana Tolomato Matanzas National Estuarine Research Reserve and the Indian River Lagoon in Flori-da, Phlips, et al., 2004 in Journal of Coastal Research, Special Issue No. 45, 2004.)
Researchers considered all the factors determining nutri-ent loading (including nitrogen and phosphorous inputs from all sources) and developed an index (Nutrient Load Index, or NLI), from 1-4, that describes how heav-ily the site is usually loaded with nutrients (1 represents a low load, 4 represents a high load). They also developed an index categorizing the sites according to estimated water residence times (RTI) on a scale of 1-4. This was done by summarizing the factors that determine tidal flushing, including tidal excursion, freshwater inflows, wind, water stratification, and depth. The index de-scribes the extent to which nutrients generally remain in the estuary, or are flushed out (1 represents a short resi-dence time, 4 represents a long residence time).
Their findings indicate that regions with short water residence times have lower peak phytoplankton abun-dance than regions with longer residence times (at least under normal to high rainfall conditions, not accounting for drought). In fact, this held true despite differences in nutrient load index. Sites that had a high residence time
index (index of 3 or 4) did not have the highest peak or average chlorophyll-a concentrations even if they had high nutrient load indexes.
Four of the sampling sites were on Florida’s northern east coast within the GTM NERR, which is defined by barrier islands. These sites were all relatively close to ocean inlets and as a consequence, all had relatively low residence times (RTI of 1 or 2). The four other sites were sub-basins of the Indian River Lagoon located on the central east coast. The lagoon has a several ecologically distinct basins that differ significantly in their hydrodynamics, water chemistry, and biological features. Their residence times varied, but two of the sites had RTI of 3 and 4.
All eight sites represented different combinations of nutri-ent load index and residence time index. Graphs illustrating
National Science Education Standards
Content Standard A: Science as Inquiry
A3. Use technology and mathematics to improve investigations and communications.
A4. Formulate and revise scientific explanations using logic and evidence.
A6. Communicate and defend a scientific argument.
Content Standard B: Physical Science
B6. Interactions of energy and matter
Content Standard C: Life Science
C4. The interdependence of organisms
C5. Matter, energy, and organization in living sys-tems
Content Standard F: Science in Personal and Social Perspectives
F3. Natural Resources
F4. Environmental quality
F5. Natural and human-induced hazards
F6. Science and technology in local, national, and global challenges
the combined influence of these two factors on phyto-plankton abundance are shown below.
The study also analyzed total nitrogen (TN) and dissolved inorganic nitrogen (DIN) concentrations and chlorophyll-a concentrations at all eight sites. The authors of the study acknowledge: “The absence of well-defined relationships between nutrient concentration and phytoplankton biomass (i.e. chloro-phyll-a) is not unusual for estuarine ecosystems, even those subject to substantial eutrophication (Borum, 1996; Cloern, 2001).” p. 15, Journal of Coastal Research, Special Issue No. 45, 2004.
However, it is still worthwhile for students to analyze this data and see if they can observe patterns. In fact, the authors found significant correlations between chloro-phyll-a and TN at all four Indian River lagoon sites. They found no significant correlations between chlorophyll-a and TN within the GTM NERR sites.
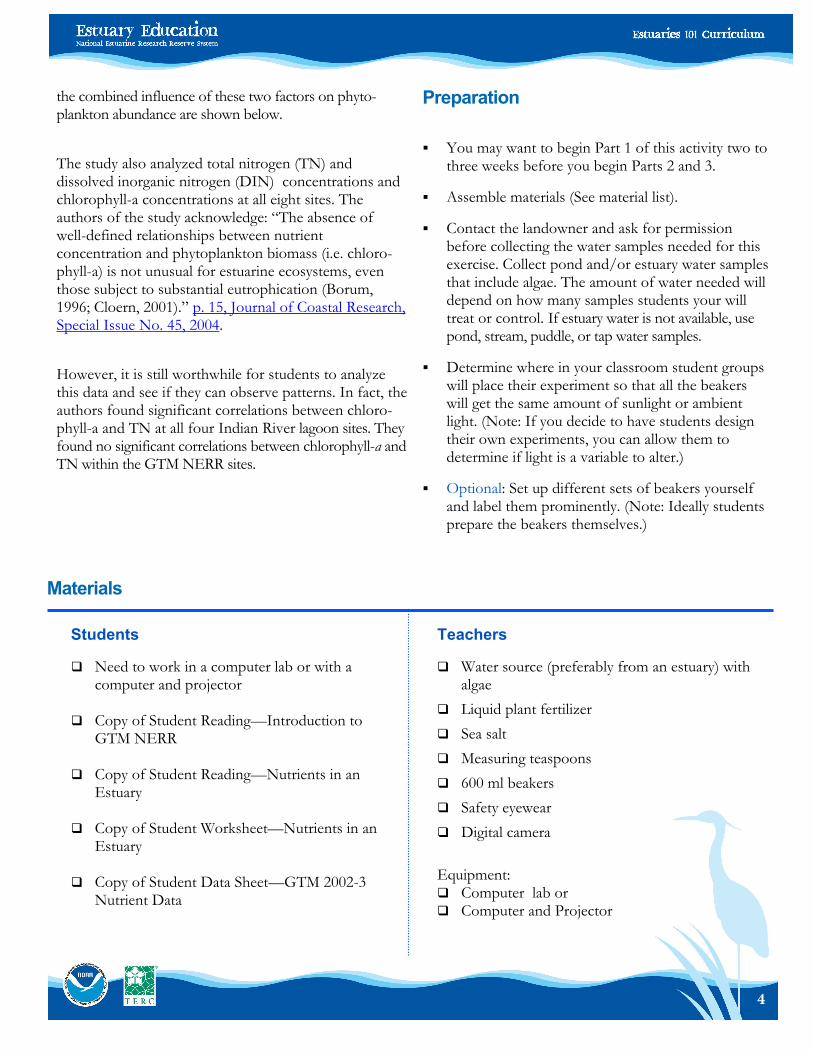
Materials
Students
Need to work in a computer lab or with acomputer and projector
Copy of Student Reading—Introduction toGTM NERR
Copy of Student Reading—Nutrients in anEstuary
Copy of Student Worksheet—Nutrients in anEstuary
Copy of Student Data Sheet—GTM 2002-3Nutrient Data
Teachers
Water source (preferably from an estuary) withalgae
Liquid plant fertilizer
Sea salt
Measuring teaspoons
600 ml beakers
Safety eyewear
Digital camera
Equipment: Computer lab or Computer and Projector
Preparation
You may want to begin Part 1 of this activity two tothree weeks before you begin Parts 2 and 3.
Assemble materials (See material list).
Contact the landowner and ask for permissionbefore collecting the water samples needed for thisexercise. Collect pond and/or estuary water samplesthat include algae. The amount of water needed willdepend on how many samples students your willtreat or control. If estuary water is not available, usepond, stream, puddle, or tap water samples.
Determine where in your classroom student groupswill place their experiment so that all the beakerswill get the same amount of sunlight or ambientlight. (Note: If you decide to have students designtheir own experiments, you can allow them todetermine if light is a variable to alter.)
Optional: Set up different sets of beakers yourselfand label them prominently. (Note: Ideally studentsprepare the beakers themselves.)
4

5
Preparation
If you are unable to download software to yourcomputers then we recommend using Google Maps(https://www.google.com/maps). The followinglink provides an excellent tutorial for you and yourstudents on creating and sharing google maps(https://support.google.com/mymaps/answer/3024454?hl=en).
Bookmark the eutrophication animation below touse during Part 3 of the activity. http://coseenow.net/blog/2008/11/eutrophication-animation/.
Make copies of the Student Reading—Introduction toGTM, Student Reading—Nutrients in an Estuary,Student Worksheet—Nutrients in an Estuary, andStudent Data Sheet—GTM 2002-3 Nutrient Data.
Procedure
Part 1 — Nutrients in an Estuary
NOTE: You may want to begin Part 1 a full two weeks before beginning Parts 2 and 3.
1. Ask students why estuaries are one of the mostproductive ecosystems in the world. What condi-tions exist in the estuary that would make it particu-larly productive? (Nutrients from land via runoff, surfacetributaries, and groundwater, mixing and circulation of nu-trients and oxygen by tides, abundance of food sources andprotective habitats make the estuary a good place for rearingof many types of juvenile organisms and for diversity of spe-cies.)
2. Ask students what types of nutrients estuaries needto support high productivity. Plants and animals neednitrogen and phosphorous, as well as many other trace nutri-ents. Nitrogen is a component of amino acids, enzymes,DNA, and proteins.) If your students are familiar withthe nitrogen cycle, you can suggest they considerhow it functions in estuaries.
3. Have teams of students brainstorm ways in whichthe estuary receives the nutrients it needs. Again, ifyour students are familiar with the nitrogen cycle,you can suggest they consider how it functions inestuaries. Have them discuss and/or record respons-es to the following questions:
• How do estuaries get necessary nutrients?
• Are these nutrients obtained and simply used upor are they cycled through the estuary?
4. Discuss the teams’ brainstormed ideas and answers.Ask if it is possible for an ecosystem to get too manynutrients.
5. Introduce the lab activity as a way of investigatingwhether estuaries can be affected by “nutrient over-enrichment.” Either explain the beakers you haveprepared, or using Part 1 of the Student Worksheet—Nutrients in an Estuary, have your students set up thevarious models.
If you have on both a fresh and salt (or brackish) source of water, have different teams of students do fresh and saltwater models. If you have only one water source, you may increase the number of varia-bles studied. For example, besides the amount of fertilizer in each beaker, different teams could vary the amount of sunlight their six models obtain; the pH of the water samples could be altered slightly by the addition of vinegar to sets of beakers.
6. Have students complete the Predictions portion ofthe Student Worksheet—Nutrients in an Estuary and thendiscuss student predictions about the beakers.
7. Take a digital picture of each set of beakers every twoor three days for two or three weeks. Or have stu-dents take their own digital images. Load the imagesinto a data file for later comparison.

6
Check for Understanding
Question 3e is the summary assessment for this activity. It directs students to “Write a short letter to the town council of this region outlining your recommendations about steps to take to reduce the amount of nutrient flow into the estuary.”
Optional Extension Inquiries Map and analyze the area around the nearest NERRS site to your region. Have students use Google Maps, as well as other maps and resources, to create a map deline-ating possible sources of nutrients for the estuary (i.e., farmland and sewage treatment plants). Then have stu-dents download the past year of SWMP data for nutri-ents from the https://coast.noaa.gov/swmp/ site for that estuary. Finally, have students look for patterns or cycles of change in the nutrient data and then propose what point sources or natural sources might be responsi-ble for those patterns or cycles of change.
8. After students have completed their observations,display the series of images and have students com-plete Part 1 of the Student Worksheet—Nutrients in anEstuary. Discuss the models and results.
Note: Consider having students read the Student Reading—Introduction to GTMNERR and Student Reading—Nutrients in an Estuary for homework as preparation for Parts 2 and 3.
Part 2 — Using Data to Study Eutrophication and Conditions in an Estuary
1. Have students read the Student Reading—Introductionto GTMNERR and Student Reading—Nutrients in anEstuary.
2. Project a map of the GTMNERR with Google Mapsand show students where the monitoringstations are. Ask students which stations are closestto a source of salt water and which ones are relative-ly far away from the ocean.
3. Have students complete Part 2 of the StudentWorksheet—Nutrients in an Estuary.
4. Discuss the readings, tasks, and questions of Part 2.
Part 3 — Eutrophication and the Nitrogen Cycle
1. Project or have students watch the animationillustrating eutrophication and algal blooms found at:http://peconice.ipower.com/Nutrients.animation.html
2. Have students complete Part 3 of the Student Work-sheet—Nutrients in an Estuary.
3. Discuss the questions. Have several students readtheir letters (question 3f) aloud to the class.

7
Teacher Worksheet with Answers Nutrients in an Estuary
Part 1 — Nutrients in an Estuary
1a. How do you think the amount of fertilizer will affect the amount of algae in each of the samples?
Answer: Student answers will vary.
1b. How do you think the algal growth will differ between the freshwater and saltwater samples?
Answer: Student answers will vary.
1c. How is this experiment different from conditions in an actual estuary that receives excess nutrients?
Answer: Student answers will vary.
1d. How did the amount of fertilizer affect the amount of algae in each of the pond/stream samples?
Answer: The amount of algae increases as the concentration of fertilizer increases.
1e. How did the algal growth differ between the freshwater and saltwater samples?
Answer: The saltier the water, the less abundant the pond algae will be.
1f. Explain using the process of photosynthesis how the level of dissolved oxygen varies with increasing amounts of living algae.
Answer: As algae increase in amount, more oxygen is produced thereby initially increasing DO levels in the water.
1g. Explain using the process of decomposition how the level of dissolved oxygen would vary in the beakers as the algae die and settled to the bottom.
Answer: Bacteria use oxygen during the process of decomposition, effectively lowering DO levels.
Part 2 — Using Data to Study Eutrophication and Conditions in an Estuary
2a. Compare 16-month nitrogen and chlorophyll-a values for each site. During which seasons do peak values seem to occur at most sites? Why do you think so?
Answer: These blooms usually occur seasonally. In the northern hemisphere, they typically occur between late spring and October. Heavier use of fertilizers in the spring combined with spring rains can introduce excess nutrients to an estuary. Other conditions that favor algal blooms come into play in the months from summer to fall: bright sunlight, still water and sharp temperature gradients that keep warmer surface water and colder bottom water from mixing.

8
2b. Do you see a clear pattern that shows a relationship between TN and chlorophyll-a?
Answer: The authors of the study acknowledge: “The absence of well-defined relationships between nutrient concentration and phytoplankton biomass (i.e. chlorophyll-a) is not unusual for estuarine ecosystems, even those subject to substantial eutrophication (Borum, 1996; Cloern, 2001).” P. 15 Journal of Coastal Research, Special Issue No. 45, 2004
2c. Which four sites seem to show the strongest correlation between TN and chlorophyll-a?
Answer: The authors found significant correlations between chlorophyll-a and TN at all four Indian River lagoon sites, but no significant corre-lations between chlorophyll-a and TN within the GTM NERR sites. The sites showing the strongest correlations are Titusvillle, Vero, and Eau Gallie.
2d. What other factors do you think determine whether or not nutrient input will cause algal blooms?
Answer: Tidal flushing, including tidal excursion, freshwater inflows, wind, water stratification, and depth.
2e. If the chlorophyll-a threshold for an algal bloom is 20 ug/L, which sites may have experienced algal blooms during the period of observation?
Answer: Given the threshold of 20 ug/L, Eau Gallie had two algal blooms, while Titusville, and Vero had one each.
2f. Looking at the chart, what conclusion can you make about the influences of nutrient loading and residence time on chlo-rophyll-a concentrations?
Answer: Regions with short water residence times have lower peak phytoplankton abundance than regions with longer residence times even despite differences in nutrient load index.
Sites within the GTM NERR all had relatively low residence times, lower average chlorophyll-a concentrations, and generally lower peak chlorophyll-a concentrations. Residence times at Indian River Lagoon sites varied, but two of the sites had RTI of 3 and 4. These sites generally had higher average chlorophyll-a concentrations, and two sites had the highest peak chlorophyll-a concentrations.
Part 3 — Eutrophication and the Nitrogen Cycle
3a. Where does most of the nitrogen that flows into an estuary come from?
Answer: Most of the nitrogen that flows into an estuary comes from runoff from the land into rivers and streams that feed into the estu-ary.
3b. What is the relationship between microbial activity during algal decomposition and DO levels in an estuary?
Answer: Bacteria break down algae and use oxygen in the process, driving DO levels lower.
3c. What causes the daily cycle of change in dissolved oxygen content in water?
Answer: During nighttime hours, decomposition uses oxygen but plants cannot photosynthesize so DO levels are always lower at night. Anoth-er big reason why DO goes down at night is because plants respire around the clock but only photosynthesize in the daylight.

9
3d. Name three possible human-caused sources of excess nutrients in this region.
Answer: Animal wastes, fertilizer from farms, leaking septic systems, and direct discharge of waste from industrial plants or sewage treat-ment plants.
3e. What do you think the effect of a heavy rainfall event in this region would have on the:
• level of nutrients in the estuary?
Answer: Heavy rain washes loads of nutrients from the sources mentioned in question 3d.
• level of dissolved oxygen in the estuary?
Answer: Initially the level of oxygen increases, but as algae and algal mats die, DO can decrease dramatically.
• development of seagrass and other aquatic plants?
Answer: As seen in a previous image, increased algae cause decreased sunlight for seagrass to photosynthesize so growth is inhibited orstopped completely.
• population of aquatic organisms such as clams, crabs, and snails?
Answer: Plunging DO levels can cause hypoxic and eventually anoxic conditions that can cause massive extinction events ofcertain species.
Assessment
3f. Write a short letter to the town council of this region outlining your recommendations about steps to take to reduce the amount of nutrient flow into the estuary.
Students may mention moving industrial plants and limiting outflow of waste products into the estuary, and limiting grazing and farming in proximity of riverbanks.
A brochure written by Florida Sea Grant Extension (available at: http://ufdc.ufl.edu/IR00003044/00001 pgs 8-9*) suggests the following actions:
1. Limit urban development, especially along shorelines.
2. Preserve wetland buffers or green space and submerged aquatic vegetation associated with coastlines, rivers, and streams.
3. Limit the use of fertilizers on residential and commercial lawns and landscaping.
4. Manage storm water runoff.
5. Use better septic systems.
6. Improve sewage treatment plants.
7. Support efforts to improve our knowledge.
* Hauxwell, J.; Jacoby, C.; Frazer, T.; Stevely, J. Accessed: 2008-07-30. http://www.webcitation.org/5ZhWgbRvv