taylor wimpey thermal imaging projecteprints.leedsbeckett.ac.uk/5066/18/report 2017-11-08 pipers...
TRANSCRIPT

Citation:Miles-Shenton, D (2018) Small Scale Forensic Thermal Imaging Study. Technical Report. KnaufInsulation.
Link to Leeds Beckett Repository record:http://eprints.leedsbeckett.ac.uk/5066/
Document Version:Monograph
The aim of the Leeds Beckett Repository is to provide open access to our research, as required byfunder policies and permitted by publishers and copyright law.
The Leeds Beckett repository holds a wide range of publications, each of which has beenchecked for copyright and the relevant embargo period has been applied by the Research Servicesteam.
We operate on a standard take-down policy. If you are the author or publisher of an outputand you would like it removed from the repository, please contact us and we will investigate on acase-by-case basis.
Each thesis in the repository has been cleared where necessary by the author for third partycopyright. If you would like a thesis to be removed from the repository or believe there is an issuewith copyright, please contact us on [email protected] and we will investigate on acase-by-case basis.

Dominic Miles-Shenton Leeds Sustainability Institute 1
Taylor Wimpey – Thermal Imaging Project
Site: Pipers Green
Crigglestone
WF4 3HY
Visit Date: 8th November 2017
Plot(s): 288
House Type: PA48 – Shelford
Full-fill Masonry, 2-Storey, 4-Bed Detached
Floor Plans:
Environmental Conditions: Internal Temperature 22 °C External Temperature 8.2 °C
Internal RH 51 % External RH 62%
Wind Speed 0.2 ms-1 Wind Direction SW
Clear skies, no rain in preceding 18 hours.
Pressure Test Results:
Depressurisation Only Pressurisation Only Mean
m3/(h.m2)@50Pa ach-1 r2 m3/(h.m2)@50Pa ach-1 r2 m3/(h.m2)@50Pa ach-1
4.65 4.22 0.999 4.98 4.51 1.000 4.81 4.37

Dominic Miles-Shenton Leeds Sustainability Institute 2
Observations: The thermal images below are shown on varying temperature scales to highlight what was being observed,
please take into account these different image spans when directly comparing images. The minimum span
used is 5° so as not to over-exaggerate any thermal anomalies observed.
Thermal images under depressurisation were captured at an average pressure of -52.4 Pa.
External - Under natural conditions
NE Front Façade Some direct sunlight on the East-facing bay wall is apparent. First floor trickle vents had been left open making it difficult to assess whether there is additional unplanned heat loss at the eaves. Warmer area above bay roof possibly due to a radiator directly under the window in Bedroom 1.
Southerly wind resulted in warm air emerging from the underfloor vents. There also appears to be a warmer band around the ground floor perimeter which extends around the whole dwelling, possibly due to a thermal bridge as the internal IR images also show the floor/wall junction to be cooler than expected. I don’t know if a cavity tray was fitted preventing the blown insulation getting down below, but this resemble instances where I have observed this previously.
NW Gable

Dominic Miles-Shenton Leeds Sustainability Institute 3
SE Gable Direct solar impinging on the SE gable, the front part is shown shaded but had direct solar within the last 2 hours.
Lounge – Under natural conditions
The warmer strip seen from outside at the ground floor perimeter can be observed as a colder area at the floor/wall junctions from inside the dwelling. Without any mixing of air inside the house there would be some natural temperature stratification internally, but this unlikely to

Dominic Miles-Shenton Leeds Sustainability Institute 4
account for the significantly cooler surface temperatures at the base of the external walls. The temperature difference between the wall surface on and off the plasterboard adhesive dabs appears to reduce near the base of the wall. The internal surface of the bay roof appears cooler than the external elements around it, but due to cold air ingress at the trickle vents and reflection of the cooler windows it is difficult to analyse. The bay window jambs appear to show no significant issues, an area where problems are commonplace.
Dominic Miles-Shenton Leeds Sustainability Institute 5
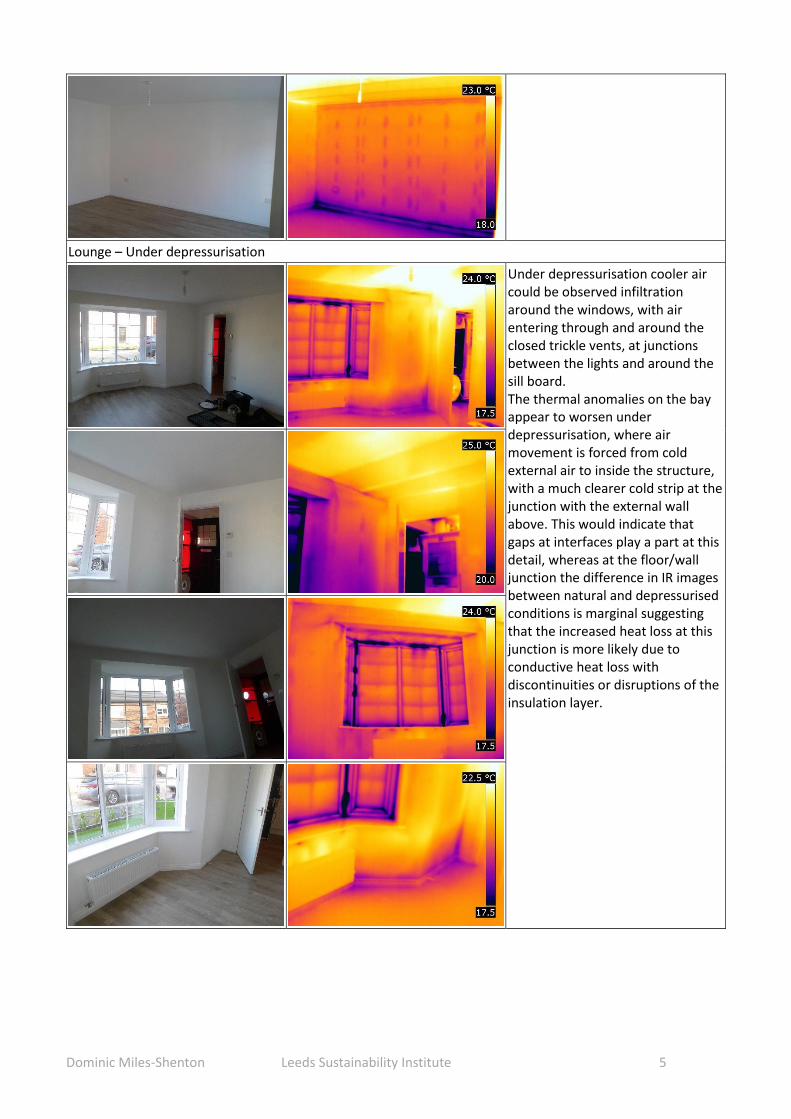
Lounge – Under depressurisation
Under depressurisation cooler air could be observed infiltration around the windows, with air entering through and around the closed trickle vents, at junctions between the lights and around the sill board. The thermal anomalies on the bay appear to worsen under depressurisation, where air movement is forced from cold external air to inside the structure, with a much clearer cold strip at the junction with the external wall above. This would indicate that gaps at interfaces play a part at this detail, whereas at the floor/wall junction the difference in IR images between natural and depressurised conditions is marginal suggesting that the increased heat loss at this junction is more likely due to conductive heat loss with discontinuities or disruptions of the insulation layer.

Dominic Miles-Shenton Leeds Sustainability Institute 6
Dining / Kitchen – Under natural conditions

Dominic Miles-Shenton Leeds Sustainability Institute 7
The previously observed phenomena at the floor/wall junction was again apparent. Where the patio doors are positioned further out in the external wall the floor surface appears to get noticeably cooler, possibly due to greater thermal bridging.

Dominic Miles-Shenton Leeds Sustainability Institute 8
Dining / Kitchen – Under depressurisation

Dominic Miles-Shenton Leeds Sustainability Institute 9
The floor surface at the patio doors does not change significantly under depressurisation, indicating again this is a bridging issue rather than to do with air movement. Air infiltration is an issue, with both direct infiltration from outside around the windows and indirect air movement around service penetrations, into the boxed-in service riser and into the intermediate floor void.

Dominic Miles-Shenton Leeds Sustainability Institute 10
Ground Floor WC – Under natural conditions
Ground Floor WC – Under depressurisation

Dominic Miles-Shenton Leeds Sustainability Institute 11
Some air movement behind the plasterboard dry lining observed, it is unclear of the source and direction of movement but tends to look as if the air is coming from the adjacent study.
Study – Under natural conditions
Plasterboard adhesive dabs appear coolest where the utilities meter boxes are situated on the external walls. Some temperature stratification across the intermediate floor void can be observed, but it is unclear whether this is heat from the heating system pipework spreading toward the outside or cooler air from the gable wall junctions spreading inside.

Dominic Miles-Shenton Leeds Sustainability Institute 12
Study – Under depressurisation
SE Gable, position of electricity and gas meter boxes are more apparent under depressurisation, it is difficult to determine how much of the additional heat loss in this area is due to reduced insulation and how much is due to infiltration into the void behind the plasterboard dry lining. However, as air movement in this void may be continuing into the adjacent downstairs WC, it could be the major factor.

Dominic Miles-Shenton Leeds Sustainability Institute 13
Hall – Under natural conditions
A colder area at the junction of the external wall with the intermediate floor and boxed void was not observed from the external IR images.

Dominic Miles-Shenton Leeds Sustainability Institute 14
Hall – Under depressurisation
The indirect infiltration by the external wall junction with the lounge wall appears to be due to the penetration for the outside light. The colder area at the junction of the external wall with the intermediate floor and boxed void appeared to worsen under depressurisation, this is deemed due to increased air movement which can be seen extending down the service void.
Natural
Depressurised
En-Suite – Under natural conditions

Dominic Miles-Shenton Leeds Sustainability Institute 15
Colder areas are visible at the junction of the ceiling and external wall, extending down the service void to the right of the window. The service void to the left of the window show warmer timbers than the air voids behind but no distinct thermal gradient beyond the natural temperature stratification in the room. This void was not present on the drawings supplies:
Additionally, there appears to be some dislocation of the loft insulation around ceiling penetrations.
En-Suite – Under depressurisation
Air being drawn in from the loft space was observed into the service voids, around ceiling penetrations and into the internal partition wall by the shower cubicle.

Dominic Miles-Shenton Leeds Sustainability Institute 16
Bedroom 1 – Under natural conditions
At ceiling level, under natural conditions, air would be expected to be leaving the building. This warmed air moving from behind the plasterboard to the loft space would be expected to make the tops of the external wall perimeter appear warmer, but there is still a clear colder section of wall at this junction at the wall plate and directly beneath the gable wall spandrel panels, raising questions about potential thermal bridging at these junctions. The cooler areas of ceiling where addition timbers between the trusses dislodge the loft insulation

Dominic Miles-Shenton Leeds Sustainability Institute 17
from direct contact with the ceiling are not excessive. The stratification of temperatures of the intermediate floor void visible from below is also clear from above. Thermal bridging at jambs/head/sill is also apparent but not excessive.

Dominic Miles-Shenton Leeds Sustainability Institute 18
Bedroom 1 – Under depressurisation
Under depressurisation colder air can be seen being drawn in from the loft through ceiling penetrations, into the void behind the plasterboard dry lining and into some partition wall voids and emerging at places at the intermediate floor perimeter. The external wall at the ceiling perimeter, in particular, looks significantly colder than under natural conditions due to the change in air movement direction suggesting that air movement has a greater effect here than any thermal bridging or insulation discontinuity issues.

Dominic Miles-Shenton Leeds Sustainability Institute 19
Bedroom 4 – Under natural conditions

Dominic Miles-Shenton Leeds Sustainability Institute 20
Repeat of the observations for Bedroom 1.
Bedroom 4 – Under depressurisation
Repeat of the observations for Bedroom 1.

Dominic Miles-Shenton Leeds Sustainability Institute 21
Bathroom – Under natural conditions
As previously observed in the bedroom, with the cold strip at the wall plate more obvious in comparison to the boxed-in service void next to it.
Bathroom – Under depressurisation
As in the En-suite, cold air is drawn in around ceiling penetration, into the void behind the dry lining and into the boxed-in void.
Bedroom 3 – Under natural conditions

Dominic Miles-Shenton Leeds Sustainability Institute 22
As previous bedrooms.

Dominic Miles-Shenton Leeds Sustainability Institute 23
Bedroom 3 – Under depressurisation
As previous bedrooms.

Dominic Miles-Shenton Leeds Sustainability Institute 24
Bedroom 2 – Under natural conditions
As previous bedrooms. The junction of the partition wall with the external wall backing on to the service void in the En-suite looks slightly cooler in places.

Dominic Miles-Shenton Leeds Sustainability Institute 25
Bedroom 2 – Under depressurisation
As previously observed in other bedrooms.

Dominic Miles-Shenton Leeds Sustainability Institute 26
Air can also clearly be observed being drawn down the junction of the partition wall with the external wall backing on to the service void in the En-suite, this void appear to link to the void behind the plasterboard on the external wall.
Landing – Under natural conditions

Dominic Miles-Shenton Leeds Sustainability Institute 27
Some areas of dislodged loft insulation appear, the level and span of the thermal image makes some of these appear worse than they are (e.g. the minimum temperature of 22.7 °C in the adjacent image) due to the nearby hot water cylinder.
Landing – Under depressurisation
Under depressurisation air could be seen infiltrating directly around ceiling penetrations, most significantly around the loft hatch door. Air could also be seen entering the internal partition wall voids.

Dominic Miles-Shenton Leeds Sustainability Institute 28
Loft – Under natural conditions
The NW gable showed no signs of significant thermal bridging beneath the spandrel panel, suggesting that the cooler strip at the ceiling perimeter observed in the bedrooms below is unlikely to be due to thermal bridging.

Dominic Miles-Shenton Leeds Sustainability Institute 29
Direct solar on the SE gable hampered thermal imaging, but again no excessive thermal bridging beneath the spandrel panel was observed.
The loft insulation itself appeared from above to be laid particularly diligently; many commonly observed errors had been avoided, with insulation inserted into the small gaps and well placed around awkward truss angles and penetrations.

Dominic Miles-Shenton Leeds Sustainability Institute 30
Pressure Test Spreadsheet:
0.665043299 4.583006643
0.008352913 0.029069961
0.999211859 0.0083431
0.640908167 4.760790915
0.004399495 0.015280399
0.999764451 0.00494345
0.665043299
date: Version 16d 19 June 2017 4.583006643 97.80802638
test house address: 0.640908167
company: 4.760790915 116.8382986
house type: 7
tester: 7
test reference number:
outdoor temp (°C) 8.2 °C
indoor temp (°C) 20.8 °C
outdoor humidity (%rh) 62.2 %RH
indoor humidity (%rh) 51 %RH
outdoor barometric pressure 1016.6 mbar or hPa kg/m3 677.1127628
indoor barometric pressure 1016.5 mbar or hPa kg/m3 1253.356575
temperature corr. fact. depress. 0.957
temperature corr. fact. press. 1.045
wind speed (m/s): 0.2
baseline pressure diff (Pa) (+/-) Pa
house width: 8.15 m
house depth: 8270 m
house height: 4.92 m
floor area: 129.05 m2
volume: 317.47 m3
envelope area including floor: 287.92 m2
Pressure Difference for ELA 10 Pa
RESULTS:
Q50 Mean Flow at 50Pa = 1386.27 m3/h
Mean Air Leakage at 50Pa = 4.37 h-1
Mean Air Permeability at 50 Pa = 4.81 m/h or m3h/m
2
Equivalent Leakage Area = 0.055 m2 at 10 Pa
DEPRESSURISATION RING -
O,A,B,C,D,E
for BD3
0,1,2,3 for
DuctBB
MEASURED FAN
PRESSURE (Pa)
Max. 90 Pa
MEASURED
FLOW (m3/h)
ADJUSTED
FLOW (m3/h)
FLOW RANGE OK
FOR SELECTED
RING?
Adjusted
Pressure
(Pa)
Ln delta
P
Ln Q Q50 Calculated
Flow at 50Pa
(m3/h)
Permeability
Depressurisation
Only (m3/(h.m
2))
Air Leakage
Depressurisation
Only (h-1
)
Approx 65 Pa b 53.3 1427 1362.8 OK 53.3 3.976 7.217 1339.21 4.65 4.22
Approx 57 Pa b 45.6 1311 1252.0 OK 45.6 3.820 7.132 r2 0.999
Approx 49 Pa b 39 1177 1124.0 OK 39 3.664 7.025 Cenv 97.808 m3/h.Pan
Approx 41 Pa b 34.2 1066 1018.0 OK 34.2 3.532 6.926 n 0.665
Approx 33 Pa b 27.7 940 897.7 OK 27.7 3.321 6.800
Approx 25 Pa b 21.2 776 741.1 OK 21.2 3.054 6.608 CL (corrected) 99.303 m3/h.Pan
Approx 20 Pa b 17.3 682 651.3 OK 17.3 2.851 6.479
PRESSURISATION RING -
O,A,B,C,D,E
for BD3
0,1,2,3 for
DuctBB
MEASURED FAN
PRESSURE (Pa)
Max. 90 Pa
MEASURED
FLOW (m3/h)
ADJUSTED
FLOW (m3/h)
FLOW RANGE OK
FOR SELECTED
RING?
Adjusted
Pressure
(Pa)
Ln delta
P
Ln Q Q50 Calculated
Flow at 50Pa
(m3/h)
Permeability
Pressurisation
Only (m3/(h.m
2))
Air Leakage
Pressurisation
Only (h-1
)
Approx 65 Pa b 54.9 1442 1510.0 OK 54.9 4.006 7.320 1433.33 4.98 4.51
Approx 57 Pa b 46.7 1314 1375.9 OK 46.7 3.844 7.227 r2 1.000
Approx 49 Pa b 40.2 1197 1253.4 OK 40.2 3.694 7.134 Cenv 116.838 m3/h.Pan
Approx 41 Pa b 34 1070 1120.4 OK 34 3.526 7.021 n 0.641
Approx 33 Pa b 27 925 968.6 OK 27 3.296 6.876
Approx 25 Pa b 21.4 795 832.5 OK 21.4 3.063 6.724 CL (corrected) 116.805 m3/h.Pan
Approx 20 Pa b 14.9 628 657.6 OK 14.9 2.701 6.489
WARNING!!
Extreme Test
Conditions
New build, masonry, blown full-fill, detached
Calculated Outdoor Air Density
Calculated Indoor Air Density
description of main construction details:
1.26
1.20
Note: ENSURE THAT FLOW SETTINGS ARE IN m3/h - When using the DG700 gauge
run baseline pressure adjustment for minimum 60s with fan switched on but not
rotating
Model 3 with DG700Blower Door & Gauge Used
MINNEAPOLIS BLOWER DOOR DATA INPUT AND CALCULATION
08/11/2017
Plot 288 - St James Way, Crigglestone, Wakefield, WF4 3HY
Knauf Insulation - Taylor Wimpey
Shelford
DMS
6.4
6.5
6.6
6.7
6.8
6.9
7.0
7.1
7.2
7.3
2.0 3.0 4.0 5.0
Ln
Q
Ln ΔP
DEPRESSURISATION
6.4
6.5
6.6
6.7
6.8
6.9
7.0
7.1
7.2
7.3
7.4
2.0 3.0 4.0 5.0
Ln
Q
Ln ΔP
PRESSURISATION
0.0
200.0
400.0
600.0
800.0
1000.0
1200.0
1400.0
1600.0
0 25 50 75 100
Q
Δ P
Depressurisation
0.0
200.0
400.0
600.0
800.0
1000.0
1200.0
1400.0
1600.0
0 25 50 75 100
Q
Δ P
Pressurisation