taxonomic status of the rana sauteri complex: discordance
TRANSCRIPT
169
Taxonomic status of the Rana sauteri complexdiscordance between genetic and morphological traits
Fu-Hsiung Hsu1 Ruey-Shing Lin2 Sheng-Hai Wu3 amp Chu-Fa Tsai2
1Department of Biological Resources National Chiayi University Taiwan2Endemic Species Research Institute Council of Agriculture Taiwan
3Department of Life Sciences National Chung-Hsiung University Taiwan
Rana sauteri Boulenger 1969 and R multiderticulata Chou amp Lin 1997 are two sister species of brown frogs in Taiwan They are distinguishable by the number of labial tooth rows (LTR) of tadpoles We investigated morphometric and genetic (mtDNA cytb sequences) traits of 331 tadpoles of the two species and their putative hybrids from 32 locations along two transects LTR correlated significantly with other morphometric traits and showed a longitudinal cline that increased from west to east across the central mountain range Genetic differentiation was significant between the two transects and correlated significantly with geographic distances However mtDNA haplotype distributions were indiscernible between the three LTR groups and uncorrelated with other morphometric traits Individuals of the two sister species also failed to form monophyletic lineages We argue that LTR is a phenotypically plastic trait related to stream current determined by elevation and monsoon rainfalls and conclude that R sauteri is the sole representative species with R multiderticulata being its synonym
Key words morphometric traits mtDNA cytb sequences Rana multiderticulata tadpole taxonomy
HERPETOLOGICAL JOURNAL 21 169ndash179 2011
Correspondence Fu-Hsiung Hsu Department of Biological Resources National Chiayi University 300 University Road Chiayi 600 Taiwan ROC E-mail richbearmailncyuedutw
INTRODUCTION
The analysis of concordance between genetic and morphological traits is an important current subject
in evolutionary biology providing insights into process-es that shape divergence among populations (Ballard amp Melvin 2010) Neutral haplotypes and heritable pheno-types provide historical records of population divergence They are expected to show concordant variation if they share the same evolutionary history (Grady amp Quattro 1999 Crandall et al 2000) although several recent studies have shown that genetic divergence does not co-incide with morphological divergence (Babik et al 2005 Johnsen et al 2006 Leacheacute amp Cole 2007 Richards amp Knowles 2007)
The main evolutionary forces that shape geographical variation in morphological traits are assumed to be genetic drift and natural selection (Grady amp Quattro 1999 Rudh et al 2007) However recent divergence (Lorenzen et al 2006) sex-biased life history introgression of genes in-tense selection (Avise 1994 2000 Gompert et al 2006 Richards amp Knowles 2007) and phenotypic plasticity (Sutherland et al 2009) may account for a discordance between genetic and morphological traits Phenotypic plastic traits or locally adapted traits that are congruent for a species generally pose difficulties for species de-lineation (Ghalambor et al 2007)
Rana sauteri Boulenger 1909 is a common brown frog from Taiwan It is widely distributed in the central moun-tain range and its peripheral hills and adjacent coastal plains at elevations of 100 to 3000 m above sea level (Lue et al 1990) Mature frogs aggregate in lotic habi-tats for breeding Tadpoles possess an abdominal sucker and an enlarged oral disc an adaptation to fast-flowing
streams and to graze algae (Chou amp Lin 1997a) In west-ern Taiwan R sauteri shows obvious altitudinal clines in life-history traits As temperature decreases with in-creased elevation its breeding season shifts from fall and winter (OctoberndashDecember) to spring (May) the breed-ing period shortens and the larval period extends from five to 12 months (Lai et al 2003)
Chou amp Lin (1997a) found a geographical cline in the shape of the upper jaw sheath and the number of labial tooth rows (LTR) of R sauteri tadpoles They described frogs from the western slope at low elevations of the cen-tral mountain range in western Taiwan as R sauteri frogs from the western slope at high elevations and those from the eastern slope in eastern Taiwan as R multidenticulata and frogs from the western slope between the ranges of the two species as their hybrids (R sauteri x R multi-denticulata Chou amp Lin 1997b) However tadpoles can exhibit remarkable phenotypic plasticity (Sutherland et al 2009) and adults of R sauteri and R multidenticulata are indistinguishable in morphology (Tanaka-Ueno et al 1998 Che et al 2007)
Molecular methods are a suitable tool for assessing the taxonomic status of amphibians (Storfer et al 2009) Studies based on mtDNA sequences of the R sauteri complex have recently shown that genetic variation can differ from the geographical cline of LTR (Tanaka-Ueno et al 1998 Jang-Liaw amp Lee 2009) However genetic traits were investigated at small geographic scales and not compared with morphological traits The objectives of this study are to examine genetic and morphological traits of tadpoles of the R sauteri complex to determine their relationships and possible evolutionary processes in differentiation and to determine the taxonomic status of the two species involved
170
MATERIALS AND METHODSTadpole collectionIn all 331 tadpoles were collected at 32 locations in the central-northern region of Taiwan between August 2002 and December 2003 A northern (sampling locations N1ndashN17) and a southern (sampling locations S1ndashS15) transect were established (Fig 1 Table 1) Each location was searched for tadpoles in ravine streams Between seven and 12 individuals were randomly sampled at each location and preserved in 70 ethanol
Morphometric measurementsWe determined the developmental stage of each tadpole collected according to the stages defined by Gosner (1960) All tadpoles were between Gosner stages 27 and 33 with completely developed oral parts subsequent tadpole de-velopment does not affect LTR (Bonacci et al 2008) A total of 17 morphometric traits were examined The three traits based on LTR were the number of continuous tooth
rows on upper labium (CTR) the number of interrupted tooth rows on the upper labium (ITR) and the number of tooth rows on the lower labium (TRL) Tadpoles were divided into groups I II and III representing R sauteri hybrids and R multidenticulata respectively (following Chou amp Lin 1997ab)
Other morphometric traits measured were snoutndashvent length (SVL) maximum body height (BH) body width at spiracle (BW) snoutndashnostril distance (SND) snoutndashspiracle distance (SSD) eyendashnostril distance (END) eyeball diameter (EBD) internostrial distance (IND) interorbital distance (IOD) mouth width (MW) tail length (TL) maximum tail height (TH) maximum cau-dal muscle height (CMH) and maximum caudal muscle width (CMW) (Chou amp Lin 1997a Altig amp McDiarmid 1999 Grosjean 2005) SND END EBD IND and IOD were measured with a graduated ocular micrometer under a stereo-microscope and the other traits were measured with a digital caliper (Mitutoyo 500ndash196) to the nearest 001 mm
DNA extraction and sequencingGenomic DNA was isolated from tail tissue using the phenol-chloroform method (Hoelzel 1992) and QIAGEN DNeasy extraction kits (QIAGEN Inc) We sequenced a region of mtDNA including the cytochrome b gene (cytb) using primers L14850 (5rsquo-TCTCA TCCTG ATGAA ACTTT GGCTC-3rsquo) and H15502 (5rsquo-GGATT AGCTG GTGTG AAATT GTCTG GG-3rsquo) (Tanaka-Ueno et al 1998 Goebel et al 1999) Amplification was performed in accordance with the following protocol a hot start at 94 degC for 2 min followed by 36 cycles at 94 degC for 40 sec 55 degC for 1 min 72 degC for 2 min and a final ex-tension at 72 degC for 10 min PCR products were purified by Gel-M Gel Extraction Kit (Viogene) and directly se-quenced with an ABI3100 automated sequencer (Perkin Elmer Inc) Sequences were edited with BIOEDIT 509 (Hall 1999) aligned with CLUSTAL_X 17 (Thompson et al 1997) and confirmed to be 596 bp in total length from both strands Unique mtDNA cytb sequences used in this study were deposited at GenBank (accession nos HM989036ndash989366)
Genetic traits and phylogenetic analysisHaplotype diversity (Hd) and nucleotide diversity (π) (Nei 1987) were calculated with DNASP 353 (Rozas amp Rozas 1999) The number of polymorphic sites and the mean number of pairwise differences among the cytb se-quences were also estimated In order to test for deviation from neutrality in the sequence data Tajimarsquos D (Tajima 1989) was calculated and compared to a beta distribution for significance testing
Maximum parsimony (MP) neighbour-joining (NJ) and Bayesian methods were employed for phyloge-netic reconstruction using R longicrus (accession no HM989035) as outgroup The MP tree reconstruction was performed in PAUP 40 (Swofford 2001) with gaps treated as missing data equal weight for transitions and transversions heuristic search with tree-bisection-recon-nection (TBR) branch swapping and 10 random addition replications MEGA 4 (Tamura et al 2007) was used
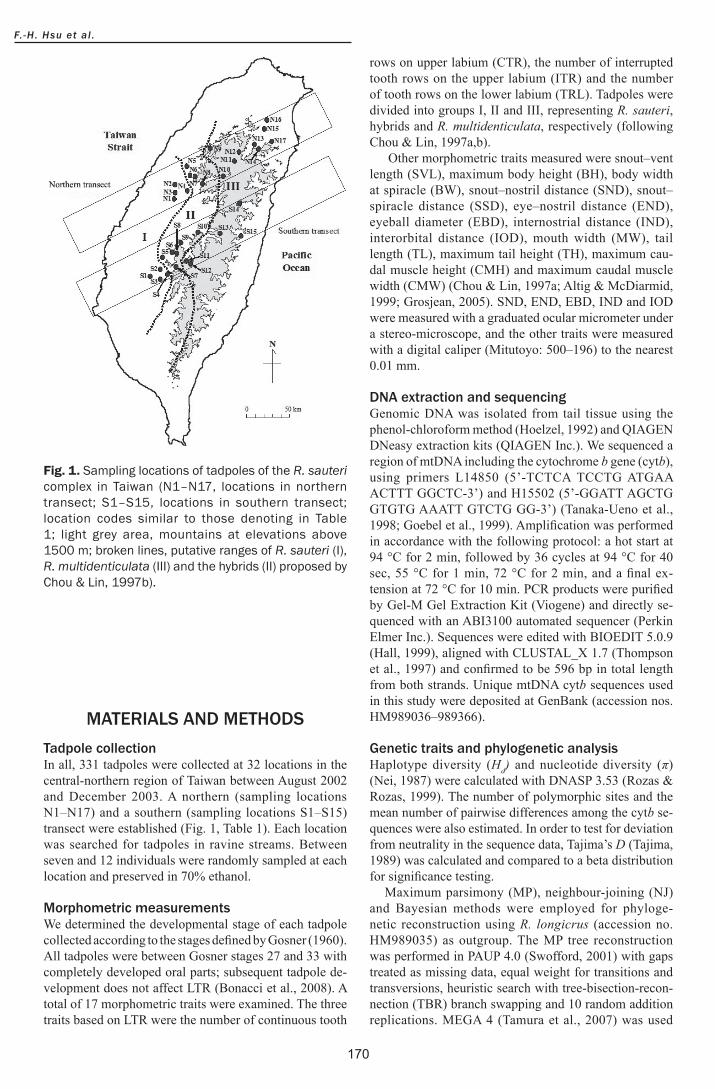
Fig 1 Sampling locations of tadpoles of the R sauteri complex in Taiwan (N1ndashN17 locations in northern transect S1ndashS15 locations in southern transect location codes similar to those denoting in Table 1 light grey area mountains at elevations above 1500 m broken lines putative ranges of R sauteri (I) R multidenticulata (III) and the hybrids (II) proposed by Chou amp Lin 1997b)
F -H Hsu et al
171
to produce an NJ tree Confidence of phylogenetic rela-tionships was assessed by 1000 nonparametric bootstrap replications The appropriate DNA substitution model for the Bayesian phylogenetic analysis was obtained by testing alternative models of evolution using Modeltest
version 37 (Posada amp Crandall 1998) MrBayes ver-sion 312 (Ronquist amp Huelsenbeck 2003) was used to perform a partition-likelihood Bayesian search Two simultaneous Metropolis-coupled Markov Chain Mon-te Carlo analyses were run each with four chains for
Taxonomy and trai t d iscordance of R sauter i complex
Code Location Latitude LongitudeEleva-
tion (m) n CTR ITR TRL
LTR groups Slopes
Northern transectN1 Huangjhukeng 24deg0447 120deg4522 180 10 2(10) 3(10) 4(10) I W
N2 Dakeng 24deg1044 120deg4627 250 8 2(8) 3(8) 4(8) I W
N3 Dawanjiao 24deg0633 120deg4651 250 11 2(11) 3(11) 4(8)5(3) I W
N4 Shangping 24deg0704 120deg5354 570 10 2(10) 3(10) 4(10) I W
N5 Meiyuan 24deg1918 120deg5319 750 8 3(8) 3(7)4(1) 5(3)6(3)7(2) II W
N6 Heping 24deg1708 120deg5411 560 9 2(7)3(2) 3(2)4(7) 4(1)5(8) II W
N7 Wushihkeng 24deg1647 120deg5623 700 8 2(4)3(4) 3(3)4(5) 4(1)5(2)6(5) II W
N8 Jiabaotai 24deg1134 121deg0051 570 11 2(1)3(10) 3(10)4(1) 4(1)5(10) II W
N9 Guanwu 24deg3006 121deg0502 1900 7 3(7) 4(7) 7(7) III W
N10 Jiayang 24deg1531 121deg1242 1450 9 3(9) 4(9) 6(2)7(3)8(4) III W
N11 Sihyuanyakou 24deg2344 121deg2108 2000 12 3(12) 4(12) 6(4)7(5)8(3) III W
N12 Nanshan 24deg2749 121deg2332 840 11 3(8)4(3) 3(2)4(9) 7(9)8(2) III E
N13 Renze 24deg3246 121deg3023 650 12 3(12) 4(11)5(1) 7(2)8(10) III E
N14 Taipingshan 24deg2925 121deg3206 1850 12 3(12) 4(12) 7(11)8(1) III E
N15 Datong 24deg4051 121deg3625 200 11 3(11) 3(1)4(10) 7(11) III E
N16 Shuanglianbi 24deg4516 121deg3720 410 12 3(12) 3(1)4(11) 6(2)7(9)8(1) III E
N17 Gulu 24deg3339 121deg4010 1000 12 3(12) 4(12) 7(6)8(6) III E
Southern transect
S1 Guanzihling 23deg2037 120deg3056 240 11 2(11) 3(11) 4(11) I W
S2 Chukou 23deg2622 120deg3622 260 12 2(12) 3(12) 4(12) I W
S3 Niaopu 23deg1946 120deg3644 270 10 2(10) 3(10) 4(10) I W
S4 Shanmei 23deg2207 120deg4017 380 12 2(12) 3(12) 4(12) I W
S5 Shuangsi 23deg3207 120deg3651 350 9 2(9) 3(8)4(1) 4(2)5(7) II W
S6 Caoling 23deg3505 120deg4211 550 11 2(11) 3(11) 4(3)5(8) II W
S7 Dabang 23deg2704 120deg4422 790 12 2(12) 3(7)4(5) 4(6)5(6) II W
S8 Fongshan 23deg3430 120deg4508 700 9 2(8)3(1) 3(9) 5(8)6(1) II W
S9 Sitou 23deg4010 120deg4750 1150 12 2(12) 3(12) 5(11)6(1) II W
S10 Dili 23deg4655 120deg5712 450 12 2(10)3(2) 3(2)4(10) 4(9)5(3) II W
S11 Alishan 23deg3101 120deg4836 2150 8 3(8) 4(8) 7(2)8(6) III W
S12 Zihjhong 23deg2957 120deg4859 2300 10 3(10) 3(1)4(9) 6(3)7(5)8(2) III W
S13 Haitiansih 23deg4524 121deg1013 2250 10 3(9)4(1) 3(1)4(9) 5(4)6(3)7(3) III W
S14 Muguasi 24deg0253 121deg2104 1450 10 3(10) 4(10) 7(3)8(7) III ES15 Wanrong 23deg4317 121deg2131 550 10 3(9)4(1) 3(1)4(9) 7(2)8(8) III E
Table 1 Sampling locations elevations sample sizes (n) and numbers of labial tooth rows (CTR continuous tooth rows on upper labium ITR interrupted tooth rows on upper labium TRL tooth rows on lower labium sample sizes in parentheses) of the three labial tooth row (LTR) groups (I II and III) of tadpoles of the R sauteri complex collected from 32 locations from the northern transect (N) and the southern transect (S) on the western slope (W) and the eastern slope (E) of the central mountain range of Taiwan
172
40000000 generations sampling trees every 1000 gen-erations We discarded the first 10000000 generations (10000 trees) on each run as ldquoburn-inrdquo after confirming chain stationarity from plots of likelihood against genera-tion The remaining trees were used to estimate posterior nodal probabilities and a summary of the phylogeny
Statistical analysisWe performed a discriminant function analysis (DFA) with STATISTICA version 70 to differentiate between the three LTR groups based on ln-transformed morpho-metric variables to address the assumption of normality (KolmogorovndashSmimov test Pgt005) The three LTR traits were discrete and did not follow a normal distribution and therefore were excluded from the DFA analysis We conducted an analysis of covariance (ANCOVA) using SVL as covariate and the locationrsquos mean of each of the other 13 morphometric traits to identify differences among three LTR groups and between two transects Spearman rank correlation (rs) analyses were conducted between total tooth rows (TTR = CTR + ITR + TRL) and morphometric traits
Geographic patterns of genetic differentiation were evaluated by analysis of molecular variance (AMOVA Excoffier et al 1992) This assessed the extent to which genetic variation was attributable to three hierarchical lev-els of subdivision among regions (groups of locations) among locations within regions and within locations AMOVA was first performed on the two geographical transects treated as regions and using the three LTR groups as regions The statistical significance of fixation indices (ΦCT ΦSC and ΦST) was tested by ARLEQUIN 2001 in nonparametric permutation with 10000 permutations against the null hypothesis that all individuals belonged to the same population (Schneider et al 2001)
Mantel tests were used to determine the relationships between TTR the other morphometric traits the genetic data and the geographical distances between sampling lo-cations The statistical significance of the relationships was based on 10000 random permutations implemented in PASSAGE (Rosenberg 2001) TTR distances were cal-culated as Euclidean pairwise distances in TTR among the 32 locations The other morphometric distances except SVL were calculated as Mahalanobis distances (Kolbe et al 2007) Pairwise genetic distances were cal-
LTR groups
CTR ITR TRL TTR
n Rows n Rows n Rows n Rows n
I 84 2 84 1000 3 84 1000 4 81 964 9 81 964 5 3 36 10 3 36
II 101 2 74 733 3 71 703 4 23 228 9 8 79
3 27 267 4 30 297 5 66 653 10 52 515
6 10 99 11 31 307
7 2 20 12 6 59
13 3 30
14 1 10
III 146 2 0 00 3 7 48 4 0 00 12 5 34
3 141 966 4 138 945 5 4 27 13 15 103
4 5 34 5 1 07 6 14 96 14 75 514
7 78 534 15 50 342 8 50 342 16 1 07
Table 2 Numbers of labial tooth rows of three labial tooth row (LTR) groups (I II and III) of the R sauteri complex (n number of tadpoles CTR continuous tooth row on upper labium ITR interrupted tooth row on upper labium TRL tooth rows on lower labium TTR total tooth rows = CTR + ITR + TRL)
Fig 2 Relationships between elevations and total labium tooth rows (TTR locationrsquos mean plusmn SD) of the R sauteri complex on the western slope (solid circles and solid line) and the eastern slope (open circles and dashed line) of central mountain range in Taiwan
F -H Hsu et al
173
culated as Slatkinrsquos linearized FST represented by FST (1 ndash FST) among the locations using ARLEQUIN 2001 Geographical distances (latitudes and longitudes) among locations were calculated using the online distance cal-culator (httpvldbgsigojpsokuchisurveycalcbl2stfhtml)
RESULTSLTR traitsBased on LTR traits individuals of the R sauteri complex were divided into three groups group I with 2 CTR 3 ITR and 4 (mode ranges 4ndash5) TRL group II with 2 (2ndash3) CTR 3 (3ndash4) ITR and 5 (4ndash7) TRL and group III with 3 (3ndash4) CTR 4 (3ndash5) ITR and 7 (5ndash8) TRL (Table 2) The number of LTR increased longitudinally (eastward) from group I to group III with the increase in elevation on the western slope of the central mountain range but not on the eastern slope (Figs 1 2 Table 1)
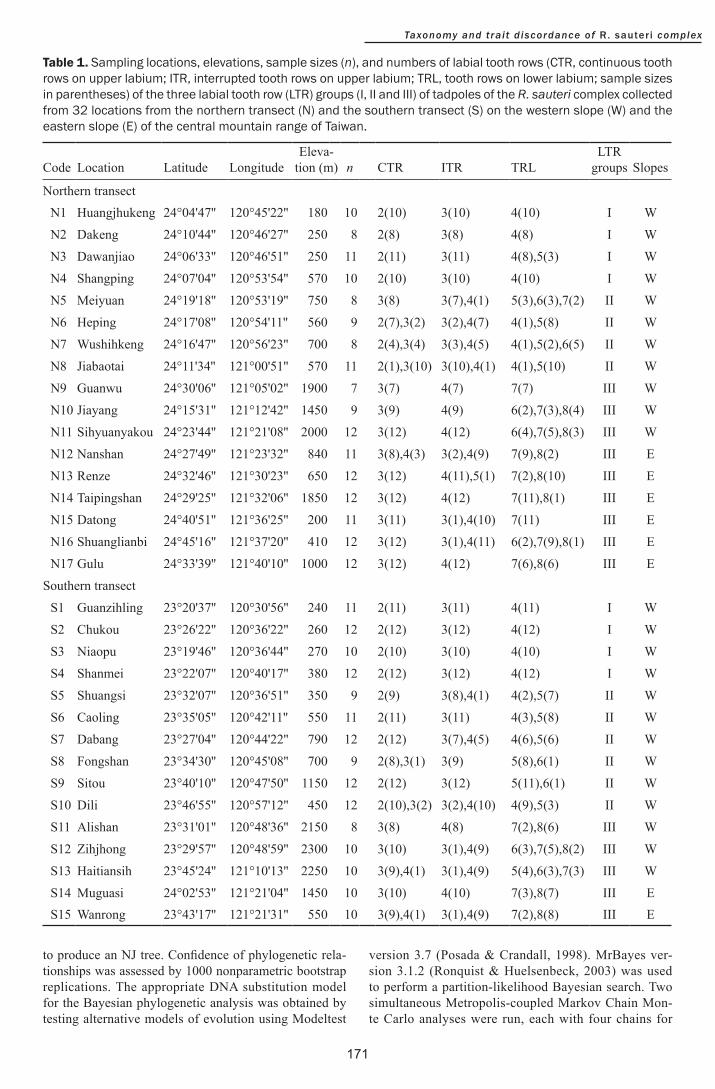
Morphometric variationThere was a significant difference in SND SSD EBD IOD MW TH and CMH (significant slope heterogeneity in TH and CMH) among all LTR groups significant dif-ferences in SSD MW and TL were also found between southern and northern transects (ANCOVA Plt005 Ta-ble 3)The positive correlation of TTR with MW SND and SSD suggested that the number of labial tooth rows is associated with the size of the oral disc related to MW and snout size represented by SND and SSD (Fig 3) The regression coefficient of 192 (Fig 3c) indicates that TTR is related to the square of MW proportional to the size of the oral disc
The DFA yielded two significant canonical variables The first was strongly influenced by SND and MW and explained 878 of the total variance The plot of the first two axes showed a remarkable separation of the mor-
Taxonomy and trai t d iscordance of R sauter i complex
VariablesThree LTR groups Two transects
R2-values F-values P-values R2-values F-values P-values
Body height 081 293 0070 078 104 0317Body width 090 117 0324 090 365 0066Snoutndashnostril distance 079 2526 lt0001 045 177 0193Snoutndashspiracle distance 095 1947 lt0001 045 636 0017Eyendashnostril distance 076 001 0997 077 043 0519Eyeball diameter 045 591 0007 027 220 0149Internostrial distances 088 097 0391 087 003 0862Interorbital distance 091 936 0001 085 001 0917Mouth width 078 1633 lt0001 063 841 0007Tail length 091 026 0774 093 484 0036Tail height 075 603 0007 065 075 0394Caudal muscle height 085 401 0029 081 040 0531Caudal muscle width 081 263 0090 077 001 0914
Table 3 Results of ANCOVA with snoutndashvent length (SVL) as a covariate for testing differences of locationrsquos mean of 13 other morphometric traits among three labial tooth row (LTR) groups and between two geographic transects for tadpoles of the R sauteri complex (n=32)
Fig 3 Relationships of total tooth rows (TTR) to snoutndashnostril distances (A) snoutndashspiracle distances (B) and mouth widths (C) of tadpoles of the R sauteri complex
174
phometric traits between groups I and III while group II overlapped widely with groups I and III (Fig 4)
Haplotype variationA total of 76 unique haplotypes were identified from the mtDNA cytb sequences of 331 tadpoles 58 were restrict-ed to a single location and 47 to a single tadpole There were 79 polymorphic sites 53 of which were parsimony informative and had no length variation The Hd-values among locations ranged between 0 and 0924 and the π-values ranged between 0 and 00167 Global Hd-values were 0935plusmn0007 (meanplusmnSD) and global π-values were 001287plusmn000076 The neutral expectation of the D val-
ues was not rejected (Tajimarsquos test D= ndash1169 Pgt01) suggesting that the cytb gene evolved under neutral ex-pectations
Forty-seven haplotypes were more abundant in the northern transect and 32 haplotypes were more abundant in the southern transect Hd -values were similar in the two transects The π-values and mean numbers of pair-wise differences (k) were two-fold higher for the southern transect than for the northern transect indicating a higher divergence in haplotypes in the former than the latter For three LTR groups the number of haplotypes (H) was highest for Group III while the π and k-values were high-est for Group II (Table 4)
PhylogenyThe average pairwise sequence divergences among hap-lotypes was 00165plusmn0135 with a range between 00017 and 00503 The MP analysis yielded a single most par-simonious tree with a length of 248 a consistency index of 059 and a retention index of 074 The NJ tree and Bayesian 50 majority-rule consensus tree had a topol-ogy identical with the MP tree
For the MP tree (Fig 5) there were three major line-ages (A B C) with a stepwise differentiation Lineage A represents the clade with the largest number of haplotypes (H1ndashH61) divided into three sub-lineages (Aa Ab and Ac) each contained haplotypes from three LTR groups Sub-lineage Aa encompassed 48 haplotypes (H1ndashH48) from 167 tadpoles of groups I II and III in the northern transect and 19 tadpoles of groups II and III in the south-ern transect All tadpoles of the sub-lineages Ab and Ac were from groups I II and III of the southern transect and consisted of 6 haplotypes from 20 tadpoles and 11 hap-lotypes from 90 tadpoles respectively (Table 4) Lineage B had 4 haplotypes with 20 tadpoles from group III and lineage C had 8 haplotypes with 15 tadpoles from groups I and II Evidently the three LTR groups were nested to-gether phylogenetically
Fig 4 Canonical plot between the first two canonical scores for 14 morphometric traits of tadpoles of the R sauteri complex (solid circles labial tooth rows (LTR) group I crosses group II open circles group III)
Partitions n H S K Hd π (times100)Haplotype groups
Aa Ab Ac B C
Transects Northern 173 47 57 3581 0891 0601 43(167) 4(6) Southern 158 32 60 8193 0894 1375 7(19) 6(20) 11(90) 4(20) 4(9)LTR groups Group I 84 19 41 5041 0902 0846 8(38) 1(1) 9(44) 1(1) Group II 101 25 46 8826 0866 1481 11(40) 2(3) 5(44) 7(14) Group III 146 48 52 6827 0910 1145 38(108) 4(16) 2(2) 4(20)Total 331 76 79 7669 0935 1287 48(186) 6(20) 11(90) 4(20) 7(15)
Table 4 Genetic variations of mtDNA cytb sequences of 331 tadpoles of the R sauteri complex in two geographical transects and three labial tooth row (LTR) groups (n sample size of tadpoles H number of total haplotypes S number of polymorphic sites k mean number of pairwise differences Hd haplotype diversity π nucleotide diversity number of haplotypes and number of tadpoles (in parentheses) in haplotype groups Aa Ab Ac B and C corresponding to those denoting lineages in the phylogenetic tree (Fig 5)
F -H Hsu et al
175
Genetic differentiationThe AMOVA results are shown in Table 5 There was a significant difference in genetic variances at each of the three hierarchical levels (between transects among loca-
tions within transects and within locations) The largest amount of genetic variance (553) was explainable by differences among locations within transects There was non-significant difference in the genetic variances among
Taxonomy and trai t d iscordance of R sauter i complex
Fig 5 A phylogenetic tree of the R sauteri complex reconstructed from the mtDNA cytb sequences with R longicrus as outgroup using maximum parsimony (MP) method (numbers above branches bootstrap values (gt50) supported by MPNJBayesian posterior probabilities H1ndashH76 haplotypes Aa Ab Ac B and C haplotype groups (clades) of lineages or sublineages N northern transect S southern transect I II III labial tooth row groups I II and III number of tadpoles in parentheses)
176
three LTR groups but significant difference among loca-tions within groups and within locations In other words the genetic differentiation was significant for tadpoles between the two transects but not among the three LTR groups
Relationships among genetic morphometricand geographical variationsTable 6 shows the results of Mantel tests for correlation among pairwise TTR distances morphometric distances and genetic as well as geographic distances The pair-wise genetic distances were significantly correlated with geographic distances but not with TTR and other mor-phometric distances There were significant positive correlations among geographic distances TTR distances and other morphometric distances Pairwise FST values among locations were 0564plusmn0322 suggesting high ge-netic differentiation among geographic populations
DISCUSSIONDiscordance of genetic and morphometric traitsLTRs of tadpoles of the R sauteri complex showed a longitudinal cline in both northern and southern transects (Figs 1 2 Table 1) but such a cline was not observed for cytb haplotypes Instead genetic differentiation differed significantly between the two transects but not among the three LTR groups In addition genetic distances were sig-nificantly correlated with geographical distances but not LTR or other morphometric distances Such discordance between genetic and phenotypic differentiations has also been detected in for example newts (Babik et al 2005) frogs (Richards amp Knowles 2007) lizards (Leacheacute amp Cole 2007 Kolbe et al 2007) and birds (Johnsen et al 2006)
Adaptive plastic phenotypesDifferences in oral structure of tadpoles among geo-graphical populations have been attributed to differences in phylogeny feeding habits and dietary specializations (Bonacci et al 2008) Rana dalmatina shows fewer upper labial tooth rows in smaller ponds because meta-morphosis is induced before attaining full development of oral structures (Bonacci et al 2008) Tadpoles of the
R sauteri complex that have a shorter tadpole period at low elevations (Lai et al 2002) may develop fewer tooth rows than those that have a longer tadpole period Larger oral discs have more tooth rows (McDiarmid amp Altig 2010) and the length of labial tooth rows is related to the microhabitat (Altig amp Johnston 1989)
Individuals of the R sauteri complex breed in streams of low current and low elevations during the dry season (autumn and winter) and at high elevations in strong current during the rainy season (spring and summer Lai et al 2003) In eastern Taiwan due to steep mountain slopes with northeast monsoon rainfalls streams are on average characterized by faster currents than in western Taiwan over the entire year Substrates in the streams were fairly homogeneous with mixtures of rubble and pebbles at low elevations while they were highly variable with more large boulders at the high elevations and in eastern Taiwan The longitudinal cline of LTR was found to cor-respond with longitudinal changes in stream current and substrate condition LTR traits are known to be associated
Table 6 Results of Mantel tests for correlations among genetic distances geographical distances total tooth row distances and other morphometric distances (r Mantel correlation coefficient italic Plt005) ln (km)
Matrix 1 Matrix 2r-
values P-
valuesGenetic distance Geographical
distance0119 00118
Genetic distance Total tooth row distance
0068 00614
Genetic distance Other morpho- metric distance
0124 00965
Geographical distance
Total tooth row distance
0401 lt00001
Geographical distance
Other morpho- metric distance
0262 00001
Total tooth row distance
Other morpho- metric distance
0402 lt00001
Structure Source of variance df Variance () Fixation index P-value
Two transects
Between transects 1 2585 ΦCT=0259 00001
Among locationswithin transects 30 553 ΦSC=0746 lt00001
Within locations 299 1884 ΦST=0812 lt00001
Three LTR groupsAmong groups 2 767 ΦCT=0077 00673
Among locationswithin groups 29 7133 ΦSC=0773 lt00001Within locations 299 2099 ΦST=0790 lt00001
Table 5 Analysis of molecular variances (AMOVA) of mtDNA cytb sequences of the R sauteri complex for two transects (northern and southern) and three labial tooth row (LTR) groups (I II and III)
F -H Hsu et al
177
with the size of the oral disc which is important for feed-ing in lotic habitats (Altig amp Johnston 1989)
Based on our results it is reasonable to consider that LTRs of tadpoles are a consequence of phenotypic plas-ticity It increases with enlargement of the oral disc corresponding with elevation and monsoon rainfalls The increase in LTR and size of the oral disk enables the tadpoles to grasp and graze on substrates in fast-flowing streams (Richards 2002)
Distribution and differentiationThe R sauteri complex is one of the most common and widespread riverine frogs in Taiwan It forms breeding col-onies of up to several thousand individuals It is common at all elevations in western Taiwan but rare and sporadic in the east (Lue et al 1990) The higher Hd -value in the southern transect than in the northern one suggests that populations in the southern transect had a longer evolu-tionary history of local differentiation (Avise 2000 Chen et al 2006) They also had high FST values and a large proportion of private haplotypes suggesting that they were more restricted geographically shaping their genetic differentiation Mountains might act as barriers for gene flow among geographical populations (Toda et al 1998 Huang et al 2002) Amphibians also exhibit a wider pop-ulation variation than other major terrestrial animal taxa (Beebee 2005) due to lower gene flow and high genetic differentiation among geographical populations resulting from site fidelity and limited dispersal However current ecology demography and the historical pattern of both vicariance and dispersal may act in concert to produce a very complex population structure (Avise 1994) The weak positive correlation between genetic and geographi-cal distance probably resulted from the interplay between modern and vicariant forces that restrict contemporary gene flow and isolate populations (eg Bossart amp Prowell 1998) Pleistocene glacial refugia have been proposed for some high-elevation species of animals in Taiwan (Hsu et al 2001 Yuan et al 2006) A rapid colonization from multiple intermountain refugia after the last glaciation might result in the present mosaic geographic distribution of genotypes in the R sauteri complex
Taxonomic statusThe structure arrangement and configuration of mouth-parts of tadpoles are regularly used as diagnostic traits (Haas 2003 Altig 2006 Bonacci et al 2008) and the LTR formula has been considered to be species-specific for the genus Rana (Vences et al 2002) The formula was used by Chou amp Lin (1997a 1997b) to distinguish the R sauteri complex into two species The results of this study however suggest that LTR represents a phe-notype associated with size differences in the oral disc determined by environmental factors Therefore it is an unsuitable trait for species delimitation Phylogenetically R sauteri and R multidenticulata were nested together with their putative hybrids without representing mono-phyletic lineages Accordingly we regard Rana sauteri Boulenger 1909 as the sole representative species of the R sauteri complex and Rana multidenticulata Chou and Lin 1997 as its synonym
Taxonomy and trai t d iscordance of R sauter i complex
ACKNOWLEDGEMENTSThis study was supported in part by the National Sci-ence Council of Taiwan (NSC91-2621-B-329-001 NSC92-2621-B-415-001) We thank Dr Hon-Tsen Yu for constructive comments on manuscript Dr Su-Ju Lai for assistance in morphometric measurements Jun-Han Huang for DNA sequencings and Tai-Lin Ai Ming-Xue Wang and Wan-Ting Chen for field collections
REFERENCESAltig R (2006) Discussions of the origin and evolution of the
oral apparatus of anuran tadpoles Acta Herpetologica 1 95ndash105
Altig R amp Johnston GF (1989) Guilds of anuran larvae relationships among developmental modes morphologies and habitats Herpetological Monographs 3 81ndash109
Altig R amp McDiarmid RW (1999) Body plan Development and morphology In Tadpoles The Biology of Anuran Larvae 24ndash51 McDiarmid RW amp Altig R (eds) Chicago The University of Chicago Press
Avise JC (1994) Molecular Markers Natural History and Evolution New York Chapman amp Hall Press
Avise JC (2000) Phylogeography The History and Formation of Species Cambridge Mass Harvard University Press
Babik W Branicki W Crnobrnja-Isailović J Cogălniceanu D Sas I Olgun K Poyarkov NA Garcia-Pariacutes M amp Arntzen JW (2005) Phylogeography of two European newt species ndash discordance between mtDNA and morphology Molecular Ecology 14 2475ndash2491
Ballard JWO amp Melvin RG (2010) Linking the mitochondrial genotype to the organismal phenotype Molecular Ecology 19 1523ndash1539
Beebee TJC (2005) Conservation genetics of amphibians Heredity 95 423ndash427
Bonacci A Brunelli E Sperone E amp Tripepi S (2008) The oral apparatus of tadpoles of Rana dalmatina Bombina variegata Bufo bufo and Bufo viridis (Anura) Zoologischer Anzeiger 247 47ndash54
Bossart JL amp Prowell DP (1998) Genetic estimates of population structure and gene flow limitations lessons and new directions Trends in Ecology and Evolution 13 202ndash206
Che J Pang J Zhao EM Matsui M amp Zhang YP (2007) Phylogenetic relationships of the Chinese brown frogs (genus Rana) inferred from partial mitochondrial 12S and 16S rRNA gene sequences Zoological Science 24 71ndash80
Chen SF Rossiter SJ Faulkes CG amp Jones G (2006) Population genetic structure and demographic history of the endemic Formosan lesser horseshoe bat (Rhinolophus monoceros) Molecular Ecology 15 1643ndash1656
Chou WH amp Lin JY (1997a) Geographical variations of Rana sauteri (Anura Ranidae) in Taiwan Zoological Studies 36 201ndash221
Chou WH amp Lin JY (1997b) Description of a new species Rana multidenticulata (Anura Ranidae) from Taiwan Zoological Studies 36 222ndash229
Crandall KA Bininda-Emonds ORP Mace GM amp Wayne RK (2000) Considering evolutionary processes in conservation biology Trends in Ecology and Evolution
178
15 290ndash295Excoffier L Smouse PE amp Quattro JM (1992) Analysis of
molecular variance inferred from metric distances among DNA haplotypes application to human mitochondrial DNA restriction data Genetics 131 479ndash491
Ghalambor CK McKay JK Carroll SP amp Reznick DN (2007) Adaptive versus non-adaptive phenotypic plasticity and the potential for contemporary adaptation in new environments Functional Ecology 21 394ndash407
Goebel AM Donnelly JM amp Atz ME (1999) PCR primers and amplification methods for 12S ribosomal DNA the control region cytochrome oxidase I and cytochrome b in bufonids and other frogs and an overview of PCR primers which have amplified DNA in amphibians successfully Molecular Phylogenetics and Evolution 11 163ndash199
Gompert Z Nice CC Fordyce JA Forister ML amp Shapiro AM (2006) Identifying units for conservation using molecular systematics the cautionary tale of the Karner blue butterfly Molecular Ecology 15 1759ndash1768
Gosner KL (1960) A simplified table for staging anuran embryos and larvae with notes on identification Herpetologica 16 183ndash190
Grady JM amp Quattro JM (1999) Using character concordance to define taxonomic and conservation units Conservation Biology 13 1004ndash1007
Grosjean S (2005) The choice of external morphological characters and developmental stages for tadpole-based anuran taxonomy a case study in Rana (Sylvirana) nigrovittata (Blyth 1855) (Amphibia Anura Ranidae) Contributions to Zoology 74 61ndash76
Haas A (2003) Phylogeny of frogs as inferred from primarily larval characters (Amphibia Anura) Cladistics 19 23ndash89
Hall TA (1999) BIOEDIT a user-friendly biological sequence alignment editor and analysis program for Windows 9598NT Nucleic Acids Symposium Series 41 95ndash98
Hoelzel AR (1992) Molecular Genetic Analysis of Populations Oxford Oxford University Press
Hsu FH Lin FJ amp Lin YS (2001) Phylogeographic structure of the Formosan wood mouse Apodemus semotus Thomas Zoological Studies 40 91ndash102
Huang SSF Hwang SY amp Lin TP (2002) Spatial pattern of chloroplast DNA variation of Cyclobalanopsis glauca in Taiwan and East Asia Molecular Ecology 11 2349ndash2358
Jang-Liaw NH amp Lee TH (2009) Intraspecific relationships of populations of the brown frog Rana sauteri (Rana Ranidae) in Taiwan inferred from mitochondrial cytochrome b gene sequences Zoological Science 26 608ndash616
Johnsen A Andersson S Fernandez JG Kempenaers B Pavel V Questiau S Raess M Rindal E amp Lifjeld JT (2006) Molecular and phenotypic divergence in the bluethroat (Luscinia svecica) subspecies complex Molecular Ecology 15 4033ndash4047
Kolbe JJ Larson A amp Losos JB (2007) Differential admixture shapes morphological variation among invasive populations of the lizard Anolis sagrei Molecular Ecology 16 1579ndash1591
Lai SJ Kam YC Hsu FH amp Lin YS (2002) Elevational effects on the growth and development of tadpoles of Sauterrsquos frog Rana sauteri Boulenger in Taiwan Acta Zoologica Taiwanica 13 11ndash20
Lai SJ Kam YC amp Lin YS (2003) Elevational variation
in reproductive and life history traits of Sauterrsquos frog Rana sauteri Boulenger 1909 in Taiwan Zoological Studies 42 193ndash202
Leacheacute AD amp Cole CJ (2007) Hybridization between multiple fence lizard lineages in an ecotone locally discordant variation in mitochondrial DNA chromosomes and morphology Molecular Ecology 16 1035ndash1054
Lorenzen ED Arctander P amp Siegismund HR (2006) Regional genetic structuring and evolutionary history of the impala Aepyceros melampus Journal of Heredity 97 119ndash132
Lue KY Lin CY amp Jung KS (1990) Wildlife Data Bank of Taiwan (1) Amphibians (II) Taipei Ecological Research of the Council of Agriculture No 8
McDiarmid RW amp Altig R (2010) Morphology of amphibian larvae In Amphibian Ecology and Conservation 39ndash53 Dodd CK Jr (ed) New York Oxford University Press
Nei M (1987) Molecular Evolutionary Genetics New York Columbia University Press
Posada D amp Crandall KA (1998) Modeltest testing the model of DNA substitution Bioinformatics 14 817ndash818
Richards CL amp Knowles LL (2007) Tests of phenotypic and genetic concordance and their application to the conservation of Panamanian golden frogs (Anura Bufonidae) Molecular Ecology 16 3119ndash3133
Richards SJ (2002) Influence of flow regime on habitat selection by tadpoles in an Australian rainforest stream Journal of Zoology 257 273ndash279
Ronquist F amp Huelsenbeck JP (2003) MrBayes 3 Bayesian phylogenetic inference under mixed models Bioinformatics 19 1572ndash1574
Rosenberg MS (2001) PASSAGE Pattern Analysis Spatial Statistics and Geographic Exegesis Version 10 Tempe Arizona Department of Biology Arizona State University
Rozas J amp Rozas R (1999) DNASP version 3 an integrated program for molecular population genetics and molecular evolution analysis Bioinformatics 15 174ndash175
Rudh A Rogell B amp Houmlglund J (2007) Non-gradual variation in colour morphs of the strawberry poison frog Dendrobates pumilio genetic and geographical isolation suggest a role for selection in maintaining polymorphism Molecular Ecology 16 4284ndash4294
Schneider S Roessli D amp Excoffier L (2001) ARLEQUIN Version 2001 A Software for Population Genetics Data Analysis Geneva Genetics and Biometry Laboratory Department of Anthropology University of Geneva
Storfer A Eastman JM amp Spear SF (2009) Modern molecular methods for amphibian conservation BioScience 59 559ndash571
Sutherland MAB Gouchie GM amp Wassersug RJ (2009) Can visual stimulation alone induce phenotypically plastic responses in Rana sylvatica tadpole oral structure Journal of Herpetology 43 165ndash168
Swofford DL (2001) PAUP Phylogenetic Analysis Using Parsimony (and Other Methods) Version 40 Beta Sunderland Mass Sinauer Associates
Tajima F (1989) Statistical method for testing the neutral mutation hypothesis by DNA polymorphism Genetics 123 585ndash595
Tamura K Dudley J Nei M amp Kumar S (2007) MEGA4 Molecular evolutionary genetics analysis (MEGA) software
F -H Hsu et al
179
version 40 Molecular Biology and Evolution 24 1596ndash1599
Tanaka-Ueno T Matsui M Chen SL Takenaka O amp Ota H (1998) Phylogenetic relationships of brown frogs from Taiwan and Japan assessed by mitochondrial cytochrome b gene sequence (Rana Ranidae) Zoological Science 15 283ndash288
Thompson JD Gibson TJ Plewniak F Jeanmougin F amp Higgins DG (1997) The Clustal_X windows interface flexible strategies for multiple sequence alignment aided by quality analysis tools Nucleic Acids Research 25 4876ndash4882
Toda M Nishida M Matsui M Lue KY amp Ota H (1998) Genetic variation in the Indian rice frog Rana limnocharis (Amphibia Anura) in Taiwan as revealed by allozyme data Herpetologica 54 73ndash82
Vences M Puente M Nieto S amp Vieites DR (2002) Phenotypic plasticity of anuran larvae environmental variables influence body shape and oral morphology in Rana temporaria tadpoles Journal of Zoology 257 155ndash162
Yuan SL Lin LK amp Oshida T (2006) Phylogeography of the mole-shrew (Anourosorex yamashinai) in Taiwan implications of interglacial refugia in a high-elevation small mammal Molecular Ecology 15 2119ndash2130
Accepted 17 April 2011
Taxonomy and trai t d iscordance of R sauter i complex
170
MATERIALS AND METHODSTadpole collectionIn all 331 tadpoles were collected at 32 locations in the central-northern region of Taiwan between August 2002 and December 2003 A northern (sampling locations N1ndashN17) and a southern (sampling locations S1ndashS15) transect were established (Fig 1 Table 1) Each location was searched for tadpoles in ravine streams Between seven and 12 individuals were randomly sampled at each location and preserved in 70 ethanol
Morphometric measurementsWe determined the developmental stage of each tadpole collected according to the stages defined by Gosner (1960) All tadpoles were between Gosner stages 27 and 33 with completely developed oral parts subsequent tadpole de-velopment does not affect LTR (Bonacci et al 2008) A total of 17 morphometric traits were examined The three traits based on LTR were the number of continuous tooth
rows on upper labium (CTR) the number of interrupted tooth rows on the upper labium (ITR) and the number of tooth rows on the lower labium (TRL) Tadpoles were divided into groups I II and III representing R sauteri hybrids and R multidenticulata respectively (following Chou amp Lin 1997ab)
Other morphometric traits measured were snoutndashvent length (SVL) maximum body height (BH) body width at spiracle (BW) snoutndashnostril distance (SND) snoutndashspiracle distance (SSD) eyendashnostril distance (END) eyeball diameter (EBD) internostrial distance (IND) interorbital distance (IOD) mouth width (MW) tail length (TL) maximum tail height (TH) maximum cau-dal muscle height (CMH) and maximum caudal muscle width (CMW) (Chou amp Lin 1997a Altig amp McDiarmid 1999 Grosjean 2005) SND END EBD IND and IOD were measured with a graduated ocular micrometer under a stereo-microscope and the other traits were measured with a digital caliper (Mitutoyo 500ndash196) to the nearest 001 mm
DNA extraction and sequencingGenomic DNA was isolated from tail tissue using the phenol-chloroform method (Hoelzel 1992) and QIAGEN DNeasy extraction kits (QIAGEN Inc) We sequenced a region of mtDNA including the cytochrome b gene (cytb) using primers L14850 (5rsquo-TCTCA TCCTG ATGAA ACTTT GGCTC-3rsquo) and H15502 (5rsquo-GGATT AGCTG GTGTG AAATT GTCTG GG-3rsquo) (Tanaka-Ueno et al 1998 Goebel et al 1999) Amplification was performed in accordance with the following protocol a hot start at 94 degC for 2 min followed by 36 cycles at 94 degC for 40 sec 55 degC for 1 min 72 degC for 2 min and a final ex-tension at 72 degC for 10 min PCR products were purified by Gel-M Gel Extraction Kit (Viogene) and directly se-quenced with an ABI3100 automated sequencer (Perkin Elmer Inc) Sequences were edited with BIOEDIT 509 (Hall 1999) aligned with CLUSTAL_X 17 (Thompson et al 1997) and confirmed to be 596 bp in total length from both strands Unique mtDNA cytb sequences used in this study were deposited at GenBank (accession nos HM989036ndash989366)
Genetic traits and phylogenetic analysisHaplotype diversity (Hd) and nucleotide diversity (π) (Nei 1987) were calculated with DNASP 353 (Rozas amp Rozas 1999) The number of polymorphic sites and the mean number of pairwise differences among the cytb se-quences were also estimated In order to test for deviation from neutrality in the sequence data Tajimarsquos D (Tajima 1989) was calculated and compared to a beta distribution for significance testing
Maximum parsimony (MP) neighbour-joining (NJ) and Bayesian methods were employed for phyloge-netic reconstruction using R longicrus (accession no HM989035) as outgroup The MP tree reconstruction was performed in PAUP 40 (Swofford 2001) with gaps treated as missing data equal weight for transitions and transversions heuristic search with tree-bisection-recon-nection (TBR) branch swapping and 10 random addition replications MEGA 4 (Tamura et al 2007) was used
Fig 1 Sampling locations of tadpoles of the R sauteri complex in Taiwan (N1ndashN17 locations in northern transect S1ndashS15 locations in southern transect location codes similar to those denoting in Table 1 light grey area mountains at elevations above 1500 m broken lines putative ranges of R sauteri (I) R multidenticulata (III) and the hybrids (II) proposed by Chou amp Lin 1997b)
F -H Hsu et al
171
to produce an NJ tree Confidence of phylogenetic rela-tionships was assessed by 1000 nonparametric bootstrap replications The appropriate DNA substitution model for the Bayesian phylogenetic analysis was obtained by testing alternative models of evolution using Modeltest
version 37 (Posada amp Crandall 1998) MrBayes ver-sion 312 (Ronquist amp Huelsenbeck 2003) was used to perform a partition-likelihood Bayesian search Two simultaneous Metropolis-coupled Markov Chain Mon-te Carlo analyses were run each with four chains for
Taxonomy and trai t d iscordance of R sauter i complex
Code Location Latitude LongitudeEleva-
tion (m) n CTR ITR TRL
LTR groups Slopes
Northern transectN1 Huangjhukeng 24deg0447 120deg4522 180 10 2(10) 3(10) 4(10) I W
N2 Dakeng 24deg1044 120deg4627 250 8 2(8) 3(8) 4(8) I W
N3 Dawanjiao 24deg0633 120deg4651 250 11 2(11) 3(11) 4(8)5(3) I W
N4 Shangping 24deg0704 120deg5354 570 10 2(10) 3(10) 4(10) I W
N5 Meiyuan 24deg1918 120deg5319 750 8 3(8) 3(7)4(1) 5(3)6(3)7(2) II W
N6 Heping 24deg1708 120deg5411 560 9 2(7)3(2) 3(2)4(7) 4(1)5(8) II W
N7 Wushihkeng 24deg1647 120deg5623 700 8 2(4)3(4) 3(3)4(5) 4(1)5(2)6(5) II W
N8 Jiabaotai 24deg1134 121deg0051 570 11 2(1)3(10) 3(10)4(1) 4(1)5(10) II W
N9 Guanwu 24deg3006 121deg0502 1900 7 3(7) 4(7) 7(7) III W
N10 Jiayang 24deg1531 121deg1242 1450 9 3(9) 4(9) 6(2)7(3)8(4) III W
N11 Sihyuanyakou 24deg2344 121deg2108 2000 12 3(12) 4(12) 6(4)7(5)8(3) III W
N12 Nanshan 24deg2749 121deg2332 840 11 3(8)4(3) 3(2)4(9) 7(9)8(2) III E
N13 Renze 24deg3246 121deg3023 650 12 3(12) 4(11)5(1) 7(2)8(10) III E
N14 Taipingshan 24deg2925 121deg3206 1850 12 3(12) 4(12) 7(11)8(1) III E
N15 Datong 24deg4051 121deg3625 200 11 3(11) 3(1)4(10) 7(11) III E
N16 Shuanglianbi 24deg4516 121deg3720 410 12 3(12) 3(1)4(11) 6(2)7(9)8(1) III E
N17 Gulu 24deg3339 121deg4010 1000 12 3(12) 4(12) 7(6)8(6) III E
Southern transect
S1 Guanzihling 23deg2037 120deg3056 240 11 2(11) 3(11) 4(11) I W
S2 Chukou 23deg2622 120deg3622 260 12 2(12) 3(12) 4(12) I W
S3 Niaopu 23deg1946 120deg3644 270 10 2(10) 3(10) 4(10) I W
S4 Shanmei 23deg2207 120deg4017 380 12 2(12) 3(12) 4(12) I W
S5 Shuangsi 23deg3207 120deg3651 350 9 2(9) 3(8)4(1) 4(2)5(7) II W
S6 Caoling 23deg3505 120deg4211 550 11 2(11) 3(11) 4(3)5(8) II W
S7 Dabang 23deg2704 120deg4422 790 12 2(12) 3(7)4(5) 4(6)5(6) II W
S8 Fongshan 23deg3430 120deg4508 700 9 2(8)3(1) 3(9) 5(8)6(1) II W
S9 Sitou 23deg4010 120deg4750 1150 12 2(12) 3(12) 5(11)6(1) II W
S10 Dili 23deg4655 120deg5712 450 12 2(10)3(2) 3(2)4(10) 4(9)5(3) II W
S11 Alishan 23deg3101 120deg4836 2150 8 3(8) 4(8) 7(2)8(6) III W
S12 Zihjhong 23deg2957 120deg4859 2300 10 3(10) 3(1)4(9) 6(3)7(5)8(2) III W
S13 Haitiansih 23deg4524 121deg1013 2250 10 3(9)4(1) 3(1)4(9) 5(4)6(3)7(3) III W
S14 Muguasi 24deg0253 121deg2104 1450 10 3(10) 4(10) 7(3)8(7) III ES15 Wanrong 23deg4317 121deg2131 550 10 3(9)4(1) 3(1)4(9) 7(2)8(8) III E
Table 1 Sampling locations elevations sample sizes (n) and numbers of labial tooth rows (CTR continuous tooth rows on upper labium ITR interrupted tooth rows on upper labium TRL tooth rows on lower labium sample sizes in parentheses) of the three labial tooth row (LTR) groups (I II and III) of tadpoles of the R sauteri complex collected from 32 locations from the northern transect (N) and the southern transect (S) on the western slope (W) and the eastern slope (E) of the central mountain range of Taiwan
172
40000000 generations sampling trees every 1000 gen-erations We discarded the first 10000000 generations (10000 trees) on each run as ldquoburn-inrdquo after confirming chain stationarity from plots of likelihood against genera-tion The remaining trees were used to estimate posterior nodal probabilities and a summary of the phylogeny
Statistical analysisWe performed a discriminant function analysis (DFA) with STATISTICA version 70 to differentiate between the three LTR groups based on ln-transformed morpho-metric variables to address the assumption of normality (KolmogorovndashSmimov test Pgt005) The three LTR traits were discrete and did not follow a normal distribution and therefore were excluded from the DFA analysis We conducted an analysis of covariance (ANCOVA) using SVL as covariate and the locationrsquos mean of each of the other 13 morphometric traits to identify differences among three LTR groups and between two transects Spearman rank correlation (rs) analyses were conducted between total tooth rows (TTR = CTR + ITR + TRL) and morphometric traits
Geographic patterns of genetic differentiation were evaluated by analysis of molecular variance (AMOVA Excoffier et al 1992) This assessed the extent to which genetic variation was attributable to three hierarchical lev-els of subdivision among regions (groups of locations) among locations within regions and within locations AMOVA was first performed on the two geographical transects treated as regions and using the three LTR groups as regions The statistical significance of fixation indices (ΦCT ΦSC and ΦST) was tested by ARLEQUIN 2001 in nonparametric permutation with 10000 permutations against the null hypothesis that all individuals belonged to the same population (Schneider et al 2001)
Mantel tests were used to determine the relationships between TTR the other morphometric traits the genetic data and the geographical distances between sampling lo-cations The statistical significance of the relationships was based on 10000 random permutations implemented in PASSAGE (Rosenberg 2001) TTR distances were cal-culated as Euclidean pairwise distances in TTR among the 32 locations The other morphometric distances except SVL were calculated as Mahalanobis distances (Kolbe et al 2007) Pairwise genetic distances were cal-
LTR groups
CTR ITR TRL TTR
n Rows n Rows n Rows n Rows n
I 84 2 84 1000 3 84 1000 4 81 964 9 81 964 5 3 36 10 3 36
II 101 2 74 733 3 71 703 4 23 228 9 8 79
3 27 267 4 30 297 5 66 653 10 52 515
6 10 99 11 31 307
7 2 20 12 6 59
13 3 30
14 1 10
III 146 2 0 00 3 7 48 4 0 00 12 5 34
3 141 966 4 138 945 5 4 27 13 15 103
4 5 34 5 1 07 6 14 96 14 75 514
7 78 534 15 50 342 8 50 342 16 1 07
Table 2 Numbers of labial tooth rows of three labial tooth row (LTR) groups (I II and III) of the R sauteri complex (n number of tadpoles CTR continuous tooth row on upper labium ITR interrupted tooth row on upper labium TRL tooth rows on lower labium TTR total tooth rows = CTR + ITR + TRL)
Fig 2 Relationships between elevations and total labium tooth rows (TTR locationrsquos mean plusmn SD) of the R sauteri complex on the western slope (solid circles and solid line) and the eastern slope (open circles and dashed line) of central mountain range in Taiwan
F -H Hsu et al
173
culated as Slatkinrsquos linearized FST represented by FST (1 ndash FST) among the locations using ARLEQUIN 2001 Geographical distances (latitudes and longitudes) among locations were calculated using the online distance cal-culator (httpvldbgsigojpsokuchisurveycalcbl2stfhtml)
RESULTSLTR traitsBased on LTR traits individuals of the R sauteri complex were divided into three groups group I with 2 CTR 3 ITR and 4 (mode ranges 4ndash5) TRL group II with 2 (2ndash3) CTR 3 (3ndash4) ITR and 5 (4ndash7) TRL and group III with 3 (3ndash4) CTR 4 (3ndash5) ITR and 7 (5ndash8) TRL (Table 2) The number of LTR increased longitudinally (eastward) from group I to group III with the increase in elevation on the western slope of the central mountain range but not on the eastern slope (Figs 1 2 Table 1)
Morphometric variationThere was a significant difference in SND SSD EBD IOD MW TH and CMH (significant slope heterogeneity in TH and CMH) among all LTR groups significant dif-ferences in SSD MW and TL were also found between southern and northern transects (ANCOVA Plt005 Ta-ble 3)The positive correlation of TTR with MW SND and SSD suggested that the number of labial tooth rows is associated with the size of the oral disc related to MW and snout size represented by SND and SSD (Fig 3) The regression coefficient of 192 (Fig 3c) indicates that TTR is related to the square of MW proportional to the size of the oral disc
The DFA yielded two significant canonical variables The first was strongly influenced by SND and MW and explained 878 of the total variance The plot of the first two axes showed a remarkable separation of the mor-
Taxonomy and trai t d iscordance of R sauter i complex
VariablesThree LTR groups Two transects
R2-values F-values P-values R2-values F-values P-values
Body height 081 293 0070 078 104 0317Body width 090 117 0324 090 365 0066Snoutndashnostril distance 079 2526 lt0001 045 177 0193Snoutndashspiracle distance 095 1947 lt0001 045 636 0017Eyendashnostril distance 076 001 0997 077 043 0519Eyeball diameter 045 591 0007 027 220 0149Internostrial distances 088 097 0391 087 003 0862Interorbital distance 091 936 0001 085 001 0917Mouth width 078 1633 lt0001 063 841 0007Tail length 091 026 0774 093 484 0036Tail height 075 603 0007 065 075 0394Caudal muscle height 085 401 0029 081 040 0531Caudal muscle width 081 263 0090 077 001 0914
Table 3 Results of ANCOVA with snoutndashvent length (SVL) as a covariate for testing differences of locationrsquos mean of 13 other morphometric traits among three labial tooth row (LTR) groups and between two geographic transects for tadpoles of the R sauteri complex (n=32)
Fig 3 Relationships of total tooth rows (TTR) to snoutndashnostril distances (A) snoutndashspiracle distances (B) and mouth widths (C) of tadpoles of the R sauteri complex
174
phometric traits between groups I and III while group II overlapped widely with groups I and III (Fig 4)
Haplotype variationA total of 76 unique haplotypes were identified from the mtDNA cytb sequences of 331 tadpoles 58 were restrict-ed to a single location and 47 to a single tadpole There were 79 polymorphic sites 53 of which were parsimony informative and had no length variation The Hd-values among locations ranged between 0 and 0924 and the π-values ranged between 0 and 00167 Global Hd-values were 0935plusmn0007 (meanplusmnSD) and global π-values were 001287plusmn000076 The neutral expectation of the D val-
ues was not rejected (Tajimarsquos test D= ndash1169 Pgt01) suggesting that the cytb gene evolved under neutral ex-pectations
Forty-seven haplotypes were more abundant in the northern transect and 32 haplotypes were more abundant in the southern transect Hd -values were similar in the two transects The π-values and mean numbers of pair-wise differences (k) were two-fold higher for the southern transect than for the northern transect indicating a higher divergence in haplotypes in the former than the latter For three LTR groups the number of haplotypes (H) was highest for Group III while the π and k-values were high-est for Group II (Table 4)
PhylogenyThe average pairwise sequence divergences among hap-lotypes was 00165plusmn0135 with a range between 00017 and 00503 The MP analysis yielded a single most par-simonious tree with a length of 248 a consistency index of 059 and a retention index of 074 The NJ tree and Bayesian 50 majority-rule consensus tree had a topol-ogy identical with the MP tree
For the MP tree (Fig 5) there were three major line-ages (A B C) with a stepwise differentiation Lineage A represents the clade with the largest number of haplotypes (H1ndashH61) divided into three sub-lineages (Aa Ab and Ac) each contained haplotypes from three LTR groups Sub-lineage Aa encompassed 48 haplotypes (H1ndashH48) from 167 tadpoles of groups I II and III in the northern transect and 19 tadpoles of groups II and III in the south-ern transect All tadpoles of the sub-lineages Ab and Ac were from groups I II and III of the southern transect and consisted of 6 haplotypes from 20 tadpoles and 11 hap-lotypes from 90 tadpoles respectively (Table 4) Lineage B had 4 haplotypes with 20 tadpoles from group III and lineage C had 8 haplotypes with 15 tadpoles from groups I and II Evidently the three LTR groups were nested to-gether phylogenetically
Fig 4 Canonical plot between the first two canonical scores for 14 morphometric traits of tadpoles of the R sauteri complex (solid circles labial tooth rows (LTR) group I crosses group II open circles group III)
Partitions n H S K Hd π (times100)Haplotype groups
Aa Ab Ac B C
Transects Northern 173 47 57 3581 0891 0601 43(167) 4(6) Southern 158 32 60 8193 0894 1375 7(19) 6(20) 11(90) 4(20) 4(9)LTR groups Group I 84 19 41 5041 0902 0846 8(38) 1(1) 9(44) 1(1) Group II 101 25 46 8826 0866 1481 11(40) 2(3) 5(44) 7(14) Group III 146 48 52 6827 0910 1145 38(108) 4(16) 2(2) 4(20)Total 331 76 79 7669 0935 1287 48(186) 6(20) 11(90) 4(20) 7(15)
Table 4 Genetic variations of mtDNA cytb sequences of 331 tadpoles of the R sauteri complex in two geographical transects and three labial tooth row (LTR) groups (n sample size of tadpoles H number of total haplotypes S number of polymorphic sites k mean number of pairwise differences Hd haplotype diversity π nucleotide diversity number of haplotypes and number of tadpoles (in parentheses) in haplotype groups Aa Ab Ac B and C corresponding to those denoting lineages in the phylogenetic tree (Fig 5)
F -H Hsu et al
175
Genetic differentiationThe AMOVA results are shown in Table 5 There was a significant difference in genetic variances at each of the three hierarchical levels (between transects among loca-
tions within transects and within locations) The largest amount of genetic variance (553) was explainable by differences among locations within transects There was non-significant difference in the genetic variances among
Taxonomy and trai t d iscordance of R sauter i complex
Fig 5 A phylogenetic tree of the R sauteri complex reconstructed from the mtDNA cytb sequences with R longicrus as outgroup using maximum parsimony (MP) method (numbers above branches bootstrap values (gt50) supported by MPNJBayesian posterior probabilities H1ndashH76 haplotypes Aa Ab Ac B and C haplotype groups (clades) of lineages or sublineages N northern transect S southern transect I II III labial tooth row groups I II and III number of tadpoles in parentheses)
176
three LTR groups but significant difference among loca-tions within groups and within locations In other words the genetic differentiation was significant for tadpoles between the two transects but not among the three LTR groups
Relationships among genetic morphometricand geographical variationsTable 6 shows the results of Mantel tests for correlation among pairwise TTR distances morphometric distances and genetic as well as geographic distances The pair-wise genetic distances were significantly correlated with geographic distances but not with TTR and other mor-phometric distances There were significant positive correlations among geographic distances TTR distances and other morphometric distances Pairwise FST values among locations were 0564plusmn0322 suggesting high ge-netic differentiation among geographic populations
DISCUSSIONDiscordance of genetic and morphometric traitsLTRs of tadpoles of the R sauteri complex showed a longitudinal cline in both northern and southern transects (Figs 1 2 Table 1) but such a cline was not observed for cytb haplotypes Instead genetic differentiation differed significantly between the two transects but not among the three LTR groups In addition genetic distances were sig-nificantly correlated with geographical distances but not LTR or other morphometric distances Such discordance between genetic and phenotypic differentiations has also been detected in for example newts (Babik et al 2005) frogs (Richards amp Knowles 2007) lizards (Leacheacute amp Cole 2007 Kolbe et al 2007) and birds (Johnsen et al 2006)
Adaptive plastic phenotypesDifferences in oral structure of tadpoles among geo-graphical populations have been attributed to differences in phylogeny feeding habits and dietary specializations (Bonacci et al 2008) Rana dalmatina shows fewer upper labial tooth rows in smaller ponds because meta-morphosis is induced before attaining full development of oral structures (Bonacci et al 2008) Tadpoles of the
R sauteri complex that have a shorter tadpole period at low elevations (Lai et al 2002) may develop fewer tooth rows than those that have a longer tadpole period Larger oral discs have more tooth rows (McDiarmid amp Altig 2010) and the length of labial tooth rows is related to the microhabitat (Altig amp Johnston 1989)
Individuals of the R sauteri complex breed in streams of low current and low elevations during the dry season (autumn and winter) and at high elevations in strong current during the rainy season (spring and summer Lai et al 2003) In eastern Taiwan due to steep mountain slopes with northeast monsoon rainfalls streams are on average characterized by faster currents than in western Taiwan over the entire year Substrates in the streams were fairly homogeneous with mixtures of rubble and pebbles at low elevations while they were highly variable with more large boulders at the high elevations and in eastern Taiwan The longitudinal cline of LTR was found to cor-respond with longitudinal changes in stream current and substrate condition LTR traits are known to be associated
Table 6 Results of Mantel tests for correlations among genetic distances geographical distances total tooth row distances and other morphometric distances (r Mantel correlation coefficient italic Plt005) ln (km)
Matrix 1 Matrix 2r-
values P-
valuesGenetic distance Geographical
distance0119 00118
Genetic distance Total tooth row distance
0068 00614
Genetic distance Other morpho- metric distance
0124 00965
Geographical distance
Total tooth row distance
0401 lt00001
Geographical distance
Other morpho- metric distance
0262 00001
Total tooth row distance
Other morpho- metric distance
0402 lt00001
Structure Source of variance df Variance () Fixation index P-value
Two transects
Between transects 1 2585 ΦCT=0259 00001
Among locationswithin transects 30 553 ΦSC=0746 lt00001
Within locations 299 1884 ΦST=0812 lt00001
Three LTR groupsAmong groups 2 767 ΦCT=0077 00673
Among locationswithin groups 29 7133 ΦSC=0773 lt00001Within locations 299 2099 ΦST=0790 lt00001
Table 5 Analysis of molecular variances (AMOVA) of mtDNA cytb sequences of the R sauteri complex for two transects (northern and southern) and three labial tooth row (LTR) groups (I II and III)
F -H Hsu et al
177
with the size of the oral disc which is important for feed-ing in lotic habitats (Altig amp Johnston 1989)
Based on our results it is reasonable to consider that LTRs of tadpoles are a consequence of phenotypic plas-ticity It increases with enlargement of the oral disc corresponding with elevation and monsoon rainfalls The increase in LTR and size of the oral disk enables the tadpoles to grasp and graze on substrates in fast-flowing streams (Richards 2002)
Distribution and differentiationThe R sauteri complex is one of the most common and widespread riverine frogs in Taiwan It forms breeding col-onies of up to several thousand individuals It is common at all elevations in western Taiwan but rare and sporadic in the east (Lue et al 1990) The higher Hd -value in the southern transect than in the northern one suggests that populations in the southern transect had a longer evolu-tionary history of local differentiation (Avise 2000 Chen et al 2006) They also had high FST values and a large proportion of private haplotypes suggesting that they were more restricted geographically shaping their genetic differentiation Mountains might act as barriers for gene flow among geographical populations (Toda et al 1998 Huang et al 2002) Amphibians also exhibit a wider pop-ulation variation than other major terrestrial animal taxa (Beebee 2005) due to lower gene flow and high genetic differentiation among geographical populations resulting from site fidelity and limited dispersal However current ecology demography and the historical pattern of both vicariance and dispersal may act in concert to produce a very complex population structure (Avise 1994) The weak positive correlation between genetic and geographi-cal distance probably resulted from the interplay between modern and vicariant forces that restrict contemporary gene flow and isolate populations (eg Bossart amp Prowell 1998) Pleistocene glacial refugia have been proposed for some high-elevation species of animals in Taiwan (Hsu et al 2001 Yuan et al 2006) A rapid colonization from multiple intermountain refugia after the last glaciation might result in the present mosaic geographic distribution of genotypes in the R sauteri complex
Taxonomic statusThe structure arrangement and configuration of mouth-parts of tadpoles are regularly used as diagnostic traits (Haas 2003 Altig 2006 Bonacci et al 2008) and the LTR formula has been considered to be species-specific for the genus Rana (Vences et al 2002) The formula was used by Chou amp Lin (1997a 1997b) to distinguish the R sauteri complex into two species The results of this study however suggest that LTR represents a phe-notype associated with size differences in the oral disc determined by environmental factors Therefore it is an unsuitable trait for species delimitation Phylogenetically R sauteri and R multidenticulata were nested together with their putative hybrids without representing mono-phyletic lineages Accordingly we regard Rana sauteri Boulenger 1909 as the sole representative species of the R sauteri complex and Rana multidenticulata Chou and Lin 1997 as its synonym
Taxonomy and trai t d iscordance of R sauter i complex
ACKNOWLEDGEMENTSThis study was supported in part by the National Sci-ence Council of Taiwan (NSC91-2621-B-329-001 NSC92-2621-B-415-001) We thank Dr Hon-Tsen Yu for constructive comments on manuscript Dr Su-Ju Lai for assistance in morphometric measurements Jun-Han Huang for DNA sequencings and Tai-Lin Ai Ming-Xue Wang and Wan-Ting Chen for field collections
REFERENCESAltig R (2006) Discussions of the origin and evolution of the
oral apparatus of anuran tadpoles Acta Herpetologica 1 95ndash105
Altig R amp Johnston GF (1989) Guilds of anuran larvae relationships among developmental modes morphologies and habitats Herpetological Monographs 3 81ndash109
Altig R amp McDiarmid RW (1999) Body plan Development and morphology In Tadpoles The Biology of Anuran Larvae 24ndash51 McDiarmid RW amp Altig R (eds) Chicago The University of Chicago Press
Avise JC (1994) Molecular Markers Natural History and Evolution New York Chapman amp Hall Press
Avise JC (2000) Phylogeography The History and Formation of Species Cambridge Mass Harvard University Press
Babik W Branicki W Crnobrnja-Isailović J Cogălniceanu D Sas I Olgun K Poyarkov NA Garcia-Pariacutes M amp Arntzen JW (2005) Phylogeography of two European newt species ndash discordance between mtDNA and morphology Molecular Ecology 14 2475ndash2491
Ballard JWO amp Melvin RG (2010) Linking the mitochondrial genotype to the organismal phenotype Molecular Ecology 19 1523ndash1539
Beebee TJC (2005) Conservation genetics of amphibians Heredity 95 423ndash427
Bonacci A Brunelli E Sperone E amp Tripepi S (2008) The oral apparatus of tadpoles of Rana dalmatina Bombina variegata Bufo bufo and Bufo viridis (Anura) Zoologischer Anzeiger 247 47ndash54
Bossart JL amp Prowell DP (1998) Genetic estimates of population structure and gene flow limitations lessons and new directions Trends in Ecology and Evolution 13 202ndash206
Che J Pang J Zhao EM Matsui M amp Zhang YP (2007) Phylogenetic relationships of the Chinese brown frogs (genus Rana) inferred from partial mitochondrial 12S and 16S rRNA gene sequences Zoological Science 24 71ndash80
Chen SF Rossiter SJ Faulkes CG amp Jones G (2006) Population genetic structure and demographic history of the endemic Formosan lesser horseshoe bat (Rhinolophus monoceros) Molecular Ecology 15 1643ndash1656
Chou WH amp Lin JY (1997a) Geographical variations of Rana sauteri (Anura Ranidae) in Taiwan Zoological Studies 36 201ndash221
Chou WH amp Lin JY (1997b) Description of a new species Rana multidenticulata (Anura Ranidae) from Taiwan Zoological Studies 36 222ndash229
Crandall KA Bininda-Emonds ORP Mace GM amp Wayne RK (2000) Considering evolutionary processes in conservation biology Trends in Ecology and Evolution
178
15 290ndash295Excoffier L Smouse PE amp Quattro JM (1992) Analysis of
molecular variance inferred from metric distances among DNA haplotypes application to human mitochondrial DNA restriction data Genetics 131 479ndash491
Ghalambor CK McKay JK Carroll SP amp Reznick DN (2007) Adaptive versus non-adaptive phenotypic plasticity and the potential for contemporary adaptation in new environments Functional Ecology 21 394ndash407
Goebel AM Donnelly JM amp Atz ME (1999) PCR primers and amplification methods for 12S ribosomal DNA the control region cytochrome oxidase I and cytochrome b in bufonids and other frogs and an overview of PCR primers which have amplified DNA in amphibians successfully Molecular Phylogenetics and Evolution 11 163ndash199
Gompert Z Nice CC Fordyce JA Forister ML amp Shapiro AM (2006) Identifying units for conservation using molecular systematics the cautionary tale of the Karner blue butterfly Molecular Ecology 15 1759ndash1768
Gosner KL (1960) A simplified table for staging anuran embryos and larvae with notes on identification Herpetologica 16 183ndash190
Grady JM amp Quattro JM (1999) Using character concordance to define taxonomic and conservation units Conservation Biology 13 1004ndash1007
Grosjean S (2005) The choice of external morphological characters and developmental stages for tadpole-based anuran taxonomy a case study in Rana (Sylvirana) nigrovittata (Blyth 1855) (Amphibia Anura Ranidae) Contributions to Zoology 74 61ndash76
Haas A (2003) Phylogeny of frogs as inferred from primarily larval characters (Amphibia Anura) Cladistics 19 23ndash89
Hall TA (1999) BIOEDIT a user-friendly biological sequence alignment editor and analysis program for Windows 9598NT Nucleic Acids Symposium Series 41 95ndash98
Hoelzel AR (1992) Molecular Genetic Analysis of Populations Oxford Oxford University Press
Hsu FH Lin FJ amp Lin YS (2001) Phylogeographic structure of the Formosan wood mouse Apodemus semotus Thomas Zoological Studies 40 91ndash102
Huang SSF Hwang SY amp Lin TP (2002) Spatial pattern of chloroplast DNA variation of Cyclobalanopsis glauca in Taiwan and East Asia Molecular Ecology 11 2349ndash2358
Jang-Liaw NH amp Lee TH (2009) Intraspecific relationships of populations of the brown frog Rana sauteri (Rana Ranidae) in Taiwan inferred from mitochondrial cytochrome b gene sequences Zoological Science 26 608ndash616
Johnsen A Andersson S Fernandez JG Kempenaers B Pavel V Questiau S Raess M Rindal E amp Lifjeld JT (2006) Molecular and phenotypic divergence in the bluethroat (Luscinia svecica) subspecies complex Molecular Ecology 15 4033ndash4047
Kolbe JJ Larson A amp Losos JB (2007) Differential admixture shapes morphological variation among invasive populations of the lizard Anolis sagrei Molecular Ecology 16 1579ndash1591
Lai SJ Kam YC Hsu FH amp Lin YS (2002) Elevational effects on the growth and development of tadpoles of Sauterrsquos frog Rana sauteri Boulenger in Taiwan Acta Zoologica Taiwanica 13 11ndash20
Lai SJ Kam YC amp Lin YS (2003) Elevational variation
in reproductive and life history traits of Sauterrsquos frog Rana sauteri Boulenger 1909 in Taiwan Zoological Studies 42 193ndash202
Leacheacute AD amp Cole CJ (2007) Hybridization between multiple fence lizard lineages in an ecotone locally discordant variation in mitochondrial DNA chromosomes and morphology Molecular Ecology 16 1035ndash1054
Lorenzen ED Arctander P amp Siegismund HR (2006) Regional genetic structuring and evolutionary history of the impala Aepyceros melampus Journal of Heredity 97 119ndash132
Lue KY Lin CY amp Jung KS (1990) Wildlife Data Bank of Taiwan (1) Amphibians (II) Taipei Ecological Research of the Council of Agriculture No 8
McDiarmid RW amp Altig R (2010) Morphology of amphibian larvae In Amphibian Ecology and Conservation 39ndash53 Dodd CK Jr (ed) New York Oxford University Press
Nei M (1987) Molecular Evolutionary Genetics New York Columbia University Press
Posada D amp Crandall KA (1998) Modeltest testing the model of DNA substitution Bioinformatics 14 817ndash818
Richards CL amp Knowles LL (2007) Tests of phenotypic and genetic concordance and their application to the conservation of Panamanian golden frogs (Anura Bufonidae) Molecular Ecology 16 3119ndash3133
Richards SJ (2002) Influence of flow regime on habitat selection by tadpoles in an Australian rainforest stream Journal of Zoology 257 273ndash279
Ronquist F amp Huelsenbeck JP (2003) MrBayes 3 Bayesian phylogenetic inference under mixed models Bioinformatics 19 1572ndash1574
Rosenberg MS (2001) PASSAGE Pattern Analysis Spatial Statistics and Geographic Exegesis Version 10 Tempe Arizona Department of Biology Arizona State University
Rozas J amp Rozas R (1999) DNASP version 3 an integrated program for molecular population genetics and molecular evolution analysis Bioinformatics 15 174ndash175
Rudh A Rogell B amp Houmlglund J (2007) Non-gradual variation in colour morphs of the strawberry poison frog Dendrobates pumilio genetic and geographical isolation suggest a role for selection in maintaining polymorphism Molecular Ecology 16 4284ndash4294
Schneider S Roessli D amp Excoffier L (2001) ARLEQUIN Version 2001 A Software for Population Genetics Data Analysis Geneva Genetics and Biometry Laboratory Department of Anthropology University of Geneva
Storfer A Eastman JM amp Spear SF (2009) Modern molecular methods for amphibian conservation BioScience 59 559ndash571
Sutherland MAB Gouchie GM amp Wassersug RJ (2009) Can visual stimulation alone induce phenotypically plastic responses in Rana sylvatica tadpole oral structure Journal of Herpetology 43 165ndash168
Swofford DL (2001) PAUP Phylogenetic Analysis Using Parsimony (and Other Methods) Version 40 Beta Sunderland Mass Sinauer Associates
Tajima F (1989) Statistical method for testing the neutral mutation hypothesis by DNA polymorphism Genetics 123 585ndash595
Tamura K Dudley J Nei M amp Kumar S (2007) MEGA4 Molecular evolutionary genetics analysis (MEGA) software
F -H Hsu et al
179
version 40 Molecular Biology and Evolution 24 1596ndash1599
Tanaka-Ueno T Matsui M Chen SL Takenaka O amp Ota H (1998) Phylogenetic relationships of brown frogs from Taiwan and Japan assessed by mitochondrial cytochrome b gene sequence (Rana Ranidae) Zoological Science 15 283ndash288
Thompson JD Gibson TJ Plewniak F Jeanmougin F amp Higgins DG (1997) The Clustal_X windows interface flexible strategies for multiple sequence alignment aided by quality analysis tools Nucleic Acids Research 25 4876ndash4882
Toda M Nishida M Matsui M Lue KY amp Ota H (1998) Genetic variation in the Indian rice frog Rana limnocharis (Amphibia Anura) in Taiwan as revealed by allozyme data Herpetologica 54 73ndash82
Vences M Puente M Nieto S amp Vieites DR (2002) Phenotypic plasticity of anuran larvae environmental variables influence body shape and oral morphology in Rana temporaria tadpoles Journal of Zoology 257 155ndash162
Yuan SL Lin LK amp Oshida T (2006) Phylogeography of the mole-shrew (Anourosorex yamashinai) in Taiwan implications of interglacial refugia in a high-elevation small mammal Molecular Ecology 15 2119ndash2130
Accepted 17 April 2011
Taxonomy and trai t d iscordance of R sauter i complex
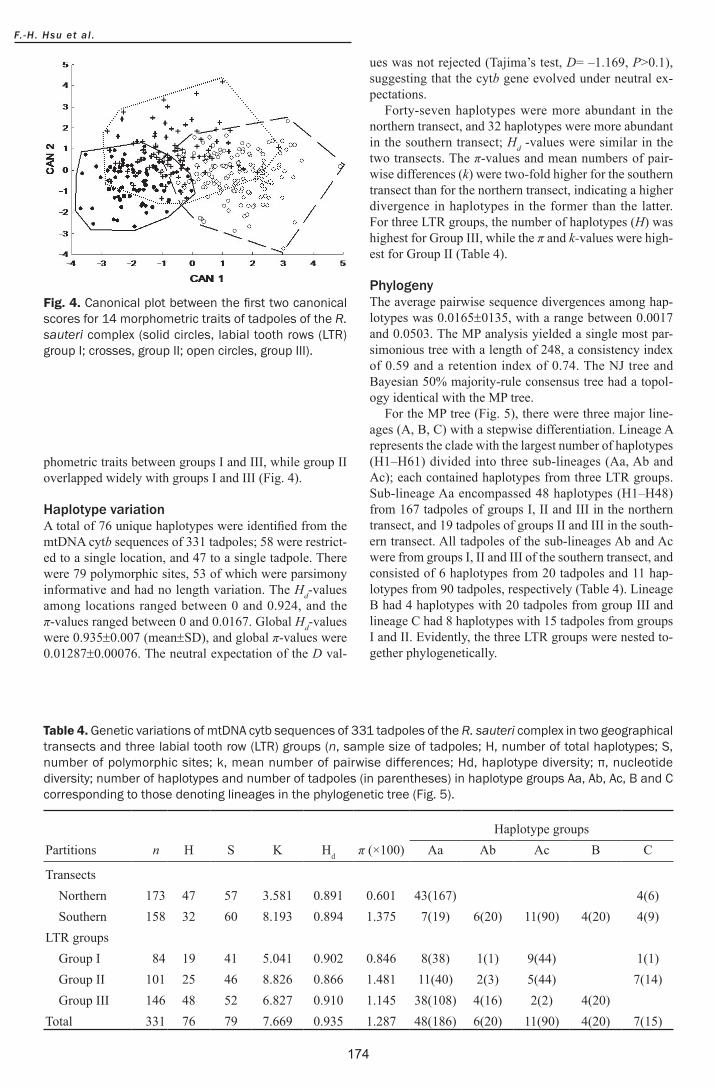
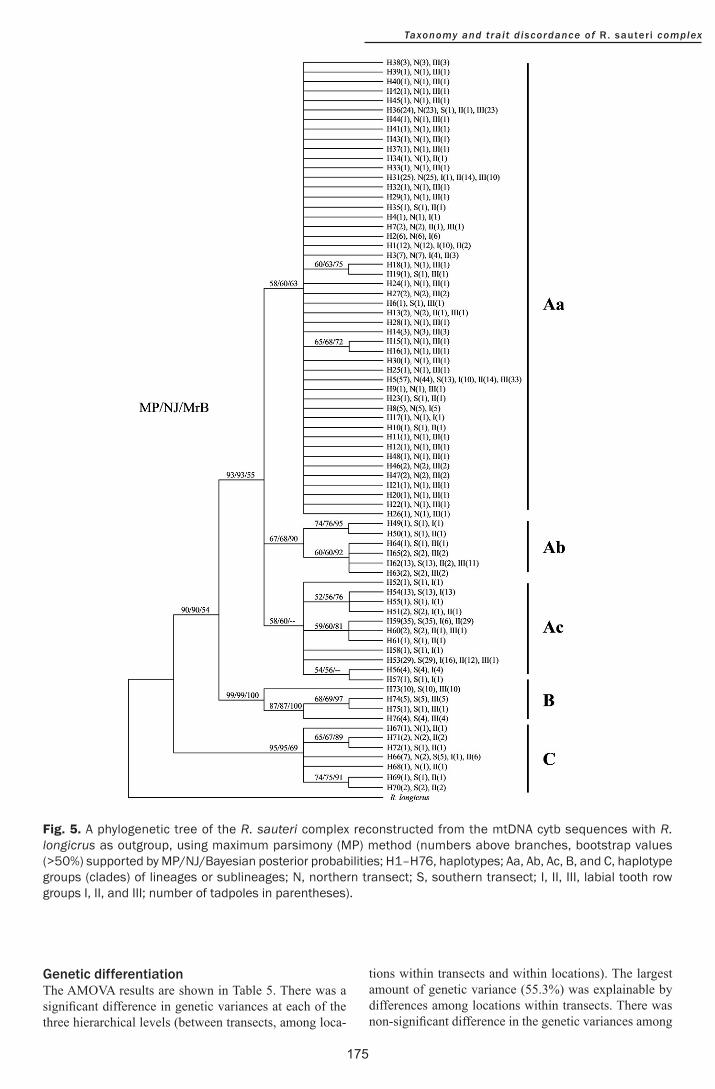
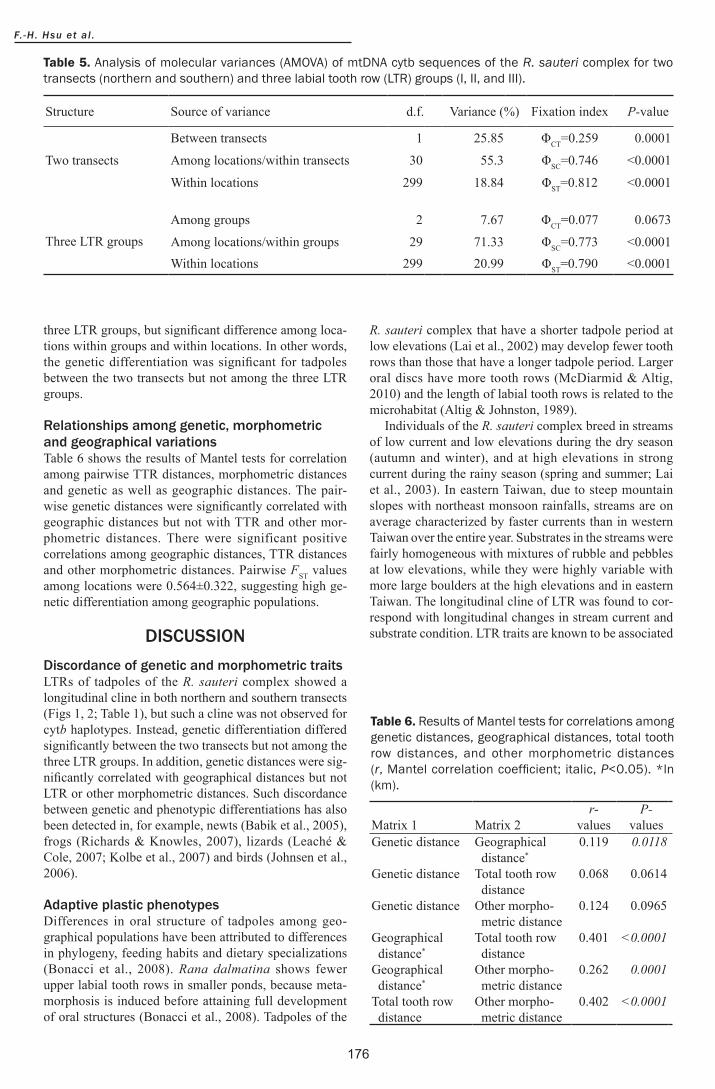