tav havalİmanlari İŞletme a.Ş. and its subsidiaries
TRANSCRIPT

TAV HAVALİMANLARI İŞLETME A.Ş. AND ITS SUBSIDIARIES
CONSOLIDATED FINANCIAL STATEMENTS AS AT 31 DECEMBER 2005, 2004 AND 2003

INDEX TO THE NOTES TO THE CONSOLIDATED FINANCIAL STATEMENTS
Page 1 Background and description of operations............................... 5 2 Adoption of new and revised International Financial Reporting Standards...................................................................
7
3 Significant accounting policies ................................................ 8 4 Critical accounting judgements and key sources of estimation uncertainty................................................................
16
5 Cash and cash equivalents ....................................................... 17 6 Restricted bank balances.......................................................... 18 7 Investments .............................................................................. 18 8 Trade receivables (net)............................................................. 19 9 Related party transactions ........................................................ 19 10 Inventories .............................................................................. 24 11 Other receivables, current and non-current assets................... 25 12 Goodwill ................................................................................. 25 13 Property, plant and equipment ................................................ 26 14 Build-Operate-Transfer (BOT) Investments (net) .................. 26 15 Prepaid concession expenses .................................................. 27 16 Other intangible assets ............................................................ 28 17 Joint ventures .......................................................................... 29 18 Bank loans .............................................................................. 30 19 Obligations under finance leases ............................................ 35 20 Trade payables ........................................................................ 36 21 Other payables and deferred revenue...................................... 37 22 Provisions for employee termination benefits......................... 36 23 Taxation on income ................................................................ 37 24 Commitments, contingencies and contractual obligations...... 41 25 Share capital and legal reserves .............................................. 44 26 Revenue .................................................................................. 45 27 Other operating income .......................................................... 45 28 Other operating expense ......................................................... 46 29 Investment income.................................................................. 47 30 Other gains and losses............................................................. 47 31 Finance costs (net) .................................................................. 47 32 Acquisition of subsidiary ........................................................ 47 33 Derivative financial instruments ............................................. 48 34 Business segments .................................................................. 49 35 Additional events after the balance sheet date ........................ 50 36 Restatement of current and prior year financial statements ..................................................................................
52

INDEPENDENT AUDITORS’ REPORT
To the Board of Directors of TAV Havalimanlari İşletme A.Ş.
1. We have audited the accompanying consolidated balance sheets of TAV Havalimanlari İşletme A.Ş. (the “Company”) and its subsidiaries (together the “Group”) as at 31 December 2005, 2004 and 2003 and the related consolidated statements of income, shareholders’ equity and cash flows for the years ended as of 31 December 2005, 2004 and 2003. These consolidated financial statements are the responsibility of the Group’s management. Our responsibility is to express an opinion on these consolidated financial statements based on our audit. 2. We conducted our audit in accordance with International Standards on Auditing. Those standards require that we plan and perform the audit to obtain reasonable assurance on whether the financial statements are free of material misstatement. An audit includes examining, on a test basis, the evidence supporting the amounts and disclosures in the financial statements. An audit also includes assessing the accounting principles used and significant estimates made by management, as well as evaluating the overall financial statement presentation. We believe that our audit provides a reasonable basis for our opinion. 3. We were not able to observe the taking of the physical inventories of duty free goods and catering as of 31 December 2004, 2003, and 2002, because those dates were prior to the date we were engaged as auditors for the Group. The duty free goods and catering inventory were stated at EUR 4,278,482, EUR 4,291,373, and EUR 3,566,717 at 31 December 2004, 2003, and 2002 respectively. Due to the nature of the Group’s records, we were unable to satisfy ourselves as to the inventory quantities by means of other auditing procedures. 4. In our opinion, the consolidated financial statements referred to above present fairly, in all material respects, the financial position of the Group as of 31 December 2005, 2004 and 2003 except for the effects of such adjustments, if any, as might have been determined to be necessary had we been able to observe the physical inventories of duty free goods and catering, the results of its operations and its cash flows for the years ended 31 December 2005, 2004 and 2003 in accordance with International Financial Reporting Standards (“IFRS”). 5. Without qualifying our opinion we draw your attention to the following: Subsequent 31 December 2005, the Group was not in compliance with certain of its loan covenants and, accordingly, the associated long term loans have been classified as short term loans in 2006 in accordance with IAS 1 “Presentation of Financial Statements” paragraph 65. As a result, the Group’s current liabilities exceed its current assets. However, the lenders, based on the restructuring of the Group (see note 35 Additional Events After the Balance Sheet Date) and fulfillment of required conditions, have sent waiver letters to the Group as of 22 January 2007 which waive all events of default.
DRT BAĞIMSIZ DENETİM VE SERBEST MUHASEBECİ MALİ MÜŞAVİRLİK A.Ş. Member of DELOITTE TOUCHE TOHMATSU İstanbul, 22 December 2006 (31 January 2007 as to the effects of the restatement discussed in Note 36)

TAV HAVALİMANLARI İŞLETME A.Ş. AND ITS SUBSIDIARIES
CONSOLIDATED BALANCE SHEETS
(Amounts expressed in Euro unless otherwise stated)
Notes
(As Restated) 31 December 2005
31 December 2004
31 December 2003
ASSETS CURRENT ASSETS Cash and cash equivalents ....................................................
5
10,928,081
17,709,130
48,596,962
Restricted bank balances ...................................................... 6 135,428,001 — — Investments held for trading................................................. 7 610,178 732,137 406,754 Held-to-maturity investments............................................... 7 — 39,429,572 507,919 Trade receivables (net) ......................................................... 8 11,741,203 4,404,942 6,670,128 Trade receivables from related parties.................................. 9 535,994 3,475,128 275,396 Inventories............................................................................ 10 5,339,262 4,110,611 4,161,284 Built-operate-transfer (BOT) Investment (net), current portion ................................................................................
14
—
48,033,387
—
Prepaid concession expenses, current portion ...................... 15 117,289,312 — — Other receivables and current assets..................................... 11 29,636,084 4,126,557 2,714,097 Total Current Assets .......................................................... 311,508,115 122,021,464 63,332,540 NON CURRENT ASSETS Long term trade receivables (net).........................................
127,167
111
29,554
Available-for-sale investments............................................. 7 28,086 — — Long term loan receivable from related parties.................... 9 202,985,126 130,481,685 68,386,352 Goodwill............................................................................... 12 72,717,730 — — Property, plant and equipment.............................................. 13 18,227,224 1,479,360 446,582 Other intangible assets.......................................................... 16 14,833,834 210,610 70,468 Built-operate-transfer (BOT) Inventory ............................... 10 9,802,672 1,237,972 3,803,789 Built-operate-transfer (BOT) Investment (net)..................... 14 134,333,720 7,428,598 129,897,688 Prepaid concession expenses................................................ 15 308,187,815 — — Other non-current assets ....................................................... 11 56,115,903 9,772 — Deferred tax assets ............................................................... 23 20,275,136 7,800,198 6,287,553 Total Non-Current Assets.................................................. 837,634,413 148,648,306 208,921,986 TOTAL ASSETS ................................................................ 1,149,142,528 270,669,770 272,254,526 LIABILITIES AND SHAREHOLDERS’ EQUITY CURRENT LIABILITIES Bank loans, current portion ..................................................
18
211,490,892
63,935,065
73,081,645
Obligations under finance leases, current portion ................ 19 39,560 179,136 — Loans payable to related parties ........................................... 9 17,800,487 — — Trade payables to related parties .......................................... 9 28,114,654 1,966,779 406,073 Trade payables...................................................................... 20 9,298,370 9,228,966 8,160,053 Derivative financial instruments........................................... 33 1,534,012 — — Provision for employment termination benefits, current portion ................................................................................
22
—
1,903,274
—
Other payables and deferred revenue ................................... 21 14,363,721 28,954,926 1,475,713 Current tax liabilities ............................................................ 23 713,960 857,511 973,181 Total Current Liabilities.................................................... 283,355,656 107,025,657 84,096,665 NON CURRENT LIABILITIES Bank loans ............................................................................
18
673,137,540
40,000,000
18,355,563
Obligations under finance leases .......................................... 19 39,669 — — Provision for employment termination benefits ................... 22 2,359,745 600,279 1,447,771 Other non current liabilities.................................................. 21 19,565,648 51,523 22,693,875 Deferred tax liabilities .......................................................... 23 3,927,151 115,368 — Total Non-Current Liabilities ........................................... 699,029,753 40,767,170 42,497,209 EQUITY Share capital .........................................................................
25
82,060,070
82,489,227
82,383,603
Legal reserves....................................................................... 25 8,362,895 7,942,904 1,158,150 Purchase of shares of entities under common control .......... (12,367,409) — — Translation reserves.............................................................. 183,918 215,247 126,695 Retained earnings ................................................................. 45,106,420 22,229,184 61,485,982 Equity attributable to equity holders of the parent ................................................................................
123,345,894
112,876,562
145,154,430
Minority interest ................................................................... 43,411,225 10,000,381 506,222 Total Equity ........................................................................ 166,757,119 122,876,943 145,660,652 TOTAL LIABILITIES AND EQUITY ............................ 1,149,142,528 270,669,770 272,254,526
The accompanying notes form an integral part of these financial statements.

TAV HAVALİMANLARI İŞLETME A.Ş. AND ITS SUBSIDIARIES
CONSOLIDATED INCOME STATEMENTS
(Amounts expressed in Euro unless otherwise stated)
Notes
(As restated) Year Ended 31 December 2005
(As restated) Year Ended 31 December 2004
(As restated) Year Ended 31 December 2003
Continuing operations Operating income......................................
26
288,325,572
212,830,690
192,869,995
Other operating income ............................ 27 16,460,112 9,491,492 8,341,434 Cost of catering inventory sold ................. (5,923,525) (4,786,416) (3,048,274) Cost of duty free inventory sold................ (39,882,122) (35,792,515) (32,003,540) Cost of services rendered.......................... (14,836,949) (235,382) (90,133) Employee benefit expense ........................ (40,754,489) (25,588,384) (18,879,414) Concession rent expenses ......................... (69,915,181) — — Depreciation and amortisation expense .... (51,328,398) (94,284,836) (72,538,128) Other operating expenses.......................... 28 (54,099,361) (29,612,819) (29,839,670) Operating profit ........................................ 28,045,659 32,021,830 44,812,270 Investment income.................................... 29 15,224,762 7,066,412 8,512,928 Other gains and losses............................... 30 407,938 (779,318) 1,229,093 Finance costs (net) .................................... 31 (40,275,731) (8,312,976) (14,444,085) Transaction gain/(loss) (net) ..................... 27,152,931 (16,380,879) (2,586,382) Monetary gain/(loss) (net) ........................ 96,152 (89,206) 111,116 Profit before tax ........................................ 30,651,711 13,525,863 37,634,940 Income tax benefit/(expense).................... 23 9,889,549 (655,616) 28,977,867 Profit for the year from continuing operations................................................
40,541,260
12,870,247
66,612,807
Attributable to: Equity holders of the parent...................... 27,426,632 13,502,687 66,734,270 Minority interest ....................................... 13,114,628 (632,440) (121,463) 40,541,260 12,870,247 66,612,807 Weighted average number of shares outstanding..............................................
40,000,000
40,000,000
40,000,000
Earnings/(loss) per share — basic and diluted: ....................................................
0.69
0.34
1.67
The accompanying notes form an integral part of these financial statements.

TAV HAVALİMANLARI İŞLETME A.Ş. AND ITS SUBSIDIARIES
CONSOLIDATED STATEMENTS OF CHANGES IN EQUITY
(Amounts expressed in Euro unless otherwise stated)
Share Capital
Legal Reserves
Translation Reserves
(As restated) Retained
Earnings
Purchase of shares of
entities under common
control
(As restated) Attributable
to Equity Holders of
the Parent
(As restated) Minority
Interest
(As restated) Total
Balance at 1 January 2003 ...............
82,383,603
722,253
—
(524,837)
—
82,581,019
564,332
83,145,351
Exchange differences on translation reserves ........................
—
—
126,695
—
—
126,695
63,353
190,048
Transfers (note 25)......... — 435,897 — (435,897) — — — —
Profit for the year........... — — — 66,734,270 — 66,734,270 (121,463) 66,612,807 Dividends....................... — — — (4,287,554) — (4,287,554) — (4,287,554) Balance at 1 January 2004 ...............
82,383,603
1,158,150
126,695
61,485,982
—
145,154,430
506,22
145,660,652
Exchange differences on translation reserves ........................
—
—
88,552
—
—
88,552
44,281
132,833 Transfers (note 25)......... — 6,784,754 — (6,784,754) — — — — Profit for the year........... — — — 13,502,687 — 13,502,687 (632,440) 12,870,247 Dividends....................... — — — (45,869,107) — (45,869,107) — (45,869,107) Issue of share capital...........................
105,624
—
—
(105,624)
—
—
10,082,318
10,082,318
Balance at 1 January 2005 ...............
82,489,227
7,942,904
215,247
22,229,184
—
112,876,562
10,000,381
122,876,943
Effect of group structure change ...........
(429,157)
—
—
—
(12,367,409)
(12,796,566)
—
(12,796,566)
Exchange differences on translation reserves ........................
—
—
(31,329)
—
—
(31,329)
(12,644)
(43,973)
Transfers (note 25)......... — 419,991 — (419,991) — — — —
Profit for the year........... — — — 27,426,632 — 27,426,632 13,114,628 40,541,260
Dividends....................... — — — (4,129,405) — (4,129,405) — (4,129,405) Issue of share capital...........................
—
—
—
—
—
—
20,308,860
20,308,860
Balance at 31 December 2005 (as restated) .......................
82,060,070
8,362,895
183,918
45,106,420
(12,367,409)
123,345,894
43,411,225
166,757,119
The accompanying notes form an integral part of these financial statements.

TAV HAVALİMANLARI İŞLETME A.Ş. AND ITS SUBSIDIARIES
CONSOLIDATED CASH FLOW STATEMENTS
(Amounts expressed in Euro unless otherwise stated)
Notes
(As restated) Year Ended 31 December 2005
(As restated) Year Ended 31 December 2004
(As restated) Year Ended 31 December 2003
OPERATING ACTIVITIES Profit/(Loss) for the year/period .................................................................
40,541,260
12,870,247
66,612,807
Adjustments to reconcile net profit to net cash provided by operating activities: -Depreciation of BOT Investments............................................................. 14 48,324,992 93,867,220 71,788,118 -Depreciation of property, plant and equipment ......................................... 13 2,210,423 385,086 726,545 -amortisation of other intangible assets ...................................................... 16 792,983 32,530 23,466 -amortisation of concession asset ............................................................... 15 69,915,181 — — -VAT expenses paid to DHMİ.................................................................... 4,417,918 — — -Provision for employment termination benefits ........................................ 22 1,758,126 1,133,670 614,450 -Allowance for doubtful receivables........................................................... 641,211 137,083 49,977 -Discount on receivables and payables ....................................................... 101,989 (149,722) (41,604) -Gain on disposal of property, plant and equipment ................................... (1,150,163) — (1,758,695) -Unused vacation accrual............................................................................ 21 593,038 (42,155) (43,244) -Provision for slow moving inventory ........................................................ 10 43,311 53,417 10,914 -Unrealised foreign exchange differences on loans .................................... (6,340,756) 1,475,243 (3,489,877) -Accrued interest income............................................................................ (11,929,522) (3,611,280) (4,011,084) -Accrued interest expense........................................................................... 11,384,805 6,929,065 9,512,229 -Income tax (income)/expense net of monetary gain .................................. 23 (11,047,962) 936,910 (29,594,100) -Mark to market valuation of derivative instruments.................................. 1,534,012 — — Operating cash flows before movements in working capital ...................... 151,790,846 114,017,314 110,399,902 -(Increase)/decrease in trade receivables .................................................... (6,401,043) 2,085,203 921,722 -(Increase)/decrease in inventories ............................................................. (9,495,362) 2,547,767 (1,758,412) -(Increase)/decrease in related party receivables ........................................ 2,921,879 (3,174,563) (281,941) -Increase in other receivables and current assets ........................................ (4,093,078) (1,420,897) (978,168) -Increase/(decrease) in trade payables ........................................................ (4,397,223) 1,215,218 2,651,934 -Increase/(decrease) in advances received .................................................. 721,247 102,922 (328,160) -Increase/(decrease) in related party payables ............................................ 25,994,367 1,577,711 (252,223) -Increase in other payables and current liabilities....................................... (15,577,219) 549,940 441,882 -Increase in restricted bank balances .......................................................... (135,428,001) — — Cash generated from operations ................................................................. 6,036,413 117,500,615 110,816,536 -Income taxes paid...................................................................................... 23 (2,278,221) (2,449,857) (2,789,262) -Interest paid............................................................................................... (6,762,335) (7,919,709) (8,036,986) -Retirement benefits paid............................................................................ 22 (1,550,045) (77,888) (106,010) Net cash provided from operating activities........................................... (4,554,188) 107,053,161 99,884,278 INVESTING ACTIVITIES Net change in investments held for trading/held to -maturity .....................................................................................................
39,551,531
(39,247,036)
3,029,151 -Loans collected/(provided) from/(to) related parties ................................. (60,573,919) (58,484,053) (11,326,727) -Acquisition of available for sale investments ............................................ (28,086) — — -Acquisition of subsidiary .......................................................................... 32 (96,161,277) — — -Payment of concession expenses............................................................... 15 (495,392,308) — — -Proceeds on tangible and intangible assets disposed ................................. 1,949,280 29,791 2,200,109 -Additions to BOT Investments.................................................................. 14 (126,930,064) (19,315,352) (42,606,543) -Purchases of property, plant and equipment.............................................. 13 (5,422,112) (1,187,009) (70,701) -Purchases of intangible assets ................................................................... 16 (264,425) (168,872) (19,885) -Change in VAT portion of prepaid rent..................................................... (80,960,746) — — -Change in other long term investments ..................................................... 18,742,961 4,241,902 3,654,768 Net cash used in investing activities ........................................................ (805,489,165) (114,130,629) (45,139,828) CASH FLOWS FROM FINANCING ACTIVITIES -New borrowings raised..............................................................................
885,328,713
93,728,439
39,608,403
-Repayment of borrowings ......................................................................... (103,149,879) (81,715,185) (100,174,625) -New loans raised from related parties ....................................................... 17,800,487 — — -Purchase of shares of entities under common control ............................... (12,796,566) — — -Dividends paid .......................................................................................... (4,129,405) (45,869,107) (4,287,554) -Issue of share capital by shareholders ....................................................... 20,308,861 10,082,318 — -Effect of group structure change ............................................................... — — — -Repayments of obligations under finance leases ....................................... (99,907) (36,829) — Net cash from/(used in) from financing activities ................................ 803,262,304 (23,810,364) (64,853,776) NET (DECREASE)/INCREASE IN CASH AND CASH EQUIVALENTS ....................................................................................... (6,781,049) (30,887,832) (10,109,326) CASH AND CASH EQUIVALENTS AT THE BEGINNING OF YEAR......................................................................................................... 17,709,130 48,596,962 58,706,288 CASH AND CASH EQUIVALENTS AT THE END OF YEAR.......... 10,928,081 17,709,130 48,596,962

TAV HAVALİMANLARI İŞLETME A.Ş. AND ITS SUBSIDIARIES
NOTES TO THE CONSOLIDATED FINANCIAL STATEMENTS
(Amounts expressed in Euro unless otherwise stated)
1. BACKGROUND AND DESCRIPTION OF OPERATIONS
TAV Havalimanlari İşletme A.Ş. (“TAV” or “the Company”) was established in 1997 under the name of Tepe Akfen Vie Yatirim Yapim ve İşletme A.Ş. in Turkey for the purpose of reconstructing the İstanbul Atatürk Airport (International Lines Building) and operating it for a limited period of 66 months. In 2005, the Company’s name has been changed to TAV Havalimanlari İşletme A.Ş.
On 29 December 2005, the ultimate shareholders of the Company transferred their shares in certain companies and joint ventures, which are responsible for the operation of the İstanbul airport, to the Company. As a result of this share transfer, the Company became parent company of these subsidiaries. The immediate parent and ultimate controlling party of the TAV and its subsidiaries are Tepe, Akfen Group and Hyper Foreign Trade Holland N.V.
TAV, its subsidiaries and its joint ventures are collectively referred to as “the Group” in this report. The details of the Company’s subsidiaries at 31 December 2005 are as follows:
31 December 2005 Name of Subsidiary
Principal Activity
Place of incorporation and operation
Proportion of ownership interest %
Proportion of voting power held %
BTA Havalimanlari Yiyecek ve İçecek Hizmetleri A.Ş. (“BTA”).................................................................
Food and Beverage
Turkey
66.66
66.66 Services TAV İşletme Hizmetleri A.Ş. (“TAV İşletme”) ........................................................................
O&M, Lounge Services
Turkey
99.99
99.99 TAV Havalimanlari Terminal İşletmeciliği A.Ş .(“TAV HTI”) ................................................................
İstanbul Airport
Turkey
100.00
100.00 terminal services TAV Esenboğa Yatirim Yapim ve İşletme A.Ş. (“TAV Esenboğa”) ....................................................................
Ankara Airport
Turkey
1
100.00 terminal services İzmir Adnan Menderes Havalimani Uluslararasi Terminal İnşaati, İşletmeciliği ve Yatirim A.Ş (“TAV İzmir”)(*).......................................................................
İzmir Airport
Turkey
38.99
100.00 terminal services
The Company’s ownership interest of TAV İzmir represents the effective ownership interest via HAVAŞ. TAV Esenboğa is reflected as a subsidiary due to a formal signed protocol between TAV and shareholders of TAV Esenboğa which transfers all operational and financial control of TAV Esenboğa to TAV.
In July 2005, HAVAS owned 64.99% of TAV İzmir, resulting in TAV’s indirect ownership of 39% of TAV İzmir. At the time of the acquisition of HAVAS, the other shareholder in HAVAS agreed to transfer the other shares of TAV İzmir shares under conditions determined by TAV and in doing so relinquished all any rights to or control of the shares in TAV İzmir. Accordingly, TAV in substance owns and controls 100% of TAV İzmir from July 2005. In 2006, HAVAS purchased an additional 35% of the shares in TAV İzmir.

1. BACKGROUND AND DESCRIPTION OF OPERATIONS(cont’d)
The details of the Company’s joint ventures at 31 December 2005 are as follows;
31 December 2005 Name of Joint Venture
Principal Activity
Place of incorporation and operation
Proportion of ownership interest %
Proportion of voting power held %
ATÜ Turizm İşletmeciliği A.Ş. (“ATÜ”)................................................................
Duty free Services
Turkey
49.98
50.00
Havaş Havalimanlari Yer Hizmetleri A.Ş. (“HAVAŞ”) ..........................................................
Ground handling
Turkey
60.00
50.00
services
Description of Operations
The Group’s operations relate to the construction and operation of airports. The Group companies incorporated in Turkey enter into Build — Operate — Transfer (BOT) Agreements with Devlet Hava Meydanlari İşletmesi Genel Müdürlüğü (DHMİ), and the Directorate General of State Airports of Georgia. Under these agreements the Group agrees to build, or reconstruct, an airport within specified period of time and in exchange receives the right to operate the airport for a preestablished amount of time. At the end of the contract, the Group transfers the ownership of the building back to the Airport Authorities. In addition, the Group enters into subsequent stand alone contracts for the operation of airports.
BOT Agreements
During the periods presented in these financial statements the Group had three BOT Agreements in place.
Atatürk International Airport
A BOT agreement was executed between TAV and DHMİ regulating the reconstruction, investment and operations of the Atatürk International Airport International Lines Building (referred as “Atatürk Airport Terminal” or “AAT”) in 1998. TAV was required to complete the construction by August 2000 and then had the right to operate the facilities of the International Lines Building for 3 years, 8 months and 20 days. TAV completed the reconstruction of the International Lines Building in January 2000 and started the operation seven months early, after completion of a significant portion of the construction. Construction of remaining parts of the project was finalised in August 2000. DHMİ and the Undersecretariat of Treasury gave their acceptance of the project in August 2000 when the investment period was formally completed.
An addendum to the agreement was made in June 2000. Under the terms of the addendum, TAV committed to enlarge the International Lines Building by 30% by 2004. In return for extending the International Lines Building, operation period of TAV was increased by 13 months 12 days (to approximately 66 months in total) through June 2005. The contract expired in June 2005 and TAV transferred AAT to DHMİ.
Ankara Esenboğa International Airport
A BOT agreement was executed between TAV and DHMİ on 18 August 2004 regulating the reconstruction, investment and operations of the Ankara Esenboğa International Airport. According to the Agreement, TAV is required to complete the construction within 36 months after the agreement date and will then have the right to operate the facilities of the Ankara Esenboğa International Airport for a period of 15 years and 8 months. In the operations phase, TAV Esenboğa is going to provide mainly passenger, ramp and check-in counter services.
İzmir Adnan Menderes Airport
A BOT agreement was executed between TAV and DHMİ on 20 May 2005 regulating the reconstruction, investment and operations of the İzmir Adnan Menderes Airport. According to the Agreement, TAV is required to complete the construction within 24 months after the agreement date and will then have the right to operate the facilities of the İzmir Adnan Menderes Airport for a period of 6 years, 7 months and 29 days. In the operations phase, TAV İzmir is going to provide mainly passenger, ramp and check-in counter services.

1. BACKGROUND AND DESCRIPTION OF OPERATIONS(cont’d)
Description of Operations (cont’d) Operations Contracts
During 2005, the Group bid on, and was awarded, contracts for the operations of AAT. Under these contracts the Group continues to operate the international terminal as it did under the BOT described above, and was awarded contracts for other operations of the airport. The contract includes the following:
Terminal services — The Group operates the terminal and mainly give passenger, ramp and check-in counter services. A fee is charged to each airline based on the number of passengers that utilise the airport, ramps utilised by aircrafts and check-in counters utilised by the airlines.
Duty free goods — Duty free goods are available for purchase by both arriving and departing passengers. The sales are operated by the Group or, in certain circumstances, subcontracted to other companies in exchange for a commission based on sales.
Catering and airport hotel services — The Group has the right to manage all food and beverage operations within the terminal both for the passengers and the terminal personnel. The Group subcontracts the operation of certain of the food and beverage operations in exchange for a commission based on sales.
Area allocation revenue — The Group has right to rent office space at the airport to airlines for ticket office, banks, etc.
In addition to above services, the Group also provides the following services:
Ground handling — The group is responsible for all ground handling operations. Ground handling involves providing traffic, ramp, flight operation, cargo and all other ground handling services for domestic and international flights under the Civil Aviation Legislation license (“SHY 22”). Additional activities include shuttle bus and car parking.
Lounge services — The Group has the right to operate or rent the lounges to provide CIP or VIP services to the passengers who are member of.
Bus and car parking operations — The Group has the right to operate operations for spaces in the car park and for valet parking service. Revenues from bus operations include from shuttle services from airports to city centers
This concession contract requires the Company to make annual rent payments totaling USD 2,543,000,000 (EUR 2,149,415,685) excluding VAT over the life of the contract, of which USD 584,890,000 (EUR 491,231,077) excluding VAT has been prepaid at the beginning of the concession agreement under the terms of the contract. In addition, the Company is required to make certain enhancements and improvements to the domestic terminal within the first year of the concession agreement, and to maintain the facilities through the concession period.
The Group employs approximately 4,790 (average: 4,160) people as of 31 December 2005, 1,660 (average: 1,550) people as of 31 December 2004 and 1,315 (average: 1,300) people as of 31 December 2003.

2. ADOPTION OF NEW AND REVISED INTERNATIONAL FINANCIAL REPORTING STANDARDS
In the current year, the Group has adopted all of the new and revised Standards and Interpretations issued by the International Accounting Standards Board (“the IASB”) and the International Financial Reporting Interpretations Committee (“IFRIC”) of the IASB that are effective for accounting periods beginning on 1 January 2005.
At the date of authorisation of these financial statements, the following Standards and Interpretations were in issue but not yet effective:
IFRS 7 Financial Instruments: Disclosures IFRS 8 Operating Segments IFRIC 7 Applying the Restatement Approach under IAS 29 Financial Reporting in Hyperinflationary Economies IFRIC 8 Scope of IFRS 2 IFRIC 9 Reassessment of Embedded Derivatives IFRIC 10 Interim Financial Reporting and Impairment IFRIC 11 Group and Treasury Share Transactions IFRIC 12 Service Concession Arrangements
The management of the Group does not anticipate that the adoption of these Standards and Interpretations in future periods will have a material impact on the financial statements of the Group.
3. SIGNIFICANT ACCOUNTING POLICIES
Basis of presentation of consolidated financial statements
The accompanying consolidated financial statements have been prepared in accordance with International Financial Reporting Standards (“IFRS”). The Group maintains its books of account and prepares its statutory financial statements in Yeni Türk Lirasi (TRY) in accordance with accounting principles in the Turkish Commercial Code and tax legislation. The accompanying consolidated financial statements expressed in Euro (EUR), the functional currency of the Group, are based on the statutory records, with adjustments and reclassifications, including re-measurement from TRY to Euro for the purpose of fair presentation in accordance with IFRS.
The principal accounting policies adopted are set out below.
Foreign currencies
Although the currency of the country in which the Group is domiciled is TRY, the Group’s functional currency and reporting currency is Euro. Euro is used to a significant extent in, or has a significant impact on, the operations of the Group and reflects the economic substance of the underlying events and circumstances relevant to the Group. Therefore, the Group uses the Euro in measuring items in its financial statements and as the reporting currency. All currencies other than the currency selected for measuring items in the financial statements are treated as foreign currencies. Accordingly, transactions and balances not already measured in Euro have been re-measured to Euro in accordance with the relevant provisions of IAS 21 (“The Effects of Changes in Foreign Exchange Rates”).
The individual financial statements of each group entity are presented in the currency of the primary economic environment in which the entity operates (its functional currency). For the purpose of the consolidated financial statements, the results and financial position of each entity are expressed in EUR, which is the functional currency of the Group, and the presentation currency for the consolidated financial statements.
In preparing the financial statements of the individual entities, transactions in currencies other than entity’s functional currency are recorded at the rates of exchange prevailing on the dates of the transactions. At each balance sheet date, monetary assets and liabilities that are denominated in foreign currencies are retranslated at the rates prevailing on the balance sheet date. Non-monetary items carried at fair value that are denominated in foreign currencies are translated at the rates prevailing on the date when the fair value was determined. Non-monetary items that are measured in terms of historical cost in a foreign currency are not retranslated.
Exchange differences arising on the settlement of monetary items, and on the retranslation of monetary items, are included in profit or loss for the period. Exchange differences arising on the retranslation of non-monetary items carried at fair value are included in profit or loss for the period except for differences arising on the retranslation of non-monetary items in respect of which gains and losses are recognised directly in equity. For such non-monetary items, any exchange component of that gain or loss is also recognised directly in equity.

3. SIGNIFICANT ACCOUNTING POLICIES (cont’d)
For the purpose of presenting consolidated financial statements, the assets and liabilities of the Group’s foreign operations are translated at exchange rates prevailing on the balance sheet date. Income and expense items are translated at the average exchange rates for the period, unless exchange rates fluctuate significantly during that period, in which case the exchange rates at the date of transactions are used. Exchange differences arising, if any, are classified as equity and transferred to the group’s translation reserve. Such translation differences are recognised as income or as expenses in the period in which the operation is disposed of.
The financial statements of subsidiaries that report in the currency of a hyperinflationary economy (Turkey) are restated in terms of the measuring unit current at the balance sheet dates until 31 December 2005 before they are translated into Euros.
The TRY/EUR exchange rates, the annual change against EUR and Turkish countrywide wholesale price index (“WPI”) inflation as of the end of each year are as follows:
Year: 2005 2004 2003 TRY/EUR...................................................................... 1.5875 1.8268 1.7451 TRY (Appreciation)/Depreciation Against the EUR..... (13%) 5% 2% WPI inflation ................................................................. 4.5% 13.8% 13.9%
The financial statements of subsidiaries, namely BTA and TAV İşletme, which have the TRY as their functional currency, were restated to compensate for the effect of changes in the general purchasing power of the TRY, as of 31 December 2005, in accordance with IAS 29 as TRY is the currency of a hyperinflationary economy. Financial statements of such subsidiaries are then translated into Euro, the reporting currency of the Group, at the closing balance sheet exchange rate.
Basis of Consolidation
The consolidated financial statements consolidate the financial statements of the Company and entities controlled or jointly controlled by the Company (its subsidiaries). Control is achieved where the Company has the power to govern the financial and operating policies of an entity so as to obtain benefits from its activities.
Each entity is consolidated based on the following methods:
TAV HTI and TAV İzmir are fully consolidated.
BTA, TAV İşletme and TAV Esenboğa are fully consolidated with a minority interest removed.
ATÜ and HAVAŞ are proportionally consolidated.
Although the Company owns insignificant amount of shares of TAV Esenboğa, it has the power to appoint and remove the majority of the board of directors and control of the entity by the board. Consequently, TAV Esenboğa is controlled by the Company and is consolidated in these financial statements.
The results of a subsidiary, Havaş, acquired from independent third party, during the year are included in the consolidated income statement from the effective date of acquisition.
BTA, TAV İşletme, TAV HTI, TAV Esenboğa, and ATÜ were acquired from parents of the Company on 29 December 2005. The acquired subsidiaries and the joint venture which were under common control, are accounted through a restatement of all periods presented.
Where necessary, adjustments are made to the financial statements of subsidiaries to bring their accounting policies into line with those used by other members of the Group.
All intra-group transactions, balances, income and expenses are eliminated on consolidation.
Minority interests in the net assets of consolidated subsidiaries are identified separately from the Group’s equity therein. Minority interests consist of the amount of those interests at the date of the original business combination (see below) and the minority’s share of changes in equity since the date of the combination. Losses applicable to the minority in excess of the minority’s interest in the subsidiary’s equity are allocated against the interests of the Group except to the extent that the minority has a binding obligation and is able to make an additional investment to cover the losses.

3. SIGNIFICANT ACCOUNTING POLICIES (cont’d)
Business combinations for independent third party purchases
Acquisitions from third parties are accounted for using the purchase method. The cost of the acquisition is measured at the aggregate of the fair values, at the date of exchange, of assets given, liabilities incurred or assumed, and equity instruments issued by the Group in exchange for control of the acquiree, plus any costs directly attributable to the business combination. The acquiree’s identifiable assets, liabilities and contingent liabilities that meet the conditions for recognition under IFRS 3 are recognised at their fair values at the acquisition date.
Goodwill arising on acquisition is recognised as an asset and initially measured at cost, being the excess of the cost of the business combination over the Group’s interest in the net fair value of the identifiable assets, liabilities and contingent liabilities recognised.
The interest of minority shareholders in the acquiree is initially measured at the minority’s proportion of the net fair value of the assets, liabilities and contingent liabilities recognised.
Business combinations for entities under common control
Acquisitions from entities under common control are accounted for by use the uniting of interests method of accounting. Accordingly, the financial statements of the Group are retrospectively restated to reflect the effect of the structure change for the comparative years 2004 and 2003.
Interests in joint ventures
A joint venture is a contractual arrangement whereby the Group and other parties undertake an economic activity that is subject to joint control that is when the strategic financial and operating policy decisions relating to the activities require the unanimous consent of the parties sharing control.
Where a group entity undertakes its activities under joint venture arrangements directly, the Group’s share of jointly controlled assets and any liabilities incurred jointly with other venturers are recognised in the financial statements of the relevant entity and classified according to their nature. Liabilities and expenses incurred directly in respect of interests in jointly controlled assets are accounted for on an accrual basis. Income from the sale or use of the Group’s share of the output of jointly controlled assets, and its share of joint venture expenses, are recognised when it is probable that the economic benefits associated with the transactions will flow to/from the Group and their amount can be measured reliably.
Joint venture arrangements that involve the establishment of a separate entity in which each venturer has an interest are referred to as jointly controlled entities. The Group reports its interests in jointly controlled entities using proportionate consolidation. The Group’s share of the assets, liabilities, income and expenses of jointly controlled entities are combined with the equivalent items in the consolidated financial statements on a line-by- line basis.
Where the Group transacts with its jointly controlled entities, unrealised profits and losses are eliminated to the extent of the Group’s interest in the joint venture.
Goodwill
Goodwill arising on the acquisition of a subsidiary or a jointly controlled entity represents the excess of the cost of acquisition over the Group’s interest in the net fair value of the identifiable assets, liabilities and contingent liabilities of the subsidiary or jointly controlled entity recognised at the date of acquisition. Goodwill is initially recognised as an asset at cost and is subsequently measured at cost less any accumulated impairment losses.
For the purpose of impairment testing, goodwill is allocated to each of the Group’s cash-generating units expected to benefit from the synergies of the combination. Cash-generating units to which goodwill has been allocated are tested for impairment annually, or more frequently when there is an indication that the unit may be impaired. If the recoverable amount of the cash-generating unit is less than the carrying amount of the unit, the impairment loss is allocated first to reduce the carrying amount of any goodwill allocated to the unit and then to the other assets of the unit pro-rata on the basis of the carrying amount of each asset in the unit. An impairment loss recognised for goodwill is not reversed in a subsequent period.
On disposal of a subsidiary or a jointly controlled entity, the attributable amount of goodwill is included in the determination of the profit or loss on disposal.

3. SIGNIFICANT ACCOUNTING POLICIES (cont’d)
Revenue recognition
Revenue is measured at the fair value of the consideration received or receivable and represents amounts receivable for goods and services provided in the normal course of business, net of discounts and sales related taxes.
Aviation income: Aviation income is recognised based on the daily reports obtained from related airline companies for terminal service income charged to passengers; as well as for ramps utilised by aircraft and check-in counters utilised by the airlines.
Area allocation income: Area allocation income is recognised by the issuance of monthly invoices based on the contracts made for allocated areas in the airport.
Sales of duty free goods: Sales of goods are recognised when goods are delivered and title has passed.
Catering services income: Catering services income is recognised when services are provided. The Group defers revenue for collections from long term contracts until the services have been provided.
There are no deferred costs related to these revenues since these are related with the selling rights given to food and beverage companies to sell their products at Domestic and International Lines.
Ground handling income: Ground handling income is recognised when services are provided.
Commission: The Group subcontracts the right to operate certain of the catering services to third parties. The third parties pay the Group a specified percentage of their sales for the right to operate these concessions. The commission revenue is recognised when in every 2 to 3 days according to sales reports provided from the entities.
Lounge services: Lounge service income is recognised when services are provided.
Bus and car parking operations: Income from bus and car parking operations is recognised when services are provided.
In addition, the Group has other income as summarised below:
Interest income is accrued on a time basis, by reference to the principal outstanding and at the effective interest rate applicable, which is the rate that exactly discounts estimated future cash receipts through the expected life of the financial asset to that asset’s net carrying amount.
Dividend income from investments is recognised when the shareholders’ rights to receive payment have been established.
Inventories
Inventories are stated at the lower of cost and net realisable value. Cost comprises direct materials and, where applicable, and other related costs that have been incurred in bringing the inventories to their present location and condition. Cost is calculated using the First-in-First-out (“FIFO”) method. Net realisable value represents the estimated selling price less all estimated costs of completion and costs to be incurred in marketing, selling and distribution.
Property, plant and equipment
Property, plant and equipment are carried at cost less accumulated depreciation and any accumulated impairment losses. Depreciation is charged so as to write off the cost or valuation of assets, other than land and construction in progress, over their estimated useful lives, using the straight line method.
Assets held under finance leases are depreciated over their expected useful lives on the same basis as owned assets or, where shorter, the term of the relevant lease.
The gain or loss arising on the disposal or retirement of an item of property, plant and equipment is determined as the difference between the sales proceeds and the carrying amount of the asset and is recognised in profit or loss.

3. SIGNIFICANT ACCOUNTING POLICIES (cont’d)
Build Operate Transfer (BOT) Investment
All construction expenditures and equipment and system investments, made during BOT period according to the agreements commenced with DHMİ in the context of a Build-Operate-Transfer model, are accounted as BOT Investments.
BOT investments related to building are depreciated during the operation period of BOT. Other BOT assets are depreciated based on their useful lives not to exceed the BOT operation period.
Accounting for Operations Contract
The costs associated with the operations contract primarily include rental payments and payments enhance and improve the domestic terminal at AAT. The Company prepaid certain rental amounts and the prepayment is deferred as prepaid rent and is recognised over the life of the prepayment period. The amounts the Company incurs to enhance and improve the domestic terminal are recorded as prepaid development expenditures and are being amortised over the life of the associated contract. Any other costs associated with regular maintenance are expensed in the period in which they are incurred.
Intangible assets
Intangible assets are carried at historical cost and are presented after amortization and impairment loss. Purchased intangible assets, primarily software, are amortized over five years using the straight-line method.
Impairment of tangible and intangible assets excluding goodwill
At each balance sheet date, the Group reviews the carrying amounts of its tangible and intangible assets carried at cost less accumulated depreciation to determine whether there is any indication that those assets have suffered an impairment loss. If any such indication exists, the recoverable amount of the asset is estimated in order to determine the extent of the impairment loss (if any). Where it is not possible to estimate the recoverable amount of an individual asset, the Group estimates the recoverable amount of the cash-generating unit to which the asset belongs.
Recoverable amount is the higher of fair value less costs to sell and value in use. In assessing value in use, the estimated future cash flows are discounted to their present value using a pre-tax discount rate that reflects current market assessments of the time value of money and the risks specific to the asset.
If the recoverable amount of an asset (or cash-generating unit) is estimated to be less than its carrying amount, the carrying amount of the asset (cash-generating unit) is reduced to its recoverable amount. An impairment loss is recognised immediately in profit or loss, unless the relevant asset is carried at a revalued amount, in which case the impairment loss is treated as a revaluation decrease.
Where an impairment loss subsequently reverses, the carrying amount of the asset (cash-generating unit) is increased to the revised estimate of its recoverable amount, but so that the increased carrying amount does not exceed the carrying amount that would have been determined had no impairment loss been recognised for the asset (cash-generating unit) in prior years. A reversal of an impairment loss is recognised immediately in profit or loss, unless the relevant asset is carried at a revalued amount, in which case the reversal of the impairment loss is treated as a revaluation increase.
Borrowing costs
Borrowing costs directly attributable to the acquisition and construction of qualifying assets, which are assets that necessarily take a substantial period of time to get ready for their intended use or sale, are added to the cost of those assets, until such time as the assets are substantially ready for their intended use or sale. Investment income earned on the temporary investment of specific borrowings pending their expenditure on qualifying assets is deducted from the borrowing costs eligible for capitalisation.
All other borrowing costs are recognised in profit or loss in the period in which they are incurred.

3. SIGNIFICANT ACCOUNTING POLICIES (cont’d)
Taxation and deferred income taxes
Turkish tax legislation does not permit a parent company and its subsidiary to file a consolidated tax return. Therefore, provisions for taxes, as reflected in the accompanying consolidated financial statements, have been calculated on a separate-entity basis.
Income tax expense represents the sum of the tax currently payable and deferred tax.
The tax currently payable is based on taxable profit for the year. Taxable profit differs from profit as reported in the income statement because it excludes items of income or expense that are taxable or deductible in other years and it further excludes items that are never taxable or deductible. The Group’s liability for current tax is calculated using tax rates that have been enacted or substantively enacted by the balance sheet date.
Deferred tax is recognised on differences between the carrying amounts of assets and liabilities in the financial statements and the corresponding tax bases used in the computation of taxable profit, and are accounted for using the balance sheet liability method. Deferred tax liabilities are generally recognised for all taxable temporary differences and deferred tax assets are recognised to the extent that it is probable that taxable profits will be available against which deductible temporary differences can be utilised. Such assets and liabilities are not recognised if the temporary difference arises from goodwill or from the initial recognition (other than in a business combination) of other assets and liabilities in a transaction that affects neither the taxable profit nor the accounting profit.
The carrying amount of deferred tax assets is reviewed at each balance sheet date and reduced to the extent that it is no longer probable that sufficient taxable profits will be available to allow all or part of the asset to be recovered.
Deferred tax is calculated at the tax rates that are expected to apply in the period when the liability is settled or the asset realised. Deferred tax is charged or credited to profit or loss, except when it relates to items charged or credited directly to equity, in which case the deferred tax is also dealt with in equity.
Prepaid corporation taxes and corporation tax liabilities are offset as they relate to income taxes levied by the same taxation authority. Deferred tax assets and liabilities are also offset for individual entities.
Retirement pay provision
Under Turkish law and union agreements, lump sum payments are made to employees retiring or involuntarily leaving the Group. The Group recognises liability by estimating the present value of the future probable obligation of the Company and its Subsidiaries and Joint Ventures registered in Turkey arising from the retirement of employees. Group management used some assumptions (detailed in Note 22) in the calculation of the total liability.
Foreign currency transactions
The individual financial statements of each group entity are presented in the currency of the primary economic environment in which the entity operates (its functional currency). For the purpose of the consolidated financial statements, the results and financial position of each entity are expressed in EUR, which is the functional currency of the Group, and the presentation currency for the consolidated financial statements.
In preparing the financial statements of the individual entities, transactions in currencies other than entity’s functional currency are recorded at the rates of exchange prevailing on the dates of the transactions. At each balance sheet date, monetary items denominated in foreign currencies are retranslated at the rates prevailing on the balance sheet date. Non-monetary items carried at fair value that are denominated in foreign currencies are retranslated at the rates prevailing on the date when the fair value was determined. Non-monetary items that are measured in terms of historical cost in a foreign currency are not retranslated.
Exchange differences arising on the settlement of monetary items, and on the retranslation of monetary items, are included in profit or loss for the period. Exchange differences arising on the retranslation of non-monetary items carried at fair value are included in profit or loss for the period.

3. SIGNIFICANT ACCOUNTING POLICIES (cont’d)
Leasing — the Group as Lessee
Leases are classified as finance leases whenever the terms of the lease transfer substantially all the risks and rewards of ownership to the lessee. All other leases are classified as operating leases.
Assets held under finance leases are recognised as assets of the Group at their fair value at the inception of the lease or, if lower, at the present value of the minimum lease payments. The corresponding liability to the lessor is included in the balance sheet as a finance lease obligation. Lease payments are apportioned between finance charges and reduction of the lease obligation so as to achieve a constant rate of interest on the remaining balance of the liability. Finance charges are charged to profit or loss, unless they are directly attributable to qualifying assets, in which case they are capitalised in accordance with the Group’s general policy on borrowing costs (see borrowing costs note).
Provisions
Provisions are recognised when the Group has a present obligation as a result of a past event, it is probable that the Group will be required to settle that obligation, and a reliable estimate can be made of the obligation. Provisions are measured at the directors’ best estimate of the expenditure required to settle the obligation at the balance sheet date, and are discounted to present value where the effect is material.
Earnings per share
Earnings per common share for 31 December 2005, 2004 and 2003 have been determined using the number of TAV’s shares as of 31 December 2005 respectively. Earnings per common share for 2004 and 2003 have been determined using the number of TAV’s shares as of 31 December 2005 as if those shares had been outstanding for all periods presented. There are no potentially dilutive securities.
Financial instruments
Financial assets and financial liabilities are recognised on the Group’s balance sheet when the Group becomes a party to the contractual provisions of the instrument.
Trade and other receivables
Trade and other receivables are measured at initial recognition at fair value, and are subsequently measured at amortised cost using the effective interest rate method. Appropriate allowances for estimated irrecoverable amounts are recognised in profit or loss when there is objective evidence that the asset is impaired. The allowance recognised is measured as the difference between the asset’s carrying amount and the present value of estimated future cash flows discounted at the effective interest rate computed at initial recognition. The Group’s Managers consider that the carrying amount of trade and other receivables approximates their fair value.
Due to/from related parties
The close family members of board of directors and key management personnel and any companies controlled or affiliated with them are considered as related parties.
The carrying value of the due to and from related parties is estimated to be their fair values.
Investments
Investments are recognised and derecognised on a trade date basis where the purchase or sale of an investment is under a contract whose terms require delivery of the investment within the timeframe established by the market concerned, and are initially measured at fair value, plus directly attributable transaction costs.
Held to maturity investments are measured at amortised cost using the effective interest rate method. Investments classified as held for trading and available-for-sale are measured at subsequent reporting dates at fair value. Where securities are held for trading purposes, gains and losses arising from changes in fair value are included in profit or loss for the period. For available-for-sale investments, gains and losses arising from changes in fair value are recognised directly in equity, until the security is disposed of or is determined to be impaired, at which time the cumulative gain or loss previously recognised in equity is included in the net profit or loss for the period.

3. SIGNIFICANT ACCOUNTING POLICIES (cont’d)
Cash and cash equivalents
Cash and cash equivalents comprise cash on hand and demand deposits, and other short-term highly liquid investments which their maturities are three months or less from date of acquisition and that are readily convertible to a known amount of cash and are subject to an insignificant risk of changes in value. The carrying amount of these assets approximates their fair value.
Restricted bank balances
Group’s uses of Project Accounts or Reserve Accounts or Funding Accounts are upon the lenders’ consent according to financial agreements. Therefore, bank balances included in these accounts are presented as restricted bank balances in the balance sheet and classified under operating activities in the cash flow statements.
Bank borrowings
Interest-bearing bank loans and overdrafts are initially measured at fair value, and are subsequently measured at amortised cost, using the effective interest rate method. Any difference between the proceeds (net of transaction costs) and the settlement or redemption of borrowings is recognised over the term of the borrowings in accordance with the Group’s accounting policy for borrowing costs.
Trade and other payables
Trade and other payables are initially measured at fair value, and are subsequently measured at amortised cost, using the effective interest rate method. The Group’s Managers consider that the carrying amount of trade and other payables approximates their fair value.
Derivative financial instruments and hedge accounting
The Group’s activities expose it primarily to the financial risks of changes in foreign exchange rates and interest rates. Two subsidiaries in the Group, TAV HTI and TAV Esenboğa, use derivative financial instruments (primarily interest rate derivative contracts) to manage its risks associated with interest rate fluctuations relating to certain firm commitments and forecasted transactions.
Derivative financial instruments are initially measured at fair value on the contract date, and are remeasured to fair value at subsequent reporting dates. The Group has not designated the derivative financial instruments as hedges and, accordingly, the changes in the fair value of non-hedging derivatives are charged to income in the related year.
Credit risk
The Group’s principal financial assets are bank balances and cash, trade and other receivables, and investments.
The credit risk on liquid funds is limited because the counterparties are banks with high credit-ratings.
The Group’s credit risk is minimum, as most of its sales are collected in cash or by credit cards.
Events After Balance Sheet Date
Events after the balance sheet date are those events, favourable and unfavourable, that occur between the balance sheet date and the date when the financial statements are authorised for issue. Two types of events can be identified:
— those that provide evidence of conditions that existed at the balance sheet date (adjusting events after the balance sheet date); and — those that are indicative of conditions that arose after the balance sheet date (non-adjusting events after the balance sheet date).
The Group records adjusting events after the balance sheet date and disclose non-adjusting events after the balance sheet date on the attached financial statements.
Change in Accounting Policies, Accounting Estimates and Errors
Adjustments due to the changes in accounting policies or accounting errors are applied retrospectively and the financial statements of the previous year are restated changes in accounting estimates are deemed to affect that period only, and thus adjustments applied in the current period. If however the estimated changes are for the following periods, changes are applied both on the current and following periods prospectively.

4. CRITICAL ACCOUNTING JUDGEMENTS AND KEY SOURCES OF ESTIMATION UNCERTAINTY
Critical judgements in applying the entity’s accounting policies
In the process of applying the entity’s accounting policies, which are described in note 3, management has made the following judgements that have most significant effect on the amounts recognised in the financial statements (apart from those involving estimations, which are dealt with below).
BTA, TAV İşletme, TAV HTI, TAV Esenboğa, and ATÜ were acquired from parents of the Company on 29 December 2005. The acquired subsidiaries and the joint venture, which all are in airport terminal related operations and could be treated as an integrated operation of TAV by nature or by transfer of knowledge, were under common control by TAV since the beginning of their operations and are accounted for by use of the pooling of interest method. This application is based on management judgement that this treatment is the best way to present the economic substance of the transaction because there is no independent third party involved and hence measurement of the fair value is very difficult and, therefore meets the criteria of IAS 8.10-12. IAS 8.10 states that “In the absence of a standard or an interpretation that specifically applies to a transaction, other event or condition, management shall use its judgement in developing and applying an accounting policy that results in information that is: (a) relevant to the economic decision-making need’s of users; and (b) reliable, in that financial statements. IAS 8.12 states that “in making the judgement described in paragraph 10, management may also consider the most recent pronouncement of other standard-setting bodies that use a similar conceptual framework to develop accounting standards, other accounting literature, and accepted industry practices, to the extent that these do not conflict with the sources in paragraph 11. Accordingly, the financial statements of these entities have been retrospectively restated to reflect the effect of structure change for the comparative years 2004 and 2003.
5. CASH AND CASH EQUIVALENTS
31 December 2005
31 December 2004
31 December 2003
Cash on hand ..................................... 245,133 295,843 201,138 Cash at banks — demand deposits .... 3,228,151 10,594,848 683,911 Cash equivalents................................ 7,312,855 6,713,349 47,625,672 Other liquid assets ............................. 141,942 105,090 86,241 10,928,081 17,709,130 48,596,962
31 December 2005
31 December 2004
31 December 2003
Cash equivalents Demand deposits ..........................
—
2,034,240
2,088,257
Time deposits ............................... 4,542,136 3,857,353 43,336,701 Reverse repurchase agreements.... 2,770,719 821,756 2,200,714 7,312,855 6,713,349 47,625,672
The details of the Group’s time deposits, maturities and interest rates as at 31 December 2005, 2004 and 2003 are as follows:
Original Currency
Maturity
Interest rate %
31 December 2005
TRY.................... 02.01.2006 13.00-14.00 2,538,243 EUR.................... 16.01.2006 3.50 2,003,893 4,542,136
Original Currency
Maturity
Interest rate %
31 December 2004
TRY.................... 13.01.2005 0 109,482 TRY.................... 03.01.2005 18.00 119,591 EUR.................... 06.01.2005 1.75 499,932 EUR.................... 17-20.01.2005 4.00 3,128,348 3,857,353
Original Currency
Maturity
Interest rate %
31 December 2003
EUR.................... 30.01.2004 2.50 500,148 EUR.................... 19-28.01.2004 3.75 1,510,221 TRY.................... 06.01.2004 29.50 99,009 EUR.................... 05.01.2004 2.13 823,000 USD.................... 31.03.2004 3.96 40,404,323 43,336,701
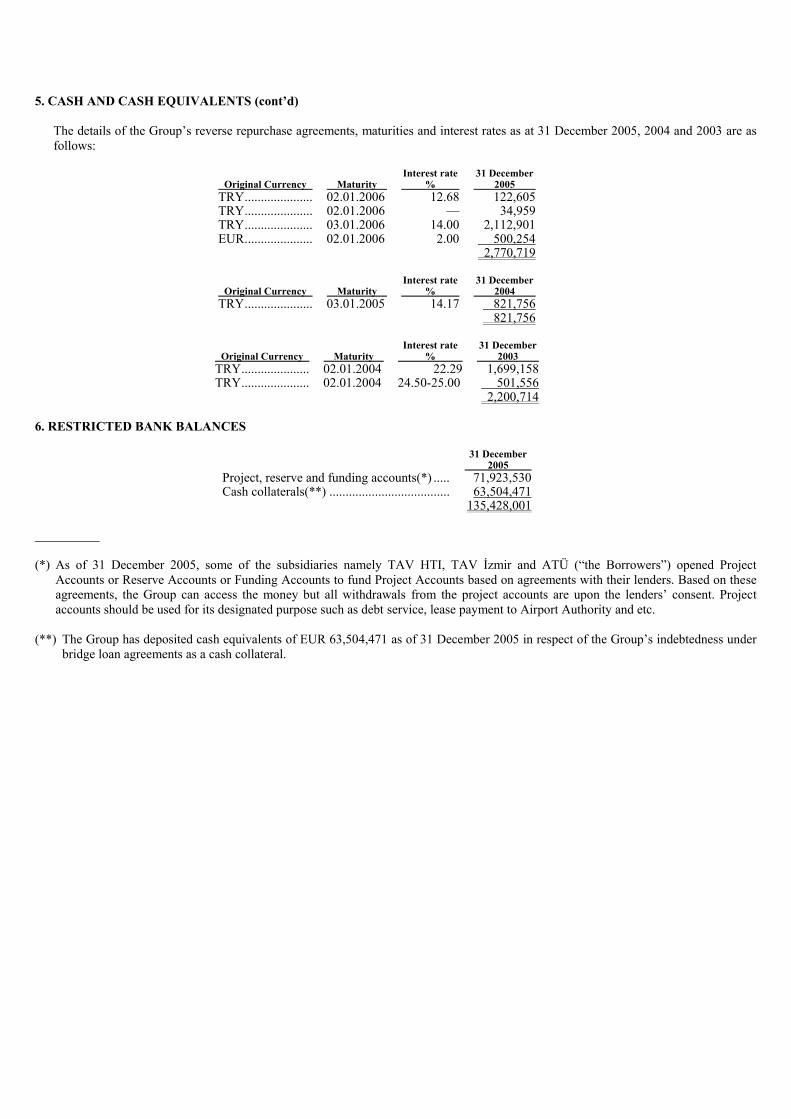
5. CASH AND CASH EQUIVALENTS (cont’d)
The details of the Group’s reverse repurchase agreements, maturities and interest rates as at 31 December 2005, 2004 and 2003 are as follows:
Original Currency
Maturity
Interest rate %
31 December 2005
TRY..................... 02.01.2006 12.68 122,605 TRY..................... 02.01.2006 — 34,959 TRY..................... 03.01.2006 14.00 2,112,901 EUR..................... 02.01.2006 2.00 500,254 2,770,719
Original Currency
Maturity
Interest rate %
31 December 2004
TRY..................... 03.01.2005 14.17 821,756 821,756
Original Currency
Maturity
Interest rate %
31 December 2003
TRY..................... 02.01.2004 22.29 1,699,158 TRY..................... 02.01.2004 24.50-25.00 501,556 2,200,714
6. RESTRICTED BANK BALANCES
31 December 2005
Project, reserve and funding accounts(*) ..... 71,923,530 Cash collaterals(**) ..................................... 63,504,471 135,428,001
__________ (*) As of 31 December 2005, some of the subsidiaries namely TAV HTI, TAV İzmir and ATÜ (“the Borrowers”) opened Project
Accounts or Reserve Accounts or Funding Accounts to fund Project Accounts based on agreements with their lenders. Based on these agreements, the Group can access the money but all withdrawals from the project accounts are upon the lenders’ consent. Project accounts should be used for its designated purpose such as debt service, lease payment to Airport Authority and etc.
(**) The Group has deposited cash equivalents of EUR 63,504,471 as of 31 December 2005 in respect of the Group’s indebtedness under
bridge loan agreements as a cash collateral.

7. INVESTMENTS a) Investments held for trading
31 December 2005
31 December 2004
31 December 2003
Debt securities: Investment funds — short term..... 610,178 732,137 406,754 610,178 732,137 406,754
b) Available-for-sale investments
Shareholding %
31 December 2005
Available for sale equity securities: Unlisted entities TAV Havacilik A.Ş..................................
3.00
28,086
28,086 c) Held to maturity investments
Original Currency
Maturity
Interest rate %
31 December 2004
USD .................... 23.05.2005 1.00 474,032 USD .................... 15.04.2005 4.67 19,964,728 EUR .................... 17.06.2005 4.88 18,990,812 39,429,572
Original Currency
Maturity
Interest rate %
31 December 2003
USD .................... 23.05.2004 1.00 507,919 507,919
8. TRADE RECEIVABLES (NET)
31 December 2005
31 December 2004
31 December 2003
Trade receivables ......................................... 11,728,247 4,390,821 6,609,463 Notes receivable........................................... 13,272 9,385 — Discount on receivables (—) ....................... (20,709) (30,370) (45,254) Doubtful receivables .................................... 1,266,152 662,174 525,091 Allowance for doubtful receivables (—) ..... (1,266,152) (662,174) (525,091) Other ............................................................ 20,393 35,106 105,919 11,741,203 4,404,942 6,670,128
Allowance for doubtful receivables has been determined by reference to past default experience.
As of 31 December 2005, the Borrowers irrevocably and unconditionally assign and transfer, as security for the fulfillment of all the obligations at any time due, in respect of the finance documents to the lenders all of their receivables and rights, title, interest and benefit in, to and under their receivables, as well as the claims arising from such receivables under the following “assigned receivables” such as income from the lease, area lease, duty free, food and beverage, contractors, O&M providers, insurers including VAT refunds, and etc.
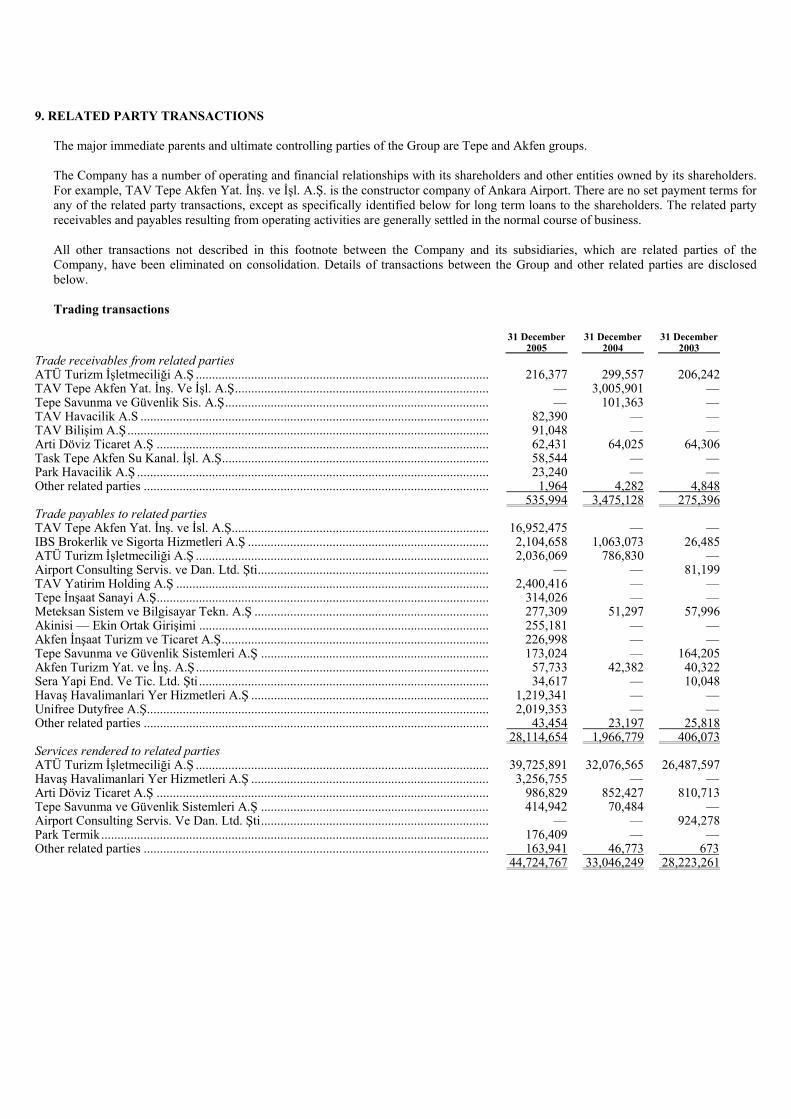
9. RELATED PARTY TRANSACTIONS
The major immediate parents and ultimate controlling parties of the Group are Tepe and Akfen groups.
The Company has a number of operating and financial relationships with its shareholders and other entities owned by its shareholders. For example, TAV Tepe Akfen Yat. İnş. ve İşl. A.Ş. is the constructor company of Ankara Airport. There are no set payment terms for any of the related party transactions, except as specifically identified below for long term loans to the shareholders. The related party receivables and payables resulting from operating activities are generally settled in the normal course of business.
All other transactions not described in this footnote between the Company and its subsidiaries, which are related parties of the Company, have been eliminated on consolidation. Details of transactions between the Group and other related parties are disclosed below.
Trading transactions
31 December 2005
31 December 2004
31 December 2003
Trade receivables from related parties ATÜ Turizm İşletmeciliği A.Ş ..........................................................................................
216,377
299,557
206,242
TAV Tepe Akfen Yat. İnş. Ve İşl. A.Ş.............................................................................. — 3,005,901 — Tepe Savunma ve Güvenlik Sis. A.Ş................................................................................. — 101,363 — TAV Havacilik A.S ........................................................................................................... 82,390 — — TAV Bilişim A.Ş............................................................................................................... 91,048 — — Arti Döviz Ticaret A.Ş ...................................................................................................... 62,431 64,025 64,306 Task Tepe Akfen Su Kanal. İşl. A.Ş.................................................................................. 58,544 — — Park Havacilik A.Ş ............................................................................................................ 23,240 — — Other related parties .......................................................................................................... 1,964 4,282 4,848 535,994 3,475,128 275,396 Trade payables to related parties TAV Tepe Akfen Yat. İnş. ve İsl. A.Ş...............................................................................
16,952,475
—
—
IBS Brokerlik ve Sigorta Hizmetleri A.Ş .......................................................................... 2,104,658 1,063,073 26,485 ATÜ Turizm İşletmeciliği A.Ş .......................................................................................... 2,036,069 786,830 — Airport Consulting Servis. ve Dan. Ltd. Şti....................................................................... — — 81,199 TAV Yatirim Holding A.Ş ................................................................................................ 2,400,416 — — Tepe İnşaat Sanayi A.Ş...................................................................................................... 314,026 — — Meteksan Sistem ve Bilgisayar Tekn. A.Ş ........................................................................ 277,309 51,297 57,996 Akinisi — Ekin Ortak Girişimi ......................................................................................... 255,181 — — Akfen İnşaat Turizm ve Ticaret A.Ş.................................................................................. 226,998 — — Tepe Savunma ve Güvenlik Sistemleri A.Ş ...................................................................... 173,024 — 164,205 Akfen Turizm Yat. ve İnş. A.Ş.......................................................................................... 57,733 42,382 40,322 Sera Yapi End. Ve Tic. Ltd. Şti ......................................................................................... 34,617 — 10,048 Havaş Havalimanlari Yer Hizmetleri A.Ş ......................................................................... 1,219,341 — — Unifree Dutyfree A.Ş......................................................................................................... 2,019,353 — — Other related parties .......................................................................................................... 43,454 23,197 25,818 28,114,654 1,966,779 406,073 Services rendered to related parties ATÜ Turizm İşletmeciliği A.Ş ..........................................................................................
39,725,891
32,076,565
26,487,597
Havaş Havalimanlari Yer Hizmetleri A.Ş ......................................................................... 3,256,755 — — Arti Döviz Ticaret A.Ş ...................................................................................................... 986,829 852,427 810,713 Tepe Savunma ve Güvenlik Sistemleri A.Ş ...................................................................... 414,942 70,484 — Airport Consulting Servis. Ve Dan. Ltd. Şti...................................................................... — — 924,278 Park Termik....................................................................................................................... 176,409 — — Other related parties .......................................................................................................... 163,941 46,773 673 44,724,767 33,046,249 28,223,261

9. RELATED PARTY TRANSACTIONS (cont’d)
Nature of major transactions with related parties:
The Company generates commission income, rent income and utility participating fee from ATÜ and these amounts are included in revenues. Majority of service rendered to Havaş represents the bus and parking income of TAV İşletme.
Year ended 31 December 2005
Year ended 31 December 2004
Year ended 31 December 2003
Services rendered by related parties Tepe Savunma ve Güvenlik Sistemleri A.Ş......................................................................
4,602,008
3,967,838
2,380,514
Tepe İnşaat Sanayi A.Ş..................................................................................................... 244,357 4,916,436 — Havaş Havalimanlari Yer Hizmetleri A.Ş ........................................................................ 1,326,626 — — Park Enerji Holding A.Ş................................................................................................... 1,225,617 — — TAV Tepe Akfen Yat. İnş. Ve İşl A.Ş.............................................................................. 3,539,938 — — TAV Yatirim Holding A.Ş ............................................................................................... 2,805,762 — — Meteksan Sistem ve Bilgisayar Tekn. A.Ş ....................................................................... 565,559 445,794 376,110 Akfen İnşaat Turizm ve Ticaret A.Ş................................................................................. 442,358 — — Airport Consulting Servis. Ve Dan. Ltd. Şti..................................................................... — 302,279 902,349 Sera Yapi End. Ve Tic. Ltd. Şti ........................................................................................ — 100,950 — Unifree Dutyfree A.Ş........................................................................................................ 40,718,304 35,747,094 34,463,712 Other related parties ......................................................................................................... 41,224 39,601 — 55,511,753 45,519,992 38,122,685
Nature of major transactions with related parties:
The Company receives maintenance services from Meteksan Sistem. Expenses incurred from Park Enerji Holding A.Ş. are related with consultancy expenses. Havaş renders bus services and parking lot services to TAV İşletme.
TAV Yatirim Holding A.Ş. (“TAV Holding”) provided support, consultancy and such facilities to the Company in connection with information technology, finance, human resource, administration, accounting, general management and operations by way of human resources and/or consultants and allowed the Company to utilise any kind of resources of TAV Holding including know-how the matters mentioned during the period. The Company pays USD 2,000,000 plus VAT per month for such consulting and support services to TAV Holding.
The expenses charged by Tepe Savunma ve Güvenlik A.Ş. are related to the security management services.
ATÜ purchases the duty free goods sold from Unifree Dutyfree A.Ş. ATÜ operates duty free shops at the airport.
Year ended 31 December 2005
Year ended 31 December 2004
Year ended 31 December 2003
Construction work rendered by related parties TAV Tepe Akfen Yat. İnş. Ve İşl. A.Ş..............................................................................
93,536,213
4,264,460
—
93,536,213 4,264,460 —
Nature of major transactions with related parties:
TAV Tepe Akfen Yat. İnş. ve İşl. A.Ş. provided services related to refurbishment of Domestic and International Lines and construction of Esenboğa Airport.

9. RELATED PARTY TRANSACTIONS (cont’d) Financing transactions
31 December 2005
31 December 2003
31 December 2004
Loans receivable from related parties TAV Tepe Akfen Yat. İnş. ve İşl. A.Ş..............................................................................
45,711,388
31,121,308
1,618,515
Tepe İnşaat Sanayi A.Ş..................................................................................................... 88,100,764 51,200,106 40,133,388 Akfen İnşaat Turizm ve Ticaret A.Ş................................................................................. 60,108,539 42,082,149 26,579,470 Bilintur Bilkent Tur. İnş. Yat. Tic. Ltd. Şti ...................................................................................................................................
—
469,653
—
Sera Yapi End. ve Tic. Ltd. Şti......................................................................................... 5,197,833 5,608,469 54,979 TAV Havacili A.Ş ............................................................................................................ 2,238,257 — — Akfen Holding A.Ş........................................................................................................... 1,538,809 — — Other related parties ......................................................................................................... 89,536 — — 202,985,126 130,481,685 68,386,352
The Group management structured the collection schedule for the loans of USD 181,497,862 (EUR 153,407,138) to Tepe İnşaat Sanayi A.Ş., Akfen İnşaat Turizm ve Ticaret A.Ş., and Sera Yapi End. ve Tic. Ltd. Şti. (shareholders of the Company) on 27 March 2006.
Loans receivable from related parties are presented under long term assets in the accompanying financial statements based on the history of collections. Subsequent to 31 December 2005, the Group management structured loans to shareholders for the first time on 27 March 2006.
31 December 2005
31 December 2004
31 December 2003
Loans payable to related parties TAV Yatirim Holding A.Ş ....................................................................
15,185,586
—
—
Bilintur Bilkent Tur. İnş. Yat. Tic. Ltd. Şti ........................................................................................................
994,776
—
—
Tepe Emlak Yatirim İnşaat ve Tic. A.Ş................................................. 823,383 — — Other related parties .............................................................................. 796,742 — — 17,800,487 — —
Loans payable to related parties are classified as current liabilities being their maturities are not known and there is no previous history of payment as they were obtained in 2005 for the first time.
The interest rate used within the Group is 5.5% per annum. The Group converts related party TRY loan receivable and payable balances to USD and charges interest at a rate of 5.5% per annum. The USD conversion was performed using the Central Bank’s announced exchange rates.
Year ended 31 December 2005
Year ended 31 December 2004
Year ended 31 December 2003
Interest income from related parties Tepe İnşaat Sanayi A.Ş......................................................................................................
3,704,538
1,678,153
2,500,061
Akfen İnşaat Turizm ve Ticaret A.Ş.................................................................................. 3,085,419 1,316,680 1,511,023 TAV Yatirim Holding A.Ş ................................................................................................ 2,808,871 — — TAV Tepe Akfen Yat. İnş. Ve İşl. A.Ş.............................................................................. 1,922,439 527,743 — Sera Yapi End. ve Tic. Ltd. Şti.......................................................................................... 358,259 88,704 — Other related parties .......................................................................................................... 49,996 — — 11,929,522 3,611,280 4,011,084 Interest expense to related parties Unifree Duty Free İşletmeciliği A.Ş..................................................................................
33,813
—
—
TAV Yatirim Holding A.Ş ................................................................................................ 11,214 — — Akfen İnşaat Turizm ve Ticaret A.Ş.................................................................................. — 1,838 — Other related parties .......................................................................................................... 8,141 — — 53,168 1,838 —

9. RELATED PARTY TRANSACTIONS (cont’d)
Other transactions
Year ended 31 December 2005
Year ended 31 December 2004
Year ended 31 December 2003
Other gains from related parties TAV Tepe Akfen Yat. İnş. Ve İşl................................................................
1,540,061
—
—
TAV Yatirim Holding A.Ş .......................................................................... 1,150,163 — — Havaş Havalimanlari Yer Hizmetleri A.Ş ................................................... 193,612 — — Tepe İnşaat Sanayi A.Ş ............................................................................... — 545,191 602,397 Akfen İnşaat Turizm ve Ticaret A.Ş............................................................ — — 207,213 Tepe Savunma ve Güvenlik Sistemleri A.Ş ................................................ — 807,269 134,785 ATÜ Turizm İşletmeciliği A.Ş .................................................................... — 14,916 9,291 Other related parties .................................................................................... 63,690 — 48,362 2,947,526 1,367,376 1,002,048
Nature of other major transactions with related parties:
Other gain from TAV Yatirim Holding was generated from sales of leaseholds. Gains from TAV Tepe Akfen İnş. A.Ş., Akfen İnşaat Turizm A.Ş., Tepe Savunma were related with income from services related to business projects.
Year ended 31 December 2005
Year ended 31 December 2004
Year ended 31 December 2003
Other expenses with related parties Donations to Bilkent University ..........
1,512,112
1,489,697
1,305,256
1,512,112 1,489,697 1,305,256
Compensation of key management personnel:
The remuneration of directors and other members of key management during the year was as follows:
Year ended 31 December 2005
Year ended 31 December 2004
Year ended 31 December 2003
Short-term benefits (salaries and bonuses) ..... 1,143,140 1,260,543 751,498 1,143,140 1,260,543 751,498
Some of the key management of the Group are included in TAV Yatirim Holding A.Ş.’s payroll, therefore they are not included in the above table as such expenses separately invoiced by TAV Yatirim Holding A.Ş.
10. INVENTORIES
31 December 2005
31 December 2004
31 December 2003
Duty free inventories ............................................. 4,898,553 4,017,323 4,082,268 Catering inventories............................................... 464,565 261,159 209,105 Goods in transit...................................................... 127,527 — — Other inventories ................................................... 101,562 41,763 26,128 Less: Provision for slow moving and obsolete inventories ...........................................................
(252,945)
(209,634)
(156,217)
5,339,262 4,110,611 4,161,284
Provision for slow moving and obsolete inventories:
Year ended 31 December 2005
Year ended 31 December 2004
Year ended 31 December 2003
At 1 January..................................... 209,634 156,217 145,303 Additional provision for the year..... 43,311 53,417 10,914 At the end of the period ................... 252,945 209,634 156,217 BOT Inventory Spare parts .......................................
2,347,468
1,008,509
2,242,812
Order advances given....................... 7,455,204 229,463 1,560,977 9,802,672 1,237,972 3,803,789

11. OTHER RECEIVABLES, CURRENT AND NON-CURRENT ASSETS
31 December 2005
31 December 2004
31 December 2003
Other receivables and current assets: VAT portion of prepaid rent to DHMİ (short term) ...................... 21,205,685 — — Prepaid rent ................................................................................... 1,265,459 — — Prepaid insurance .......................................................................... 3,217,110 1,647,877 492,851 Income accruals............................................................................. 365,429 161,547 111,068 VAT deductible and carried forward............................................. 1,813,838 2,161,775 1,739,726 Prepaid taxes and dues .................................................................. 1,115,846 64,240 41,992 Advances given to personnel......................................................... 73,949 6,260 13,664 Business advances given ............................................................... 42,532 15,332 95,541 Other receivables........................................................................... 536,236 69,526 219,255 29,636,084 4,126,557 2,714,097 Other non current assets: VAT portion of prepaid rent to DHMİ (long term) ....................... 55,337,143 — — Non current prepaid insurance ...................................................... 778,760 — — Other non current receivable ......................................................... — 9,772 — 56,115,903 9,772 —
12. GOODWILL
Cost At 1 January 2005 ...................................
—
Arising on acquisition of a subsidiary..... 72,717,730 At 31 December 2005 ............................. 72,717,730 Carrying amount At 31 December 2005 ............................. 72,717,730
The Group tests goodwill annually for impairment, or more frequently if there are indications that goodwill might be impaired.
See Note 32 for the details related to acquisition of subsidiary (HAVAŞ).

13. PROPERTY, PLANT AND EQUIPMENT
Buildings
Machinery and equipment
Vehicles
Furniture and fixtures
Leaseholds Improvements
Construction in progress
Advances given and other PP&E
Total
Cost Opening balance, 1 January 2003 ..........
94,575
2,593,224
165,601
4,859,171
—
—
—
7,712,571
Foreign currency translation effect .....................................................
—
11,315
(6,703)
98,073
—
—
—
102,685
Additions................................................ — — 11,370 52,932 — 6,399 — 70,701 Disposals................................................ (94,575) (1,819,964) (10,300) (3,745,090) — — — (5,669,929) Closing balance, 31 December 2003 ......................................................
—
784,575
159,968
1,265,086
—
6,399
—
2,216,028
Foreign currency translation effect .....................................................
—
9,807
6,821
87,558
—
560
—
104,746
Additions................................................ 585,724 — — 804,840 — 12,410 — 1,402,974 Closing balance, 31 December 2004 ......................................................
585,724
794,382
166,789
2,157,484
—
19,369
—
3,723,748
Foreign currency translation effect .....................................................
—
24,755
17,221
319,125
—
3,932
—
365,033
Additions................................................ — 474,605 1,927,905 1,951,675 791,814 177,625 62,433 5,386,057 Acquired on acquisition of a subsidiary ..............................................
44,602
27,519,255
4,459,588
3,403,555
5,738,610
—
—
41,165,610
Disposals................................................ — (10,554) (137,055) (268,477) (570,024) — — (986,110) Transfers from CIP................................. — — — — 62,705 (26,650) — 36,055 Closing balance, 31 December 2005 ......................................................
630,326
28,802,443
6,434,448
7,563,362
6,023,105
174,276
62,433
49,690,393
Accumulated depreciation Opening balance, 1 January 2003 ..........
79,302
2,109,032
63,982
3,940,187
—
—
—
6,192,503
Depreciation charge for the year ............ — 288,645 31,218 406,682 — — — 726,545 Foreign currency translation effect .....................................................
—
6,312
(7,535)
80,136
—
—
—
78,913
Eliminated on disposals ......................... (79,302) (1,781,060) (6,180) (3,361,973) — — — (5,228,515) Closing balance, 31 December 2003 ......................................................
—
622,929
81,485
1,065,032
—
—
—
1,769,446
Foreign currency translation effect .....................................................
—
7,432
2,896
79,528
—
—
—
89,856
Depreciation charge for the year ............ 976 158,239 32,207 193,664 — — — 385,086 Closing balance, 31 December 2004 ......................................................
976
788,600
116,588
1,338,224
—
—
—
2,244,388
Foreign currency translation effect .....................................................
—
23,581
10,694
225,269
—
—
—
259,544
Depreciation charge for the year ............ 12,167 1,181,859 319,494 426,868 270,035 — — 2,210,423 Acquired on acquisition of a subsidiary ..............................................
11,709
18,970,158
2,284,687
2,910,447
2,758,806
—
—
26,935,807
Eliminated on disposals ......................... — (2,366) (70,270) (24,175) (90,182) — — (186,993) Closing balance, 31 December 2005 ......................................................
24,852
20,961,832
2,661,193
4,876,633
2,938,659
—
—
31,463,169
Carrying amount at 31 December 2003 ......................................................
—
161,646
78,483
200,054
—
6,399
—
446,582
Carrying amount at 31 December 2004 ......................................................
584,748
5,782
50,201
819,260
—
19,369
—
1,479,360
Carrying amount at 31 December 2005 ......................................................
605,474
7,840,611
3,773,255
2,686,729
3,084,446
174,276
62,433
18,227,224
The depreciation periods for property, plant and equipment are as follows:

13. PROPERTY, PLANT AND EQUIPMENT (cont’d)
Useful life Buildings ............................. 50 years Machinery and equipment ... 5 years Vehicles............................... 5 years Furniture and fixtures .......... 5 years Leasehold improvements..... 5-6 years
The carrying amount of the Group’s fixtures and equipment includes an amount of EUR 316,673 (2004: EUR 216,707, 2003: 0) in respect of assets held under finance leases.

14. BUILT-OPERATE-TRANSFER (BOT) INVESTMENTS (NET)
31 December 2005
31 December 2004
31 December 2003
Net book value of Short term BOT investments ....
—
48,033,387
—
Long term BOT investments .... 134,3 7,428,598 129,8Total ......................................... 134,3 55,461,985 129,8
Atatürk International Airport
Ankara Esenboğa International Airport
İzmir Adnan Menderes Airport
Tbilisi International Airport
Batumi International Airport
BOT Investment
Advances given (for BOT)
Construction in progress (for BOT)
Construction in progress (for BOT)
Advances given (for BOT)
Construction in progress (for BOT)
Construction in progress (for BOT)
Total
Cost Opening balance, 1 January 2003 ...............................
333,611,835
—
—
—
—
—
—
333,611,835
Foreign currency translation effect ...........................................................................
572,999
—
—
—
—
—
—
572,999
Additions ..................................................................... 42,554,231 85,990 — — — — — 42,640,221 Disposals ..................................................................... (36,740) — — — — — — (36,740) Transfers from CIP and advances ............................... 65,970 (65,970) — — — — — — Closing balance, 31 December 2003 .......................... 376,768,295 20,020 — — — — — 376,788,315 Foreign currency translation effect ...........................................................................
498,480
—
—
—
—
—
—
498,480
Additions ..................................................................... 11,332,894 553,860 7,428,598 — — — — 19,315,352 Disposals ..................................................................... (112,500) — — — — — — (112,500) Transfers from CIP and advances ............................... 559,842 (559,842) — — — — — — Closing balance, 31 December 2004 .......................... 389,047,011 14,038 7,428,598 — — — — 396,489,647 Foreign currency translation effect ...........................................................................
1,624,029
—
—
—
—
—
—
1,624,029
Additions ..................................................................... 23,500 64,147 105,071,771 12,407,579 9,425,772 — — 126,992,769 Transfers from CIP and advances ............................... 15,480 (78,185) — — — — — (62,705) Transfer to DHMİ-İstanbul airport .........................................................................
(390,710,020)
—
—
—
—
—
—
(390,710,020)
Closing balance, 31 December 2005 .......................... — — 112,500,369 12,407,579 9,425,772 — — 134,333,720 Accumulated depreciation Opening balance, 1 January 2003 ...............................
174,811,142
—
—
—
—
—
—
174,811,142
Depreciation charge for the year................................. 71,788,118 — — — — — — 71,788,118 Foreign currency translation effect ...........................................................................
294,429
—
—
—
—
—
—
294,429
Eliminated on disposals............................................... (3,062) — — — — — — (3,062) Closing balance, 31 December 2003 .......................... 246,890,627 — — — — — — 246,890,627 Foreign currency translation effect ...........................................................................
352,524
—
—
—
—
—
—
352,524
Depreciation charge for the year................................. 93,867,220 — — — — — — 93,867,220 Eliminated on disposals............................................... (82,709) — — — — — — (82,709) Closing balance, 31 December 2004 .......................... 341,027,662 — — — — — — 341,027,662 Foreign currency translation effect ...........................................................................
1,357,366
—
—
—
—
—
—
1,357,366
Depreciation charge for the year................................. 48,324,992 — — — — — — 48,324,992 Transfer to DHMİ-İstanbul airport .........................................................................
(390,710,020)
—
—
—
—
—
—
(390,710,020)
Closing balance, 31 December 2005 .......................... — — — — — — — — Carrying amount at 31 December 2003 ............................................................................
129,877,668
20,020
—
—
—
—
—
129,897,688
Carrying amount at 31 December 2004 ............................................................................
48,019,349
14,038
7,428,598
—
—
—
—
55,461,985
Carrying amount at 31 December 2005 ............................................................................
—
—
112,500,369
12,407,579
9,425,772
—
—
134,333,720
BOT Investments are depreciated during the BOT contract period commencing from the date of operation of the terminals
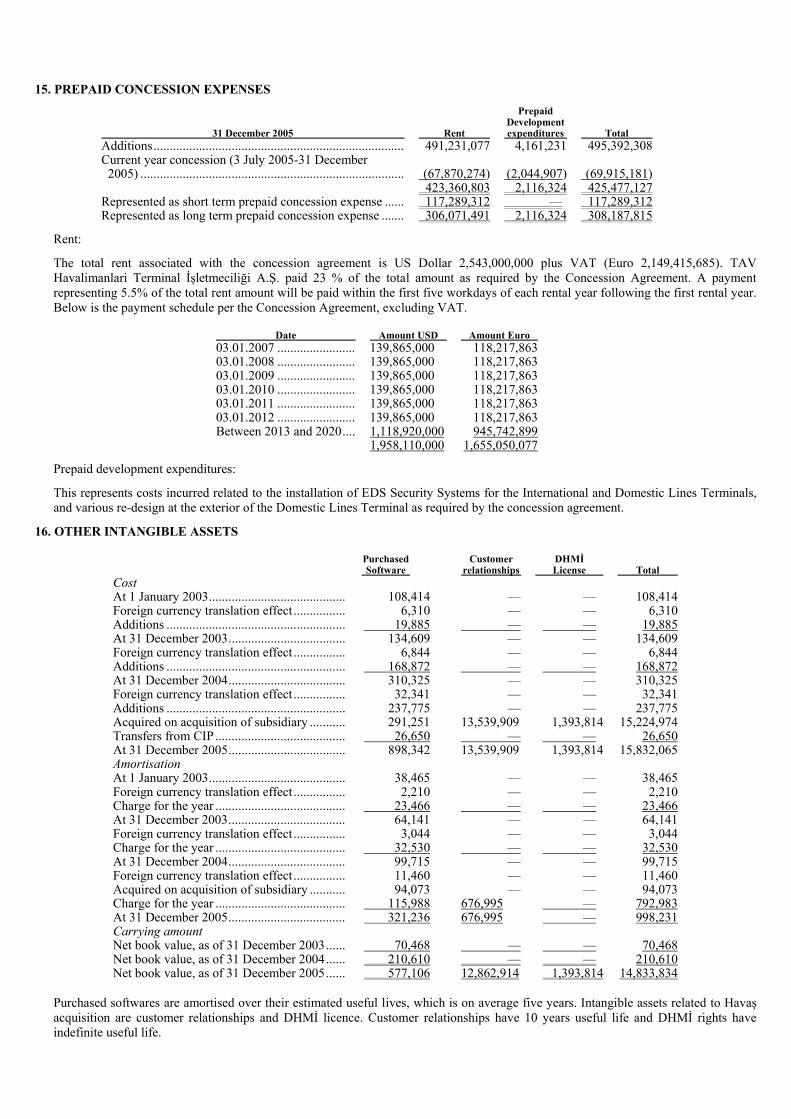
15. PREPAID CONCESSION EXPENSES
31 December 2005
Rent
Prepaid Development expenditures
Total
Additions............................................................................. 491,231,077 4,161,231 495,392,308 Current year concession (3 July 2005-31 December 2005) .................................................................................
(67,870,274)
(2,044,907)
(69,915,181)
423,360,803 2,116,324 425,477,127 Represented as short term prepaid concession expense ...... 117,289,312 — 117,289,312 Represented as long term prepaid concession expense ....... 306,071,491 2,116,324 308,187,815
Rent:
The total rent associated with the concession agreement is US Dollar 2,543,000,000 plus VAT (Euro 2,149,415,685). TAV Havalimanlari Terminal İşletmeciliği A.Ş. paid 23 % of the total amount as required by the Concession Agreement. A payment representing 5.5% of the total rent amount will be paid within the first five workdays of each rental year following the first rental year. Below is the payment schedule per the Concession Agreement, excluding VAT.
Date Amount USD Amount Euro 03.01.2007 ........................ 139,865,000 118,217,863 03.01.2008 ........................ 139,865,000 118,217,863 03.01.2009 ........................ 139,865,000 118,217,863 03.01.2010 ........................ 139,865,000 118,217,863 03.01.2011 ........................ 139,865,000 118,217,863 03.01.2012 ........................ 139,865,000 118,217,863 Between 2013 and 2020.... 1,118,920,000 945,742,899 1,958,110,000 1,655,050,077
Prepaid development expenditures:
This represents costs incurred related to the installation of EDS Security Systems for the International and Domestic Lines Terminals, and various re-design at the exterior of the Domestic Lines Terminal as required by the concession agreement.
16. OTHER INTANGIBLE ASSETS
Purchased Software
Customer relationships
DHMİ License
Total
Cost At 1 January 2003..........................................
108,414
—
—
108,414
Foreign currency translation effect ................ 6,310 — — 6,310 Additions ....................................................... 19,885 — — 19,885 At 31 December 2003.................................... 134,609 — — 134,609 Foreign currency translation effect ................ 6,844 — — 6,844 Additions ....................................................... 168,872 — — 168,872 At 31 December 2004.................................... 310,325 — — 310,325 Foreign currency translation effect ................ 32,341 — — 32,341 Additions ....................................................... 237,775 — — 237,775 Acquired on acquisition of subsidiary ........... 291,251 13,539,909 1,393,814 15,224,974 Transfers from CIP ........................................ 26,650 — — 26,650 At 31 December 2005.................................... 898,342 13,539,909 1,393,814 15,832,065 Amortisation At 1 January 2003..........................................
38,465
—
—
38,465
Foreign currency translation effect ................ 2,210 — — 2,210 Charge for the year ........................................ 23,466 — — 23,466 At 31 December 2003.................................... 64,141 — — 64,141 Foreign currency translation effect ................ 3,044 — — 3,044 Charge for the year ........................................ 32,530 — — 32,530 At 31 December 2004.................................... 99,715 — — 99,715 Foreign currency translation effect ................ 11,460 — — 11,460 Acquired on acquisition of subsidiary ........... 94,073 — — 94,073 Charge for the year ........................................ 115,988 676,995 — 792,983 At 31 December 2005.................................... 321,236 676,995 — 998,231 Carrying amount Net book value, as of 31 December 2003......
70,468
—
—
70,468
Net book value, as of 31 December 2004...... 210,610 — — 210,610 Net book value, as of 31 December 2005...... 577,106 12,862,914 1,393,814 14,833,834
Purchased softwares are amortised over their estimated useful lives, which is on average five years. Intangible assets related to Havaş acquisition are customer relationships and DHMİ licence. Customer relationships have 10 years useful life and DHMİ rights have indefinite useful life.

17. JOINT VENTURES
The Group has the following significant interests in joint ventures:
A 49.98 percent equity shareholding with an equivalent voting power, in ATÜ Turizm İşletmeciliği A.Ş., a joint venture established in Turkey. The following amounts are included in the Group’s financial statements as a result of the proportionate consolidation of ATÜ Turizm İşletmeciliği A.Ş.:
31 December 2005
31 December 2004
31 December 2003
Current assets ................ 11,745,182 8,309,987 9,120,306 Non-current assets......... 19,065,433 837,520 951,241 Current liabilities .......... 4,780,851 2,516,851 2,962,870 Non-current liabilities ... 19,419,908 317,540 207,337 Income .......................... 92,475,712 81,744,636 70,189,836 Expenses ....................... 87,526,099 74,935,852 66,062,087
A 60.00 per cent equity shareholding with an equivalent voting power, in Havaş Havalimanlari Yer Hizmetleri A.Ş., a joint venture acquired in 2005. The following amounts are included in the Group’s financial statements as a result of the proportionate consolidation of Havaş Havalimanlari Yer Hizmetleri A.Ş.:
31 December 2005
Current assets................ 7,232,281 Non-current assets ........ 21,007,703 Current liabilities .......... 6,034,252 Non-current liabilities... 2,091,606 Income .......................... 50,952,107 Expenses ....................... 51,033,455
18. BANK LOANS
The details of the Group’s bank loans as at 31 December 2005 are as follows:
Presented as Projects
Current liabilities
Non-current liabilities
TAV HTI ......................... 92,433,616 564,075,027 TAV İzmir ....................... 32,862,303 — TAV Esenboğa ................ — 79,483,793 ATÜ................................. 1,086,219 18,940,263 TAV................................. 84,546,627 10,000,000 Other ................................ 562,127 638,457 211,490,892 673,137,540

18. BANK LOANS (cont'd)
TAV HTI
Presented as Original Currency
Maturity
Interest rate %
Current Liabilities
Non-current liabilities
EUR ....... 31.12.2015 Euribor+2.50 18,534,474 386,383,838 EUR ....... 31.12.2015 Euribor+5.00 1,587,766 32,198,653 USD ....... 31.12.2015 Libor+2.50 7,112,095 145,492,536 USD ....... 07.07.2006 Libor+2.00 65,199,281 — 92,433,616 564,075,027
TAV HTI has bank loans in the amount of EUR 470,108,270 (“Tranch A”) and USD originated EUR 152,611,982 (“Tranch B”) under a senior facility agreement and EUR 33,788,391 under a mezzanine facility agreement. These loans require semi annual principal and interest payments at each 30 June and at each 31 December according to bank agreements. TAV HTI has canceled the use of Tranch C bank loan amounting to USD 15 million. There are not any outstanding amounts TAV HTI can borrow from the bank related to the borrowing agreements. However, with the consent of the facility agent, TAV HTI has a right to have an additional;
• subordinated debt approved in advance by the Facility Agent
• indebtedness upto USD 1 million for the acquisition cost of any assets or leases of assets
• indebtedness upto USD 3 million for the payment of tax and social security liabilities
These loans are subject to certain restrictive covenants including the requirement to maintain certain financial ratios, and certain restrictions on the transactions entered into by TAV HTI or its shareholders.
Among the above event of defaults, financial covenants are summarised as follows and the companies shall ensure the following financial covenants semiannually;
a) the Debt Service Cover Ratios are each greater than or equal to
— TAV HTI : 1.10:1
b) the Loan Life Cover Ratio and the Average Projected Debt Service Cover Ratio are greater than or equal to — TAV HTI : 1.15:1
c) the Debt to Equity Ratio is no greater than. — TAV HTI : 85:15
Other covenants restrict TAV HTI to enter certain transactions.
In addition, unless an Initial Public Offering has occurred, on each date upon which a distribution could take place pursuant to the terms of the borrowing agreements (whether or not in fact TAV HTI makes such distribution) the TAV HTI must pay 25% for the repayment of principals of loans.
Upon the occurrence of an Initial Public Offering, the proceeds of such Initial Public Offering in an amount equal to 50% of the Euro equivalent of USD 40,000,000 are applied in prepayment of the Mezzanine Facility.
If TAV HTI, sells, transfers or otherwise disposes of any assets having a value individually in excess of USD 500,000 or in the aggregate in any Fiscal Year of the Company in excess USD 1,000,000 and does not apply those proceeds in the purchase of an asset serving a similar purpose, such proceeds of disposal shall be applied by the Company in repayment of the Loans on the next prepayment date.
The borrowing repayable according to the original term of the contract as of 31 December 2005 is as follows;
31 December 2005
On demand or within one year ..... 92,433,616 In the second year ........................ 25,835,497 In the third year............................ 33,208,642 In the fourth year.......................... 45,064,658 In the fifth year............................. 54,207,357 After five years ............................ 405,758,873 656,5

18. BANK LOANS (cont’d) TAV İzmir
Presented as Original Currency
Maturity
Interest rate %
Current liabilities
Non-current liabilities
EUR .................... 14.08.2006 Euribor + 3 10,207,944 EUR .................... 14.12.2006 Euribor + 3 12,608,074 — EUR .................... 04.10.2006 Euribor + 2 10,046,285 — 32,862,303 —
TAV İzmir has bank loans in the amount of EUR 32,862,303 from different banks. There are not any outstanding amounts TAV İzmir can borrow from the bank related to the borrowing agreements. The bank repayments are payable within one year.
TAV Esenboğa
Presented as Original Currency
Maturity
Interest rate %
Current liabilities
Non-current liabilities
EUR .................... 31.12.2016 Euribor+3.5 — 75,041,186 EUR .................... 30.06.2016 Euribor+0.85 — 4,442,607 — 79,483,793
The loans are subject to certain covenants similar to those for TAV HTI. These loans require semi annual principal and interest payments according to bank agreements. TAV Esenboğa have the option to use EUR 98.5 million available loan related to the borrowing agreement. These loans require semi annual principal and interest payments at each 30 June and at each 31 December according to bank agreements.
These loans are subject to certain restrictive covenants including the requirement to maintain certain financial ratios, and certain restrictions on the transactions entered into by TAV HTI or its shareholders.
However, with the consent of the facility agent, TAV Esenboğa has a right to have an additional;
• subordinated debt approved in advance by the Facility Agent
• indebtedness up to USD 0,5 million for the acquisition cost of any assets or leases of assets
• indebtedness up to USD 3 million for the payment of tax and social security liabilities
The financial covenants set out in the bank loan are:
a) The Debt Service Cover Ratios are each greater than or equal to
— TAV Esenboğa : 1.10:1
b) The Loan Life Cover Ratio and the Average Projected Debt Service Cover Ratio are greater than or equal to
— TAV Esenboğa : 1.15:1
c) The Debt to Equity Ratio is no greater than.
— TAV Esenboğa : 75:25
Other covenants restrict TAV Esenboğa to enter certain transactions.
The borrowing repayable according to the original term of the contract as of 31 December 2005 is as follows;
31 December 2005
On demand or within one year ..... — In the second year......................... 2,340,088 In the third year ............................ 3,907,551 In the fourth year .......................... 5,894,645 In the fifth year............................. 6,689,483 After five years............................. 60,652,026 79,483,793

18. BANK LOANS (cont’d) Pledges related with Project Loans:
a) Share pledge: In case of an event of default, the banks have the right to the shares of the company. Upon the occurrence of any event of default, the banks can demand the sale of shares by way of public auction in accordance with the applicable provisions of the Bankruptcy and Execution Law of the Republic of Turkiye or by way of private auction among the nominees.
b) Receivable pledge: In case of an event of default, the banks have the right to the receivables of the company in order to perform its obligations under the loan documents. Immediately upon the occurrence of default, the banks shall cease to be entitled to receive payments made by the Company and to exercise the rights with the assigned receivables and all payments relating to assigned receivables shall be made to the banks which shall be entitled to collect the assigned receivables and exercise all rights with respect to assigned receivables.
c) Pledge over bank accounts: In case of an event of default, the banks have the right to the bank accounts of the company in order to perform its obligations under the loan documents. Upon the occurrence of event of default the Company shall be entitled to set-off and apply the whole or any part of the monies standing to the credit of the accounts and any interests, proceeds and other income that may accrue or arise from the accounts.
ATÜ
Presented as Original Currency
Maturity
Interest rate %
Current Liabilities
Non-current liabilities
20.12.2015.......... 21.12.2015 Euribor+2.70 543,821 9,470,131 20.12.2015.......... 21.12.2015 Euribor+2.70 542,398 9,470,132 1,086,219 18,940,263
ATÜ has bank loans in the amount of EUR 20,026,482 under loan agreement. The loan agreement requires 50% of all monies otherwise available for distribution as dividends shall be utilised for mandatory prepayment of the Facility. There are not any outstanding amounts ATÜ can borrow from the bank related to the borrowing agreement.
The borrowing repayable according to the original term of the contract as of 31 December 2005 is as follows;
31 December 2005
On demand or within one year ..... 1,086,219 In the second year......................... 2,104,474 In the third year ............................ 2,104,474 In the fourth year .......................... 2,104,474 In the fifth year............................. 2,104,474 After five years............................. 10,522,367 20,026,482
TAV
Presented as Original Currency
Maturity
Interest rate %
Current Liabilities
Non-current liabilities
TRY.................... — Spot Loan 270 — USD.................... 31.12.2006 Libor+3.75 84,546,357 EUR.................... 07.12.2010 Euribor+3.75 — 5,000,000 EUR.................... 04.01.2007 Euribor+1.90 — 5,000,000 84,546,627 10,000,000
TAV Havalimanlari İşletme A.Ş. has obtained bank loans in the amount of EUR 94,546,627 under loan agreements with three different banks. According to loan agreements, there are some informational covenant matters that are not restrictive.
The borrowing repayable according to the original term of the contract as of 31 December 2005 is as follows;
31 December 2005
On demand or within one year ..... 84,546,627 In the second year......................... 5,731,640 In the third year ............................ 1,422,120 In the fourth year .......................... 1,422,120 In the fifth year............................. 1,424,120 94,546,627
The Euribor rate is 2.362% — 2.844% and Libor rate is 4.3857% — 4.8226% as of 31 December 2005.

18. BANK LOANS (cont’d) TAV (cont’d) The group’s borrowings are repayable as of 31 December 2005 are as follows:
31 December 2005
On demand or within one year ..... 211,490,892 In the second year ........................ 36,599,998 In the third year............................ 40,692,946 In the fourth year.......................... 54,485,897 In the fifth year............................. 64,425,434 After five years ............................ 476,933,265 884,628,432
The details of the Group’s bank loans as at 31 December 2004 are as follows:
Presented as Original Currency
Maturity
Interest rate %
Current liabilities
Non-current liabilities
USD..................... (Letter of credit) — 351,203 — 04.01- TRY..................... 05.01.2005 — 550,819 — EUR..................... 03.03.2005 5.00 10,165,278 — USD..................... 23.05.2005 5.28 9,218,126 — EUR..................... 17.06.2005 Euribor+3.00 33,308,523 — EUR..................... 30.06.2005 5.00 10,000,000 — EUR..................... 30.06.2010 Euribor+2.00 341,116 15,000,000 EUR..................... 31.12.2009 Euribor+2.00 — 25,000,000 63,935,065 40,000,000
The details of the Group’s bank loans as at 31 December 2003 are as follows:
Presented as Original Currency
Maturity
Interest rate %
Current liabilities
Non-current liabilities
EUR..................... (Letter of credit) — 2,229,333 — USD..................... (Letter of credit) — 325,722 — TRY..................... Spot loan — 423,577 — 16.01.2004 USD..................... 17.11.2004 4.80-7.25 8,129,820 — 05.01.2005 USD..................... 25.03.2005 5.18-6.13 26,401,837 10,024,431 EUR..................... 25.03.2005 Euribor+4.75 34,649,867 8,331,132 24.05.2004 EUR..................... 26.07.2004 4.41-4.60 921,489 — 73,081,645 18,355,563
The majority of the borrowings are arranged at floating rates, thus exposing the Group to cash flow interest rate risk.
The group’s borrowings are repayable as of 31 December 2004 and 2003 are as follows:
31 December 2004
31 December 2003
On demand or within one year..... 63,935,065 73,081,645 In the second year ........................ — 18,355,563 In the third year............................ — — In the fourth year ......................... — — In the fifth year ............................ 25,000,000 — After five years ............................ 15,000,000 — 103,935,065 91,437,208
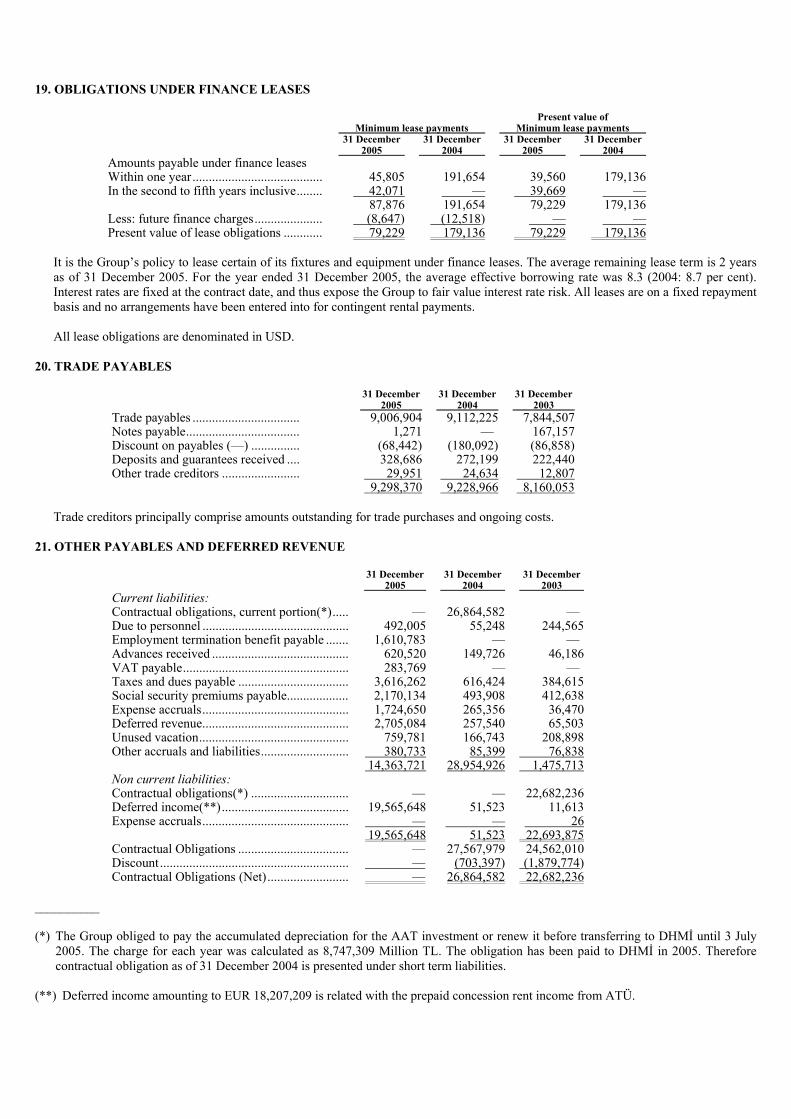
19. OBLIGATIONS UNDER FINANCE LEASES
Minimum lease payments
Present value of Minimum lease payments
31 December 2005
31 December 2004
31 December 2005
31 December 2004
Amounts payable under finance leases Within one year........................................
45,805
191,654
39,560
179,136
In the second to fifth years inclusive........ 42,071 — 39,669 — 87,876 191,654 79,229 179,136 Less: future finance charges..................... (8,647) (12,518) — — Present value of lease obligations ............ 79,229 179,136 79,229 179,136
It is the Group’s policy to lease certain of its fixtures and equipment under finance leases. The average remaining lease term is 2 years as of 31 December 2005. For the year ended 31 December 2005, the average effective borrowing rate was 8.3 (2004: 8.7 per cent). Interest rates are fixed at the contract date, and thus expose the Group to fair value interest rate risk. All leases are on a fixed repayment basis and no arrangements have been entered into for contingent rental payments.
All lease obligations are denominated in USD.
20. TRADE PAYABLES
31 December 2005
31 December 2004
31 December 2003
Trade payables ................................. 9,006,904 9,112,225 7,844,507 Notes payable................................... 1,271 — 167,157 Discount on payables (—) ............... (68,442) (180,092) (86,858) Deposits and guarantees received .... 328,686 272,199 222,440 Other trade creditors ........................ 29,951 24,634 12,807 9,298,370 9,228,966 8,160,053
Trade creditors principally comprise amounts outstanding for trade purchases and ongoing costs.
21. OTHER PAYABLES AND DEFERRED REVENUE
31 December 2005
31 December 2004
31 December 2003
Current liabilities: Contractual obligations, current portion(*)..... — 26,864,582 — Due to personnel ............................................. 492,005 55,248 244,565 Employment termination benefit payable ....... 1,610,783 — — Advances received .......................................... 620,520 149,726 46,186 VAT payable................................................... 283,769 — — Taxes and dues payable .................................. 3,616,262 616,424 384,615 Social security premiums payable................... 2,170,134 493,908 412,638 Expense accruals............................................. 1,724,650 265,356 36,470 Deferred revenue............................................. 2,705,084 257,540 65,503 Unused vacation.............................................. 759,781 166,743 208,898 Other accruals and liabilities........................... 380,733 85,399 76,838 14,363,721 28,954,926 1,475,713 Non current liabilities: Contractual obligations(*) .............................. — — 22,682,236 Deferred income(**)....................................... 19,565,648 51,523 11,613 Expense accruals............................................. — — 26 19,565,648 51,523 22,693,875 Contractual Obligations .................................. — 27,567,979 24,562,010 Discount.......................................................... — (703,397) (1,879,774) Contractual Obligations (Net)......................... — 26,864,582 22,682,236
__________ (*) The Group obliged to pay the accumulated depreciation for the AAT investment or renew it before transferring to DHMİ until 3 July
2005. The charge for each year was calculated as 8,747,309 Million TL. The obligation has been paid to DHMİ in 2005. Therefore contractual obligation as of 31 December 2004 is presented under short term liabilities.
(**) Deferred income amounting to EUR 18,207,209 is related with the prepaid concession rent income from ATÜ.

22. PROVISION FOR EMPLOYMENT TERMINATION BENEFITS
Under the Turkish Labour Law, the Company and its Turkish subsidiaries and associates are required to pay termination benefits to each employee who has completed one year of service and whose employment is terminated without due cause, is called up for military service, dies or who retires after completing 25 years of service (20 years for women) and reaches the retirement age (58 for women and 60 for men). Since the legislation was changed on 8 September 1999, there are certain transitional provisions relating to length of service prior to retirement.
The amount payable consists of one month’s salary limited to a maximum of EUR 1,088 (2004: EUR 862, 2003: EUR 722) for each period of service at 31 December 2005.
The liability is not funded, as there is no funding requirement.
The provision has been calculated by estimating the present value of the future probable obligation of the Company and its Subsidiaries and Joint Venture registered in Turkey arising from the retirement of employees. IFRS require actuarial valuation methods to be developed to estimate the enterprise’s obligation under defined benefit plans. Accordingly the following actuarial assumptions were used in the calculation of the total liability:
• The principal assumption is that the maximum liability for each year of service will increase in line with inflation. Thus, the
discount rate applied represents the expected real rate after adjusting for the anticipated effects of future inflation. Consequently, in the accompanying financial statements as at 31 December 2005, the provision has been calculated by estimating the present value of the future probable obligation of the Group arising from the retirement of the employees. The provisions at 31 December 2005 have been calculated assuming an annual inflation rate of 6.175% (2004: 10% and 2003) and a discount rate of 12% (2004: 16% and 2003) resulting in a real discount rate of approximately 5.49% (2004: 5.45% and 2003: 5.93%). It is planned that, retirement rights will be paid to employees at the end of concession periods. Accordingly, present value of the future probable obligation has been calculated based on the concession periods.
31 December 2005
31 December 2004
31 December 2003
Obligation, current portion........ — 1,903,274 — Obligation, long term portion.... 2,359,745 600,279 1,447,771 Total .......................................... 2,359,745 2,503,553 1,447,771
Year ended 31 December 2005
Year ended 31 December 2004
Year ended 31 December 2003
Present value at 1 January ......................................... 2,503,553 1,447,771 939,331 Service cost ............................................................... 1,273,158 1,105,653 586,918 Interest cost ............................................................... 133,498 108,464 65,526 Retirement pay paid .................................................. (1,550,045) (77,888) (106,010) Retirement pay payable(*) ........................................ (1,610,783) — — Provision released ..................................................... (44,666) (15,676) (15,604) Obligation acquired on acquisition of subsidiary ...... 1,258,894 — — Translation (gain)/loss............................................... 396,136 (64,771) (22,390) Present value at end of the period ............................. 2,359,745 2,503,553 1,447,771
__________ * At the time of new concession agreement, all personnel have been transferred from the Company to TAV HTI. Accordingly, management decided to pay employee
termination benefits to all personnel. Therefore obligation of the Company as of 31 December 2004 is presented under short term liabilities. EUR 1,550,045 of total liability has been paid in 2005 and the remaining balance of EUR 1,193,555 will be paid in 2006.

23. TAXATION ON INCOME
31 December 2005
31 December 2004
31 December 2003
Current tax liability: Current corporate tax provision.... 2,134,669 2,334,187 2,546,808 Prepaid taxes and funds................ (1,420,709) (1,476,676) (1,573,627) 713,960 857,511 973,181
Year ended 31 December 2005
Year ended 31 December 2004
Year ended 31 December 2003
Income tax expense/(benefit): Current tax................................. 2,134,669 2,334,187 2,546,808 Deferred tax (benefit)/charge..... (12,024,218) (1,678,571) (31,524,675) (9,889,549) 655,616 (28,977,867)
Corporate Tax
The Group is subject to Turkish corporate taxes. Provision is made in the accompanying financial statements for the estimated charge based on the Group’s results for the years and periods.
Corporate tax is applied on taxable corporate income, which is calculated from the statutory accounting profit by adding back non-deductible expenses, and by deducting dividends received from resident companies, other exempt income and investment incentives utilized.
The effective rate of tax in 2005 is 30% (2004: 33% and 2003: 30%).
In Turkey, advance tax returns are filed on a quarterly basis. The advance corporate income tax rate in 2005 is 30% (2004: 33% and 2003: 30%). The excess temporary tax paid of corporate income that was calculated at the rate of 30% during the taxation of the corporate income in temporary taxation periods after January 2006 over 20% will be deducted from future temporary tax returns.
Losses are allowed to be carried 5 years maximum to be deducted from the taxable profit of the following years. However, losses occurred cannot be deducted from the profit occurred in the prior years retroactively.
In Turkey, there is no procedure for a final and definitive agreement on tax assessments. Companies file their tax returns between 1-25 April following the close of the accounting year to which they relate. Tax authorities may, however, examine such returns and the underlying accounting records and may revise assessments within five years.
Income withholding tax
In addition to corporate taxes, companies should also calculate income withholding taxes and funds surcharge on any dividends distributed, except for companies receiving dividends who are resident companies in Turkey and Turkish branches of foreign companies. The rate of income withholding tax is 10% starting from 24 April 2003. This rate was changed to 15% with the code numbered 5520 article 15 commencing from 21.06.2006. However until the resolution of council of ministers, it will be used as 10%. After the resolution, declared in official journal in July 23, 2006 this rate changed to 15% commencing from 23 July 2006. Undistributed dividends incorporated in share capital are not subject to income withholding taxes. Withholding tax at the rate of 19,8% is still applied to investment allowances relating to investment incentive certificates obtained prior to 24 April 2003. Subsequent to this date, companies can deduct 40% of the investments within the scope of the investment incentive certificate and that are directly related to production facilities of the company. The investments without investment incentive certificates do not qualify for tax allowance.
Investment incentive certificates are revoked commencing from 1 January 2006. If companies cannot use investment incentive due to inadequate profit, such outstanding investment incentive can be carried forward to following years as of 31 December 2005 so as to be deducted from taxable income of subsequent profitable years. However the companies can deduct the carried forward outstanding allowance from 2006, 2007 and 2008 taxable income. The investment incentive amount that cannot be deducted from 2008 taxable income will not be carried forward to following years.
The tax rate that the companies can use in the case of deducting the tax investment incentive amount in 2006, 2007 and 2008 is 30%. If the Company cannot use the investment incentive carried forward, the effective tax rate will be 20% and the unused investment incentive will be cancelled.
As the management of the Group planned not to use the investment incentives, the consolidated Group companies have used 20% corporate tax rate in 2006.

23. TAXATION ON INCOME (cont’d)
Inflation adjusted legal tax calculation
For 2003 and previous years, taxable profits were calculated without any inflation adjustment to the statutory records, except that fixed assets and the related depreciation were revalued annually. Law No. 5024 published in the Official Gazette No. 25332 on 30 December 2003 requires the application of inflation accounting in Turkey in 2004 and future years for tax purposes, if the actual rate of inflation meets certain thresholds, using principles which do not differ substantially from the principles in IAS 29 “Financial Reporting in Hyperinflationary Economies”. As inflation met certain thresholds as of 31 December 2004, the Group has adjusted its statutory financial statements as of 31 December 2004 in accordance with Law No. 5024 and inflation adjusted balances as at 31 December 2004 were taken as opening balances as of 1 January 2005. However, as inflation did not meet the required thresholds as at 31 December 2005, no further inflation adjustment made to the Group’s statutory financial statements in 2005.
Deferred Tax
The Group recognises deferred tax assets and liabilities based upon temporary differences arising between its financial statements as reported for IFRS purposes and its statutory tax financial statements. These differences usually result in the recognition of revenue and expenses in different reporting periods for IFRS and tax purposes and they are given below.
For calculation of deferred tax asset and liabilities, the rate of 30% (2004 and 2003: 30%) is used.
In Turkey, the companies cannot declare a consolidated tax return, therefore subsidiaries that have deferred tax assets position were not netted off against subsidiaries that have deferred tax liabilities position and disclosed separately.
Subsidiaries that have deferred tax assets position:
31 December 2005
31 December 2004
31 December 2003
Deferred tax (assets)/liabilities: Revaluation and depreciation/amortisation differences of fixed assets ...........................................................................
(260,313)
(3,262,508)
(5,993,430)
Revaluation of prepaid rent to DHMİ..................................... (563,141) — — Provision for employment termination benefits ..................... (278,470) (751,065) (434,331) Unused investment incentive.................................................. (15,536,271) — Tax losses carried forward ..................................................... (2,230,428) (3,562,249) — Change in fair value of interest rate derivatives ..................... (460,204) — — Discount on receivables and payables .................................... 12,223 54,071 12,481 Provision for doubtful receivables.......................................... (140,091) (51,352) (110,673) Other....................................................................................... (818,441) (227,095) 238,400 Net deferred tax assets............................................................ (20,275,136) (7,800,198) (6,287,553)
Subsidiaries that have deferred tax liabilities position:
31 December 2005
31 December 2004
31 December 2003
Revaluation and depreciation/amortisation differences of fixed assets ............................................................................
4,925,967
785,172
—
Provision for employment termination benefits ...................... (429,454) — — Unused investment incentive .................................................. (155,516) (669,804) — Discount on receivables and payables..................................... 2,097 — — Provision for doubtful receivables .......................................... (40,695) — — Other ....................................................................................... (375,248) — — Net deferred tax liabilities ....................................................... 3,927,151 115,368 —
At the balance sheet date, the Group has unused tax losses of EUR 7,434,759 (2004: EUR 11,874,163 and 2003: 0) available for offset against future profits. A deferred tax asset has been recognised in respect of 2,230,428 (2004: EUR 3,562,249, 2003: 0) of such losses. Unutilised tax losses will expire as follows:
31 December 2005
31 December 2004
31 December 2003
Expire in 2009... 547,445 11,874,163 — Expire in 2010... 6,887,314 — — Total .................. 7,434,759 11,874,163 —

23. TAXATION ON INCOME (cont’d)
Movements of deferred tax (assets)/liabilities are as follows:
Year ended 31 December 2005
Year ended 31 December 2004
Year ended 31 December 2003
Opening balance at 1 January ...................... (7,684,830) (6,287,553) 25,853,355 Acquisition of subsidiary(*) ........................ 4,519,475 — — Charged to profit or loss for the year........... (12,024,218) (1,678,571) (31,524,675) Translation effect......................................... (1,158,412) 281,294 (616,233) Closing balance at the end of the period...... (16,347,985) (7,684,830) (6,287,553)
__________ * Balance represents the deferred tax liability of HAVAŞ at the time of acquisition.
Total charge for the year can be reconciled to the accounting profit as follows:
Year ended 31 December 2005
Year ended 31 December 2004
Year ended 31 December 2003
Reconciliation of taxation: Profit before tax........................................................................ 30,651,711 13,525,863 37,634,940 Tax at the domestic income tax rate of 30% (2004: 33% and 2003: 30%) ......................................................................
9,195,513
4,463,534
11,290,482
— tax effects of: — expenses that are not deductible in determining taxable profit .....................................................................
551,056
613,772
41,659
— non-taxable income ........................................................... (243,270) (1,203,654) — — utilisation of tax losses not previously recognised ...........................................................................
1,011,272
351,618
585,487
— investment incentives used................................................ (15,360,302) (669,804) (15,310,081) — effect of consolidation eliminations .................................. (158,031) (3,073) 23,743 — effect of other adjustments ................................................ (4,885,787) (2,896,777) (25,609,157) Tax (income)/expense for the year........................................... (9,889,549) 655,616 (28,977,867)

24. COMMITMENTS, CONTINGENCIES AND CONTRACTUAL OBLIGATIONS
Commitments and contingencies
31 December 2005
31 December 2004
31 December 2003
Letter of guarantees given to DHMİ ................... 117,993,819 — — Letter of guarantees given to third parties........... 94,186,677 94,437,040 46,168,226 Letter of credit..................................................... 1,020,103 — — Notes payable given ............................................ 88,855 — — 213,289,454 94,437,040 46,168,226
Majority of letter of guarantees given to third parties includes the guarantees given to customs and some customers Majority of letter of credit includes letter of credits given for the constructions of Ankara Esenboğa and İzmir Adnan Menderes airports.
TAV HTI is obliged to give 6% of the total rent amount as a letter of guarantee for 15.5 years amounting to USD 152,580,000 according to the rent agreement made with the Landlord Authority (“DHMİ”). EUR 117,993,819 of the total obligation has been provided by the Group as of 31 December 2005, and the rest of the obligation of 34,586,181 EUR in terms of letter of guarantees has been provided by Akfen İnşaat ve Turizm A.Ş. as of 31 December 2005. The Company has transferred the letter of guarantees to Tav Havalimanlari İşletme A.Ş. during year 2006.
Havaş’s shares have been pledged for the loan amounting to YTL 140,888,999 (EUR 88,748,976).
The accounts of TAV Havalimanlari Holding A.Ş. for the years ended 2001 through 2004 are under review by the Head Account Specialists of the Ministry of Finance for tax purposes (“Tax Authority”). The Company has received the Tax Authority report for 2001, which has identified certain expenses that were deducted in 2001, 2002, 2003 but should have been deducted in 2004 and 2005. The assessment therefore results in a difference in the timing of the tax payments, and any resulting impacts. The initial assessment is that there are 19,060,911 TRY, 17,665,143 TRY and 25,518,857 TRY should have been added to tax base for the years of 2001, 2002 and 2003 respectively and that there are additional expenses that can be recognised of 2,201,345 TRY in 2004 and and 60,585,779 TRY in 2005. Management believes the treatment they adopted is in accordance with Turkish Tax Legislation rules, and on 29 January 2007 the Company has applied to the court to challenge the position of the Tax Authority. Management believes that the case will be settled in its favor based on compliance with present tax legislation rules, judgement decisions and applications of the Ministry of Finance. Therefore, no provision has been reflected in the financial statements. If the court were to find against the Group, management estimates the late tax payment liability would be 13 Million TRY as of 30 September 2006.
Contractual obligations
TAV HTI
TAV HTI is bound by the terms of the Concession Agreement made with DHMİ. If the Company does not follow the rules and regulations set forth in the concession agreement, this might lead to the forced cessation of the Company’s operation.
DHMİ may terminate the Concession Agreement if the ownership of interest of TAV in TAV HTI should be below 49% during the first three years of the operation period.
At the end of the contract period, the Company will be responsible for one year for the maintenance and repair of the devices, system and equipment supplied for the contractual facilities. In case the necessary maintenance and repairs not made, DHMİ will have this maintenance and repair made, and the price will be set off from the final acceptance.
Pursuant to the provisions of this agreement, the contractual obligations the Company include the rental of the above mentioned facilities for a period of fifteen and a half years beginning on July 3rd, 2005; the operation of the facilities in compliance with international norms and standards within the rental (operation) period; the performance of periodic repair and maintenance activities on the facilities and the transfer of the facilities in question including the supporting systems, equipment, furniture and fixtures in a proper and usable condition to the owner authority (“DHMİ”) upon the expiry of the rental period.
In the case where the Company as the renter performs a delayed and/or incomplete rent payment to the State Airports Authority, the Company is charged a fine of 10% of the rent amount to be paid. The Company is then obliged to perform the payment latest within five days. Otherwise, the State Airports Authority shall be entitled to cancel the rent agreement. The Company is not entitled to claim the rent payments performed to the State Airports Authority prior to the cancellation of the contract.
The Group encompass the provision and installation of EDS Security Systems for the International and Domestic Lines Terminals, and various re-design at the exterior of the Domestic Lines Terminal as determined by the owner authority in the rent contract. According to the agreement, the Group should complete the installation until 1 January 2007.
24. COMMITMENTS, CONTINGENCIES AND CONTRACTUAL OBLIGATIONS (cont’d)
TAV Esenboğa and TAV İzmir
TAV Esenboğa and TAV İzmir are bound by the terms of the BOT Agreement made with DHMİ. If the Company does not follow the rules and regulations set forth in the concession agreement, this might lead to the forced cessation of the Company’s operation. According to the BOT Agreement.
Share capital of the Company can not be less than 20% of fixed investment amount.
The Companies have a commitment to make additional investment up to 20% of the initial BOT investment upon request of DHMİ.
At the end of the contract period, the Companies will be responsible for one year for the maintenance and repair of the devices, system and equipment supplied for the contractual facilities. In case the necessary maintenance and repairs not made, DHMİ will have this maintenance and repair made, and the price will be set off from the final acceptance.
All equipments used by the Company must be brand new and under warranty and need to meet the international standards and Turkish Standards as well.
If the need shall arise to replace fixed assets subject to depreciation, which become unusable within the rent period and the depreciation rates of which are not delineated in the Tax Application Law, the renter is obliged to perform the replacement.
All fixed assets covered by the implementation contract will be transferred to DHMİ free of charge. Transferred items must be in working conditions and should not be damaged.
The Company has the responsibility of repair and maintenance of all fixed assets under the investment.
Havaş
Prior to the legal transfer of 95% of the shares in TAV İzmir in December 2006, Havas owned 100% of TAV İzmir. Based on a prior agreement, it intended to transfer 100% of these shares to the Group. A Protocol for Joint Venture was executed between Bayindir Insaat Turizm A.S. (“Bayindir”), Havaalanlari Yer Hizmetleri A.S. (“Havas”) and Urart Gümrüksüz Magaza İşletmeciligi ve Ticaret A.S. (“Urart”) on 13 August 2004 relating to İzmir Adnan Menderes Airport New International Terminal. This Joint Venture Protocol contains provisions to the effect that when İzmir Adnan Menderes Havalimani Uluslararasi Terminal Insaati ve İşletmeciligi A.S. (“TAV İzmir”), which has not been incorporated as of the date of the Joint Venture Protocol, is incorporated, Havas will sell the 5% of the shares that it owns in TAV İzmir to Urart. In 2005, Urart filed a lawsuit against Bayindir, Havas and TAV İzmir for the specific performance of the above mentioned Joint Venture Protocol. Under the said lawsuit the court has rendered a preliminary injunction order for prohibiting the sale, transfer or establishment of any personal and/or real rights (rights in rem) on such number of shares owned by Havas in TAV İzmir that corresponds to the 5% of the share capital of TAV İzmir. This preliminary injunction order is still in effect since the lawsuit is still pending being litigated at the court.
In the event that the court renders a judgement ruling for the transfer of such number of the shares owned by Havas in TAV İzmir that corresponds to the 5% of the share capital of TAV İzmir to Urart, as the Joint Venture Protocol does not set forth the purchase price, the purchase price to be determined by the court will be paid by Urart to Havas for acquiring these shares.
In accordance with the general ground handling agreement (an integral part of the ground handling operation A Group license) signed with the Landlord Authority (“DHMİ”), the Company undertakes the liability of all the losses incurred by its personnel to DHMİ or to third parties. It also takes the responsibility of the training facilities given to the personnel and the quality of the service provided by its personnel together with the repair and maintenance of the ground handling vehicles and equipment. The Company is required to provide DHMİ with a letter of guarantee amounting to USD 1,000,000. Fines received from losses incurred by the ground handling personnel or fines arising from the violation of the related agreement will be charged to the Company. Fines which are over due in accordance with the appointed agreement/ period declared by DHMİ will be settled by the liquidation of the letter of guarantee. If DHMİ liquidates the collateral, the Company is obliged to complete the collateral at its original amount which is USD 1,000,000 within 15 days.
In accordance with the rental agreements signed with the DHMİ regarding the several parking areas, land, buildings, offices at the Atatürk, Esenboğa, Adnan Menderes, Dalaman, Adana, Trabzon, Milas, Kapadokya, Antalya and Kayseri airports, when the rent period ends DHMİ will have the right to retain the immovables built in the area without any pay.

24. COMMITMENTS, CONTINGENCIES AND CONTRACTUAL OBLIGATIONS (cont’d)
Contingent asset
The Company is able to expense this VAT on concession rent payments upon the issuance of the related invoice, and DHMİ issues the invoice annually. Cumulative VAT expense related with DHMİ invoices as of 31 December 2005: EUR 4,417,918.
The Company has opened a tax court case in February 2006 against Ministry of Finance for the concession rent, which has been paid partially and the remaining will be paid to DHMİ, for not being subject to VAT. According to temporary VAT code number 12, the Group stated that airport privatisations are exempt from VAT. Group management believes that this court will be finalised in Group’s favor, paid VAT will be reimbursed to the Group, and the Group will not pay VAT on concession rent anymore.
25. SHARE CAPITAL AND LEGAL RESERVES
The parent’s share capital held as of 31 December 2005 is as follows:
Shareholders
(%)
31 December 2005
Tepe İnşaat San. A.Ş.............................................................. 7.50 11,000,000 TAV Yatirim Holding A.Ş..................................................... 40.00 Akfen İnşaat Tur. ve Tic. A.Ş ................................................ 6.80 10,718,500 Akfen Holding A.Ş ................................................................ 0.70 281,500 Hyper Foreign Trade Holland N.V ........................................ 45.00 18,000,000 Paid in capital in TRY (nominal) ........................................... 100.00 40,000,000 Paid in capital in EUR (nominal) ........................................... 25,196,850 Effect of non-cash increases and exchange rates ................... 56,863,220 Paid in capital in EUR ........................................................... 82,060,070
The Company’s share capital consists of 40,000,000 shares amounted to TRY 40,000,000 in 2005 (2004 and 2003: 40,000,000).
Tepe İnşaat Sanayi A.Ş., Sera Yapi End. ve Tic. Ltd. Şti. and Akfen İnşaat Turizm ve Ticaret A.Ş. are shareholders of Hyper Foreign Trade Holland N.V.
BTA, TAV İşletme, TAV HTI, TAV Esenboğa, and ATÜ were acquired from parents of the Company on 29 December 2005. The acquired subsidiaries and the joint venture which were under common control, are accounted for by use of the pooling of interest method. Accordingly, the financial statements of these entities have been retrospectively included in the accompanying consolidated financial statements, as if these entities had merged at the beginning of the earliest period presented, beginning of 2003. Share capital represents the combined share capital of the Group at 31 December 2004 and 2003 as there is not a legal parent company and effective from 31 December 2005 share capital represents the parent Company’s capital.
Legal Reserves
The legal reserves consist of first and second legal reserves, appropriated in accordance with the Turkish Commercial Code. The first legal reserve is appropriated out of historical statutory profits at the rate of 5% per annum, until the total reserve reaches 20% of the historical paid-in share capital. The second legal reserve is appropriated after the first legal reserve and dividends, at the rate of 10% per annum of all cash dividend distributions.
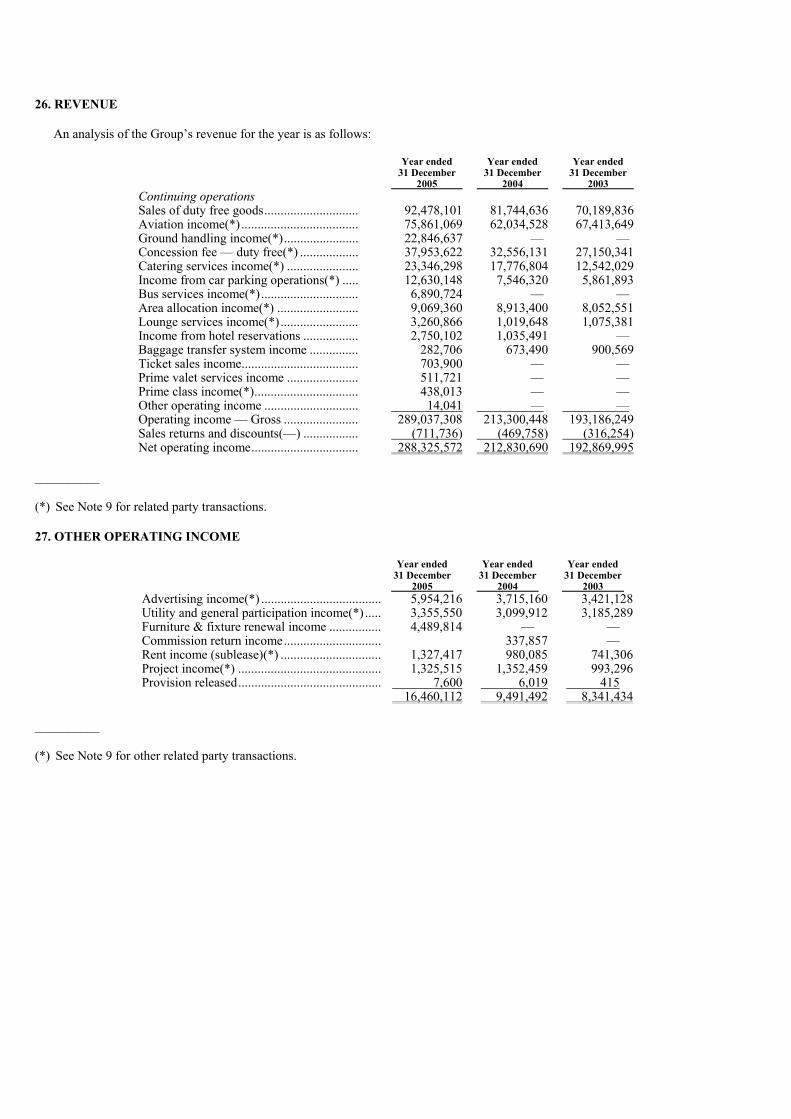
26. REVENUE
An analysis of the Group’s revenue for the year is as follows:
Year ended 31 December 2005
Year ended 31 December 2004
Year ended 31 December 2003
Continuing operations Sales of duty free goods.............................
92,478,101
81,744,636
70,189,836
Aviation income(*) .................................... 75,861,069 62,034,528 67,413,649 Ground handling income(*)....................... 22,846,637 — — Concession fee — duty free(*) .................. 37,953,622 32,556,131 27,150,341 Catering services income(*) ...................... 23,346,298 17,776,804 12,542,029 Income from car parking operations(*) ..... 12,630,148 7,546,320 5,861,893 Bus services income(*).............................. 6,890,724 — — Area allocation income(*) ......................... 9,069,360 8,913,400 8,052,551 Lounge services income(*)........................ 3,260,866 1,019,648 1,075,381 Income from hotel reservations ................. 2,750,102 1,035,491 — Baggage transfer system income ............... 282,706 673,490 900,569 Ticket sales income.................................... 703,900 — — Prime valet services income ...................... 511,721 — — Prime class income(*)................................ 438,013 — — Other operating income ............................. 14,041 — — Operating income — Gross ....................... 289,037,308 213,300,448 193,186,249 Sales returns and discounts(—) ................. (711,736) (469,758) (316,254) Net operating income................................. 288,325,572 212,830,690 192,869,995
__________ (*) See Note 9 for related party transactions. 27. OTHER OPERATING INCOME
Year ended 31 December 2005
Year ended 31 December 2004
Year ended 31 December 2003
Advertising income(*) ..................................... 5,954,216 3,715,160 3,421,128 Utility and general participation income(*) ..... 3,355,550 3,099,912 3,185,289 Furniture & fixture renewal income ................ 4,489,814 — — Commission return income.............................. 337,857 — Rent income (sublease)(*) ............................... 1,327,417 980,085 741,306 Project income(*) ............................................ 1,325,515 1,352,459 993,296 Provision released............................................ 7,600 6,019 415 16,460,112 9,491,492 8,341,434
__________ (*) See Note 9 for other related party transactions.

28. OTHER OPERATING EXPENSE
Year ended 31 December 2005
Year ended 31 December 2004
Year ended 31 December 2003
Management consultancy fee(*) ................. 2,805,762 — — Maintenance expenditures(*) ...................... 15,040,829 9,349,435 10,577,202 VAT not recoverable ................................... 6,032,743 — — Cleaning expense......................................... 3,738,798 3,284,172 2,324,104 Security cost(*) ........................................... 4,602,008 3,967,838 2,380,514 Utility cost ................................................... 6,743,271 5,095,879 4,618,965 Insurance expense(*)................................... 2,248,182 2,595,430 2,827,953 Consultancy expenses(*)............................. 4,382,447 533,985 1,392,879 Communication and stationary expenses .... 427,841 471,646 254,657 Traveling and transportation expenses ........ 525,575 438,518 1,116,111 Taxes ........................................................... 1,177,600 107,588 81,777 Representation expenses(*)......................... 202,624 353,849 92,964 Advertisement and marketing expenses ...... 426,205 534,136 406,543 Provision expenses ...................................... 488,131 247,989 588,755 Rent expense(*)........................................... 1,603,065 1,550,839 1,425,240 Project expense(*) ....................................... 138,029 14,033 300,972 Expenses incurred from customs................. 177,015 124,843 — Export fee .................................................... 274,565 — — Packaging and label expenses ..................... 230,599 228,322 177,964 Legal expenses ............................................ 210,204 — — Other operating expenses(*)........................ 2,623,868 714,317 1,273,070 54,099,361 29,612,819 29,839,670
__________ (*) See Note 9 for related party transactions. 29. INVESTMENT INCOME
Year ended 31 December 2005
Year ended 31 December 2004
Year ended 31 December 2003
Interest on bank deposits and intercompany loans(*) ...... 14,852,965 7,015,832 8,023,691 Profit on sale of marketable securities ............................. 371,797 50,580 489,237 15,224,762 7,066,412 8,512,928
__________ (*) See Note 9 for related party transactions 30. OTHER GAINS AND LOSSES
Year ended 31 December 2005
Year ended 31 December 2004
Year ended 31 December 2003
Donations to Bilkent University(—) .... (1,512,112) (1,489,697) (1,305,256) Gain on sale of fixed assets(*) ............. 1,150,163 — 1,758,695 Other income(*) ................................... 769,887 710,379 775,654 407,938 (779,318) 1,229,093
__________ (*) See Note 9 for related party transactions.

31. FINANCE COSTS (NET)
Year ended 31 December 2005
Year ended 31 December 2004
Year ended 31 December 2003
Interest on loans(*)............................... (11,384,801) (6,930,907) (9,512,230) Commission for letter of guarantees .... (1,434,953) (282,175) (553,655) Bank charges ........................................ (24,468,680) (120,283) (1,576,518) (37,288,434) (7,333,365) (11,642,403) Discount interest expense — net .......... (940,531) (967,796) (2,086,591) Fair value of derivatives....................... (1,534,012) — — Other finance costs(—) ........................ (512,754) (11,815) (715,091) (40,275,731) (8,312,976) (14,444,085)
__________ (*) See Note 9 for related party transactions.
Net borrowing costs including in the cost of qualifying assets during the year are EUR 4,146,717 (2004: 2,600,000). These costs were reduced from finance costs.
32. ACQUISITION OF SUBSIDIARY
On 1 July 2005, the Group acquired 60% of the issued share capital of Havaş Havaalanlari Yer Hizmetleri A.Ş. (“HAVAŞ) for cash consideration of USD 125,000,000 (EUR 103,357,493). At the date of this acquisition, the Group or HAVAŞ had right to acquire the remaining shares of TAV İzmir without any additional consideration. According to the conditions of the agreement, TAV İzmir’s other shareholder has committed to transfer the rest of TAV İzmir shares based on the conditions those will be set by the Group, and accordingly transferred all rights and liabilities on TAV İzmir to the Group. In 2006, remaining 35% of TAV İzmir shares have been transferred to the Group. Therefore, at the time of acquisition of HAVAŞ, it was considered that, 100% of TAV İzmir shares have also been purchased with the consideration paid amounting to USD 125,000,000. This transaction has been accounted for by the purchase method of accounting.
The net assets acquired in the transaction, and the goodwill arising, are as follows:
Net assets acquired
Acquiree’s carrying amount before combination
Fair value adjustments
Fair value
Property, plant and equipment ................... 11,463,365 — 11,463,365 Intangible assets ......................................... — 14,933,724 14,933,724 Deferred tax assets ..................................... 533,184 — 533,184 Inventories.................................................. 396,720 — 396,720 Trade receivables ....................................... 1,566,893 — 1,566,893 Cash and cash equivalents.......................... 7,196,216 — 7,196,216 Other assets ................................................ 5,218,600 — 5,218,600 Retirement benefit obligation..................... (1,258,894) — (1,258,894) Trade payables ........................................... (4,329,313) — (4,329,313) Deferred tax liability .................................. (1,018,759) (4,061,973) (5,080,732) 19,768,012 10,871,751 30,639,763 Goodwill .................................................... 72,717,730 Total consideration, satisfied by cash ........ 103,357,493 Net cash outflow arising on acquisition Cash consideration paid .............................
103,357,493
Cash and cash equivalents acquired ........... (7,196,216) 96,161,277
The goodwill arising on the acquisition of Havaş Havalimanlari Yer Hizmetleri A.Ş. is attributable to the anticipated profitability of the distribution of the Group’s services and the anticipated future operating synergies from the combination.
If the acquisition of Havaş Havalimanlari Yer Hizmetleri A.Ş. had been completed on the first day of the financial year, Group revenues for the period would have been increased by EUR 20,653,071 and group profit attributable to equity holders of the parent would have been decreased by EUR 2,143,459.

33. DERIVATIVE FINANCIAL INSTRUMENTS
31 December 2005 Assets Liabilities Net Amount Interest rate cap...... 102,782 — (102,782) Interest rate floor ... — 17,475 17,475 Interest rate swap ... — 1,619,319 1,619,319 102,782 1,636,794 1,534,012 Current................... 102,782 1,636,794 1,534,012
Interest rate derivatives
TAV Esenboğa uses interest rate derivatives (cap, floor and swap) to manage its exposure to interest rate movements on its bank borrowings. Contracts with nominal values of EUR 178,000,000 have floating interest receipts at EURIBOR plus 3.5 per cent.
34. BUSINESS SEGMENTS
For management purposes, the Group is currently organised into five divisions; Terminal Services, Catering Service, Duty Free Service, Ground Handling Service and Other. These divisions are the basis on which the Group reports its primary segment information. The principal activities of each are as follows:
• Terminal services: Operating Terminal Buildings, the Carpark and the General Aviation Terminal. The Group companies included
in this segment are TAV, TAV HTI, TAV Esenboğa, and TAV İzmir.
• Catering service: Managing all food & beverage operations of the terminal, both for the passengers and the terminal personnel, which is run by BTA.
• Duty free service: Sales of duty free goods for the international arriving and departing passengers. The Group operates its duty free
service through ATÜ.
• Ground handling service: Providing, traffic, ramp, flight operation, cargo and all other ground handling services for domestic and international flights under the Civil Aviation Legislation license. The Group operates the ground handling services through HAVAŞ.
• Other: Providing CIP services. The Group company included in this segment is TAV İşletme.
Segment information about these segments is presented below:
31 December 2005
Terminal Services
Catering Service
Duty Free Service
Ground handling service
Other
Consolidation Eliminations
Consolidated
Operating income ....... 187,041,344 28,994,320 92,475,713 50,451,192 10,438,074 (81,075,071) 288,325,572 Operating expenses..... (135,243,569) (27,361,439) (47,934,529) (42,683,433) (6,453,015) 37,035,321 (222,640,664) Other operating income ......................
14,967,030
466,692
1,520,076
32,486
417,594
(943,766)
16,460,112
Other operating expenses....................
(45,833,280)
(4,567,715)
(40,600,564)
(5,364,110)
(2,909,597)
45,175,905
(54,099,361)
Operating profit .......... 20,931,525 (2,468,142) 5,460,696 2,436,135 1,493,056 192,389 28,045,659 Other information -Assets ........................
1,372,820,603
6,647,431
30,810,615
28,239,984
6,308,016
(295,684,121)
1,149,142,528
-Liabilities .................. (1,124,713,082) (8,687,613) (24,200,759) (8,125,858) (5,350,281) 188,692,184 (982,385,409) -Tangible, intangible assets and BOT purchases ..................
128,631,869
407,801
516,279
2,483,289
577,363
—
132,616,601
-Tangible, intangible assets and BOT depreciation and amortisation ..............
46,433,482
1,830,379
488,744
2,487,746
88,047
—
51,328,398
-Concession rent expense .....................
(69,915,181)
—
—
—
—
—
(69,915,181)

34. BUSINESS SEGMENTS (cont’d) 31 December 2004
Terminal Services
Catering Service
Duty Free Service
Ground handling service
Other
Consolidation Eliminations
Consolidated
Operating income .................... 151,320,498 20,631,596 81,744,636 — — (40,866,040) 212,830,690 Operating expenses.................. 106,754,549 (19,990,703) (43,019,155) — — 9,076,874 160,687,533 Other operating income ........... 8,893,163 467,581 980,085 — — (849,337) 9,491,492 Other operating expenses ........ 29,481,759 (2,156,553) (32,027,131) — (42,666) 34,095,290 29,612,819 Operating profit ....................... 23,977,353 (1,048,079) 7,678,435 — (42,666) 1,456,787 32,021,830 Other information -Assets .....................................
279,387,367
5,342,809
9,147,507
—
27,682
(23,235,595)
270,669,770
-Liabilities ............................... (162,615,313) (5,529,619) (2,834,391) — (57,444) 23,243,940 (147,792,827) -Tangible, intangible assets and BOT purchases................
17,614,519
2,364,363
901,512
—
6,804
—
20,887,198
-Tangible, intangible assets and BOT depreciation and amortisation ...........................
90,692,261
2,482,255
1,110,320
—
—
—
94,284,836
31 December 2003
Terminal Services
Catering Service
Duty Free Service
Ground handling service
Other
Consolidation Eliminations
Consolidated
Operating income .................... 141,464,868 14,502,129 70,189,836 — — (33,286,838) 192,869,995 Operating expenses.................. 82,910,775 (12,872,044) (37,417,523) — — 6,640,853 126,559,489 Other operating income ........... 7,545,158 380,072 741,306 — — (325,102) 8,341,434 Other operating expenses ........ 27,831,587 (1,973,674) (27,382,305) — — 27,347,896 29,839,670 Operating profit ....................... 38,267,664 36,483 6,131,314 — — 376,809 44,812,270 Other information -Assets .....................................
251,814,980
12,722,702
10,071,547
—
—
(2,354,703)
272,254,526
-Liabilities ............................... (114,573,276) (11,204,125) (3,170,207) — — 2,353,734 (126,593,874) -Tangible, intangible assets and BOT purchases................
42,429,522
84,549
216,736
—
—
—
42,730,807
-Tangible, intangible assets and BOT depreciation and amortisation ...........................
70,722,019
1,278,275
537,835
—
—
—
72,538,129
35. ADDITIONAL EVENTS AFTER THE BALANCE SHEET DATE
The name of the company formerly known as ‘TAV Havalimanlari Terminal İşletmeciliği A.Ş.’ has been changed into ‘TAV İstanbul Terminal İşletmeciliği A.Ş.’ as of 7 August 2006.
The name of the ultimate shareholder of the company formerly known as ‘TAV Havalimanlari İşletme A.Ş.’ has been changed into ‘TAV Havalimanlari Holding A.Ş.’ as of 7 August 2006.
On 21 July 2006, share capital of the Company has been increased to TRY 200,000,000 with nominal value.
TAV Havalimanlari İşletme A.Ş.’s nominal share has been increased from TRY 200,000,000 to TRY 232,500,000 at 6 December 2006. The increased capital has been fully paid on 22 December 2006.
TAV Havalimanlari İşletme A.Ş.’s 9.87% of shares has been sold to IDB Infrastructure Fund L.P., Global Investment House KSCC and Global Opportunistic Fund II Company BSCC at 3 May 2006 and 8 August 2006 respectively. The shareholders of the Group have paid their loan payables to TAV Havalimanlari Holding A.Ş. with the funds provided from this sale. The shareholders are planning to pay the rest of their loan payables to TAV Havalimanlari Holding A.Ş. following to the planned next share sale.
TAV Georgia and TAV Bilişim were acquired from parents of the Company on 27 March 2006 and 17 May 2006 respectively. The acquired subsidiary and the joint venture were also under common control. Since these entities have been established in 2005 and their 2005 key figures were not material to the consolidated financial statements, 31 December 2005 financial statements have not been restated.
A hedging contract has been signed between HVB and TAV HTI on 17 January 2006 for the 50% of junior facility (in total EUR 33,961,623).

35. ADDITIONAL EVENTS AFTER THE BALANCE SHEET DATE (cont’d)
Subsequent to year end the Group violated a number of its debt covenants resulting in EUR 814,498,716 of its debt becoming currently payable. The Group has committed to complete a financial restructuring and based on that expectation the bank has granted a waiver of the non-compliance. The banks have waived default matters with various waiver letters dated on or before 20 December 2006, provided that funds generated by shareholders have been made to the accounts of the Group’s bank accounts, among other things. The Company’s shareholders, Tepe and Akfen Group companies sold 21% their shares in the Company, to third parties (Babcock Brown Turkish Airportd LLC and Goldman Sachs International), and additionally obtained an additional USD 70 million of a loan from a bank. The investors placed certain restrictions on how these proceeds would be used by the shareholders including, among other things, a requirement that certain amounts be injected into the Group. As of 22 December 2006, the shareholders have transferred USD 317.5 million to the Group.
TAV İzmir has started its operations on 9 September 2006.
TAV Esenboğa has started its operations on 13 October 2006.
The Companies have a commitment to make additional investment up to 20% of the initial BOT investment upon request of DHMİ. DHMİ has requested an extension of EUR 13,900,000 (13% of the initial investment) from TAV İzmir on 21 August 2006 which extended the operation period by 8 months and 27 days. DHMİ has not requested the rest of the additional investment within 20% limit as of this report date.
Bridge loan that TAV HTI utilised from WestLB amounting to EUR 65,199,281 (USD 75 million) has been paid as of 7 July 2006.
Change in the tax rate
According to Law No: 5520 “Corporate Tax Law” announced in Official Gazette on 21 June 2006, corporate tax rate has decreased to 20% starting from 1 January 2006 (31 December 2005: 30%).
The application of incentive allowance has been ceased as of 1.1.2006. However, the amount for unused incentive allowance as of 31 December 2005 can be carried forward for offset against future taxable income if the companies have insufficient taxable income. Nonetheless, incentive allowance carried forward can only be offset against income obtained in 2006, 2007 and 2008. The transfer of incentive allowance amount that cannot be offset against corporate income attributable to 2008 to future periods is not applicable.
Companies will apply a 30% of corporate tax rate if incentive allowance carried forward can be offset against their taxable income in their corporate tax balances for 2006, 2007 and 2008. Unless companies benefit from incentive allowance carried forward, corporate tax rate will be 20% and also no right for incentive allowance will be granted. The Company’s management planned not to benefit from investment incentives in the following years.
Change in tax rate has been disclosed as follows:
31 December 2005
Net deferred tax asset .............................................................. 16,347,985 Less: unused investment incentive.......................................... (15,691,787) Deferred tax asset at 30% as of 31 December 2005................ 656,198 Deferred tax asset at 20% as of 1 January 2006...................... (437.465) Decrease in deferred tax asset as a result of reduction in tax rate...................................................................................
218,733

36. RESTATEMENT OF CURRENT AND PRIOR YEAR FINANCIAL STATEMENTS
The financial statements as of and for the years ended 31 December 2005, 2004 and 2003 have been restated for the following:
a — In prior periods the Company consolidated TAV İzmir and reflected a minority interest for the shares of TAV İzmir held indirectly by the other 40% shareholder of HAVAS. The other shareholders do not have a right to these shares as they relinquished such right at the time of acquisition and, accordingly, TAV İzmir should have been fully consolidated (see Note 1 for complete description of ownership). The Group has restated the financial statements for all periods subsequent to acquisition to eliminate the minority interest and fully consolidated TAV İzmir. Effect of change in accounting method of TAV İzmir is as follows:
2005 Previously Reported EUR
2005 Restated EUR
The effect of restatement EUR
As of 31 December Minority interest...................
51,943,783
43,411,225
(8,532,558)
Payables to related parties .... 24,791,000 28,163,540 3,372,540 Trade payables ..................... 11,403,028 9,249,484 (2,153,544) Retained earnings ................. 42,471,058 45,106,420 2,635,362 Goodwill............................... 74,430,356 72,717,730 (1,712,626) Total Current Assets............. 314,473,687 311,508,115 (2,965,572)
As retained earnings and minority interest figures have been changed in shareholders equity due to the change in accounting method of TAV İzmir, statement of changes in shareholders equity for the year ended 31 December 2005 has also been restated.
b — Certain loan covenants and commitments and contingencies those were not disclosed in prior year disclosures, have been included in this report.
c — As the companies cannot declare a consolidated tax return in Turkey, subsidiaries that have deferred tax assets position were not netted off against subsidiaries that have deferred tax liabilities position and disclosed separately in the current period financial statements. For comparability purposes, gross up of deferred tax assets and liabilities have been made to the balance sheets as of 31 December 2004 as well. Effect of change in presentation is as follows:
Previously Reported EUR
Restated EUR
The effect of restatement EUR
As of 31 December 2005 Deferred tax assets.............
16,347,985
20,275,136
3,927,151
Deferred tax liabilities ....... — 3,927,151 3,927,151 As of 31 December 2004 Deferred tax assets.............
7,684,830
7,800,198
115,368
Deferred tax liabilities ....... — 115,368 115,368
d — While preparing financial statements as of 30 September 2006, the Group determined certain reclassification differences in income statement for the years ended 31 December 2005, 2004 and 2003. In order to be able to have comparable financial statements and disclosures, the Group management made the related reclassifications to the income statement and related disclosures for the year ended 31 December 2005, 2004 and 2003. These reclassifications do not have any effect on net profit/loss figure. In accordance with the reclassifications made to income statement, necessary reclassifications have also been made to segment reporting disclosure (Note 35).
e — On the statements of cash flows, translation reserve generated by the subsidiaries whose functional currencies are other than EUR, has been allocated to each line item of the cash flow statements, whereas it was presented separately before.
f — Following restatements have been done to current and prior year financial statements:
Previously Reported EUR
Restated EUR
The effect of restatement EUR
As of 31 December 2005 Concession fee-duty free ........................................
39,142,324
37,953,622
(1,188,702)
Area allocation income........................................... 7,880,658 9,069,360 1,188,702 As of 31 December 2004 Concession rent expenses (operating expenses) .....
1,225,730
—
1,225,730
Rent expense (other operating expenses) ............... 325,109 1,550,839 (1,225,730) As of 31 December 2003 Concession rent expenses (operating expenses) .....
1,122,928
—
1,122,928
Rent expense (other operating expenses) ............... 302,312 1,425,240 (1,122,928)