target date funds: historical volatility/return profiles · – “american century target maturity...
TRANSCRIPT
Target Date Funds:Historical Volatility/Return Profiles
October 23, 2009
A study by Deloitte Financial Advisory Services LLP in conjunction with Advanced Analytical Consulting Group Inc. for the U.S. Department of Labor, Employee Benefits Security Administration.
Michael J. Brien, PhDDeloitte Financial Advisory Services LLP
Philip J. Cross, PhDDeloitte Financial Advisory Services LLP
Constantijn W.A. Panis, PhDAdvanced Analytical Consulting Group Inc

1Copyright © 2009 Deloitte Development LLC. All rights reserved.
Table of Contents
Objectives and Key Findings
Data and Methodology
Primary Findings
2010 Funds: A First Look
2010 Funds: A Closer Look
Equity Exposure

Objectives and Key Findings

3Copyright © 2009 Deloitte Development LLC. All rights reserved.
Objectives• Provide update on initial Task Order work
– Findings subject to change based on further work and additional data
• Review Life Cycle/Target Date Funds–Provide in-depth look at the universe of life cycle funds
• Evaluate Volatility and Return of Target Date Funds
–Present volatility/return profiles within and across funds–Understand the impact of recent economic crisis
•Explore recent returns and volatility in 2010 funds

4Copyright © 2009 Deloitte Development LLC. All rights reserved.
Key Findings• Rates of returns and volatility on target-2010 funds varied
substantially in 2008– Spread in returns can be traced to substantial variation in equity exposure– Some fund families maintain equity exposure of more than 60 percent, even
for their 2010 fund• Returns generally increase with equity exposure, except in 2008• Overall objective of funds, as stated in fund prospectuses, is
generally not informative of whether a fund is aggressive or conservative
• Funds that performed particularly poorly in 2008 were heavily exposed to equities– Performance may rebound when the returns on equity improve.
• Best performing 2010 funds in ’08 were not “typical” TDFs– “American Century Target Maturity 2010 Inv” invests only in Treasuries– “DWS Target 2010” does not have 2020, 2030, 2040, 2050 sibling funds

Data and Methodology

6Copyright © 2009 Deloitte Development LLC. All rights reserved.
Data*
• Volatility and Returns– Computed from daily fund prices– Source: Bloomberg, Yahoo Finance and the Thrift Savings Plan website
• Asset Composition– Source: MarketWatch and the Thrift Savings Plan website– Asset Composition
• Funds in the Sample– 1,645 currently active funds defined by Morningstar as Life Cycle Funds– Funds asset sizes range from less than $1 mil to $16.8 bil; mean size is
$493 mil, median size is $25 mil– Fraction of each fund in stocks ranges from 0% to 97% (median 68%) and
net fraction in cash ranges from -107% to 38% (median 5%)
*Deloitte FAS assumes that such information and data are reliable. We have observed, however, in a small number of cases differences between these data and data reported by other commonly used sources.

7Copyright © 2009 Deloitte Development LLC. All rights reserved.
Efficient Frontier
• Optimal allocations should be along the mean-variance frontier, which contains diversified portfolios of risky assets
Standard Deviation (Risk)
Expe
cted
Ret
urn
Individual securities (or funds)
Efficient frontier
Mean-Variance Efficient FrontierVolatility
Return

8Copyright © 2009 Deloitte Development LLC. All rights reserved.
Methodology
• Returns are historical annualized daily returns over N years, from day t=1 until day t=T;
• Volatility is the historical annualized standard deviation in the daily percentage change in returns;
1)1()( −= N
priceTpricereturn
NTiprice
ipriceipriceStdDevvolatilityTi
/)1(
)1()(,...,1
×
−
−−=
=

Primary Findings

10Copyright © 2009 Deloitte Development LLC. All rights reserved.
Volatility/Return within a Family of Funds
• Before 2008, return and volatility within a family increased with the target date– Appear to be along an Efficient Frontier
Volatility and return in 2005-2007 for a single family, single class of funds
2010
2020
20302040
0.00
0.02
0.04
0.06
0.08
0.10
3-Y
ear R
etur
n
0 .02 .04 .06 .08 .1 .123-Year Volatility

11Copyright © 2009 Deloitte Development LLC. All rights reserved.
Volatility/Return Across Funds
• While fund managers differed in target investments and returns, the patterns were largely similar
Volatility and return in 2005-2007 for various fund families (investor class)
0.00
0.02
0.04
0.06
0.08
0.10
3-Y
ear R
etur
n
0 .02 .04 .06 .08 .1 .123-Year Volatility

12Copyright © 2009 Deloitte Development LLC. All rights reserved.
Investor Classes Differ Mostly in Returns
• Within fund families, investor classes vary in fees and thus returns, not in volatility
Volatility and return in 2005-2007 for various investor classes (single fund family)
0.00
0.02
0.04
0.06
0.08
0.10
3-Y
ear R
etur
n
0 .02 .04 .06 .08 .1 .123-Year Volatility

13Copyright © 2009 Deloitte Development LLC. All rights reserved.
Crash Reduced Returns, Upped Volatility
• The market crash that started in 2008 increased volatility and lowered returns
Volatility and return in 2005-07 vs. 2006-08 (single fund family, single investor class)
2010
202020302040
2010
2020
20302040
2005-2007
2006-2008
-0.10
-0.05
0.00
0.05
0.10
3-Y
ear R
etur
n
0 .05 .1 .15 .2 .25 .33-Year Volatility

14Copyright © 2009 Deloitte Development LLC. All rights reserved.
1-Year Differences Were Even Larger
• 1-year volatility generally higher than 3-year volatility; 1-year returns lower than 3-year returns
Volatility and return in 2007 vs. 2008(single fund family, single investor class)
2007
2008
-0.50
-0.40
-0.30
-0.20
-0.10
0.00
0.10
1-Y
ear R
etur
n
0 .1 .2 .3 .4 .51-Year Volatility

2010 Funds: A First Look

16Copyright © 2009 Deloitte Development LLC. All rights reserved.
2010 Funds Varied in Volatility and Returns
• Target date funds, even with the same target year, are heterogeneous in volatility/return profiles
Volatility and return in 2008 for funds with target date 2010(many fund families, single investor class)
TSPLifecycle 2010
-0.40
-0.30
-0.20
-0.10
0.00
0.10
1-Y
ear R
etur
n
0 .1 .2 .3 .41-Year Volatility

17Copyright © 2009 Deloitte Development LLC. All rights reserved.
Returns Dropped, Differences Widened
• As may have been expected, funds with target date 2010 had lower average returns in 2008 than in 2007, and fund return differences widened
Distribution of rates of return in 2007 vs 2008 among funds with target date 2010 (many fund families, single class)
2007returns
2008returns
Den
sity
-.5 -.4 -.3 -.2 -.1 0 .1 .2
Rate of Return

18Copyright © 2009 Deloitte Development LLC. All rights reserved.
Volatility Rose In Many Funds
• Funds with target date 2010 varied in 2007 volatility; appeared more volatile in last 12 months
Distribution of volatility in 2007 vs 2008 among funds with target date 2010 (many fund families, single class)
2007volatility
2008volatility
Den
sity
0 .1 .2 .3 .4Volatility

19Copyright © 2009 Deloitte Development LLC. All rights reserved.
Heterogeneity in Small and Large Funds
• Small 2010 funds are more heterogeneous in rates of return than large funds
Distribution of rates of return in 2008 among funds with target date 2010, weighted/unweighted by asset size(many fund families, single class)
Unweighted
Weighted
Den
sity
-.5 -.4 -.3 -.2 -.1 0 .1 .2 .3
Rate of Return

20Copyright © 2009 Deloitte Development LLC. All rights reserved.
Heterogeneity in Small and Large Funds
• Small 2010 funds are more heterogeneous in volatility than large funds
Distribution of volatility in 2008 among funds with target date 2010, weighted/unweighted by asset size(many fund families, single class)
Unweighted
Weighted
Den
sity
0 .1 .2 .3 .4Volatility

21Copyright © 2009 Deloitte Development LLC. All rights reserved.
Volatility is Related to Equity Exposure
• Volatility among 2010 funds correlates with fraction of funds invested in stocks
Current equity exposure vs volatility in 2008 among funds with target date 2010, (many fund families, single class)
0.0
0.2
0.4
0.6
0.8
Frac
tion
inve
sted
in s
tock
s
0 .1 .2 .3 .4Volatility

2010 Funds: A Closer Look

23Copyright © 2009 Deloitte Development LLC. All rights reserved.
Objectives
• Investigate variability in the 2008 performance of 2010 funds– Compare ‘08 performance of 2010 fund with other TDFs
in the fund family – Compare fund families’ performance in ‘08 with that in
‘06, ‘07 and ‘09
• Link between fund performance and fund philosophy– Examine the glide paths (asset composition over different
target dates) of fund families

24Copyright © 2009 Deloitte Development LLC. All rights reserved.
Methodology
• Illustrative sample selection– A case study of 2010 funds that performed well,
intermediately, and poorly in ’08, and other members of their families
– Within-family investor classes with relatively low expense ratios
• Time-period selection– One-year results for ‘06, ’07, ‘08 and partial year ‘09
(through 10/9/09)– Funds established during a year are excluded from the
results for that year

25Copyright © 2009 Deloitte Development LLC. All rights reserved.
Funds* in the Case StudyAlliance Bernstein 2010 Retirement Strategy I
Seek the highest total return over time consistent with its asset mix (which emphasizes capital preservation and income for periods nearer to and after retirement).
American Century Target Maturity 2010 Inv**Seek the highest return consistent with investment in U.S. Treasury securities.
DWS Target 2010***Provide a guaranteed return of investment to investors who reinvest all dividends and hold their shares to the Maturity Date and to provide long-term growth of capital.
Fidelity Advisor Freedom 2010 ISeek high total return with a secondary objective of principal preservation.
Oppenheimer Transition 2010 YSeek total return until the target retirement date and then seeks income and secondary capital growth.
Vanguard Target Retirement 2010Seek high total return with a secondary objective of principal preservation as the fund approaches its target date and beyond.
Thrift Savings Plan L 2010 FundProvide the highest possible rate of return for the amount of risk taken.
*Where applicable the case study includes some or all of 2000 (a.k.a. "Income" or "Retirement"), 2010, 2020, 2030, 2040 & 2050 Target Date Funds. Off-decade funds are excluded. Fund descriptions are based on their prospectuses.**For this family only a 2010 and 2020 fund are available.***Other target dates are from the DWS LifeCompass fund family.

26Copyright © 2009 Deloitte Development LLC. All rights reserved.
AC
F
D
T
AB
O
V
-0.40
-0.30
-0.20
-0.10
0.00
0.10
One
-yea
r ret
urn
in 2
008
0.00 0.10 0.20 0.30One-year volatility in 2008
Variability in Performance of 2010 Funds in ‘08Graph depicts a universe of 32 Target Date Funds
Better in ‘08: American Century and DWS
Intermediate in ‘08: Thrift Savings Plan, Vanguard and Fidelity
Worse in ‘08: Alliance Bernstein and Oppenheimer

27Copyright © 2009 Deloitte Development LLC. All rights reserved.
Summary of the Seven Highlighted 2010 TDFs
Alliance Bernstein
2010 Retirement
Str I
American Century
Target Mat 2010 Inv
DWS Target 2010
Fidelity Advisor
Freedom 2010 I
Oppenheimer Transition
2010 Y
Vanguard Target
Retirement 2010
Thrift Savings Plan L 2010
Fund
2009 Return 0.265 0.003 0.017 0.228 0.204 0.166 0.085
Volatility 0.186 0.012 0.027 0.150 0.182 0.137 0.074
2008 Return -0.326 0.111 -0.036 -0.264 -0.412 -0.206 -0.105
Volatility 0.275 0.054 0.061 0.207 0.302 0.210 0.126
2007 Return 0.058 0.144 0.058 0.076 0.072 0.077 0.064
Volatility 0.115 0.061 0.039 0.077 0.113 0.085 0.059
2006 Return 0.085 0.043 0.095 0.111
Volatility 0.059 0.038 0.056 0.049
Asset composition (%)
Equities 62.43 0.00 9.15 49.23 63.65 53.65 30.00
Bonds 30.91 100.00 90.84 31.26 39.33 43.74 70.00
Cash -0.03 0.00 0.01 14.25 3.34 0.64 0.00
Other 6.25 0.00 0.00 5.26 -6.24 2.03 0.00

28Copyright © 2009 Deloitte Development LLC. All rights reserved.
Volatility/Return Profile: 2010 Funds in ‘06, ‘07, ‘08 & ’09
Profiles negatively correlated in ’08 and positively correlated in ’09 (YTD)
‘06 and ‘07 profiles have modest positive correlations, and much more narrow ranges of volatility and return
'06
'06
'06'06
'07
'07
'07'07 '07'07'07
'08
'08
'08
'08
'08
'08
'08
'09
'09 '09
'09'09
'09
'09
-0.40
-0.30
-0.20
-0.10
0.00
0.10
0.20
0.30
One
-yea
r ret
urn
0.00 0.05 0.10 0.15 0.20 0.25 0.30 0.35One-year volatility

29Copyright © 2009 Deloitte Development LLC. All rights reserved.
Volatility/Return Profiles in 2006, ‘07, ‘08 & ‘09
AB
AB
ABAB
AB
AC
AC
D
D
D
D
F
F
F
FF
V
T
T
T
T
T
0.00
0.05
0.10
0.15
0.20
One
-yea
r ret
urn
in 2
006
0.00 0.05 0.10 0.15 0.20One-year volatility in 2006
AB ABAB
ABAB
AC
AC
DD
D D
F
FF
F F F
O
O
O
VV V V VV
TT
T T T
0.00
0.05
0.10
0.15
0.20
One
-yea
r ret
urn
in 2
007
0.00 0.05 0.10 0.15 0.20One-year volatility in 2007
AB
AB
ABABABAB
ACAC
D
D
D
D D
F
F
F
FF
FOO O
V
V
V
VVV
T
T
T
T
T
-0.40
-0.30
-0.20
-0.10
0.00
0.10
0.20
One
-yea
r ret
urn
in 2
008
0.00 0.05 0.10 0.15 0.20 0.25 0.30 0.35 0.40One-year volatility in 2008
AB
ABAB ABAB
AB
AC
AC
D
D
D
D D
F
F
FF
F F
O
O
O
OO
V
V
V
VVV
TT
T
TT
-0.05
0.00
0.05
0.10
0.15
0.20
0.25
0.30
0.35
0.40
Parti
al a
nnua
l ret
urn
in 2
009
0.00 0.05 0.10 0.15 0.20 0.25 0.30Partial annual volatility in 2009
Equity Exposure

31Copyright © 2009 Deloitte Development LLC. All rights reserved.
2000-2050 Glide Paths for the Fund FamiliesEquity shares in 2010 funds range from 0% to 64%
“Income” or “Retirement” funds listed as 2000 funds
American Century funds fully in U.S. Treasury bonds
DWS Target 2010 fund separate from DWS LifeCompass fund family for other target years
AC
D
AB
O
T
FV
0
20
40
60
80
100
Per
cent
age
of A
sset
s in
Equ
ities
2000 2010 2020 2030 2040 2050Target Year

32Copyright © 2009 Deloitte Development LLC. All rights reserved.
Alliance BernsteinAmerican CenturyDWSFidelityOppenheimerThrift SavingsVanguard
Annual Returns by Equity Exposure 2006
-0.1
0.0
0.1
0.2
0.3
0.4
2006
Ret
urn
0 .2 .4 .6 .8 1Equity Exposure
2007
-0.1
0.0
0.1
0.2
0.3
0.4
2007
Ret
urn
0 .2 .4 .6 .8 1Equity Exposure
2009
-0.1
0.0
0.1
0.2
0.3
0.420
09 R
etur
n
0 .2 .4 .6 .8 1Equity Exposure
2008NOTE Different scale
-0.5
-0.4
-0.3
-0.2
-0.1
0.0
0.1
0.2
0.3
2008
Ret
urn
0 .2 .4 .6 .8 1Equity Exposure
33Copyright © 2009 Deloitte Development LLC. All rights reserved.
Alliance BernsteinAmerican CenturyDWSFidelityOppenheimerThrift SavingsVanguard
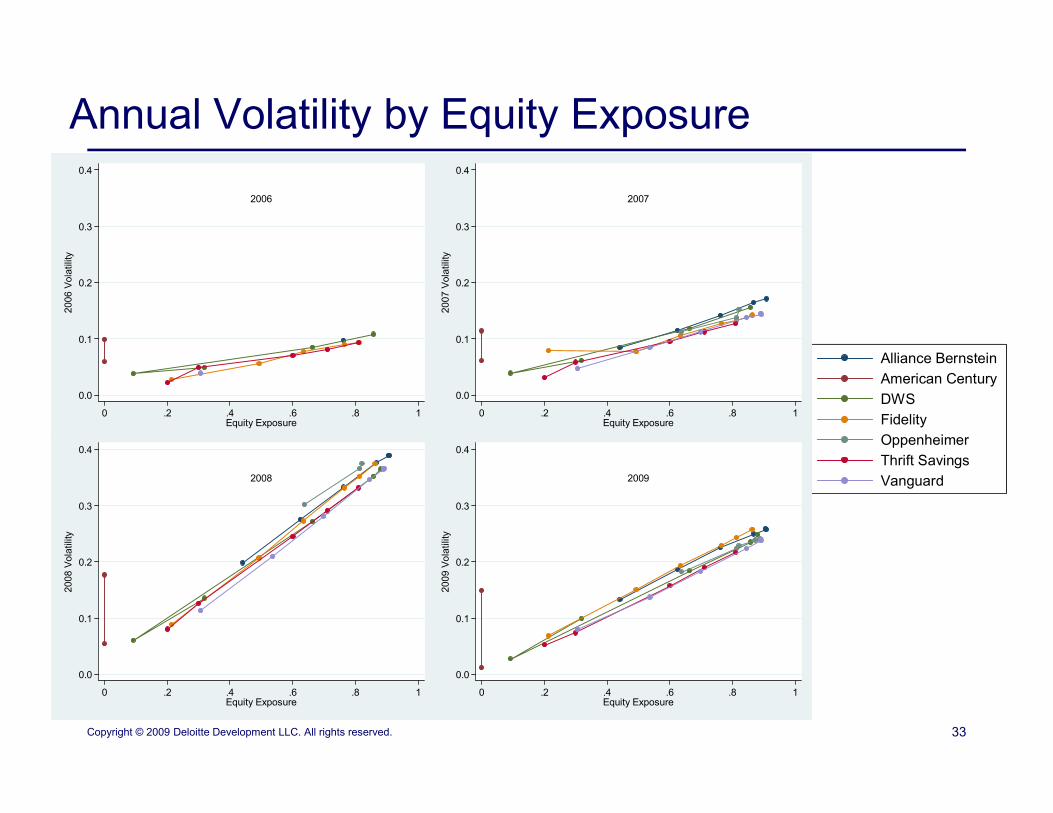
Annual Volatility by Equity Exposure
2006
0.0
0.1
0.2
0.3
0.4
2006
Vol
atili
ty
0 .2 .4 .6 .8 1Equity Exposure
2007
0.0
0.1
0.2
0.3
0.4
2007
Vol
atili
ty
0 .2 .4 .6 .8 1Equity Exposure
2008
0.0
0.1
0.2
0.3
0.4
2008
Vol
atili
ty
0 .2 .4 .6 .8 1Equity Exposure
2009
0.0
0.1
0.2
0.3
0.420
09 V
olat
ility
0 .2 .4 .6 .8 1Equity Exposure

34Copyright © 2009 Deloitte Development LLC. All rights reserved.
DisclaimerThe views, opinions, and/or findings contained in this report are those of the authors and should not be construed as an official Government position, policy or decision, unless so designated by other documentation.
These presentation slides were accompanied by discussion from the preparers, which was an integral part of this report. Such discussion has not been provided herein and may have influenced a readers’ understanding of these slides.
Work for this report was performed in accordance with the Statement on Standards for Consulting Services issued by the American Institute of Certified Public Accountants (“AICPA”). Our services were provided under contract DOLJ08327415from the U.S. Department of Labor.
This document contains general information only. Deloitte Financial Advisory Services LLP (“Deloitte FAS”) and Advance Analytical Consulting Group Inc. (“AACG”) are not, by means of this document, rendering business, financial, investment, or other professional advice or services. This document is not a substitute for such professional advice or services, nor should it be used as a basis for any decision or action. Before making any decision or taking any action, a qualified professional advisor should be consulted. Deloitte FAS, its affiliates, or related entities and AACG shall not be responsible for any loss sustained by any person who relies on this publication.
Michael J. Brien, PhDDeloitte Financial Advisory Services LLPTel.: +1 202 378 5096E-mail: [email protected]
Constantijn W.A. Panis, PhDAdvanced Analytical Consulting Group IncTel.: +1 310 866 2650E-mail: [email protected]
For more information please contact:
About Deloitte
As used in this document, "Deloitte" means Deloitte Financial Advisory Services LLP, a subsidiary of Deloitte LLP. Deloitte Financial Advisory Services LLP advises clients on managing business controversy and conflict, executing deals, and maintaining regulatory compliance. Please see www.deloitte.com/us/about for a detailed description of the legal structure of Deloitte LLP and its subsidiaries.
About Advanced Analytical Consulting Group Inc
Advanced Analytical Consulting Group Inc (AACG) provides economic, statistical, and computing consulting for business decisions and litigation. We provide expert testimony, support for academic experts, and advice and assistance identifying the right expert from academic and business settings. AACG Economic Consulting assists business clients with strategic and operational consulting based on in-depth quantitative analysis of corporate data and the client's position in the market.
For more information visit www.aacg.com.
Copyright © 2009 Deloitte Development LLC. All rights reserved.