sustainable vegetable farming systems: 1998-2000
TRANSCRIPT

Sustainable vegetable farming systems:
1998-2000
A Wells Horticultural Research and Advisory Station, Gosford
Project Number: VG98046

VG98046
This report is published by Horticulture Australia Ltd to pass on information concerning horticultural research and development undertaken for the vegetable industry.
The research contained in this report was funded by Horticulture Australia Ltd with the financial support of the vegetable industries.
All expressions of opinion are not to be regarded as expressing the opinion of Horticulture Australia Ltd or any authority of the Australian Government.
The Company and the Australian Government accept no responsibility for any of the opinions or the accuracy of the information contained in this report and readers should rely upon their own enquiries in making decisions concerning their own interests.
ISBN 0 7341 0327 1
Published and distributed by:
Horticultural Australia Ltd
Level 1 50 Carrington Street Sydney NSW 2000 Telephone: (02) 8295 2300 Fax: (02) 8295 2399
E-Mail: [email protected]
© Copyright 2001 Horticulture Australia

HORTICULTURAL RESEARCH & DEVELOPMENTT CORPORATION
• - ^ i t . ^U -«M^-*J^ ]K^*»**4i
FINAL REPORT
"Sustainable vegetable farming systems: 1998-2000"
VG98046
July 1998 to June 2000
A.T. Wells, Horticultural Research and Advisory Station, Gosford (02-43481900)
=8M i NSW Agriculture

Acknowledgments Wayne Pitt and John Heckenberg are the heart and soul of the Sustainable-Vegetable-Farming-Systems experiment. They set-up the experiment in late 1991 and they are still there, working consistently and wisely, being both farmers and scientists. Long-term experiments are impossible without long-term, committed support.
Grant Davidson, the foreman at the Somersby Research Station, and all the Somersby farm staff (Robert Lawlor, Dennis Hawkins, Phil Courtney and Greg Blakemore), have backed us up during the many busy and difficult times.
The Agricultural Resource Management and Horticulture Programs of NSW Agriculture have also granted long-term support, against the tide of short-term pressures.
The experiment was the brainchild of Professor Peter Cornish. He secured the initial funding and broad support for the project. He, Jim Murison and George Kuczera were responsible for the innovative "systems" experimental design. Yin Chan has been the driving force behind measuring soil effects of the farming systems. His guidance and encouragement, and the many days he spent either in the field or laboratory, have been crucial to the success of the experiment.
The Land and Water Resources Research and Development Corporation gave us generous funding from the start of the experiment until 1997. Their faith in the experiment during the early, slow, years is gratefully acknowledged.
The Horticultural Research and Development Corporation have provided funding since 1997. The research team are grateful for this support, realising the difficulties involved in putting scarce vegetable industry levies into long-term, sustainability research when there are so many shorter-term, production demands. In particular, we thank Leigh Sparrow and Jonathan Eccles for their support and guidance.
Any recommendations contained in this publication do not necessarily represent current HRDC policy. No person should act on the basis of the contents of this publication, whether as to matters of fact or opinion or other content, without first obtaining specific, independent professional advice in respect of the matters set out in the publication.
ii

Table of Contents 1 MEDIA SUMMARY 2
2 TECHNICAL SUMMARY 3
3 INTRODUCTION 4
3.1 PROJECT OBJECTIVES 5
4 MATERIALS AND METHODS 5
4.1 TREATMENTS AND EXPERIMENTAL DESIGN 5
4.1.1 Systems approach 5 4.1.2 System descriptions 5 4.1.3 Site and soil 6 4.1.4 Plot layout 6
4.2 MEASUREMENTS 7 4.3 CROP SEQUENCES 7 4.4 CROP AND SOIL MANAGEMENT 8
4.4.1 Cabbage crop and oat-lupin cover crop: June to December 1998 8 4.4.2 Capsicum crop: Jan to Jun 1998 9 4.4.3 Annual rye and vetch cover crop and fallow: Jun to Oct 1999 9 4.4.4 Sweet corn crop: Oct 1999 to Feb 2000 9 4.4.5 Cabbage crop: Apr to Sep 2000 10
4.5 FERTILISER MANAGEMENT 10
5 RESULTS 12
5.1 CROP YIELDS 12 5.2 CROP GROWTH 13
5.3 PROFITABILITY 14
5.4 SOIL RESULTS 16 5.4.1 Organic carbon 16 5.4.2 Soil phosphorus 17
5.5 RUNOFF RESULTS 18
6 A MODEL OF THE TRADE-OFF BETWEEN PRODUCTION AND ENVIRONMENTAL OBJECTIVES 19
6.1 THE TRADE-OFF SITUATION 20
6.2 LONGER-TERM EFFECTS 21
6.3 THE EFFECT OF OTHER SOILS TYPES 21
7 DISCUSSION 21
7.1 BALANCING PRODUCTION AND ENVIRONMENTAL OBJECTIVES 21
7.2 ECONOMIC IMPEDIMENTS TO SUSTAINABILITY 22
7.3 HOW APPLICABLE ARE THE RESULTS TO OTHER SOIL TYPES? 2 3
7.4 SWEET CORN—AN ECONOMIC COVER CROP 23 7.5 SOIL PHOSPHORUS 23 7.6 SOIL TILLAGE ISSUES 24
8 RECOMMENDATIONS 25

1 Media Summary Learning how to grow vegetable crops sustainably and profitably is the major aim of the "Sustainable Vegetable Farming Systems" experiment. NSW Agriculture has been conducting the experiment since 1992, comparing the productivity and environmental impact of five different approaches to commercial vegetable growing. The project has been supported by the Horticultural Research and Development Corporation.
The experiment is situated on the Horticultural Research Station at Somersby, 85 km north of Sydney. This is part of the Central Coast Plateau, a fruit and vegetable production area for over 60 years. The area's sandy, permeable soils and high rainfall provide a fragile environment for intensive horticulture, with the potential for serious soil erosion and nutrient losses to aquatic ecosystems.
The research team have tested two broad approaches to finding a balance between productivity and environmental impact: one, to continue using largely conventional methods but with reduced fertiliser inputs and reduced tillage; or two, to use more natural-biological methods that focus on building long-term soil health and fertility.
The experiment's conventional high-input approach had the highest soil erosion and nutrient runoff rates (7.8 tonnes soil/ha/year and 24.5 kg/ha/year of both nitrogen and phosphorus). These results were similar to recent measurements made by the University of Western Sydney on commercial vegetable farms with clay soils. The performance of the lower-input conventional systems was a substantial improvement with soil and nutrient losses ranging from one-tenth to one-half of the levels of the high-input system. However, the biological systems had the lowest losses, they ranged from two-hundredths to one-sixth of the high-input system's losses.
Unfortunately there was a trade-off between productivity and environmental impact: the biological systems and one of the more conventional systems had lower yields than the high-input system. The difference in yields reflects, to some extent, the greater challenges of managing lower-input systems. Yields should increase as our understanding of these systems improves. However, it is likely that high-input approaches will often produce higher yields, in the short to medium term at least.
Lower yields were a major disadvantage because the prevailing low market prices for vegetables strongly favoured the high yielding systems. Higher prices for the produce from the lower-input systems would have been needed to make the systems attractive to growers. This suggests that markets that value sustainability are necessary for widespread adoption of lower-input vegetable farming systems. Such markets would reward growers for using sustainable practices. They would compensate growers for the risk of obtaining lower and more variable yields while they improve the long-term prospects of their soils and the environment.
2

2 Technical Summary There is widespread recognition of the need to develop new approaches to commercial vegetable production that can preserve long-term productivity, reduce negative environmental effects and remain profitable. The "Sustainable Vegetable Farming Systems" experiment (HRDC project VG98046) contributes to these objectives by building an understanding of how whole vegetable production systems work. The experiment has been comparing the productivity and environmental impact of five different approaches to commercial vegetable growing since 1992.
The experiment is located at the Somersby section of NSW Agriculture's Horticultural Research Station at Somersby, 85 km north of Sydney. The sandy, permeable (yellow-earth) soil at the experimental site is representative of the surrounding fruit and vegetable growing area on the cental coast plateau. The poorly structured and buffered soil, in combination with the area's high rainfall, provide a fragile environment for intensive horticulture. The potential for serious soil erosion and nutrient losses to aquatic ecosystems is high.
The vegetable farming systems included in the experiment represent farms on which different approaches to management are practiced. The systems are replicated in three randomised blocks. The size of the individual plots range from 0.1 ha, on the runoff monitoring block, to 0.03 ha on the other two blocks. The systems are: Q ConvHI - conventional, high inputs, frequent tillage, no cover cropping; Q ConvLO - conventional, lower inputs, reduced tillage, occasional cover crops; • Organic - adhering to organic standards, reduced tillage, frequent cover crops; Q Objective - scientific/technological, fertigation, minimum tillage, plastic mulch, occasional cover crops; • Integrated - adaptable combination of Organic and Objective approaches, organic fertilisers + fertigation,
minimum tillage, frequent cover crops.
It is useful to consider the systems as representing different levels of 'forcing' toward higher productivity. The Organic and Integrated systems represent low levels of forcing, the Objective and ConvLO systems represent successively higher levels and the ConvHI system represents a high level of forcing. The ConvHI level of forcing is comparable to that on many vegetable farms in the Sydney region.
The ConvHI system experienced the worst environmental/sustainability problems. Soil erosion on the ConvHI was 7.8 T/ha/year compared with 3.5, 2.0, 0.7 and 0.3 on the ConvLO, Objective, Organic and Integrated systems respectively. Phosphorus runoff from the ConvHI was 24.5 kg/ha/year compared with 7.9, 2.8 0.6 and 1.7 from the other systems (in the same order). Nitrogen runoff from the ConvHI was also 24.5 kg/ha/year compared with 10.1, 6.9, 1.7 and 3.7 from the other systems. The two conventional systems generally produced the highest yields of marketable vegetables while the other systems generally produced smaller and more variable yields. It appeared that the higher levels of forcing (higher fertiliser inputs, more tillage, etc.) on the conventional systems was better able to over-ride the limitations caused by variations in soil quality.
The results can be summarised in the following way. At low levels of forcing, a small increase (such as a small increase in nutrient inputs) caused a large yield response with a negligible increase in soil/nutrient loss. At moderate levels of forcing, yield response had levelled out but soil/nutrient loss had risen steadily, to be 5 to 10-fold higher than at the low level of forcing. A small increase or decrease in forcing at this point would have very little effect on yield but a marked effect on soil/nutrient loss. At high levels of forcing there was no further increase in yield but soil/nutrient loss was another 2 to 3-fold higher (up to 30-fold higher than the losses at low levels of forcing). A small increase or decrease in forcing at this point would cause a large response in soil/nutrient loss but negligible effect on yield.
It is argued in the report that to maintain soil and nutrient losses at low levels (necessary for long-term sustainability), the level of forcing would need to be below that which maximised yield. Experience with the experiment has shown that operating successfully at lower levels of forcing required good management and planning skills and knowledge of system processes. A further challenge for growers who choose to use low-input, sustainable practices was that low prices for vegetables favoured the higher yielding, high-forcing systems. The lower yielding systems generally required higher market prices to financially break-even and were therefore less likely to survive. This economic pressure acts against growers using practices that incur a significant short-term cost but produce largely long-term (and public) benefits. Importing organic matter, such as compost, to soils and growing cover crops are examples of such practices. The experiment has demonstrated that these practices can strongly reduce erosion and nutrient losses. Yet the short-term production benefits have been subtle in comparison to the effects of mineral fertilisers and pesticides. It follows that markets that support sustainable farming practices are needed. Markets that will provide growers with the returns needed to cope with the risk of obtaining lower and more variable yields. Growers may need to adopt Environmental Management Systems to demonstrate their sustainable practices to these markets.
Finally, there is still much to be leant about how to farm vegetables more effectively using low-input and environmentally responsible approaches. It may be vital for the future of Australia's vegetable industries to continue conducting research into this area.
3

3 Introduction Many growers, scientists and sections of the community recognise a need to develop vegetable production systems that can preserve long-term productivity, minimise negative environmental impacts and remain profitable. Conventional vegetable farming often involves repeated soil disturbance, frequent exposure of soil to the elements and excessive use of fertilisers, pesticides and irrigation water. These practices can result in severe damage to soil structure, soil erosion, reduced soil fertility and the loss of fertilisers and other chemicals from increased runoff and leaching (Hollinger et al. 1998). These effects reduce productivity and profitability due to degradation of the soil resource and can cause off-site environmental damage. The long-term viability of the vegetable industry is at stake, as is Australia's reputation as a producer of 'clean and green' agricultural produce.
Yet developing sustainable vegetable farming systems is not easy. Like all ecosystems they are complex and can be unpredictable. Interactions between the components of the system (such as soil, crops, climate) and management practices (such as tillage, rotations, nutrient and water inputs, crop protection and harvesting), can produce unexpected outcomes, particularly in the longer term.
There is a critical need to gain a better understanding of how whole production systems operate and behave under different approaches to management. This is the aim of the 'Sustainable Vegetable Farming Systems' experiment.
The experiment began in 1992 and is now in its ninth year. It started during a period of intense political and community concern over chronic blue-green algae blooms in the Hawkesbury-Nepean river and other water bodies around Australia. The primary objective of the experiment, at that time, was to measure the loads of phosphorus, nitrogen and eroded soil that intensive vegetable production systems are likely to contribute to waterways. Developing productive and profitable vegetable production systems, with demonstrably better environmental performance, was an equally important aim (Cornish, 1992). Yet, as the experiment has matured, this second aim has become the major focus.
The work of measuring pollution loads from vegetable farming systems is well advanced. There is now a large volume of data on nutrient and sediment runoff, both from this experiment (on sandy soil) and from on-farm studies (on alluvial and duplex soils) in western Sydney (Cornish, 1997; and the current HRDC project VG98044). The greater challenge is to learn how to improve the situation.
We already know that certain practices can improve the sustainability of agricultural production systems. These include reduced tillage, organic matter additions to soil, cover cropping and careful use of fertilisers and pesticides. However, we have little understanding of how much difference these practices make and how they effect each other. They all entail considerable challenges to growers in adapting them to their farms, with the risk of increased costs, production problems and reduced profitability. That is why it is important to understand what the potential benefits and costs of different approaches are. Then growers can make more informed decisions about how to go about growing vegetables sustainably.
This final report on the 'Sustainable Vegetable Farming Systems' experiment, VG98046, covers the period from July 1998 to June 2000. It follows the final report for the Horticultural Research and Development Corporation (HRDC) from the previous funding period: 1997-98 (Wells, 1998). The period from 1992 to 1997 has been reported in a final report to the Land and Water Resources Research and Development Corporation (Wells and Chan, 1997). Details of how soil properties have changed in response to the different management approaches can be found in Wells et al. (2000).
4

3.1 Project Objectives The experiment has been in a holding-phase during this funding period. The management of the systems has continued but a smaller amount of monitoring has taken place than in the earlier period of the experiment. Monitoring during the present period has focussed on crop performance with less attention paid to soil and environmental effects.
Thus, our primary objective, over this period, has been to monitor the productivity and profitability of the vegetable farming systems. But the holding phase has also allowed time to analyse and reflect on the results collected over the whole life of the experiment.
4 Materials and Methods The "Sustainable Vegetable Farming Systems" experiment is a replicated field experiment. It is also a systems experiment rather than a factorial experiment. Whole vegetable farming systems, that reflect different management goals, are the experimental treatments being compared. Thus the treatments differ from each other in their general approach rather than strictly on technical details.
4.1 Treatments and Experimental Design
4.1.1 Systems approach The essence of the systems approach is to gather data about as many aspects of the vegetable farming systems as possible. Then we fit all these pieces of information together into a broad picture. We sacrifice some detail to see how the whole system is operating. This approach has often led to insights that are more relevant to growers than is possible with a factorial approach. One reason for this is that the systems approach has allowed us to investigate a large number of issues at the same time. Instead of the reductionist thinking that is encouraged by factorial experiments, we have been forced to think about the management of each treatment in an integrated way, and to adapt to changing circumstances - similar to the way farmers need to think.
To make this approach rigorous we defined blueprints which set out the goals and values that determined the management approach of each treatment. These blueprints were determined from surveys of vegetable growers (Murison, 1995) and through focus group work (unpublished). Each decision made about the management of a system has had to comply with the goals and values of that system. In a more practical sense, however, the goals and values were transformed into a set of management practices that were typical for each system. Having defined the goals and values in the first place was enormously useful though, and they were often essential in making more complex decisions.
4.1.2 System descriptions The names of some of the systems have been changed in this report from what they were named in previous reports and papers. This was done to make the names more descriptive and meaningful to a wider audience. Hopefully this will improve the readability of the report. The old and new system names are:
• 'District Practice' has become 'ConvHI'; • 'Agfact' has become 'ConvLO'; • 'Objective' remains 'Objective'; • 'Organic' remains 'Organic'; • 'Evolving' has become 'Integrated'.
5

ConvHI: This is a conventional high-input system that aims to maximise short-term profit. The investment made in each crop is rigorously protected; technology is used to fix problems and pest, weed and disease free crops are highly valued. These goals and values often lead to excessive use of fertilisers, pesticides, irrigation, soil tillage and little use of beneficial crop rotations. These practices are used to ensure large yields of well-sized, unblemished produce. Such produce receives the best market prices.
ConvLO: This is a conventional lower input system. It has similar goals and values to the ConvHI system but its management is influenced by advice available from departments of agriculture and similar sources of information about proven technology. An important aim is to make more efficient use of inputs and therefore reduce costs. For example, drip irrigation is used rather than spray irrigation and fertiliser rates are based on the results of trials.
Objective: This is a scientifically managed system. It aims to balance productivity and environmental impacts, making maximum use of objective management tools. Optimal inputs are applied to gain high outputs but the maintenance or improvement of measurable aspects of soil health is a key objective. Technology such as irrigation scheduling, fertigation and plastic mulches are used to reduce environmental risks while maintaining high productivity.
Organic: This system adheres to organic production standards (National Association for Sustainable Agriculture Australia Ltd, 1998). It aims to produce healthy, wholesome food and to make an acceptable living. Natural process are utilised as much as possible, external inputs are minimised and the improvement of all aspects of soil health is a key objective.
Integrated: This system has goals and values that are an integration of the Objective and Organic systems'. It aims to optimise profit with minimum environmental impact; to rely on biological processes as much as possible but use technology such as herbicides and synthetic fertilisers when benefits appear to exceed costs.
Tables 3 and 4 in the Appendix give further details about the management practices applied to each system.
4.1.3 Site and soil The experiment is located on the Somersby section of the Gosford Horticultural Research and Advisory Station, 85 km north of Sydney (lat: 33° 23' S, long: 151° 21' E), New South Wales, Australia. The annual rainfall is approximately 1300 mm and the average maximum and minimum temperatures are 25.6°C and 16.2°C in January and 16.8°C and 6.8°C in July. The site is at an elevation of 250 m above mean sea level on the Central Coast Plateau. The soil is a yellow earth (Luvic Ferrasol) described in detail by McKenzie et al., (1997). The 0 to 10 cm layer has approximately 15% clay, 8% silt, 55% fine sand and 22% coarse sand. The 70 to 80 cm layer has 23% clay, 9% silt, 42% fine sand and 27% coarse sand. The site was cleared 60 years ago and has been predominantly used to grow vegetables and citrus.
4.1.4 Plot layout The experiment has a randomised block design. There were originally four replications of each system which were randomly assigned to four blocks. However, block III was abandoned in early 1997 due to non-uniformity between the plots: two of the plots had springs on them which caused severe waterlogging following prolonged rainfall. The blocks are not in one continuous area on the research station because there was not a large enough single area to accommodate all the plots. However, the longest distance between blocks is only 80 metres. The blocks occupy different topographical positions, with the soil depth (to the ironstone layer) varying from at least one metre on block IV (on the lowest part of the slope) to only 50 cm in some places on the other three (up-slope) blocks.
6

All plots were originally 40 m x 20 m (12 beds at 1.7 m between centres and 40 m long), giving a total area of over 1.5 ha of vegetables. However, the project team found that it was not possible to manage this area of intensive vegetable production and also do good quality scientific measurements. Consequently the plots on blocks I and II were reduced to approximately 40 m x 7 m (4 beds) but the block IV plots remained full size as they were being used to monitor runoff. The slope of the of all the plots is approximately 5% or -3°.
4.2 Measurements The productivity of the farming systems was measured in three ways: (1) marketable yield; (2) total dry-matter production at maturity; and (3) leaf area index (LAI) at maturity. LAI is the area of crop leaves divided by the area of cropped land. An LAI of 3 or greater is widely recognised to provide complete soil coverage.
Marketable yield was measured by harvesting and selling produce at either Flemington Markets in Sydney or locally on the New South Wales Central Coast. Thus we gained direct feedback on the market acceptability of the produce. Dry-matter production was measured by randomly selecting whole plants, drying them at 70°C for three to five days and weighing the dried samples. LAI was measured by passing a sub-sample of fresh leaves (excluding petioles) through a leaf area meter.
Profitability was measured via gross margin analysis followed the general method used in the Farm Budget Handbook for NSW Vegetable Crops (NSW Agriculture, 1996). The following costs were included: all inventory items (fertilisers, pesticides, seedlings, etc); machinery costs, marketing costs (packaging, cartage and agent's fees) and the R&D levy. However irrigation and labour costs were not included as they were considered to be to too specific and to vary greatly on individual farms. Gross margins were calculated over a representative range of market prices to provide a more general picture of the economic performance of the farming systems.
The materials and methods used to measure runoff, erosion and nutrient losses have been detailed in a previous report on the experiment (Wells & Chan, 1997).
4.3 Crop sequences As often as possible we planted the same crops at the same time on all the systems to allow for direct comparisons. However, at times the different management goals of the systems lead to different crop rotations.
Over the last three years (which includes the previous funding period) three different vegetable crops have been grown: cabbage, capsicum and sweet corn; and two different cover crop mixtures: oats with lupins and annual rye with vetch (see Fig. 1). The ConvHI system had three cabbage crops, two sweet corn crops, one capsicum crop and no cover crops. The ConvLO system had the same crop sequence except for a rye-vetch cover crop while the ConvHI system was fallow between the capsicum and second sweet corn crops. The Objective system had the same sequence of crops as ConvHI except for an oat-lupin cover crop instead of the first cabbage crop. The Organic and Integrated systems also had similar crop sequences to the ConvHI system except for a oat-lupin cover crop instead of the second cabbage crop and a rye-vetch cover crop at the same time as on the ConvLO system.
In summary, all the systems have had four vegetable crops that were grown at the same time: two sweet corn crops, a capsicum crop and a cabbage crop. However there are, as yet, no data from the cabbage crop as it has not yet been harvested. The Organic and Integrated systems have had two cover crops, the ConvLO and Objective systems have had one, and the ConvHI system has had none.
7

Current reporting period
1-Jul-97 1-Jan-98 1-Jul-9S 1-Jan-99 1-Jul-99 1-Jan-00 1-Jul-00
wm Cabbage
\:\-.\ Sweet Corn
Capsicum
\ \ \ Oats and Lupins
///, Rye and Vetch
Figure 1: Crop sequences on the farming systems from July 1997 to July 2000
A A Crop and soil management This section details the horticultural management applied to each system for each cropping period. Information about fertiliser management is included in the following section.
4.4.1 Cabbage crop and oat-lupin cover crop: June to December 1998 The oat-lupin cover crop was sown on the Organic and Integrated systems on 26 May 1998. Approximately 50 kg/ha of oat seed was mixed with 10 Kg/ha of lupin seed and broadcast on the surface of the plots. On the Organic system the seed was incorporated with a shallow, low PTO speed, pass of a rotary-hoe; on the Integrated system the beds were broken-up with 20 cm long tynes which partially covered the broadcast seed. The cover crops were allowed to grow to maturity (till the oat seed began to firm) and where slashed on 6 November 1998.
Cabbage seedlings were planted on the ConvHI, ConvLO and Objective systems on 18 June 1998. The ConvHI was rotary-hoed twice before planting while the ConvLO was rotary-hoed only once and was also deep ripped. Black plastic mulch was laid on the beds of the Objective system with a minimum of disturbance.
Ramrod (propachlor) was applied as a pre-emergent herbicide to the ConvHI and ConvLO. Chipping and surface cultivation with tractor mounted bean knives (blades which skim the soil surface) were also used to control weeds on these systems. The plastic mulch on the Objective provided good weed control. There was considerable pressure from cabbage white butterfly. Endosulfan was applied once to the ConvHI and ConvLO systems; Ambush (permethrin) was sprayed three times on ConvHI and once on the ConvLO and Objective; Delfin (Bacillus thuringiensis) was used twice on the ConvLO and once on the Objective.
8

Cabbage harvesting began on 10 November and continued over three weeks as the Objective cabbages were slower to mature.
4.4.2 Capsicum crop: Jan to Jun 1998 Capsicum seedlings were sown on each system on 12 to 14 January 1998. The cabbage crop residue on the ConvHI, ConvLO and Objective systems had been slashed. The ConvHI, ConvLO and Organic were rotary-hoed to incorporate residues and to form beds: the ConvHI twice, ConvLO once and Organic once, lightly. The Integrated system beds were ripped once to break up compacted sub-soil prior to planting but then received no other tillage. The Objective system received no tillage, the seedlings were planted directly into the plastic mulch used for the previous crop. After planting, some replacement plants were needed on the Objective due to ring-barking caused by the plastic mulch.
A pre-emergent herbicide, Dacthal, was applied to the ConvHI, ConvLO and Integrated systems, after planting, to give initial weed control. A small, powered tiller was used on Organic for this purpose and also later on the Integrated system. Chipping was carried out on all systems except the Objective over the life of the crop. The black plastic mulch on Objective began breaking down and weeds were removed by hand from around affected plants - a very tedious job.
Pirimor was used to control aphids on the ConvHI, ConvLO, and Integrated systems when necessary. Copper Oxychloride was sprayed twice on the ConvHI and ConvLO to control fungal outbreaks caused by persistent wet weather.
Capsicum harvesting extended from late April to June 1999.
4.4.3 Annual rye and vetch cover crop and fallow: Jun to Oct 1999 Rye and vetch seed was sown on the ConvLO, Integrated and Organic systems in June 1999, within three days of harvesting the last capsicums from the previous crop. A rate of 73 kg/ha of each species was used. The capsicum residue was slashed on these systems, and the ConvLO system was rotary-hoed, prior to broadcasting the cover crop seed. The seed was covered with soil using a shallow pass with a rotary-hoe. No fertilisers or irrigation were applied. The cover crop was killed at the end of September using a forage harvester which spread the residue back onto the beds. The capsicum residue on the ConvHI system was also slashed and rotary-hoed. The ConvHI system was then left fallow and was rotary-hoed again on 31 August 1999 to control weeds. The capsicum crop was left standing on the Objective system until the plastic mulch was removed just prior to planting sweet corn.
4.4.4 Sweet corn crop: Oct 1999 to Feb 2000 Prior to sowing sweet corn seed the ConvHI system was rotary-hoed twice, once to incorporate superphosphate and again later to remove weed growth and incorporate a base dressing of granular fertiliser. The ConvLO and Organic systems were rotary-hoed only once. The Objective system had its plastic mulch removed and the top 50 mm lightly cultivated to form a seedbed. The Integrated system also had the top 50 mm lightly cultivated. Wet conditions (and a heavy cover crop residue on the ConvLO, Organic and Integrated systems) made it necessary to plant the sweet corn by hand on all systems except the ConvHI which was sown using a hand seeder. A pre-emergent herbicide, Ramrod, was applied to the ConvHI, ConvLO, Integrated and Objective systems to control weeds in the early stages of seedling growth. The pre-emergent appeared to be more effective on those systems that had not had a cover crop. A wheel hoe (hand operated) was used to control weeds on the Organic for the first 5 weeks of growth.
Heliothis was controlled by spraying the crop when silking occurred and again a week later. Gemstar, a biological spray, was applied to the ConvLO, Integrated and Objective. BT (Delphin)
9

was used on the Organic and Diazinon on the ConvHI. Good control was achieved from each spray with minimal tip damage in the cobs at harvest.
4.4.5 Cabbage crop: Apr to Sep 2000 Cabbage seedlings were planted on all systems on 1 to 2 May 2000. The ConvHI system was rotary-hoed three times and the ConvLO and Organic systems were rotary-hoed once prior to planting. The ConvLO and Integrated systems were also deep ripped. The Objective and Integrated systems received no tillage of the soil surface and regrowing sweet corn and weeds were sprayed with Roundup. The ConvHI and ConvLO systems were sprayed with Diazinon prior to planting as a preventative for cut worms. Ramrod pre-emergent herbicide was sprayed on all systems except the Organic. Black plastic mulch was laid on the Objective. The crop was harvested in early October.
4.5 Fertiliser management The ConvHI system received, from fertilisers, 1,625 kg/ha of nitrogen (N) and 900 kg/ha of phosphorus (P) for four crops over the two year reporting period (Table 1). This was at least two-fold more N than any other system and over seven-fold more P. Thirty-six percent of the N and 56 percent of the P inputs to ConvHI came from a single application of poultry manure. The ConvLO, Objective and Integrated systems received very low P inputs because they had soil available P levels greater than 150 mg/kg Bray P (Fig. 9). This is the level recommended by NSW Agriculture's best practice guidelines for growing vegetables above which no more P should be added for one year or more (NSW Agriculture, 1997). The decision to limit P inputs was also influenced by considering the very low P sorption capacity of the sandy soils at Somersby. Low P sorption capacity has led to a relatively large proportion of added P remaining available to plants, and it also increases the risk of off-site P losses.
The fertilisers applied to the ConvLO system were generally applied in several split applications over the life of each crop and were banded close to the plants. In contrast, a large proportion of the fertiliser inputs to the ConvHI system were as pre-planting applications, spread over the whole cropping area.
The P inputs on the Organic system were all from composted poultry manure which contains high P relative to its N content. We would have preferred to apply less P than this because the available P levels were already above 150 mg/kg from previous compost and rock phosphate applications. However, it is difficult to find organic fertilisers that have high N with low P. The very low fertiliser N inputs to the Organic system are somewhat misleading because they ignore the N contributions from the two legume cover crops that were grown over this period. Such contributions (which also apply to the Integrated system) could be as high as 200 kg/ha. All the fertiliser N applied to the Objective system, and the bulk of that applied to the Integrated system, was fertigated (applied in solution through the drip irrigation system) in small weekly or fortnightly doses. A small application of single superphosphate was applied to the Objective system before re-laying the plastic mulch for the cabbage crop planted in April 2000. The ConvLO system continued to receive granular, bagged fertiliser but a formulation with high N and K but no P; a very useful fertiliser for vegetable growers that have high soil P levels.
Table 1 does not cover periods when fertiliser was not applied and therefore does not include the period between the capsicum and sweet corn crops, when a rye-vetch cover crop was grown on the ConvLO, Organic and Integrated systems.
10

Table 1: Fertilisers applied to each vegetable crop on the farming systems: types, rates and the nitrogen and phosphorus inputs they represent.
System Period Crop Fertiliser Rate (kg/ha)
N input (kg/ha)
P input (kg/ha)
ConvHI Jun-Dec98 Cabbage Poultry manure NPK: 10.1,3.5,5.6 Ammonium Nitrate Blood & Bone
29,400 1,176 (split)2
515 (split) 735
588 119
175 40
Sep 99 - Feb 00 Sw. corn
500
41
0 32
Total 922 573 Jan - Jun 99 Capsicum NPK: 10.1,3.5, 5.6
NPK: 5.0, 7.5,4.2 882 (split) 735
89 37
31 55
Capsicum
Total 126 86 Single super 735 0 66 NPK: 11.5,6.0,14.5 1,029 118 62 NPK: 5.0,7.5,4.2 735 37 55 Ammonium Nitrate 147 50 0 Total 205 183
Apr - Sep 00 Cabbage NPK: 11.5,6.0,14.5 NPK: 10.1,3.5, 5.6 Ammonium Nitrate
735 368 735
84 37
250
44 13 0
Apr - Sep 00 Cabbage
Total 371 57
TOTAL 1,624 899 ConvLO Jun-Dec 98 Cabbage NPK: 19.7, 0.0, 14.1
Blood & Bone
1,279
735
252
40
0
32
Jun-Dec 98 Cabbage
Total 292 32 Jan-Jun 99 Capsicum NPK: 19.7,0.0, 14.1 882 (split) 174 0 Sep 99 - Feb 00 Sw. corn NPK: 19.7,0.0, 14.1
Ammonium Nitrate 735 (split) 147
145 50
0 0
Sep 99 - Feb 00 Sw. corn
Total 195 0 Apr - Sep 00 Cabbage NPK: 19.7, 0.0,14.1 735 (split) 145 0
TOTAL 806 32 Objective Jun-Dec 98 Cabbage Potassium Nitrate
Urea 662 (fertig.)' 335 (fertig.)
86
154
0
0
Jun-Dec 98 Cabbage
Total 240 0 Jan - Jun 99 Capsicum Potassium Nitrate
Urea 765 (fertig.) 382 (fertig.)
99 176
0 0
Jan - Jun 99 Capsicum
Total 275 0 Sep 99 - Feb 00 Sw. corn Potassium Nitrate
Urea 132 (fertig.) 278 (fertig.)
17 128
0 0
Sep 99 - Feb 00 Sw. corn
Total 145 0 Apr - Sep 00 Cabbage Single super
Potassium Nitrate Urea
515 149 (fertig.) 174 (fertig.)
0 19 80
46 0 0
Apr - Sep 00 Cabbage
Total 99 46
TOTAL 759 46 Organic Jun-Dec 98 Oat & Lupin None 0 0
Jan - Jun 99 Capsicum Composted manure 2,206 44 38
Sep 99 - Feb 00 Sw. Corn Composted manure 1,324 26 23 Apr - Sep 00 Cabbage Composted manure 3,309 (split) 66 56
TOTAL 137 116 Integrated Jun-Dec 98 Oat & Lupin None 0 0
Jan - Jun 99 Capsicum Potassium Nitrate Urea
471 (fertig.) 235 (fertig.)
61 108
0 0
Jan - Jun 99 Capsicum
Total 169 0 Sep 99 - Feb 00 Sw. corn Potassium Nitrate
Urea 132 (fertig.) 278 (fertig.)
17 128
0 0
Sep 99 - Feb 00 Sw. corn
Total 145 0 Apr - Sep 00 Cabbage NPK: 5.0,7.5,4.2
Potassium Nitrate Urea
368 126 (fertig.) 147 (fertig.)
18 16 68
28 0 0
Apr - Sep 00 Cabbage
Total 102 28
TOTAL 417 129,400 kg/ha ~ 60 mJ/ha of poultry manure 2 (split) = fertiliser applied in two or more applications over the life of the crop 3 (fertig.) = fertigation: fertiliser applied in solution through drip lines in weekly or fortnightly doses 4 Composted manure = composted and pelletised poultry manure
28
11

5 Results
5.1 Crop yields The conventional production systems generally produced higher yields of marketable vegetables than the other systems (Fig. 2). This was the case for the cabbage crop (against only the Objective system) and the sweet corn crop, but there was no significant difference in the yield of capsicums between the systems (yet the conventional systems still produced the highest average capsicum yields).
(1) Cabbage Jun-Dec 1998
(2) Capsicum Jan-Jun 1999
(3) Sweet Corn Sep 1999-Feb 2000
T
T • 7
r
i
> o O I I I 1
Figure 2: Yields from (1) the cabbage crop grown from June to December 1998, (2) the capsicum crop grown from January to June 1999, and (3) the sweet corn crop grown from September 1999 to February 2000. The error bars represent the standard errors of the mean yields. Within each crop, mean yields that have the same letter are not significantly different from each other using the LSD test at the 5% probability level.
The ConvHI system produced the highest yield of cabbages; the ConvLO system achieved 80 % of this yield and the Objective system only 53 %. Previous cabbage crops have demonstrated a similar pattern in which the systems with the highest fertiliser inputs produced the highest yields. However, it is important to note that the ConvLO system used fertiliser far more efficiently than the ConvHI, producing 80 % of the ConvHI yield with only 32 % of the N inputs and 6 % of the P inputs.
The adaptable indeterminate growth habit of capsicums appeared to cause yield to be relatively insensitive to differences in soil fertility. Two of the previous capsicum crops grown in this experiment have also produced no significant differences in yield between the systems (Wells and Chan, 1997). Small variations in management seem to have been more important. For instance, the low average capsicum yield on the Objective system (Fig. 2(2)) was caused largely by delaying picking of red capsicums (which formed earliest on this system) by approximately one week so that they would be present for a field day. They were subsequently too old to be marketable. This also appeared to reduce the crop's potential for setting later fruit. Whether it was the black plastic mulch that encouraged earlier fruiting on the Objective system is uncertain but it is an advantage to have early red capsicums when prices are often higher.
The ConvLO system produced the highest sweet corn yield but it was not significantly different from the yield on the ConvHI system. Similarly, although the sweet corn yield on the Integrated system was lower than the ConvHI yield, it was not significantly different. This represents a large improvement in the performance of the Integrated system since its last sweet corn crop two years earlier. Then, due to extreme soil hardness after seven years of no-till management, the sweet corn yield was virtually nil. Lack of tillage and soil hardness may also explain the low yield on the Objective system. The Organic system had the lowest yield of sweet corn. The Organic plants had typical N deficiency symptoms: the older leaves progressively becoming yellow, especially as the corn cobs began to fill. Although only 26 kg/ha of N was applied to
12

this crop (see Table 1), the preceding rye-vetch cover crop was expected to supply a useful amount of N. This did not appear to happen.
5.2 Crop growth In contrast to the situation with marketable yield, there were few differences between the productivity of the systems as measured by total dry matter production (Fig. 3) and LAI (Fig. 4).
However, there were very large differences in the amount of dry matter produced by different crops. Cabbage and sweet corn produced similar large amounts of dry matter (up to 10 T/ha) whereas the capsicum crop produced approximately only one fifth as much (Fig. 3). In terms of organic matter input to the soil, sweet corn contributed more than the cabbage crop because over half the cabbage dry matter was removed in the harvested cabbages. Only a small proportion of the sweet corn dry matter was removed in the harvested corn cobs. Since organic matter input to soil is a key element of maintaining soil health, it could be argued that sweet corn was the most sustainable vegetable crop followed by cabbage and then capsicum.
The oat-lupin cover crop grown on the Organic and Integrated systems in 1998 produced a similar amount of dry matter to the 2000 sweet corn crop. The rye-vetch cover crop in 1999 produced less than half this amount.
(1) Cabbage & Oat-Lupin Jun- Dec 1998
(2) Capsicum Jan-Jun 1999
(3) Rye-Vetch (4) Sweet Corn Jun - Sep 1999 Sep 1999 - Feb 200
ra~ 12
a) 8
b 4
I •' I
i S I O J)
10
8
6
4 Wmn 2
0 — mnW > o O U
a> u .> 'c ? B
Figure 3: Total dry matter production, on (1) the cabbage crop and oat-lupin cover crop grown from June to December 1998, (2) the capsicum crop grown from January to June 1999, (3) the rye-vetch cover crop grown from June to September 1999, and (4) the sweet corn crop grown from September 1999 to February 2000. The error bars represent the standard errors of the means. Within each crop, dry matter results that have the same letter are not significantly different from each other using the LSD test at the 5% probability level. In (1), the oat/lupin cover crop results were not included in the statistical test with the cabbage crop because of their different growth habit.
There were even fewer significant differences in LAI between the systems than there were for dry matter production. However, as was the case for dry matter, the differences between crops was large. The cabbage and sweet corn crops developed LAI's greater than 3 on all systems (over 6 for sweet corn), thereby providing complete soil cover and good protection from intense rainfall. The capsicum crop, in contrast, attained an LAI of little more than 1, even on the ConvHI system. Once again, sweet corn had the sustainability advantage over cabbage because its leaf area increased more rapidly after planting, providing earlier soil cover.
13

(1) Cabbage Jun-Dec 1998
= 3
< 2 4—
(2) Capsicum Jan-Jun 1999
(3) Sw. Corn Sep 1999-Feb 2000
c o O
Q) o •a
bjec
tiv
1 egra
te
o c o o Figure 4: Leaf area index at crop maturity, on (1) the cabbage crop grown from June to December 1998, (2) the capsicum crop grown from January to June 1999, and (3) the sweet corn crop grown from September 1999 to February 2000. The error bars represent the standard errors of the means. Within each crop, bars that have the same letter are not significantly different from each other using the LSD test at the 5% probability level.
5.3 Profitability Surprisingly there were only small differences in production costs between the systems when a vegetable crop was being grown (Fig. 5). Figure 5 includes only the costs of inputs to the systems and excludes costs that depend directly on yield levels (such as marketing costs). This provides a fairer comparison of the systems, unbiased by differences in yield levels.
Although the alternative systems tended to have smaller fertiliser and spray costs, these were overshadowed by the cost of seedlings, seeds and machinery-use that were common to all systems. Even though the Organic system received much smaller nutrient inputs than the conventional systems, the higher cost per unit of NPK for organically certified fertilisers meant there was little cost saving.
(1) Cabbage & Oat-Lupin Jun- Dec 1998
(2) Capsicum Jan-Jun 1999
(3) Sweet Corn Sep 1999-Feb 2000
Fertilisers Seed/lings Sprays Plastic mulch Machinery
Figure 5: Production costs of the vegetable farming systems associated with growing (1) the cabbage crop grown from June to December 1998, (2) the capsicum crop grown from January to June 1999, and (3) the sweet corn crop grown from September 1999 to February 2000.
The cost of plastic mulch on the Objective system, for the 1998 cabbage crop, led to higher total production costs than for the conventional systems (Fig. 5(1)). However, the plastic mulch was left in place and used again for the following capsicum crop, thus reducing costs for that crop.
14
Most of the spray costs for the capsicum crop were herbicides—the plastic mulch reduced this cost considerably for the Objective system.
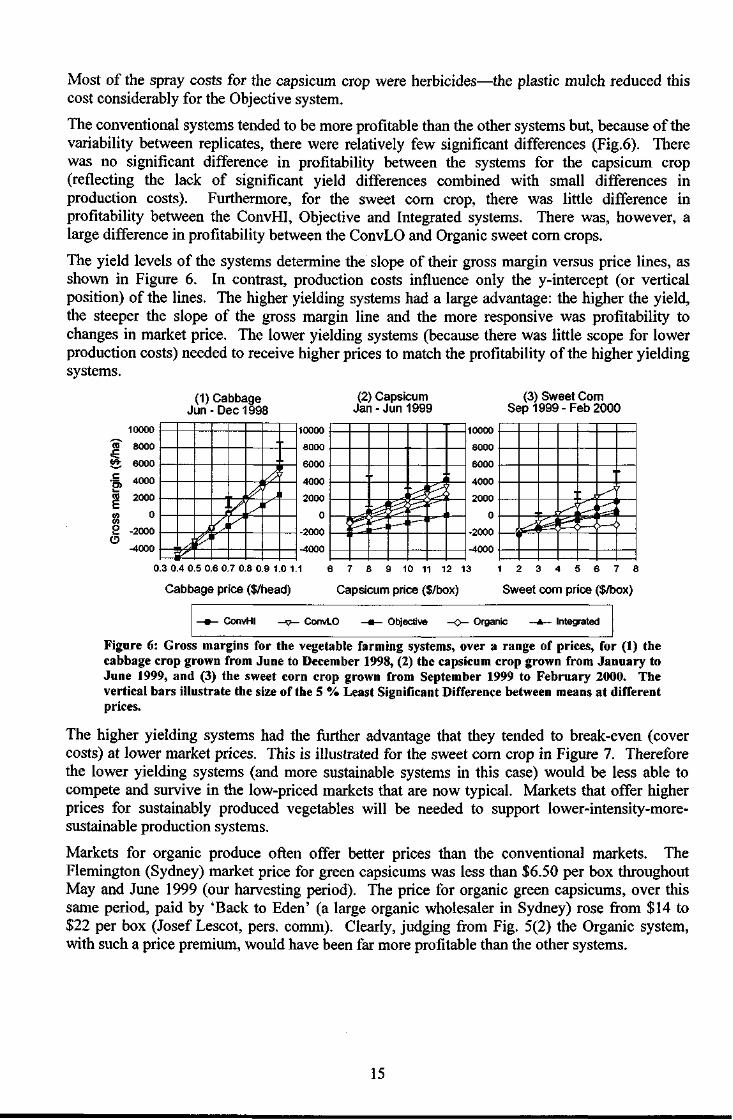
The conventional systems tended to be more profitable than the other systems but, because of the variability between replicates, there were relatively few significant differences (Fig.6). There was no significant difference in profitability between the systems for the capsicum crop (reflecting the lack of significant yield differences combined with small differences in production costs). Furthermore, for the sweet corn crop, there was little difference in profitability between the ConvHI, Objective and Integrated systems. There was, however, a large difference in profitability between the ConvLO and Organic sweet corn crops.
The yield levels of the systems determine the slope of their gross margin versus price lines, as shown in Figure 6. In contrast, production costs influence only the y-intercept (or vertical position) of the lines. The higher yielding systems had a large advantage: the higher the yield, the steeper the slope of the gross margin line and the more responsive was profitability to changes in market price. The lower yielding systems (because there was little scope for lower production costs) needed to receive higher prices to match the profitability of the higher yielding systems.
(1) Cabbage Jun-Dec 1998
(2) Capsicum Jan-Jun 1999
(3) Sweet Corn Sep 1999-Feb 2000
" if[
0.3 0.4 0.5 0.6 0.7 0.8 0.9 1.0 1.1
Cabbage price ($/head)
6 7 8 9 10 11 12 13
Capsicum price ($/box)
1 2 3 4 5 6 7 8
Sweet com price ($/box)
ConvHI ConvLO Otyective Organic Integrated
Figure 6: Gross margins for the vegetable farming systems, over a range of prices, for (1) the cabbage crop grown from June to December 1998, (2) the capsicum crop grown from January to June 1999, and (3) the sweet corn crop grown from September 1999 to February 2000. The vertical bars illustrate the size of the 5 % Least Significant Difference between means at different prices.
The higher yielding systems had the further advantage that they tended to break-even (cover costs) at lower market prices. This is illustrated for the sweet corn crop in Figure 7. Therefore the lower yielding systems (and more sustainable systems in this case) would be less able to compete and survive in the low-priced markets that are now typical. Markets that offer higher prices for sustainably produced vegetables will be needed to support lower-intensity-more-sustainable production systems.
Markets for organic produce often offer better prices than the conventional markets. The Flemington (Sydney) market price for green capsicums was less than $6.50 per box throughout May and June 1999 (our harvesting period). The price for organic green capsicums, over this same period, paid by 'Back to Eden' (a large organic wholesaler in Sydney) rose from $14 to $22 per box (Josef Lescot, pers. comm). Clearly, judging from Fig. 5(2) the Organic system, with such a price premium, would have been far more profitable than the other systems.
15

ox) 14 -
• Organic -Q f A 12 -(I) O 10 -L -
D. c 8 -(1) > d) 6 - Objective to • Integrated £ • ConvHI CD 4 -
?
• ConvLO
0 200 400 600 800 1000 1200 1400 1600
Sweet Corn Yield (boxes/ha)
Figure 7: Breakeven price versus sweet corn yield for the five vegetable farming systems
5.4 Soil Results Soil samples were collected and analysed for a range of chemical properties in May 1998, at the end of the previous funding period. The results from these samples were not available for the final report for that period and are therefore included in this report. They are related to previous results to identify trends in soil properties.
5.4.1 Organic carbon Compost applications on the Organic and Integrated systems in early 1995, in combination with reduced tillage and cover cropping, have maintained higher soil organic carbon levels on these systems than the others (Fig. 8).
2.25
£ , 2.00 C O .Q u . CO o o 'c CO
e> o S 1.25 o
1.75
1.50
1.00 1996
Years Compost applied to
Org. and Integ. systems
ConvHI ConvLO Obj ective Organic Integrated
Figure 8: Trends in soil organic carbon levels over three and a half years in the 0-10 cm layer of the farming systems. The vertical bars show the least significant differences between means for each sampling time at the 5% probability level.
Measurements of organic carbon levels in December 1995 and again in May 1998 show that the organic carbon levels on the Organic and Integrated systems have fallen since the compost application but they are still significantly higher than the levels of the other systems. The organic carbon levels of the other systems have remained relatively steady, with no indication of a decline in this important indicator of soil health. The levels are low but are typical for a sandy
16

yellow earth (Baldock and Skjemstad, 1999). The baseline level of soil organic carbon (before the experiment began) was 1.19 % with a standard deviation of 0.18 (McKenzie et al., 1997). Comparing this baseline level with Fig. 8 indicates that organic carbon levels have not declined on any of the farming systems, rather they have risen markedly on the Organic and Integrated systems.
5.4.2 Soil phosphorus Available soil P levels in May 1998 were approximately two-fold higher on the ConvHI system than they were on any other system (Fig. 9). The ConvHI system also had a significant increase in the amount of available P in the soil profile over the period from September 1994 to May 1998. There was also some evidence of a build-up of available P in the profile of the ConvLO system but not at the soil surface - where P can be lost by runoff and erosion. There has been a strong reduction in available P levels in the soil profile of the Integrated system and evidence of a similar trend in the Organic system soil profile. The available P levels of the objective system have changed little.
E o
f 1
0
20 -|
40
60 -
80
100
0
20
40
60
80
100
0
20
40
60
80
100
0
20
40
60
80
100
0
20
40
60
80
100
Bray Phosphorus (mg/kg)
100 200 300 400 500
Sep 1994 May 1998
ConvHI
Objective
Organic
P^ Integrated
100 400 500 200 300
Bray Phosphorus (mg / kg)
Figure 9: Soil Bray phosphorus levels in the soil profiles of the five farming systems in September 1994 and May 1998. The error bars refer to the standard errors of the means.
17

The very high available P level in the surface soil of the ConvHI system was associated with a zero P sorption capacity in the surface 10 cm (data not shown). Thus this P is extremely vulnerable to being lost during runoff events and the high levels in the soil profile may lead to P leaching.
5.5 Runoff Results Although the project has been in a holding phase over the current funding period and no funds have been allocated for monitoring runoff losses, we have been able to carry on with analysing runoff samples collected up till early 1999 using other funds.
The results presented here are a summary of the runoff results since we began collecting samples in early 1995. They, therefore, provide a long-term measure of the environmental performance of the different approaches to vegetable cropping.
The ConvHI system has been the largest generator of pollution in runoff water while the Organic and Integrated systems were the lowest (Table 2). The ConvLO system has experienced less than half the erosion and N losses of the ConvHI system and only one third of the P losses. The Objective system has experienced approximately one tenth of the erosion of the ConvHI system and approximately one quarter of the nutrient losses. The Organic system had an erosion rate one tenth of the rate on the ConvHI system (despite receiving tillage with a rotary hoe), and lost only 7% and 2% of the ConvHI system N and P respectively. The Integrated system had the lowest erosion rate, at only 4% of the ConvHI rate, but lost relatively more nutrients than the Organic system: 15% and 7% of ConvHI N and P respectively.
Table 2: Runoff loss rates calculated from all runoff events over the specified monitoring period1. System Monitoring Erosion Phosphorus Nitrogen loss
period (T/ha/year) loss (kg/ha/year) (years) (kg/ha/year)
ConvHI 4l) 73 243 243 ConvLO 4.0 3.5 7.9 10.1 Objective 4.4 2.0 2.8 6.9 Organic 4.4 0.7 0.6 1.7 Integrated 2A 03 L7 3.7
1 Monitoring started in April 1995 for all systems except the Integrated which began in January 1997.
The erosion and P runoff results from the ConvHI system were surprisingly similar to data collected by Cornish et al. (1997) on commercial vegetable farms in western Sydney. It was surprising because the soil on the farms was a clay loam with very different properties to the sandy soil at Somersby. The results from the commercial farms were: an erosion rate of 20 T/ha/year, P runoff loss of 15.3 kg/ha/year and N runoff loss of 200 kg/ha/year. The very large discrepancy in N loss between the two sites can easily be explained in terms of differences in soil properties. Much higher permeability of the Somersby soil results in the major pathway for N loss being via leaching rather than surface runoff. N leaching loss was measured on the ConvHI system over an 18 month period beginning in 1996, it was approximately 30-fold higher than the N runoff losses that occurred over the same period (Wells and Chan 1997).
The important point in comparing the Somersby and western Sydney results is that despite the difference in soil type and climate (much lower rainfall in western Sydney) both data sets agree that intensive, high-input vegetable growing can cause significant erosion and nutrient leakage to the environment.
18

6 A model of the trade-off between production and environmental objectives
The purpose of the following model is to simplify and summarise the results of the experiment, to help visualise patterns in the data. It will illustrate some of the broad characteristics and properties of the vegetable farming systems as well as the nature of the trade-off between production and environmental objectives.
The model describes how two measures of system performance—economic yield and soil/nutrient losses—responded to different approaches to management. It is not a mathematical model but rather a conceptual, fitted-by-eye model; it is purely descriptive, not explanatory. Yet the behaviour it describes gives clues to the functioning of the systems.
The model simplifies the complexity of vegetable farming management by using the concept of 'forcing'. Forcing refers to how hard a farming system is being pushed toward higher productivity. It includes: (1) how often vegetable crops are grown without a cover crop or some sort of break; (2) the amount and frequency of application of soluble fertilisers, irrigation water and pesticides; and (3) how frequently and how thoroughly the soil is tilled, cultivated or otherwise disturbed. It can also be thought of as the degree of intervention into natural processes, the degree of control applied.
Similar to the way that the forcing concept summarises management, yield and soil/nutrient-loss curves integrate the response of the farming system to that management. The model aims to generalise and capture the overall outcomes of the experiment, not for any particular time period or crop but over the whole length of the experiment.
As well as the two curves describing how yield and soil/nutrient-loss vary with different levels of forcing, Figure 10 also includes a trade-off curve, the result of subtracting the loss curve from the yield curve. The yield and loss curves must be in the same units to allow one to be subtracted from the other. Suitable units would be dollars (if the costs involved with soil and nutrient losses could be calculated) or some measure of social good. The relative size of the benefit/cost given to yield and soil/nutrient loss will vary depending on different points of view, but the shape of the curves should remain the same, based as they are on objective measurements. If so, the shape of the trade-off curve would also remain essentially the same and the conclusions drawn from it below would remain valid. Figure 10 also shows the approximate positions of the five vegetable farming systems within the model.
E o
w £ •>=
c CO
o
5 o CO
I > c o O ,Yield
Soil/nutrient loss
Trade-off curve (Yield - Soil/nutrient loss)
Forcing level (cropping frequency, nutrient/pesticide/water inputs, tillage frequency/intensity)
Figure 10: A simple model to summarise the results of the experiment. General response curves describe how vegetable crop yields and soil/nutrient losses vary for different levels of productivity forcing.
The model fits our observations of the systems in the following ways:
19

In terms of yield performance:
• The ConvLO system generally achieved similarly high yields to the ConvHI system despite receiving approximately half the fertiliser inputs and soil tillage (lower forcing). Thus these two systems occupy the plateau of the yield response curve with the ConvLO making far more efficient use of resources.
• The other three systems received much less forcing (lower soluble fertiliser inputs, minimum tillage, regular cover cropping) and generally produced smaller and more variable yields. Thus, these systems lie close to, or on, the steep section of the yield curve. Small changes in management here can have a large impact on yield, such as the large increase in sweet corn yield on the Integrated system following a small increase in tillage.
And in terms of soil and nutrient losses:
• Soil and nutrient losses generally increased in a steady (linear) way over the range of forcing covered by the Organic and ConvLO systems. However the losses, at the ConvHI level of forcing, were many-fold higher. This suggests that a non-linear increase in the rate of loss occurred between the ConvLO and ConvHI levels of cropping intensity. It was as though the soil's capacity to act as a buffer between management and the environment had been partly exceeded and the system became more leaky.
The model may suggest that production systems using low levels of forcing are easy, do-little management systems. That these production systems deserve lower yields because they are managed in a lazy way. However, our experience from conducting the experiment suggest almost the complete opposite. The high forcing systems are actually easier to manage. The shape of the yield response curve implies this: when a grower applies high levels of forcing, yield is insensitive to management. Mistakes, inaccuracies and poor timing make little difference. But when a grower is operating close to the steep section of the curve, small shifts in management can cause large differences in yield. Therefore the quality of management, and the degree of planning and systems thinking, is far more critical for low forcing systems. This is probably a more accurate measure of the difficulty of vegetable farming than is the amount of physical work a grower performs.
Not only does the need for good management increase at low levels of forcing but the chances of things going wrong also increases. This is also our experience from the experiment. The high forcing systems were more reliable producers, were less of a worry. It appeared that the high inputs applied to these systems over-rode or masked soil limitations and variability. On the lower forcing systems, crops were less uniform within a plot and there was often greater variability between plots, presumably due to differences in soil depth, stoniness, drainage, clay content, etc.
There is little wonder that most vegetable growers opt for high forcing management approaches. There is less risk and higher yields. A win-win situation for them because they do not directly pay for the ecological damage that such management approaches can cause.
6.1 The trade-off situation The central element of the trade-off is that, over a relatively large range of forcing, the yield curve has a greater slope than the loss curve. At the lower end of the forcing scale, productivity rises far more rapidly than the system losses do. Yet it does not take long for the slope of the loss curve to equal that of the yield curve and cause the trade-off curve to reach its maximum. In Figure 10 this happens at a level of forcing that is less than that required to maximise yield. However, because there is by then sufficient forcing to be on the relatively flat section of the yield curve, the drop in yield is small. Therefore the trade-off situation is that a relatively small sacrifice in yield (along with greater management demands) is required to greatly increase the sustainability of a vegetable farming system (under the conditions at Somersby).
20

A limitation of this analysis is that the optimum level of cropping intensity (where the trade-off curve reaches its maximum) depends on the relative value given to yield versus losses. If the cost of the losses is discounted in relation to the value of yield, then the optimum occurs at a higher level of forcing, and visa versa. Many people would argue that a level of forcing somewhere near the ConvLO system would be ideal. At that point there is no yield loss and far less environmental impact that at the ConvHI position. Many other people would argue that we should reduce environmental impact as much as possible, even if it means operating close to the steep section of the yield curve. Yet the steep section can be seen in a positive light: yield is very sensitive to management there, good management is rewarded and resources are being used very efficiently.
It follows, however, that if the long-term prospects of the production system and its surrounding environment are valued, then it will be important to keep soil and nutrient losses as low as possible while remaining profitable. And this is the real problem. The profitability analysis has shown that current market conditions for vegetables strongly favour high forcing systems.
6.2 Longer-term effects The model shows that yield does not decline, even at very high levels of forcing. That there is no toxic effect of high levels of forcing. This represents the results of the experiment at Somersby after 9 years of cropping, but the outcome may be different in the longer term. High erosion rates and other forms of soil degradation must eventually cause yield decline despite the effects of high fertiliser, water and pesticide inputs 'propping-up' production. Unfortunately we cannot yet say when this situation will occur. It is also likely that if productivity is eventually reduced by extremely poor soil health, then the losses from the system (especially soil loss) would accelerate.
6.3 The effect of other soils types The model can also help to speculate about how different soils would behave under different approaches to vegetable farming. The soil at Somersby is a relatively poor agricultural soil with low water and nutrient holding capacity and a very low aggregate stability (McKenzie et al. 1997) Better quality agricultural soils than those at Somersby would probably produce higher, more reliable, yields under low forcing systems. Such soils would also probably provide a more effective buffer between vegetable growing and the environment. This would make finding a balance between production and environmental impact far more easy.
7 Discussion
7.1 Balancing production and environmental objectives The experiment has demonstrated a trade-off in achieving consistently high vegetable yields and low environmental impact. At one end of the spectrum was the ConvHI system that produced consistently high yields but also experienced very high soil and nutrient losses. At the other end was the Organic system with very low losses but low and variable yields. The other systems demonstrated different positions of balance between these extremes. The ConvLO system achieved similar high yields to ConvHI but with soil and nutrient losses of a half to a third of the ConvHI levels. The Objective system experienced approximately another halving of losses but with generally lower and more variable yields. The Integrated system had similar low soil and nutrient losses to the Organic system but also suffered from low yields at times.
The trade-off model, developed to summarise and generalise these results, illustrated the nature of the trade-off situation. Large reductions in soil and nutrient losses were achieved with relatively small reductions in yield. However, the lowest (most sustainable) losses were associated with the steeply dropping section of the yield response curve. While this suggests that
21

maintaining low environmental impact may necessitate accepting lower and more variable yields, the development of more effective low-input production systems is likely to improve the situation.
Vegetable growers are unlikely to respond enthusiastically to the advice that they may have reduce their yields. Maximising yield has a long tradition and there is already enough variability and uncertainty for vegetable growers to live with. Perhaps the most important question is: where on the yield response curve can growers afford to be?
7.2 Economic impediments to sustainability As was argued in the above profitability results section, low market prices for vegetables favour highly productive systems. Low price markets tend to force growers to maximise production per unit of area and time. Today's markets also strongly value reliable and consistent production, not variability. Thinking in terms of the trade-off model, this means using high levels of forcing with the associated waste of resources and high soil and nutrient losses. Thus, the domestic and international forces that result in chronically low prices being offered to growers (see McFarlane, 2000) contribute to the degradation of the environment as well as causing growers severe financial stress.
This is not to suggest that simply paying growers higher prices for their produce will automatically solve the sustainability problems of vegetable farming. But it strongly suggests that we will require new types of markets before any real changes will occur. Markets that value sustainability are crucial. Markets that will pay growers enough to compensate them for the risks (lower and more variable yields) they make for the sake of future productivity and the health of the environment. Such markets are relatively common in Europe (Laurence, 2000) but there seems to be less interest in Australia. Organic markets are a good example of this type of market. However, in Australia at present, organic markets are not large enough to support improved land management over significant areas. Export organic markets may be the answer but then how can we justify the environmental impact of the energy used in transport?
Perhaps the best hope for widespread sustainability-valuing markets will come from the recent interest in Environmental Management Systems. These quality management/assurance systems, that focus on environmental as well as production and food safety issues, could potentially provide the necessary link between on-farm management and market rewards. They could help growers by providing a framework to guide them and also give the markets the assurance that higher prices paid to growers are actually supporting environmentally sound management. However, the success of sustainability-valuing markets will depend on vigorous demand for environmentally friendly produce from consumers. Food safety is a dominant issue at the moment, will environmentally sound food be the next major issue?
It is difficult for growers to consider long-term issues when they are struggling for short-term survival. It is particularly difficult to afford to undertake practices that have a significant immediate cost with only small and subtle short-term benefits, even though the long-term benefits may be very large. Applying organic matter to soil (such as compost) and cover cropping are two examples of such practices.
The compost applied to the Organic and Integrated systems in early 1995 (along with subsequent reduced tillage and cover cropping) has created significantly higher organic carbon levels on these systems for at least three and a half years (see Figure 8). A range of soil measurements taken 10 months after the applications showed that the soils had higher microbial biomass, total N, total P, cation exchange capacity, water holding capacity and aggregate stability than the other systems (Wells et al., 2000).
Yet, while the good environmental performance of the Organic and Integrated systems is probably strongly linked to the broad benefits of their higher organic carbon levels, the compost
22

has had little short-term impact on vegetable yields. There is also a very significant cost in importing organic matter, whether growers buy it off-farm or grow and processes it on farm. In the present economic climate, without some short-term pay-off or subsidisation of the cost, growers are unlikely to bother.
The cover cropping situation is similar. The experiment has shown that even occasional cover cropping can have a large effect on reducing erosion and nutrient losses. This effect occurred both while the cover crops were growing and for many months into following crops (Wells and Chan, 1997). The rye-vetch cover crop grown during 1999 on the ConvLO system is also likely to have contributed to the high yield of the following sweet corn crop. However, these effects are subtle and much less visible than the effects of using bagged fertilisers and pesticides. And although the production costs of cover crops are low (see Figure 6(1)) they take-up land that financially struggling growers would rather use for an economic crop.
7.3 How applicable are the results to other soil types? The similarity in erosion and P runoff rates between the Somersby results and those measured on clay soils by Cornish et al. (1997) indicate that soil and nutrient losses can occur under conventional high-input farming methods irrespective of differences in soil texture. Yet, we still do not know how lower-input systems would respond on heavier soils. However, considering the greater ability of clay soils to hold water and nutrients, it could be expected that they would be more productive than on the sandy soil at Somersby.
7.4 Sweet corn—an economic cover crop A compromise (to get around the economic disincentive to growing cover crops) is to grow vegetable crops that produce large amounts of biomass. Sweet corn is a good example, which, being a grass, may also be able to improve soil structure like grass cover crops have been reported to do (Tisdall and Oades, 1982; Adem and Tisdall, 1984; Stirzaker and White, 1995; Francis et al., 1999). The variety of sweet corn grown on the experiment in 2000 was a supersweet variety (Florida) that grew to little more than one metre in height. However, a more vigorous variety, H5, was grown in early 1998 which grew to a height of more than two metres and produced up to 25 T/ha of dry matter. This variety is popular with growers in western Sydney because of its disease resistance and late maturity (Biggs, 2000). It represents an excellent economic crop and cover crop in one.
An important difference, however, between sweet corn and non-economic cover crops is that cover crops are generally grown with little or no added fertiliser or irrigation. They therefore provide the additional sustainability benefits of 'soaking-up' residual soil nutrients and drying the soil which makes rainfall storage capacity available to reduce leaching and the potential for runoff. Therefore, while sweet corn can substitute as a cover crop in terms of adding organic matter and protecting the soil from rainfall, it does not supply all the benefits of a cover crop.
7.5 Soil phosphorus The build-up of plant available P in the soil profile of the ConvHI system is a cause for alarm. This system has already shown that it losses far more P via runoff than the other systems. It may also be losing P from leaching as well, judging from the rise in available P levels down to 60 cm depth. Superphosphate and poultry manure appear to be more of an environmental hazard than rock phosphate and compost as P fertilisers. These latter two sources of P have been applied in large single doses to the Organic system which has had very small P runoff losses. However this may also be due to differences in soil structure, organic matter content and a range of other differences between the systems.
23

On the other hand, if superphosphate and poultry manure are used more carefully, as they have been on the ConvLO system, they can be far less of an environmental hazard. And the yields of the ConvLO have been no different from those on the ConvHI systems since P applications were effectively stopped in 1997. This result has been on the sandy soils at Somersby that have a low capacity to adsorb P. It is very important to study how well this can be repeated on heavier soils with a high P sorption capacity.
7.6 Soil tillage issues The results indicate that the less soil disturbance there was from tillage the less erosion occurred. For example, the Integrated system, using minimum tillage, experienced the lowest erosion rate, while frequent rotary hoeing was associated with the highest erosion rate, by far, on the ConvHI system (Table 2). At the same time, minimum tillage was associated with soil hardness on the Integrated system that was serious enough to severely limit root growth and crop yields. Both Stirzaker and White (1995), working on an alluvial loam in western Sydney, and Cockroft and Olsson (2000), working on a red-brown earth in Victoria, also found that vegetable growing soils became hard and compacted under minimum or no-till production.
Soil hardness has not developed on the Objective system to an obvious degree, despite also being a minimum tillage system. However we suspect that the lower and more variable crop yields on the Objective, relative to the ConvHI and ConvLO systems, may be due in part to minimum tillage soil management. A major difference between the Objective and Integrated systems has been that the Objective soil was often covered with black plastic mulch.
Cockroft and Olsson (2000) suggest that it is the number of wetting and drying cycles that a soil surface experiences that causes the soil to become hard, or to coalesce, as they name it. Thus, the plastic mulch on the Objective system may have protected the soil surface from drying out and thereby reduced the number of wetting-drying cycles compared to the Integrated system. This hypothesis also helps to explain the results of Stirzaker and White (1995) and Rogers (2000). Both these studies reported that no-till (vegetable growing) soil that was continuously covered with cover crops and their residues did not develop high bulk densities or cause root growth problems. Certainly living cover crops would dry the soil surface but not to the same extent as direct exposure to summer solar radiation. We may test similar living mulch approaches on the Integrated system in the future.
However, to provide some perspective to the issue of tillage and erosion, it should be noted that the Organic system also had very low erosion even though it received some rotary hoeing. There are likely to be strong interactions between the health of a soil (eg organic matter content) and the effects of tillage.
Likewise, the productivity and profitability of the ConvHI system has shown no indications of declining despite receiving intensive soil tillage. Part of this is likely to be that high productivity produces large crop residues. This organic matter can potentially reduce the negative effects of frequent tillage. But equally, the effects of deteriorating soil conditions can be overcome with high inputs of fertilisers and water, on this soil type at least. The real impact of the exploitive practices used on the ConvHI system has been high losses of pollutants to the environment. This is a cost that growers do not personally experience, at least not in the short term.
24

8 Recommendations • Develop markets that reward growers for sustainable management. Markets that will pay
high enough prices to encourage growers to take the risk of obtaining lower and more variable yields from using low-input farming systems.
• Encourage vegetable growers (that are willing to adopt more sustainable practices) to implement Environmental Management Systems so they can demonstrate their environmental credentials to the market. This will require on-farm research, one-to-one extension and farm demonstrations.
• Fund further research into making low-input horticulture more reliable. Particular challenges identified by the Somersby experiment are: making better use of nutrients released from soil organic matter and organic fertilisers/amendments; maintaining favourable soil conditions for root growth under reduced tillage systems; developing commercially practical crop rotations that include frequent grass and legume cover crops; reducing the cost, and improving the on-farm management of 'waste' organic materials used as soil amendments.
• Investigate the impact of reduced phosphorus fertiliser inputs on vegetable farms on heavy soils. The Somersby experiment has demonstrated that, on light soils, phosphorus fertiliser inputs can be substantially reduced from current conventional rates while maintaining yields and reducing phosphorus runoff.
• Encourage vegetable growers to include high biomass crops, such as sweet corn, into their rotations to provide many of the benefits of cover crops as well as an economic return.
• Fund further long-term experiments that compare alternative horticultural production systems on a range of soil types and in different regions. These will be essential for developing widespread sustainable systems. They will provide information needed to develop informed Environmental Management Systems and will form a focus for extension and adoption of sustainable practices.
25

9 References Adem, H.H. and Tisdall, J.M. (1984). Management of tillage and crop residues for double
cropping in fragile soils of south-eastern Australia. Soil & Tillage Research 4, 577-589.
Baldock, J.A. and Skjemstad, J.O. (1999). Soil organic carbon / soil organic matter. In: Soil Analysis: an Interpretation Manual. K.I. Peverill, L.A. Sparrow and D.J. Reuter (eds.). CSIRO Publishing, Collingwood, Victoria. Pp. 159-170.
Biggs, T. (2000). Sweet corn from the Hawkesbury - how green is the valley? Good Fruit and Vegetables, April 2000, 11-17.
Cockroft, B. and Olsson, K.A. (2000). Degradation of soil structure due to coalescence of aggregates in no-till, no-traffic beds in irrigated crops. Aust. J. Soil Res. 38, 61-70.
Cornish, P.S. (1997). Land and water degradation due to agriculture in the Hakesbury-Nepean. Final Report to the National Landcare Program (Natural Heritage Trust), Canberra.
Cornish, P.S.; Kuczera, G. & Murison, J. (1992). Managing horticulture in the Sydney basin to achieve better economic and environmental outcomes - a model for application of systems methodology. Proceedings of the Conference on Engineering in Agriculture, Albury. Institute of Engineers Australia, Canberra.
Francis, G.S., Tabley, F.J., (1999). Restorative crops for the amelioration of degraded soil conditions in New Zealand. Aust. J. Soil Research, 37, 1017-1034.
Hollinger, E., Baginska, B., Cornish, P.S., 1998. Factors influencing soil and nutrient loss in storm water from a market garden. Proceedings of the 9th Australian Agronomy Conference, Wagga. Australian Society of Agronomy, Parkville, Vic. pp 741-744.
Laurence, R. (2000). Improving the long-term sustainability of intensive horticultural cropping systems: a feasibility study. Final report to the Horticultural Research and Development Corporation, Sydney.
McFarlane, P. (2000). Are growers in trouble? Good Fruit and Vegetables, August 2000, p 24.
McKenzie, D.C., Thompson, A.L. and Hawkins, C.A. (1997). Baseline soil data for the 'Alternative vegetable production systems' experiments at Somersby and Richmond. Report 2, Agricultural Resource Management Report Series, NSW Agriculture, Orange. 60 p.
Murison, J.A., (1995). Environmental impact of alternative horticultural systems in the Hawkesbury-Nepean catchment. Final Report for the Horticultural Research and Development Corporation, Sydney. 36 p.
National Association for Sustainable Agriculture, Australia (NASSA) Ltd, (1998). Standards for Organic Agricultural Production. NASSA, Stirling, SA. 40 p.
NSW Agriculture, (1997). Best Practice Guidelines for Growing Vegetables. NSW Agriculture, Orange. 35 p.
Rogers, G. (2000). Sustainable permanent bed systems for vegetable production. Good Fruit and Vegetables, May 2000.
Stirzaker, R.J. and White, I. (1995). Amelioration of soil compaction by a cover-crop for no-tillage lettuce production. Aust. J. Agric. Res. 46, 553-568.
Tisdall, J.M., Oades, J.M., (1982). Organic matter and water-stable aggregates in soils. J. Soil Science 33, 141-163.
Wells, A.T. and Chan, K.Y. (1997). Environmental impact of alternative horticultural production systems in the Hawkesbury-Nepean catchment. Final report to the Land and Water Resources Research and Development Corporation, Canberra. 62 p.
26

Wells, A.T. (1998). Sustainable vegetable farming systems. Final report to the Horticultural Research and Development Corporation, Sydney.
Wells, A.T., Chan, K.Y. and Cornish, P.S. (2000). Comparison of conventional and alternative vegetable farming systems on the properties of a yellow earth in New South Wales. Agriculture, Ecosystems and Environment 80, 47-60.
27

10 Appendix
Table 3: Tillage, irrigation and pest management of the five systems in the Somersby Vegetable Farming-Systems experiment, 1992-2000
System' Tillage' Weed Control Pests and Diseases
Irrigation
ConvHI
ConvLO
Multiple tillage
Reduced tillage
Tillage and Herbicides
Tillage and Herbicides
Chem. control, resistant vars. if yields OK
Chem. control, rotations, resistant vars.
To excess, spray
To excess, drip
Objective Minimum tillage
Plastic mulch, herbicides
Economic thresholds, rotations, resistant vars.
Scheduling, drip
Organic Reduced tillage
Tillage, cover crops, rotations, mulches
Rotations, resistant vars., "natural" pesticides as last resort
Drip
Integrated Minimum tillage0
Cover crops, rotations, mulches, herbicides
Rotations, resistant vars., chem. control if needed
Drip
a Farming system: DP = District Practice; Ag = Agfact; Obj = Objective; Org = Organic; Ev = Evolving. See section 2.3 for details.
b Multiple tillage = soil cultivated with a rotary hoe or discs 2 to 4 times for each crop; reduced tillage = 1 to 2 times for each crop; minimum tillage = no use of rotary hoe or other implements except to occasionally break-up crop residues on the surface.
c Occasional chisel ploughing and deep ripping has been introduced on the Integrated system since 1998 to loosen hard-setting soil.
28

Table 4: Crop rotation and nutrition management of the five systems in the Somersby Vegetable Farming-Systems experiment, 1992-2000
System Rotations Nutrients ConvHI
ConvLO
Objective
Organic
Integrated
Best market potential; no cover crops
Some consideration to disease control; occasional cover crops
Rotate crops for weed, pest and disease management and soil fertility; occasional cover crops Rotate crops for weed, pest and disease management, soil fertility and biotic diversity; frequent cover crops
Rotate crops for weed, pest and disease management, soil fertility and biotic diversity; frequent cover crops
Fertilise to excess, heavy dependence on pre-plant applications
Soluble mineral fertiliser use guided by extension advise and periodic soil tests, pre-plant plus sidedressing
Mineral fertilisers applied mostly via fertigation a guided by sap nitrate and soil tests
Compost, legumes, rock dusts
Compost, legumes, fertigation a, slow release coated fertilisers
a Fertigation refers to applying soluble nutrients through the irrigation system.
29