sustainability report fiscal year 2010
TRANSCRIPT
Sustainability Report
Fiscal Year 2010
CARNIVAL CORPORATION & PLC • Sustainability Report, Fiscal Year 2010
1
Contents and GRI G3 References Page No.
1 Strategy and Analysis ......................................................................................................................... 5
1.1 Statement by Chairman and CEO ............................................................................................ 5
1.2 Key Impacts, Risks and Opportunities ..................................................................................... 7
2 About Carnival Corporation & plc ................................................................................................. 11
2.1 Company Name ......................................................................................................................... 11
2.2 Primary Brands and Services .................................................................................................. 11
2.3 Operational Structure ............................................................................................................... 11
2.4 Headquarters ............................................................................................................................. 12
2.5 Countries of Operation ............................................................................................................. 12
2.6 Legal Form ................................................................................................................................ 12
2.7 Markets Served ......................................................................................................................... 12
2.8 Scale of Organization ................................................................................................................ 13
2.9 Significant Changes................................................................................................................... 13
2.10 Awards and Recognition .......................................................................................................... 13
2.11 Additional Disclosures .............................................................................................................. 16
3 About This Report ............................................................................................................................ 17
3.1 Reporting Period ....................................................................................................................... 17
3.2 Previous Reports ....................................................................................................................... 17
3.3 Reporting Cycle ......................................................................................................................... 17
3.4 Contact Point ............................................................................................................................. 17
3.5 Defining Report Content .......................................................................................................... 17
3.6 Report Boundary ...................................................................................................................... 18
3.7 Limit on Report Scope .............................................................................................................. 18
3.8 Basis for Reporting ................................................................................................................... 18
3.9 Data Measurement and Calculations ...................................................................................... 18
3.10 Restatements .............................................................................................................................. 19
3.11 Changes from Previous Reporting Periods ............................................................................. 19
3.12 GRI Content Index ................................................................................................................... 19
3.13 Assurance Practices .................................................................................................................. 19
CARNIVAL CORPORATION & PLC • Sustainability Report, Fiscal Year 2010
2
4 Governance, Commitments and Engagement ................................................................................ 21
4.1 Governance Structure, Committees ...................................................................................... 21
4.2 Chair/CEO Separation ............................................................................................................. 21
4.3 Board Members ......................................................................................................................... 21
4.4 Communication with Boards ................................................................................................... 21
4.5 Compensation Linkage ............................................................................................................. 21
4.6 Conflicts of Interest ................................................................................................................... 21
4.7 Board Qualifications ................................................................................................................. 21
4.8 Economic, Environmental and Social Values ......................................................................... 21
4.9 Economic, Environmental and Social Oversight .................................................................... 23
4.10 Board Evaluation ...................................................................................................................... 24
4.11 Commitments to External Initiatives - Precautionary Approach ........................................ 24
4.12 Commitments to External Initiatives - Mandatory and Voluntary ...................................... 24
4.13 Commitments to External Initiatives - Memberships ............................................................ 28
4.14 Stakeholder Engagement - Stakeholders Engaged ................................................................ 28
4.15 Stakeholder Identification and Selection ................................................................................ 29
4.16 Approaches to Stakeholder Engagement ................................................................................ 30
4.17 Stakeholder Engagement Results ............................................................................................ 30
5 Management Approach and Performance Indicators ................................................................... 31
5.1 Economic Performance Indicators .......................................................................................... 31
5.1.1 Economic Value Generated (EC1) .................................................................................................................. 31
5.2 Environmental Performance Indicators ................................................................................. 33
5.2.1 Management Approach ................................................................................................................................... 33
5.2.2 Direct Energy Use (EN3) ................................................................................................................................. 35
5.2.3 Indirect Energy Use (EN4) .............................................................................................................................. 37
5.2.4 Energy Savings Initiatives and Results (EN6) ............................................................................................... 38
5.2.5 Water Consumption (EN8) ............................................................................................................................. 39
5.2.6 Biodiversity - Habitats Protected/ Restored (EN13) ..................................................................................... 41
5.2.7 Direct and Indirect Greenhouse Gas Emissions (EN16) ............................................................................... 44
5.2.8 Greenhouse Gas (GHG) Reductions (EN18).................................................................................................. 50
5.2.9 Ozone-Depleting Substances (EN19) .............................................................................................................. 51
5.2.10 NOx, SOx and Other Significant Air Emissions (EN20) ............................................................................... 52
5.2.11 Shipboard Wastewater Management (EN21) ................................................................................................ 57
5.2.12 Shipboard Waste Management (EN22) .......................................................................................................... 62
5.2.13 Significant Spills (EN23) .................................................................................................................................. 66
CARNIVAL CORPORATION & PLC • Sustainability Report, Fiscal Year 2010
3
5.2.14 Environmental Impact Mitigation (EN26) ..................................................................................................... 67
5.2.15 Environmental Compliance (EN28) ............................................................................................................... 67
5.3 Labor Practices and Decent Work .......................................................................................... 69
5.3.1 Workforce (LA1).............................................................................................................................................. 69
5.3.2 Employee Turnover (LA2) .............................................................................................................................. 71
5.3.3 Collective Bargaining Agreements (LA4) ...................................................................................................... 72
5.3.4 Health and Safety Committees (LA6)............................................................................................................. 72
5.3.5 Occupational Health and Safety: Injury/Fatality Rates (LA7) .................................................................... 73
5.3.6 Employee Training and Education (LA10) .................................................................................................... 74
5.3.7 Employee Performance and Career Development (LA12) ........................................................................... 76
5.4 Human Rights ............................................................................................................................ 77
5.4.1 Non-Discrimination (HR4) .............................................................................................................................. 77
5.4.2 Freedom of Association and Collective Bargaining (HR5) ........................................................................... 77
5.4.3 Child Labor (HR6) ........................................................................................................................................... 78
5.4.4 Forced and Compulsory Labor (HR7) ........................................................................................................... 78
5.5 Society ........................................................................................................................................ 78
5.5.1 Impacts on Communities (SO1) ...................................................................................................................... 78
5.5.2 Training in Anti-corruption Policies and Procedures (SO3) ........................................................................ 82
5.5.3 Public Policy Positions (SO5) .......................................................................................................................... 83
5.5.4 Noncompliance with Laws and Regulations (SO8) ....................................................................................... 84
5.6 Product/Service Responsibility ................................................................................................ 85
5.6.1 Guest Health, Safety and Security (PR1) ....................................................................................................... 85
5.6.2 Compliance with Health and Safety Standards (PR2) .................................................................................. 89
5.6.3 Guest Satisfaction (PR5) .................................................................................................................................. 90
5.6.4 Guest Privacy (PR8) ........................................................................................................................................ 92
6 Declaration of the GRI G3 Application Level ................................................................................ 93
7 Glossary ............................................................................................................................................. 94
CARNIVAL CORPORATION & PLC • Sustainability Report, Fiscal Year 2010
4
This Page Intentionally Blank
CARNIVAL CORPORATION & PLC • Sustainability Report, Fiscal Year 2010
5
1 Strategy and Analysis
1.1 Statement by Chairman and CEO
This is the first Sustainability Report of Carnival Corporation & plc. It expands our ongoing commitment to transparency that has included: Corporate Environmental Management Reports
published for fiscal years 2005-2008. Costa Cruises and AIDA Cruises Sustainability
Reports published since FY2005. Sustainability Reports published by our
subsidiary brands covering FY2009. As one of the largest vacation companies in the world, Carnival is committed to operating responsibly. We believe that sustainability is about preserving our environment, respecting our employees and the communities where we do business, and returning value to our shareholders. Sustainability is not a cost of doing business; it is a way of doing business that strives to achieve the best possible outcome for the people whose lives we touch and the natural environment that we all depend on, as well as for our business. We recognize that our success is tied not only to protecting the waters in which we sail, and the environment of the destinations we visit, but also to safeguarding and developing our workforce, strengthening our stakeholder relationships, benefitting the port communities that we visit and maintaining our financial strength. In today’s
business world, the viability of our business and our reputation depend on being more sustainable and transparent. Sustainability is integral to our business interests. We understand that measuring, managing and reporting on our progress and challenges help us to promote organizational accountability. This improves our company’s performance and creates tangible value for our business, guests and stakeholders. As detailed in our Corporate Health, Environmental, Safety & Security (HESS) Policy, we are committed to fully complying with or exceeding all legal and statutory requirements related to health, environment, safety and security throughout our business activities. This is particularly challenging amid the myriad of current and emerging regulations. Some of these regulations are environmental, relating to emissions of sulfur oxides (SOx), nitrogen oxides (NOx), and greenhouse gases emissions, and to wastewater disposal. Others relate to how we manage the safety and security of our guests and ships and how we care for our seafaring employees. Nevertheless, our commitment to compliance remains unwavering. As a corporation, we strive to go beyond compliance as part of our commitment to sustainability. For example, climate change is a very serious topic that can directly and indirectly affect our business. Merchant shipping today accounts for about 2.7% of the world’s total greenhouse gas emissions1, and the cruise industry comprises a relatively small fraction of merchant shipping. However, we take the responsibility to do our part to address climate change, along with other sustainability-related issues very seriously. We have set an overall corporate target of a 20% reduction from our 2005 baseline in the intensity of carbon dioxide emissions from shipboard operations by 2015. We are achieving this target primarily by reducing the energy consumption of our existing ships and by building more energy efficient ships. Based on current progress, we expect to achieve this target. We have been recognized for our efforts by socially
1 Second IMO GHG Study 2009, International Maritime Organization
CARNIVAL CORPORATION & PLC • Sustainability Report, Fiscal Year 2010
6
responsible investment rating agencies and have been named to: The FTSE4Good Index. The Carbon Disclosure Leadership Index. The Maplecroft Climate Innovation Index. These agencies objectively assess companies with respect to globally recognized corporate responsibility standards. However, the journey ahead will present many challenges and opportunities, and we recognize that our future success and delivery on our sustainability plans and goals are inextricably linked. As an industry leader, we are committed to and accountable for growing and operating sustainably. The publication of this, our first Corporate Sustainability Report and the similar reports by our brands, continues our sustainability initiatives that began over six years ago, when Carnival Corporation & plc wholeheartedly embraced our role in maintaining the oceans, vistas and pristine islands to which we owe our livelihood. As we progress on this journey, we continue to provide our stakeholders with our views on the important sustainability aspects that are included in this report. Publication of sustainability reports has enabled us to benchmark our collective performance and to identify opportunities for improvement. This reporting
process is of value to our business because it permits us to: Explain how we manage the environmental and
other sustainability aspects of our operations. Share best practices and lessons learned among
ships and brands. Identify and address opportunities for
improvement. Develop mechanisms for closing gaps in data
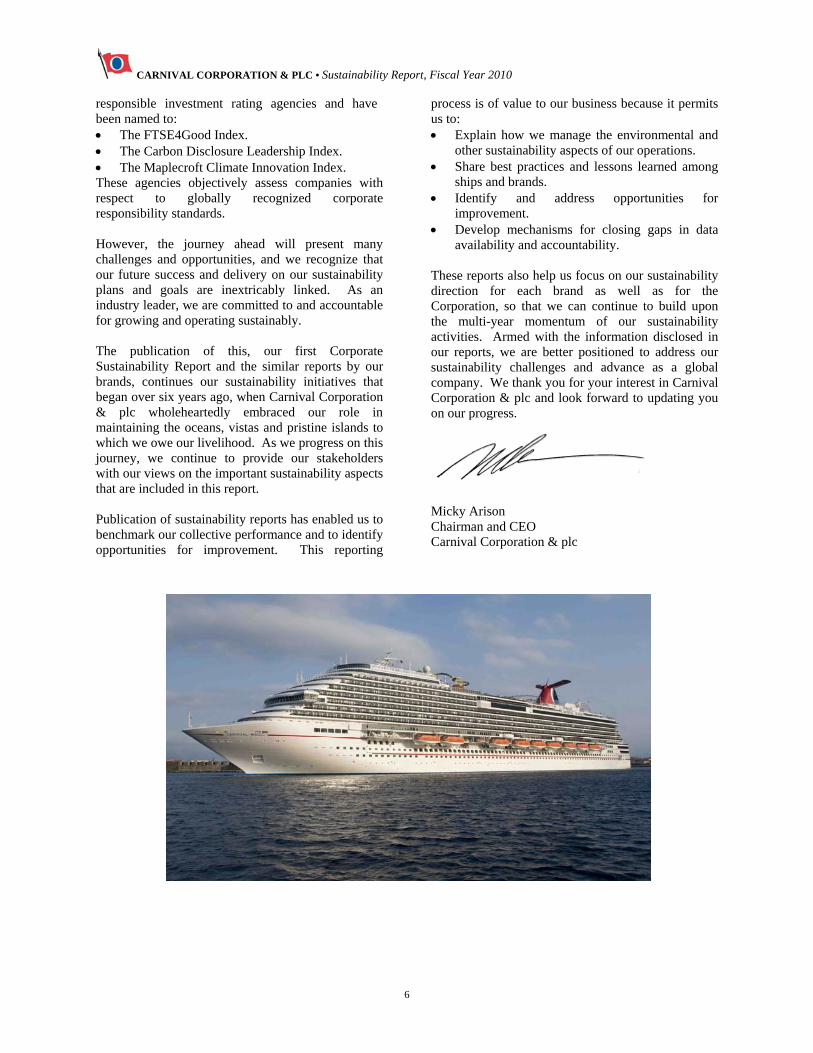
availability and accountability. These reports also help us focus on our sustainability direction for each brand as well as for the Corporation, so that we can continue to build upon the multi-year momentum of our sustainability activities. Armed with the information disclosed in our reports, we are better positioned to address our sustainability challenges and advance as a global company. We thank you for your interest in Carnival Corporation & plc and look forward to updating you on our progress.
Micky Arison Chairman and CEO Carnival Corporation & plc
CARNIVAL CORPORATION & PLC • Sustainability Report, Fiscal Year 2010
7
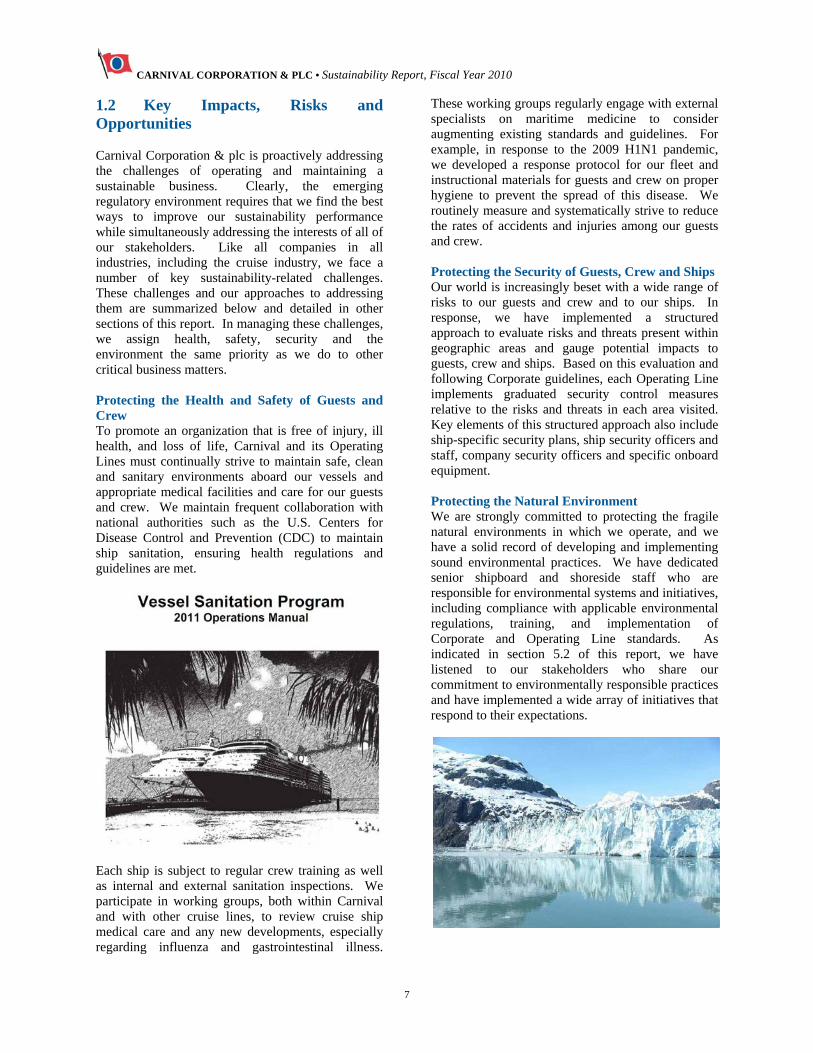
1.2 Key Impacts, Risks and Opportunities Carnival Corporation & plc is proactively addressing the challenges of operating and maintaining a sustainable business. Clearly, the emerging regulatory environment requires that we find the best ways to improve our sustainability performance while simultaneously addressing the interests of all of our stakeholders. Like all companies in all industries, including the cruise industry, we face a number of key sustainability-related challenges. These challenges and our approaches to addressing them are summarized below and detailed in other sections of this report. In managing these challenges, we assign health, safety, security and the environment the same priority as we do to other critical business matters. Protecting the Health and Safety of Guests and Crew To promote an organization that is free of injury, ill health, and loss of life, Carnival and its Operating Lines must continually strive to maintain safe, clean and sanitary environments aboard our vessels and appropriate medical facilities and care for our guests and crew. We maintain frequent collaboration with national authorities such as the U.S. Centers for Disease Control and Prevention (CDC) to maintain ship sanitation, ensuring health regulations and guidelines are met.
Each ship is subject to regular crew training as well as internal and external sanitation inspections. We participate in working groups, both within Carnival and with other cruise lines, to review cruise ship medical care and any new developments, especially regarding influenza and gastrointestinal illness.
These working groups regularly engage with external specialists on maritime medicine to consider augmenting existing standards and guidelines. For example, in response to the 2009 H1N1 pandemic, we developed a response protocol for our fleet and instructional materials for guests and crew on proper hygiene to prevent the spread of this disease. We routinely measure and systematically strive to reduce the rates of accidents and injuries among our guests and crew. Protecting the Security of Guests, Crew and Ships Our world is increasingly beset with a wide range of risks to our guests and crew and to our ships. In response, we have implemented a structured approach to evaluate risks and threats present within geographic areas and gauge potential impacts to guests, crew and ships. Based on this evaluation and following Corporate guidelines, each Operating Line implements graduated security control measures relative to the risks and threats in each area visited. Key elements of this structured approach also include ship-specific security plans, ship security officers and staff, company security officers and specific onboard equipment. Protecting the Natural Environment We are strongly committed to protecting the fragile natural environments in which we operate, and we have a solid record of developing and implementing sound environmental practices. We have dedicated senior shipboard and shoreside staff who are responsible for environmental systems and initiatives, including compliance with applicable environmental regulations, training, and implementation of Corporate and Operating Line standards. As indicated in section 5.2 of this report, we have listened to our stakeholders who share our commitment to environmentally responsible practices and have implemented a wide array of initiatives that respond to their expectations.
CARNIVAL CORPORATION & PLC • Sustainability Report, Fiscal Year 2010
8
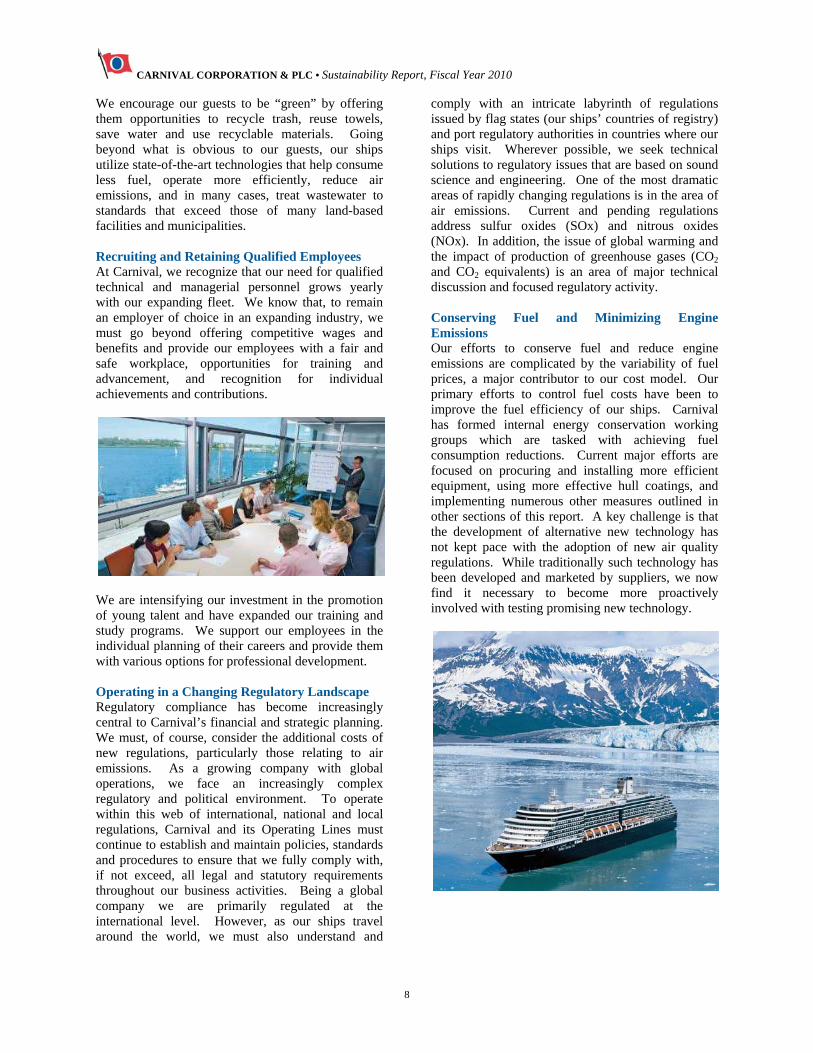
We encourage our guests to be “green” by offering them opportunities to recycle trash, reuse towels, save water and use recyclable materials. Going beyond what is obvious to our guests, our ships utilize state-of-the-art technologies that help consume less fuel, operate more efficiently, reduce air emissions, and in many cases, treat wastewater to standards that exceed those of many land-based facilities and municipalities. Recruiting and Retaining Qualified Employees At Carnival, we recognize that our need for qualified technical and managerial personnel grows yearly with our expanding fleet. We know that, to remain an employer of choice in an expanding industry, we must go beyond offering competitive wages and benefits and provide our employees with a fair and safe workplace, opportunities for training and advancement, and recognition for individual achievements and contributions.
We are intensifying our investment in the promotion of young talent and have expanded our training and study programs. We support our employees in the individual planning of their careers and provide them with various options for professional development. Operating in a Changing Regulatory Landscape Regulatory compliance has become increasingly central to Carnival’s financial and strategic planning. We must, of course, consider the additional costs of new regulations, particularly those relating to air emissions. As a growing company with global operations, we face an increasingly complex regulatory and political environment. To operate within this web of international, national and local regulations, Carnival and its Operating Lines must continue to establish and maintain policies, standards and procedures to ensure that we fully comply with, if not exceed, all legal and statutory requirements throughout our business activities. Being a global company we are primarily regulated at the international level. However, as our ships travel around the world, we must also understand and
comply with an intricate labyrinth of regulations issued by flag states (our ships’ countries of registry) and port regulatory authorities in countries where our ships visit. Wherever possible, we seek technical solutions to regulatory issues that are based on sound science and engineering. One of the most dramatic areas of rapidly changing regulations is in the area of air emissions. Current and pending regulations address sulfur oxides (SOx) and nitrous oxides (NOx). In addition, the issue of global warming and the impact of production of greenhouse gases (CO2 and CO2 equivalents) is an area of major technical discussion and focused regulatory activity. Conserving Fuel and Minimizing Engine Emissions Our efforts to conserve fuel and reduce engine emissions are complicated by the variability of fuel prices, a major contributor to our cost model. Our primary efforts to control fuel costs have been to improve the fuel efficiency of our ships. Carnival has formed internal energy conservation working groups which are tasked with achieving fuel consumption reductions. Current major efforts are focused on procuring and installing more efficient equipment, using more effective hull coatings, and implementing numerous other measures outlined in other sections of this report. A key challenge is that the development of alternative new technology has not kept pace with the adoption of new air quality regulations. While traditionally such technology has been developed and marketed by suppliers, we now find it necessary to become more proactively involved with testing promising new technology.
CARNIVAL CORPORATION & PLC • Sustainability Report, Fiscal Year 2010
9
Transparency on Sustainability Performance and Accountability In response to “greenwashing” by some, trusted third parties – both formal institutions and ad hoc consumer groups – are becoming the arbiters of defining, measuring and evaluating what constitutes a “sustainable” business. External reporting of carbon footprints and other indicators of ecological, economic and social impacts are being interwoven into business processes. Clarity and transparency about sustainability and environmental performance and targets are key parts of our policy. Mr. Arison has said, “We need to have sustainability reports and access for guests to voice their concerns about our operations and the environment.” Carnival receives many enquiries on environmental and sustainability performance from a wide variety of stakeholders. Many questions can be answered by educating stakeholders concerning our actual processes and the proactive approaches we are taking. Occasionally someone points something we are not doing as well as we could. We respond by correcting the mistake and fixing or creating a process to prevent a recurrence, if necessary. We answer each enquiry to explain what we have done to correct the issue. All questions are welcome and we respond to them.
Publishing sustainability reports is one way for us to be transparent and to educate our stakeholders (including consumers) about our commitment to improved sustainability and environmental performance. Costa Cruises and AIDA Cruises were the first Carnival brands to take this approach, which
they did five years ago. In 2010, Carnival’s Operating Lines, with the exception of Ibero Cruises, our newest member, produced such reports. Sustainability reports that are focused specifically on individual operating companies are more meaningful to some stakeholders, while an overall corporate report better meets the needs of most stakeholders. We therefore decided to publish a single Corporate Sustainability Report in 2011 based on FY2010 performance. In addition, each Operating Line has the option of publishing an individual complementary report where they decide it is appropriate.
In his address to the Global Maritime Environmental Congress in Hamburg in September 2010, Mr. Arison said: “Protecting the environment is the right thing to do… but making public pronouncements means nothing if they are not backed up by industry commitments – and long-term ones. Above all, when it comes to the environment, we need to be part of the solution, not part of the problem.”
CARNIVAL CORPORATION & PLC • Sustainability Report, Fiscal Year 2010
10
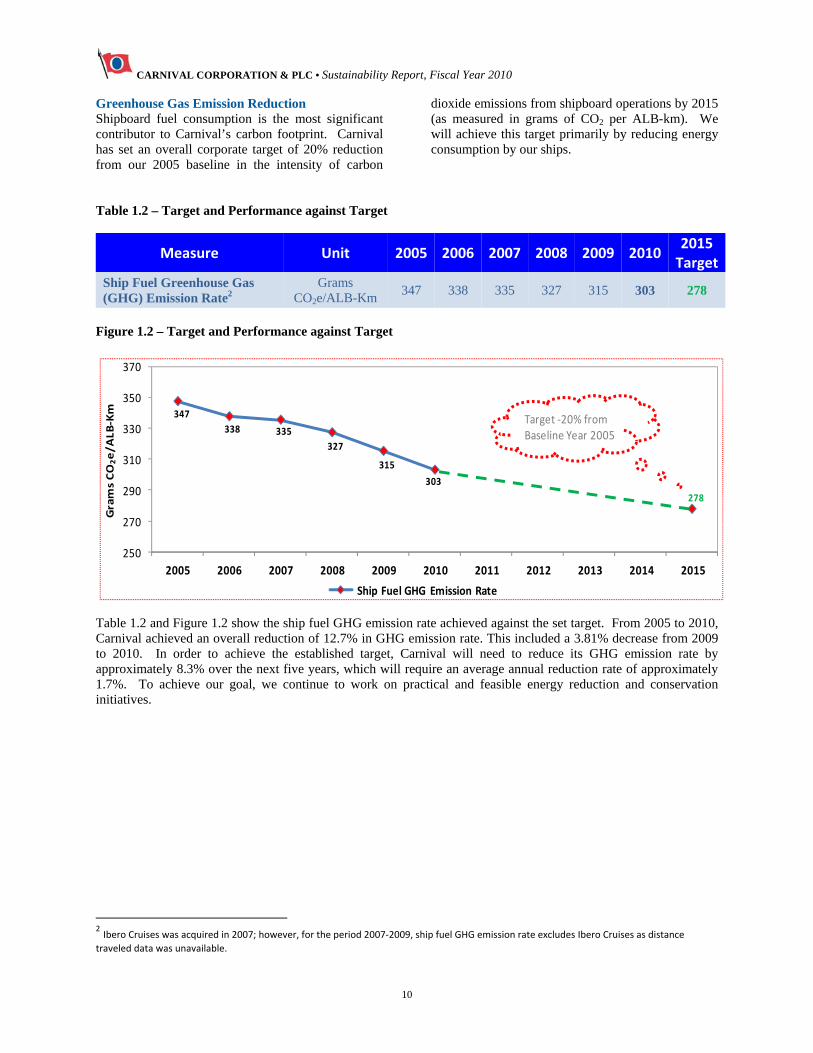
Greenhouse Gas Emission Reduction Shipboard fuel consumption is the most significant contributor to Carnival’s carbon footprint. Carnival has set an overall corporate target of 20% reduction from our 2005 baseline in the intensity of carbon
dioxide emissions from shipboard operations by 2015 (as measured in grams of CO2 per ALB-km). We will achieve this target primarily by reducing energy consumption by our ships.
Table 1.2 – Target and Performance against Target
Measure Unit 2005 2006 2007 2008 2009 20102015 Target
Ship Fuel Greenhouse Gas (GHG) Emission Rate2
Grams CO2e/ALB-Km
347 338 335 327 315 303 278
Figure 1.2 – Target and Performance against Target
347
338 335
327
315
303
278
250
270
290
310
330
350
370
2005 2006 2007 2008 2009 2010 2011 2012 2013 2014 2015
Grams CO2e/ALB‐Km
Ship Fuel GHG Emission Rate
Target ‐20% from Baseline Year 2005
Table 1.2 and Figure 1.2 show the ship fuel GHG emission rate achieved against the set target. From 2005 to 2010, Carnival achieved an overall reduction of 12.7% in GHG emission rate. This included a 3.81% decrease from 2009 to 2010. In order to achieve the established target, Carnival will need to reduce its GHG emission rate by approximately 8.3% over the next five years, which will require an average annual reduction rate of approximately 1.7%. To achieve our goal, we continue to work on practical and feasible energy reduction and conservation initiatives.
2 Ibero Cruises was acquired in 2007; however, for the period 2007‐2009, ship fuel GHG emission rate excludes Ibero Cruises as distance
traveled data was unavailable.
CARNIVAL CORPORATION & PLC • Sustainability Report, Fiscal Year 2010
11
2 About Carnival Corporation & plc 2.1 Company Name The name of this company is Carnival Corporation & plc, referred to in this report as “Carnival”. Carnival Corporation & plc has a subsidiary Operating Line, Carnival Cruise Lines, referred to in this report as “Carnival Cruise Lines”. 2.2 Primary Brands and Services Carnival is the largest and financially strongest cruise company and among the largest and most profitable vacation companies in the world. Our mission is to deliver exceptional vacation experiences through many of the world’s best-known cruise brands that cater to a variety of different geographic regions and lifestyles, all at an outstanding value unrivalled on land or at sea.
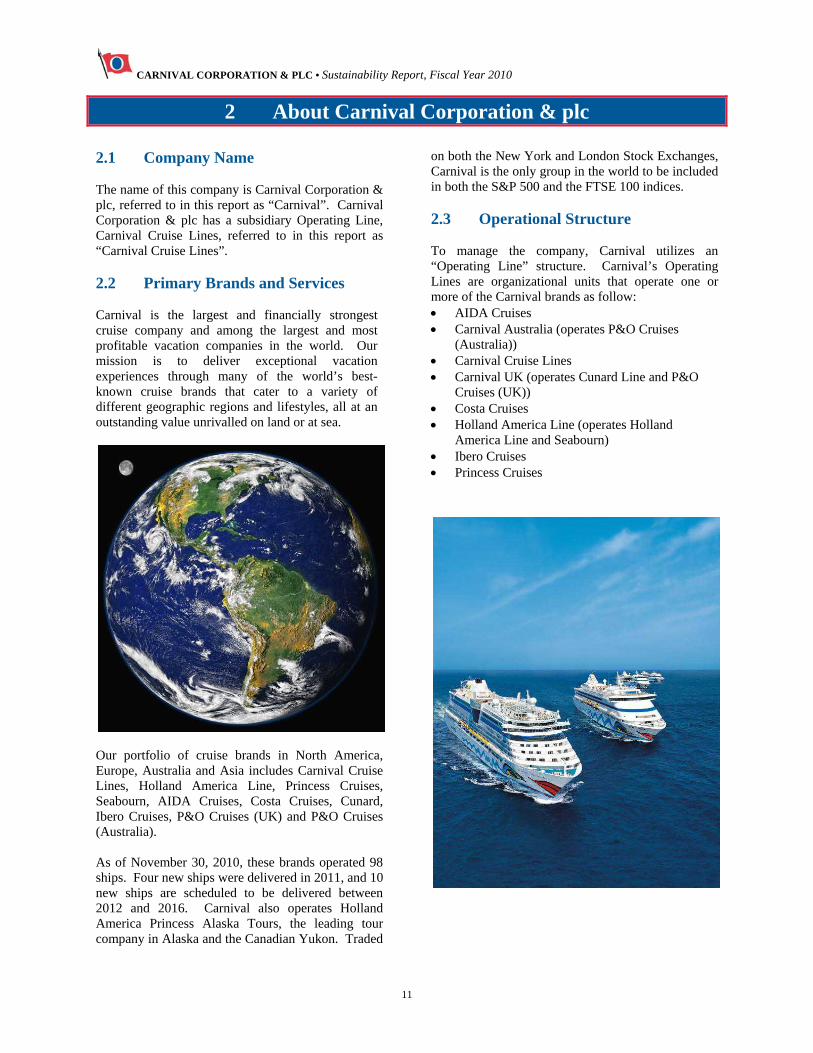
Our portfolio of cruise brands in North America, Europe, Australia and Asia includes Carnival Cruise Lines, Holland America Line, Princess Cruises, Seabourn, AIDA Cruises, Costa Cruises, Cunard, Ibero Cruises, P&O Cruises (UK) and P&O Cruises (Australia). As of November 30, 2010, these brands operated 98 ships. Four new ships were delivered in 2011, and 10 new ships are scheduled to be delivered between 2012 and 2016. Carnival also operates Holland America Princess Alaska Tours, the leading tour company in Alaska and the Canadian Yukon. Traded
on both the New York and London Stock Exchanges, Carnival is the only group in the world to be included in both the S&P 500 and the FTSE 100 indices. 2.3 Operational Structure To manage the company, Carnival utilizes an “Operating Line” structure. Carnival’s Operating Lines are organizational units that operate one or more of the Carnival brands as follow: AIDA Cruises Carnival Australia (operates P&O Cruises
(Australia)) Carnival Cruise Lines Carnival UK (operates Cunard Line and P&O
Cruises (UK)) Costa Cruises Holland America Line (operates Holland
America Line and Seabourn) Ibero Cruises Princess Cruises
CARNIVAL CORPORATION & PLC • Sustainability Report, Fiscal Year 2010
12
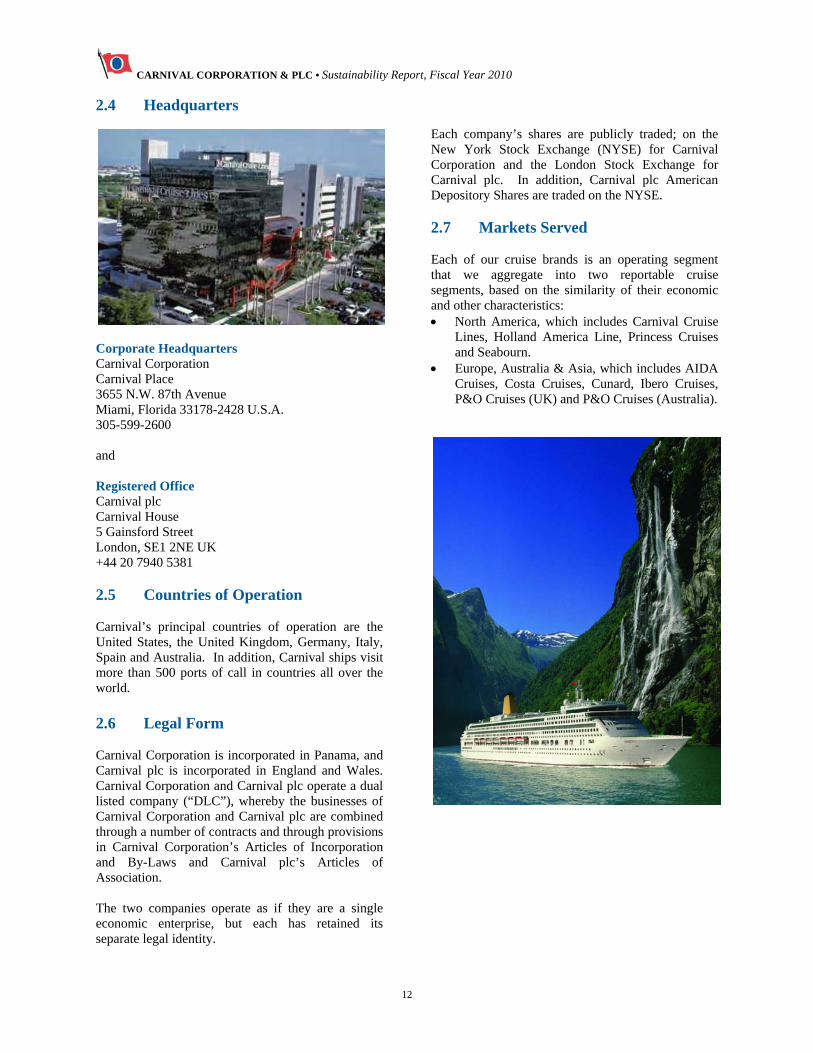
2.4 Headquarters
Corporate Headquarters Carnival Corporation Carnival Place 3655 N.W. 87th Avenue Miami, Florida 33178-2428 U.S.A. 305-599-2600 and Registered Office Carnival plc Carnival House 5 Gainsford Street London, SE1 2NE UK +44 20 7940 5381 2.5 Countries of Operation Carnival’s principal countries of operation are the United States, the United Kingdom, Germany, Italy, Spain and Australia. In addition, Carnival ships visit more than 500 ports of call in countries all over the world. 2.6 Legal Form Carnival Corporation is incorporated in Panama, and Carnival plc is incorporated in England and Wales. Carnival Corporation and Carnival plc operate a dual listed company (“DLC”), whereby the businesses of Carnival Corporation and Carnival plc are combined through a number of contracts and through provisions in Carnival Corporation’s Articles of Incorporation and By-Laws and Carnival plc’s Articles of Association. The two companies operate as if they are a single economic enterprise, but each has retained its separate legal identity.
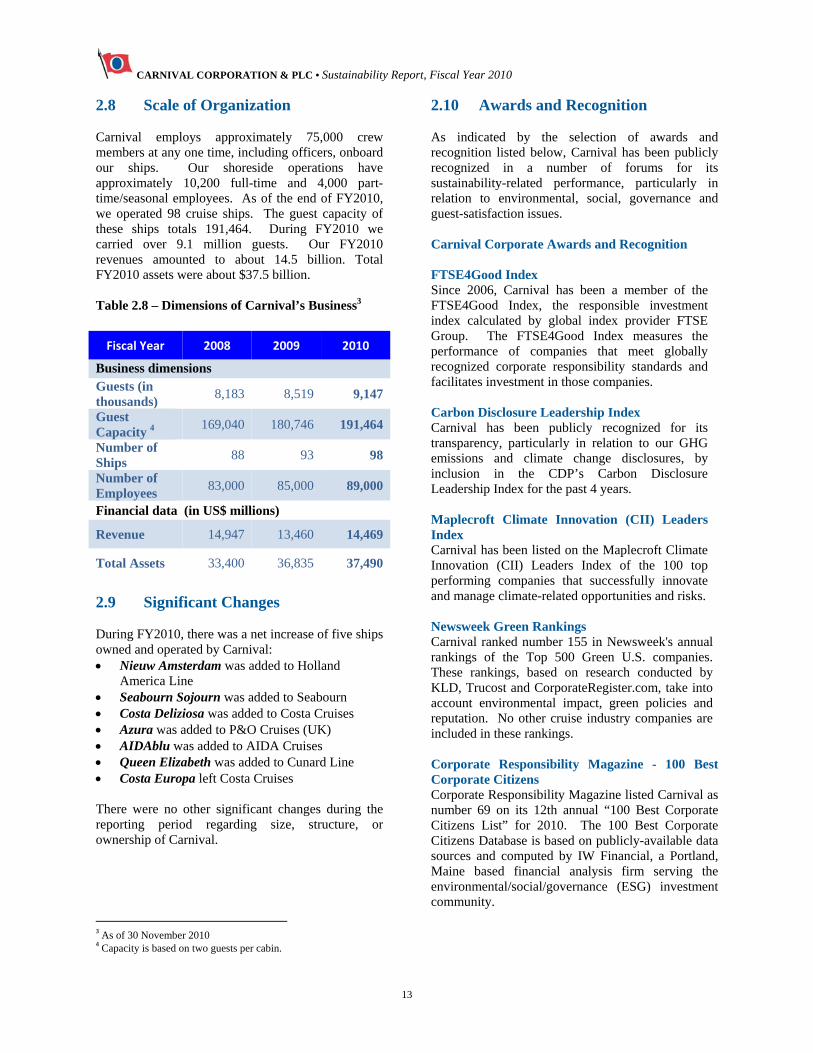
Each company’s shares are publicly traded; on the New York Stock Exchange (NYSE) for Carnival Corporation and the London Stock Exchange for Carnival plc. In addition, Carnival plc American Depository Shares are traded on the NYSE. 2.7 Markets Served Each of our cruise brands is an operating segment that we aggregate into two reportable cruise segments, based on the similarity of their economic and other characteristics: North America, which includes Carnival Cruise
Lines, Holland America Line, Princess Cruises and Seabourn.
Europe, Australia & Asia, which includes AIDA Cruises, Costa Cruises, Cunard, Ibero Cruises, P&O Cruises (UK) and P&O Cruises (Australia).
CARNIVAL CORPORATION & PLC • Sustainability Report, Fiscal Year 2010
13
2.8 Scale of Organization Carnival employs approximately 75,000 crew members at any one time, including officers, onboard our ships. Our shoreside operations have approximately 10,200 full-time and 4,000 part-time/seasonal employees. As of the end of FY2010, we operated 98 cruise ships. The guest capacity of these ships totals 191,464. During FY2010 we carried over 9.1 million guests. Our FY2010 revenues amounted to about 14.5 billion. Total FY2010 assets were about $37.5 billion. Table 2.8 – Dimensions of Carnival’s Business3
Fiscal Year 2008 2009 2010
Business dimensions Guests (in thousands)
8,183 8,519 9,147
Guest Capacity 4
169,040 180,746 191,464
Number of Ships
88 93 98
Number of Employees
83,000 85,000 89,000
Financial data (in US$ millions)
Revenue 14,947 13,460 14,469
Total Assets 33,400 36,835 37,490
2.9 Significant Changes During FY2010, there was a net increase of five ships owned and operated by Carnival: Nieuw Amsterdam was added to Holland
America Line Seabourn Sojourn was added to Seabourn Costa Deliziosa was added to Costa Cruises Azura was added to P&O Cruises (UK) AIDAblu was added to AIDA Cruises Queen Elizabeth was added to Cunard Line Costa Europa left Costa Cruises There were no other significant changes during the reporting period regarding size, structure, or ownership of Carnival.
3 As of 30 November 2010 4 Capacity is based on two guests per cabin.
2.10 Awards and Recognition As indicated by the selection of awards and recognition listed below, Carnival has been publicly recognized in a number of forums for its sustainability-related performance, particularly in relation to environmental, social, governance and guest-satisfaction issues. Carnival Corporate Awards and Recognition FTSE4Good Index Since 2006, Carnival has been a member of the FTSE4Good Index, the responsible investment index calculated by global index provider FTSE Group. The FTSE4Good Index measures the performance of companies that meet globally recognized corporate responsibility standards and facilitates investment in those companies. Carbon Disclosure Leadership Index Carnival has been publicly recognized for its transparency, particularly in relation to our GHG emissions and climate change disclosures, by inclusion in the CDP’s Carbon Disclosure Leadership Index for the past 4 years. Maplecroft Climate Innovation (CII) Leaders Index Carnival has been listed on the Maplecroft Climate Innovation (CII) Leaders Index of the 100 top performing companies that successfully innovate and manage climate-related opportunities and risks. Newsweek Green Rankings Carnival ranked number 155 in Newsweek's annual rankings of the Top 500 Green U.S. companies. These rankings, based on research conducted by KLD, Trucost and CorporateRegister.com, take into account environmental impact, green policies and reputation. No other cruise industry companies are included in these rankings. Corporate Responsibility Magazine - 100 Best Corporate Citizens Corporate Responsibility Magazine listed Carnival as number 69 on its 12th annual “100 Best Corporate Citizens List” for 2010. The 100 Best Corporate Citizens Database is based on publicly-available data sources and computed by IW Financial, a Portland, Maine based financial analysis firm serving the environmental/social/governance (ESG) investment community.
CARNIVAL CORPORATION & PLC • Sustainability Report, Fiscal Year 2010
14
Association of Fundraising Professionals The Association of Fundraising Professionals presented Carnival with their Outstanding Large Corporation Award on National Philanthropy Day in connection with our community involvement in Broward County, Florida. Mutual of America Mutual of America presented Carnival with their Community Partnership Award in connection with our School to Work Partnership with Big Brothers Big Sisters of Greater Miami (Florida). Miami-Dade County Public Schools (MDCPS) Miami-Dade County (Florida) Public Schools issued a Proclamation for Outstanding Community Leadership recognizing Carnival’s involvement with MDCPS’ career academy programs. Carnival Operating Line Awards and Recognition In addition, as indicated below, Carnival's Operating Lines received numerous public accolades for their sustainability efforts: Amver Awards 2010
In 2010 over 50 Carnival ships (from Carnival Cruise Lines, Cunard Line, Holland America Line, and Princess Cruises) received awards for their participation in the United States Coast Guard’s Amver (Automated Merchant Vessel Emergency Reporting) program. Amver is a unique, computer-based, and voluntary global ship reporting system used worldwide by search and rescue authorities to arrange for assistance to persons in distress at sea. Carnival Cruise Line
Cruise Critic Editor’s Pick Awards: Best for Budget-Friendly Cruising
Porthole Magazine Readers’ Choice Awards: o Best Value for the Money o Best Entertainment o Best Mexican Riviera Itineraries o Best Casinos o Best Web Site o Best Theme Cruises
Porthole Magazine Editor-in-Chief Award: Best Cruise Line Blog (Senior Cruise Director John Heald’s Blog)
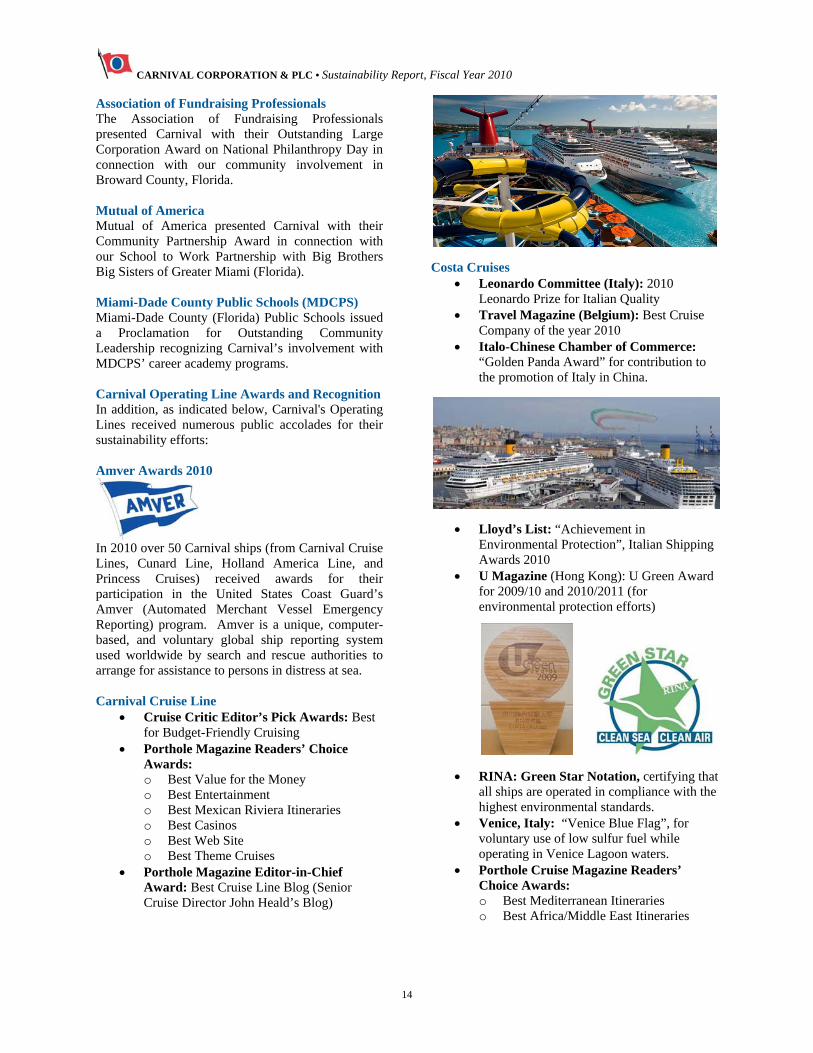
Costa Cruises
Leonardo Committee (Italy): 2010 Leonardo Prize for Italian Quality
Travel Magazine (Belgium): Best Cruise Company of the year 2010
Italo-Chinese Chamber of Commerce: “Golden Panda Award” for contribution to the promotion of Italy in China.
Lloyd’s List: “Achievement in Environmental Protection”, Italian Shipping Awards 2010
U Magazine (Hong Kong): U Green Award for 2009/10 and 2010/2011 (for environmental protection efforts)
RINA: Green Star Notation, certifying that all ships are operated in compliance with the highest environmental standards.
Venice, Italy: “Venice Blue Flag”, for voluntary use of low sulfur fuel while operating in Venice Lagoon waters.
Porthole Cruise Magazine Readers’ Choice Awards: o Best Mediterranean Itineraries o Best Africa/Middle East Itineraries
CARNIVAL CORPORATION & PLC • Sustainability Report, Fiscal Year 2010
15
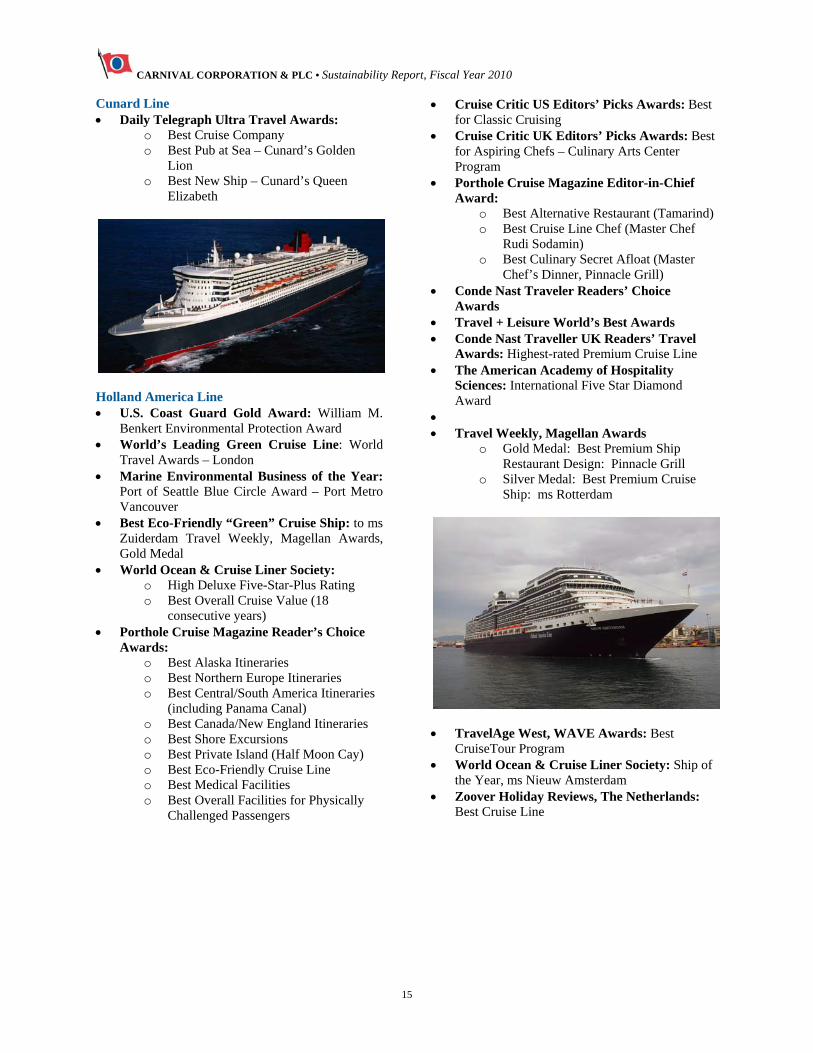
Cunard Line Daily Telegraph Ultra Travel Awards:
o Best Cruise Company o Best Pub at Sea – Cunard’s Golden
Lion o Best New Ship – Cunard’s Queen
Elizabeth
Holland America Line U.S. Coast Guard Gold Award: William M.
Benkert Environmental Protection Award World’s Leading Green Cruise Line: World
Travel Awards – London Marine Environmental Business of the Year:
Port of Seattle Blue Circle Award – Port Metro Vancouver
Best Eco-Friendly “Green” Cruise Ship: to ms Zuiderdam Travel Weekly, Magellan Awards, Gold Medal
World Ocean & Cruise Liner Society: o High Deluxe Five-Star-Plus Rating o Best Overall Cruise Value (18
consecutive years) Porthole Cruise Magazine Reader’s Choice
Awards: o Best Alaska Itineraries o Best Northern Europe Itineraries o Best Central/South America Itineraries
(including Panama Canal) o Best Canada/New England Itineraries o Best Shore Excursions o Best Private Island (Half Moon Cay) o Best Eco-Friendly Cruise Line o Best Medical Facilities o Best Overall Facilities for Physically
Challenged Passengers
Cruise Critic US Editors’ Picks Awards: Best for Classic Cruising
Cruise Critic UK Editors’ Picks Awards: Best for Aspiring Chefs – Culinary Arts Center Program
Porthole Cruise Magazine Editor-in-Chief Award:
o Best Alternative Restaurant (Tamarind) o Best Cruise Line Chef (Master Chef
Rudi Sodamin) o Best Culinary Secret Afloat (Master
Chef’s Dinner, Pinnacle Grill) Conde Nast Traveler Readers’ Choice
Awards Travel + Leisure World’s Best Awards Conde Nast Traveller UK Readers’ Travel
Awards: Highest-rated Premium Cruise Line The American Academy of Hospitality
Sciences: International Five Star Diamond Award
Travel Weekly, Magellan Awards
o Gold Medal: Best Premium Ship Restaurant Design: Pinnacle Grill
o Silver Medal: Best Premium Cruise Ship: ms Rotterdam
TravelAge West, WAVE Awards: Best
CruiseTour Program World Ocean & Cruise Liner Society: Ship of
the Year, ms Nieuw Amsterdam Zoover Holiday Reviews, The Netherlands:
Best Cruise Line
CARNIVAL CORPORATION & PLC • Sustainability Report, Fiscal Year 2010
16
P&O Cruises Travel Weekly Globe Awards: Favorite Cruise
Company Porthole Cruise Magazine – Reader’s Choice
Awards 2010: Best Cruise Website for Kids TTG Awards, Trade-facing Website of the
Year: Complete Cruise Solution website Travolution Awards: Best Cruise Website British Travel Awards:
o Cruise Line of the Year o Best Luxury Cruise Line o Best Mainstream Cruise Line
Cruise Critic Editor’s Pick Awards: o Best Cruise Line for Honeymoons o Best Ship for Cruising with Kids, P&O
Cruises Ventura
Princess Cruises: Port of Los Angeles: Environmental Green Flag
Award. Port of San Francisco:
o Environmental Green Award. o Cruise Ship Environmental Award to
Sea Princess. Venice, Italy: “Venice Blue Flag”, for
voluntary use of low sulfur fuel while operating in Venice Lagoon waters.
U.S. National Oceanic and Atmospheric Administration (NOAA): Weather Cruise Ship Company of the Year
Recommend Magazine Readers Choice: Best Cruise Line – Itineraries
Travel Weekly: “Best Cruise Line in Alaska” Condé Nast Traveler: Readers’ Choice Awards Cruise Critic Editors’ Picks Awards:
o Best for Weddings At Sea o Best Main Dining Room
Condé Nast Traveler: Readers’ Choice Awards Seabourn Cruise Critic Editor’s Pick Awards: Best for
Luxury
2.11 Additional Disclosures
Additional details relating to sections 2.2, 2.6, 2.7, and 2.8 are disclosed in the Carnival 2010 Annual Report to the Shareholders, and in the Annual Report on Form 10-K on the Carnival Corporate website (www.carnivalcorp.com).
CARNIVAL CORPORATION & PLC • Sustainability Report, Fiscal Year 2010
17
3 About This Report 3.1 Reporting Period This Corporate Sustainability Report provides information related to Carnival’s Fiscal Year 2010 (December 1, 2009 to November 30, 2010) for all of Carnival’s Operating Lines. This report is complemented by sustainability reports published by the following Carnival Operating Lines, also for Fiscal Year 2010: AIDA Cruises Carnival UK (P&O Cruises and Cunard Line) Costa Cruises P&O Cruises Australia 3.2 Previous Reports The Sustainability Reports published by our Operating Lines in 2010, which reflect Fiscal Year 2009 performance, culminated our sustainability “keel-laying” of five years earlier, when Carnival formally renewed its commitment to maintaining the oceans, vistas and pristine islands to which we owe our livelihood. As we progress on our sustainability voyage, we have also summarized the reports published to date, along with our views on the sustainability subjects that are of interest to our stakeholders. In 2005, we began a corporate-wide Environmental Management System (EMS) initiative. This comprehensive, planned approach to improving our environmental performance resulted, in 2006, in certification of all of our Operating Lines and ships in accordance with the ISO14001 EMS standard. Each Operating Line’s EMS outlines its commitment to compliance with applicable environmental legislation and regulations and lays the groundwork for addressing the immediate and long-term environmental impacts of our cruises on the oceans, the air, and the natural habitat of our destinations. In late 2006, our Corporate Environmental Compliance Department was expanded to become the Maritime Policy & Compliance Department, reflecting the Corporation’s need to uniformly coordinate and share Health, Environmental, Safety and Security (HESS) standards and best practices across the organization. With this change, we redefined responsibility and accountability for HESS performance at the highest levels of the company, streamlining how we develop policies and standards,
and assuring that we meet, if not exceed, all relevant regulatory requirements. In 2008, we made a commitment to expand our transparency by publicly disclosing the environmental, social and governance performance of each of our Operating Lines, using the internationally recognized Global Reporting Initiative (GRI) framework. This effort, which resulted in the publication of FY2009 Sustainability Reports by our Operating Lines in 2010, expanded on the annual public Environmental Management Reports that we first published in 2006 (for FY2005). 3.3 Reporting Cycle Carnival intends to publish an annual Sustainability Report on a fiscal year basis. 3.4 Contact Point For questions or to provide feedback regarding this report or its contents, please contact:
James R. Van Langen, P.E. Vice President Management Systems Maritime Policy & Compliance Carnival Corporation & plc 3655 N.W. 87th Avenue Miami, Florida 33178-2428 U.S.A.
Or e-mail us at: [email protected] 3.5 Defining Report Content Carnival and its subsidiary Operating Lines are members of a number of organizations that work together with key stakeholders to address sustainability issues in the cruise industry, in the broader maritime industry and with companies representing other industries. Sections 4.13 and 5.5.3 identify and describe our relationships with these organizations. Carnival and its subsidiary Operating Lines regularly and proactively engage with a very broad range of stakeholder groups (see Sections 4.14 and 4.15) that have interests in our sustainability policies, standards and performance. These groups comprise the primary intended audience for this report.
CARNIVAL CORPORATION & PLC • Sustainability Report, Fiscal Year 2010
18
Carnival systematically defined the content of this report by first listing all of the sustainability-related issues that were identified as a result of stakeholder engagements. These issues were then analyzed using a prioritization matrix approach that enabled us to identify the issues that are of greatest interest to our stakeholders. This matrix technique helped us to evaluate each issue to narrow down the field to those that are most material. Finally, we applied a process that enabled us to: Identify those issues that were currently being
reported on and/or measured internally. Select a core set of issues and identify a related
metrics reporting framework/process. Agree on the desired content for each metric and
the approach to reporting (qualitative vs. quantitative detailed performance tracking, etc.).
Decide use of metrics data for other purposes (making disclosure decisions, driving performance improvement, etc.).
3.6 Report Boundary This report encompasses the Operating Lines, cruise ships, and shoreside operations and facilities, worldwide, over which Carnival has operational control. 3.7 Limit on Report Scope This report covers and prioritizes information on the basis of the principles of materiality, sustainability context, and stakeholder inclusiveness. It includes entities that meet the criteria of being subject to Carnival's operational control. The information in this report includes significant actions or events in the reporting period and does not intentionally exclude relevant information that would influence or inform stakeholder assessments or decisions or that would reflect significant economic, environmental or social impacts. The scope of this report includes purchases of shipboard and shoreside energy (fuel and electricity), and related greenhouse gas emissions. However, it excludes the other aspects and performance indicators of Carnival's supply chain, shoreside facilities and shore excursion activities, the environmental impacts of which are relatively small in comparison to those of Carnival’s fleet of cruise ships.
3.8 Basis for Reporting As described above, this report is limited to those subsidiaries, facilities and operations over which Carnival has operational control. Since this is Carnival's first sustainability report, comparability with prior years is limited to environmental data, subject to restatements of certain previously reported environmental data (see Section 3.10).
3.9 Data Measurement and Calculations This report was developed in accordance with the G3 (third generation) Sustainability Reporting Guidelines of the Global Reporting Initiative (GRI). Sustainability performance data included in this report are based on information supplied to Carnival by its subsidiary Operating Lines and the fleets of cruise ships operated by each. This includes: Quantitative data that were collected, aggregated
and analyzed utilizing the Corporation’s in-house sustainability data collection and reporting systems.
Qualitative data that were collected from each of Carnival’s Operating Lines and from other in-house and industry sources.
Carnival understands the importance of data quality and strives to continuously improve our data collection and measurement techniques. Other sections of this report provide detailed information on data measurement and calculation approaches in relation to each performance indicator and the associated tables and graphs. We selected the 34 performance indicators in this report based on the economic, environmental and social issues of greatest interest to most of our stakeholders and which we determined to be material to Carnival. In most cases, we attempted to align our data gathering to follow the GRI indicator protocols as closely as possible. However, in some cases, due to the unique characteristics of our cruise business, we have deviated from strict adherence to the GRI indicator protocol requirements to reflect materiality. As mentioned in other sections of this report, Carnival does not always have full operational control of its shoreside activities. Therefore, we have excluded certain shoreside-related data from this report. Some of our Operating Lines have included shoreside performance indicators in their respective sustainability reports.
CARNIVAL CORPORATION & PLC • Sustainability Report, Fiscal Year 2010
19
3.10 Restatements Since this is Carnival's first sustainability report, comparability with prior years is relevant only for environmental data. Environmental Indicators As indicated in section 3.2 above, Carnival reported its environmental performance via Environmental Management Reports (EMRs) for Fiscal Years 2005-2008. However, in 2008, Carnival revised several of the environmental indicators used in the EMRs to improve the consistency of reporting from its subsidiaries. Therefore, the environmental data in this report cannot be compared with data reported in the 2005-2008 EMRs. We also changed several GHG emission factors to reflect new Global Warming Potentials published in scientific and guidance documents after 2008, as well as some of the factors used to calculate normalized intensity metrics, to permit more meaningful data comparisons. In 2008, we also changed the electricity and steam emissions factors for the various regions where we consumed electricity and steam. 3.11 Changes from Previous Reporting Periods Since this is Carnival's first corporate-level sustainability report, there are no changes from previous reporting periods in the scope, boundary, or measurement methods applied in the report for the economic and social indicators. However, as indicated in Section 3.10 above, the environmental indicators have changed from previous reports in terms of scope, boundary and measurement methods applied. This report includes more environmental performance aspects and indicators than previously reported. There has also been a significant boundary change; Ibero Cruises, which was acquired in 2007, is now included. However, except for absolute indicators related to fuel consumption, no other data from Ibero Cruises is available for FY2007-2009. For the current reporting period (FY2010), Ibero Cruises’ economic, environmental and social performance data is included in Section 5.0 of this report. Any exceptions are disclosed in the notes on the related data tables and graphs.
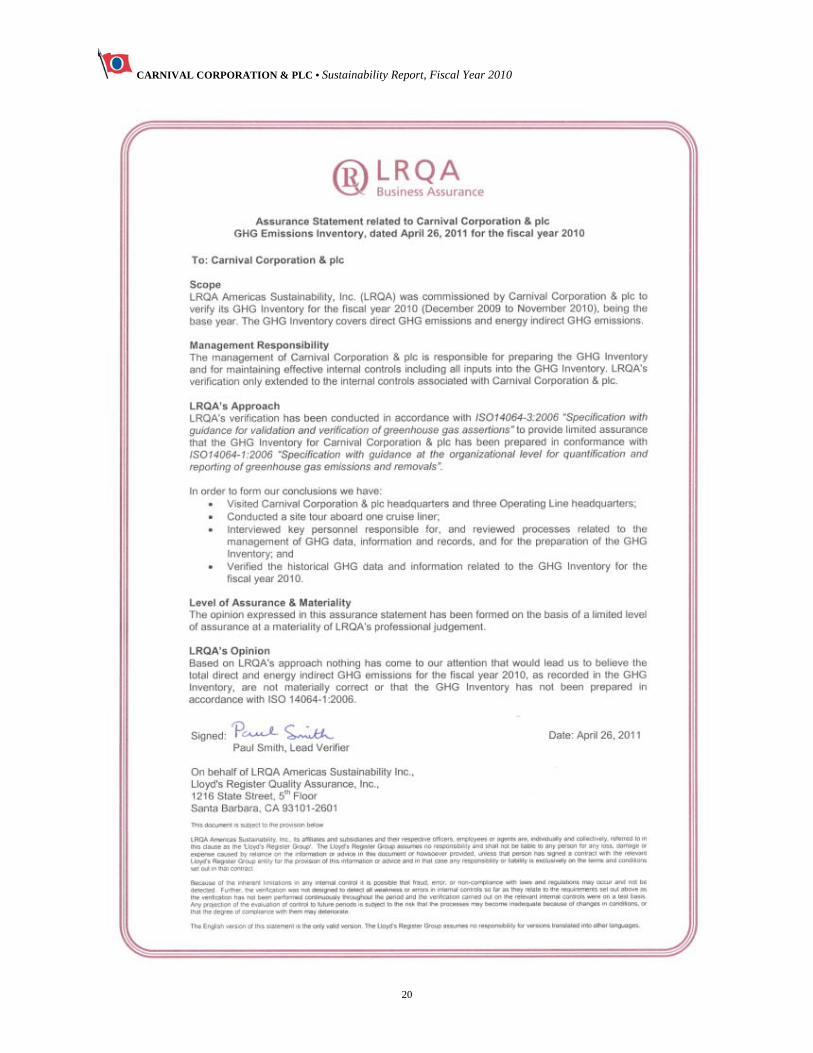
3.12 GRI Content Index The Table of Contents of this report follows and is numbered in accordance with the Standard Disclosures as listed in the GRI G3 Sustainability Reporting Guidelines. 3.13 Assurance Practices With the exception of Carnival's greenhouse gas (GHG) inventory and since this is our first sustainability report, Carnival has decided not to seek external assurance for this report. Carnival contracted with LRQA Americas Sustainability, Inc. (LRQA) to verify Carnival's GHG inventory for fiscal year 2010 (December 1, 2009 to November 30, 2010). Carnival's GHG inventory includes direct and indirect GHG emissions. LRQA is an independent, third-party verifier. LRQA's verification was conducted in accordance with ISO 14064-3:2006, "Greenhouse gases -- Part 3: Specification with guidance for the validation and verification of greenhouse gas assertions". This verification provided limited assurance that Carnival's GHG inventory has been prepared in conformance with ISO14063-1:2006, "Greenhouse gases -- Part 1: Specification with guidance at the organization level for quantification and reporting of greenhouse gas emissions and removals". The LRQA Assurance Statement follows.
CARNIVAL CORPORATION & PLC • Sustainability Report, Fiscal Year 2010
20
CARNIVAL CORPORATION & PLC • Sustainability Report, Fiscal Year 2010
21
4 Governance, Commitments and Engagement The governance policies and practices of Carnival, as outlined below, are further detailed in the “Corporate Governance” section of the Carnival website (www.carnivalcorp.com). 4.1 Governance Structure, Committees The governance structure of Carnival includes the following committees of the Boards of Directors, each of which has a specific charter, defined responsibilities and composition: Audit Committee Nominating & Governance Committee Executive Committee Compensation Committee Health, Environmental, Safety & Security
(HESS) Committee 4.2 Chair/CEO Separation The Chairman of Carnival is also the Chief Executive Officer, the reasons for which are detailed in the Corporate Governance Guidelines. 4.3 Board Members The membership of the Carnival Boards of Directors includes: Three members with executive functions Two non-executive directors Nine independent non-executive directors 4.4 Communication with Boards Mechanisms for shareholders and employees to provide recommendations or direction to the Boards of Directors are detailed under 'Communications between Shareholders and the Boards' on the Corporate website. 4.5 Compensation Linkage Linkages between compensation for members of the Boards of Directors, executives and senior managers, and the company’s financial, environmental, social and governance performance are described in the 'Compensation Committee’ section on the Corporate website.
4.6 Conflicts of Interest The processes for the Boards of Directors to ensure conflicts of interest are avoided are detailed in the Carnival Corporation & plc Code of Business Conduct and Ethics, available on the Corporate website. 4.7 Board Qualifications The process for determining the qualifications and expertise of the members of the Boards of Directors for guiding the Carnival strategy on economic, environmental and social topics is described in the Corporate Governance Guidelines on the Corporate website. 4.8 Economic, Environmental and Social Values Carnival recognizes our responsibility to provide industry leadership and to conduct our business as a responsible global citizen. Our corporate leadership is manifested in our Code of Business Conduct and Ethics and requires that every employee and member of the Boards of Directors use sound judgment, maintain high ethical standards and demonstrate honesty in all business dealings. As a responsible global citizen, we are ardently committed to achieving and maintaining the highest standards of professional and ethical conduct. In addition, Carnival’s Health, Environmental, Safety and Security (HESS) Policy describes our commitments to: Protecting the health, safety and security of our
guests, employees and all others working on behalf of the Company;
Protecting the environment, including the marine environment in which our vessels sail and the communities in which we operate;
Fully complying with or exceeding all legal and statutory requirements related to health, environment, safety and security throughout our business activities; and
Assigning health, environment, safety and security matters the same priority as other critical business matters.
The full text of our HESS Policy follows and is on our Corporate website.
CARNIVAL CORPORATION & PLC • Sustainability Report, Fiscal Year 2010
22
CARNIVAL CORPORATION & PLC • Sustainability Report, Fiscal Year 2010
23
4.9 Economic, Environmental and Social Oversight The Boards of Directors of Carnival Corporation and Carnival plc have established a Board-level Health, Environmental, Safety & Security (HESS) Committee to assist the Boards in fulfilling their responsibility to supervise and monitor HESS and sustainability-related policies, programs, initiatives at sea and onshore and compliance with HESS legal and regulatory requirements. The HESS Committee meets on at least a quarterly basis.
Carnival’s Corporate Maritime Policy & Compliance Department (MP&C) is headed by a Senior Vice President, with a full-time professional and administrative staff, and is responsible for providing a common, integrated approach to management of HESS matters and for reporting to the HESS Committee on such matters. The Senior Vice-President MP&C reports directly to Carnival’s Vice-Chairman/COO and to the Chairman of the HESS Committee of the Boards of Directors. The principal activities of MP&C include: Establishing HESS policy and standards Conducting HESS audits of Carnival’s Operating
Lines and ships Measuring and reporting on HESS-related
performance MP&C develops and assures implementation of
corporate maritime policy, standards and guidance based upon: The assessment of risk. Identification of best management practices. Changing and emerging regulations. Monitoring and responding to expectations of
internal and external stakeholders. Results of shipboard audits and Operating Line
headquarter reviews of HESS processes and performance.
Annually MP&C audits each Operating Line’s head office and one-third of each Line’s fleet of cruise ships. In 2010, MP&C performed 8 office audits and 33 shipboard audits. These were in addition to the internal audits performed by each Operating Line under their respective management systems and by external third-party certification and regulatory auditors. Each MP&C HESS audit is organized and planned to: Verify compliance with international and Flag
Administration rules, Corporate Standards, Operating Line policies and procedures, regulations, codes, and guidance directly involved in the safe conduct of ship operations.
Verify the effectiveness and efficiency of the shipboard and shore-side HESS management systems.
MP&C HESS audit results are used to: Determine compliance, effectiveness and
efficiency Analyze trends Support newbuild and retrofit decisions Report status to the HESS Committee and to
Operating Line management Promote best management practices MP&C provides the Boards of Directors, the HESS Committee and senior management with: Results and trends of operational incidents
regarding HESS areas Analysis and mitigation of identified risks Anticipated and actual impacts of new
regulations and expectations of internal and external stakeholders
Results of consolidated HESS audits Visibility of the Corporation’s sustainability-
related policies, programs, initiatives and performance
In addition, Carnival has established a hotline telephone number and website to permit reporting of
CARNIVAL CORPORATION & PLC • Sustainability Report, Fiscal Year 2010
24
HESS-related concerns. The hotline can be contacted at: 1-888-290-5105 (toll-free in North America) 1-305-406-5863 (from all other locations) www.carnivalcompliance.com 4.10 Board Evaluation The Carnival processes for evaluating the performance of the Boards of Directors are described in the Corporate Governance Guidelines on the Corporate website. 4.11 Commitments to External Initiatives - Precautionary Approach Risks and/or opportunities are identified and addressed by Carnival's formal Enterprise Risk Management (ERM) process in the risk categories of Regulatory and Brand Quality/Innovation. Risk assessment activities within ERM occur at two levels: risk categories and risk events. The outputs of the ERM process are communicated to the Boards of Directors on a bi-annual basis. In addition, supplemental ERM reporting is provided periodically to the Audit and HESS Committees. At the risk category level, biennial assessments are performed by management at each Operating Line who score each category in terms of impact, likelihood and other factors that increase or decrease the risk. This involves discussions among senior management of the Operating Lines and considers the underlying risk events in the overall evaluation. Risk categories are prioritized to create a high level company risk profile that is shared with the Boards of Directors as part of ERM reporting. Higher-scoring risk categories are subject to more in-depth evaluation, including a cross-company review of mitigation methods at the risk event level. This process is performed for a select number of high priority risks each year and involves reviews of the detailed elements of mitigation, identification of the "key elements" of mitigation and benchmarking among companies to identify gaps, best practices and areas of opportunity. It also involves assessments of the impact and likelihood of the risk events and an assessment of management’s capability to manage each risk. Defined scales are used for scoring. Areas of opportunities are translated into action plans, which are highlighted to senior Operating Line and corporate management and to the Boards of Directors. Once an in-depth mitigation analysis is completed for a risk category, the ERM process
continues to monitor the status of action plans and risk metrics to ensure the risk is being effectively managed. The ERM process is executed by risk committees established at each Operating Line and at corporate. These committees review risks, define action plans for improvement and support ERM reporting requirements. At the business unit level, each Operating Line has implemented an International Organization for Standardization (ISO) 14001 Environmental Management System (EMS) to address risks related to environmental regulations, including those related to climate change. Carnival has chosen a proactive approach to managing this issue by including greenhouse gas (GHG) emissions as a significant environmental aspect in the EMS of each Operating Line. This process is managed routinely by Operating Line management. In addition, as part of our management of regulatory risks, Carnival is developing a Regulatory Risk Map for use for strategic planning and corporate-wide dissemination of regulatory risk and related financial impacts. 4.12 Commitments to External Initiatives - Mandatory and Voluntary The Maritime Legal Environment Carnival ships are regulated by the various international, national, state and local laws, regulations and treaties in force in the jurisdictions in which our ships operate. Our ships are registered in the Bahamas, Bermuda, Italy, Malta, The Netherlands, Panama, Portugal and UK and are regulated by these Flag States and by the international conventions that govern health, environmental, safety and security matters in relation to guests, crewmembers and the ships. Representatives of each “Flag”, or country of registry, conduct periodic inspections, surveys and audits to verify compliance with these regulations. In addition, we are subject to the decrees, directives, regulations and other requirements of the more than 500 ports that our ships visit every year as they apply to the various aspects of ship operations. Carnival’s operations are distinctly different from those of typical shore-based companies and present unique challenges. The laws, regulations and other legal requirements applicable to our operations do not remain static based on a fixed geographic location, but change regularly, sometimes on a daily basis, depending on the itineraries of our ships and the ports and countries visited.
CARNIVAL CORPORATION & PLC • Sustainability Report, Fiscal Year 2010
25
Carnival ensures that all such legal and other requirements are taken into account when establishing, implementing and maintaining its health, environmental, safety and security management systems. Some of the principal laws, acts, codes, directives, legislation, protocols, statutes, rules and regulations with which Carnival must comply on a routine basis are listed below. The International Maritime Organization (IMO) The International Maritime Organization (IMO), headquartered in London, United Kingdom, is a specialized agency of the United Nations with 169 Member States and three Associate Members. The IMO's primary purpose is to develop and maintain a comprehensive regulatory framework for shipping. IMO’s areas of responsibility include safety, environmental concerns, legal matters, technical co-operation, maritime security and the efficiency of shipping. SOLAS, MARPOL and STCW, as described below, are the most important IMO conventions applicable to the sustainability-related aspects of Carnival’s operations. SOLAS The “International Convention for the Safety of Life at Sea, 1974, as amended” (SOLAS) specifies minimum standards for the construction, equipment and operation of ships, compatible with their safety. Flag States are responsible for ensuring that ships under their flag comply with its requirements, and a number of certificates are prescribed in the Convention as proof that this has been done. SOLAS includes twelve Chapters, nine of which apply to Carnival’s operations: Chapter I - General Provisions Chapter II-1 - Construction - Subdivision and
stability, machinery and electrical installations Chapter II-2 - Fire protection, fire detection and
fire extinction Chapter III - Life-saving appliances and
arrangements Chapter IV – Radiocommunications Chapter V - Safety of navigation Chapter IX - Management for the safe operation
of ships Chapter XI-1 - Special measures to enhance
maritime safety Chapter XI-2 - Special measures to enhance
maritime security Chapter IX of SOLAS, Management for the Safe Operation of Ships, includes “The International Management Code for the Safe Operation of Ships and for Pollution Prevention” (the ISM Code), which
is the international standard for the safe management and operation of ships and for pollution prevention. The ISM Code requires the development, implementation and Flag certification of the Safety Management Systems (which includes environmental protection) of each of Carnival’s Operating Lines and of each individual ship. Certifications include a “Document of Compliance” (DOC) for each shoreside office, and a “Safety Management Certificate” (SMC) for each ship. Chapter XI-2 of SOLAS, Special measures to enhance maritime security, includes the “International Ship and Port Facilities Security Code” (ISPS Code), which is a comprehensive set of measures to enhance the security of ships and port facilities, developed in response to the perceived threats to ships and port facilities in the wake of the 9/11 attacks in the United States. The ISPS Code takes the approach that ensuring the security of ships and port facilities is a risk management activity and that, to determine what security measures are appropriate, an assessment of the risks must be made in each particular case. The purpose of the Code is to provide a standardized, consistent framework for evaluating risk, enabling governments to offset changes in threat with changes in vulnerability for ships and port facilities through determination of appropriate security levels and corresponding security measures. MARPOL The “International Convention for the Prevention of Pollution from Ships, 1973, as modified by the Protocol of 1978 relating thereto and by the Protocol of 1997” (MARPOL) is the primary international convention covering prevention of pollution of the marine environment by ships from routine operational or accidental causes. MARPOL includes six technical Annexes, four of which apply to Carnival’s operations: Annex I, Regulations for the Prevention of
Pollution by Oil Annex IV, Regulations for the Prevention of
Pollution by Sewage from Ships Annex V, Regulations for the Prevention of
Pollution by Garbage from Ships Annex VI, Regulations for the Prevention of Air
Pollution from Ships
CARNIVAL CORPORATION & PLC • Sustainability Report, Fiscal Year 2010
26
STCW The “International Convention on Standards of Training, Certification and Watchkeeping for Seafarers as amended, including the 1995 and 2010 Manila Amendments” (STCW) establishes requirements on training, certification and watchkeeping for seafarers on an international level. STCW prescribes minimum standards relating to training, certification and watchkeeping for seafarers which countries are obliged to meet or exceed. STCW includes eight chapters, all of which apply to Carnival’s operations: Chapter I: General provisions Chapter II: Master and deck department Chapter III: Engine department Chapter IV: Radiocommunication and radio
personnel Chapter V: Special training requirements for
personnel on certain types of ships Chapter VI: Emergency, occupational safety,
medical care and survival functions Chapter VII: Alternative certification Chapter VIII: Watchkeeping International Labour Organization (ILO) The ILO is the United Nations agency responsible for drawing up and overseeing international labor standards. It is the only 'tripartite' UN agency that brings together representatives of governments, employers and workers to jointly shape policies and programs promoting decent work for all. This arrangement enables the ILO to incorporate 'real world' knowledge about employment and work. Over the last 80 years more than 68 international labor standards related to the maritime sector were
developed and adopted by the ILO and have been implemented, as applicable, to Carnival’s operations. These international labor standards address a broad range of subjects related to the employment of people who work on ships, including: Minimum requirements for seafarers to work on
a ship Conditions of employment Accommodation, recreational facilities, food and
catering Health protection, medical care, welfare and
social security protection Compliance and enforcement In 2006, the ILO published the “Maritime Labour Convention (MLC), 2006” (MLC2006), which provides comprehensive rights and protection at work for the world's more than 1.2 million seafarers. This new labor standard consolidates and updates the above standards into a single document. The Convention sets out seafarers' rights to decent conditions of work on a wide range of subjects, and aims to be globally applicable, easily understandable, readily updatable and uniformly enforced. MLC2006 was designed to become a global instrument known as the "fourth pillar" of the international regulatory regime for quality shipping, complementing the key IMO Conventions (SOLAS, MARPOL and STCW). MLC2006 is expected to enter into force in late 2012 or early 2013. Carnival already complies with many of the provisions of this new Convention, and will be fully compliant when it becomes mandatory.
CARNIVAL CORPORATION & PLC • Sustainability Report, Fiscal Year 2010
27
Worldwide Environmental Regulations Besides MARPOL, some examples of the broad range of other environmental regulations that govern our operations are shown in Table 4.12. Table 4.12 – Environmental Regulations
Environmental Regulations Purpose
Flag state marine environmental rules and regulations To regulate the environmental aspects of our ships based on the laws of the countries where our ships are registered.
Port state marine environmental rules and regulations To regulate the environmental aspects of our ships based on the laws of the countries and areas where our ships operate.
International, regional, national and local regulations limiting the sulfur content of fuels
To reduce sulfur oxide (SOx) emissions from ships.
Directive 2000/59/EC of the European Parliament and of the Council 27 November 2000
To reduce discharges of ship-generated waste and cargo residues to sea.
European Council Directive of 12 December 1991 on hazardous waste (91/689/EEC) amending Directive 78/319/ EEC on hazardous waste
To define hazardous waste and how it is to be managed.
U.S. Act to Prevent Pollution from Ships To implement MARPOL and regulate air and water pollution from ships in U.S. waters
U.S. Clean Water Act (CWA) To set standards for effluent discharges to U.S. bodies of water and territorial waters to prevent pollution.
U.S. Vessel General Permit (VGP)
To regulate discharges incidental to the normal operation of vessels when is U.S. waters.
U.S. Clean Air Act (CAA) To protect the U.S. public from exposure to airborne pollutants that is hazardous to human health.
U.S. Resource Conservation and Recovery Act (RCRA) To regulate hazardous waste management and disposal practices.
Alaska Cruise Ship Legislation To regulate water, air and waste from cruise ships operating in Alaskan waters.
Hawaii Cruise Ship Legislation To regulate water, air and waste from cruise ships operating in Hawaiian waters.
Ballast Water Management Regulations of the U.S. Coast Guard, California, IMO, Canada, Bermuda and in Europe
To prevent impacts to marine and aquatic life from non-indigenous species.
The Montreal Protocol To phase out the production and use of ozone-depleting substances.
Voluntary Guidelines:
Memorandum of Understanding Cruise Operations in Washington State
Florida Department of Environmental Protection Memorandum of Understanding
Cruise Lines International Association standards
To provide guidelines for responsible handling and disposal of various waste streams that is not governed by other regulations.
CARNIVAL CORPORATION & PLC • Sustainability Report, Fiscal Year 2010
28
Cruise Industry Standards Through the Cruise Lines International Association (CLIA – see sections 4.13 and 5.5.3), Carnival helped to develop and has adopted and implemented a number of voluntary industry standards and guidelines that exceed minimum regulatory requirements and address a wide variety of subjects that foster a safe, secure and healthy cruise ship environment, including: Accessibility - to help accommodate guests with
disabilities Anti-corruption principles Environmental protection Gambling guidelines Medical facilities guidelines Safety and security of guests and crew Safety standards related to balcony fire
protection, smoke alarms, infant lifejackets, helicopter pickup areas, and tender operator qualifications and training
Shipboard workplace code of conduct Vessel sanitation CLIA Environmental Standard Carnival helped to develop and has adopted and implemented the CLIA Environmental Standard, “Cruise Industry Waste Management Practices and Procedures”, as a corporate standard applicable to all Carnival ships. This standard is based on principles that include: Designing and constructing cruise ships to be
environmentally friendly Embracing new technology Complying fully with international and U.S.
environmental laws Minimizing waste production Maintaining cooperative relationships with the
regulatory community This CLIA Environmental Standard includes requirements related to environmentally responsible handling and disposal of: Photo processing waste, including x-ray
development fluid Dry-cleaning waste fluids and contaminated
materials Print shop waste fluids Photo copying and laser printer cartridges Unused and outdated pharmaceuticals Fluorescent and mercury vapor lamp bulbs Batteries Bilge and oily water residues Glass, cardboard, aluminum and steel cans Incinerator ash
Gray water Black water The CLIA Environmental Standard also includes requirements for environmental awareness and training programs for ships’ crewmembers and promoting environmental awareness among guests. This Standard is incorporated into the Environmental Management Systems of Carnival’s Operating Lines. 4.13 Commitments to External Initiatives - Memberships Carnival and its subsidiary Operating Lines are members of, and actively participate in, the following organizations, whose members work together and with key stakeholders to address a broad range of sustainability issues in the cruise industry, in the broader maritime industry and with companies representing other industries: Cruise Lines International Association Florida Caribbean Cruise Association European Cruise Council International Chamber of Shipping/International
Shipping Federation European Community Shipowners’ Associations The Chamber of Shipping (UK) Ship Emission Abatement and Trading (SEAaT) Global Environmental Management Initiative
(GEMI) 4.14 Stakeholder Engagement - Stakeholders Engaged Carnival and its subsidiary Operating Lines regularly and proactively engage with a very broad range of stakeholder groups that have interests in our sustainability policies, standards and performance. Such stakeholder groups include: Guests Employees Home and destination port communities Travel professionals Suppliers Media Non-governmental organizations (NGOs) Government agencies Investors Business organizations
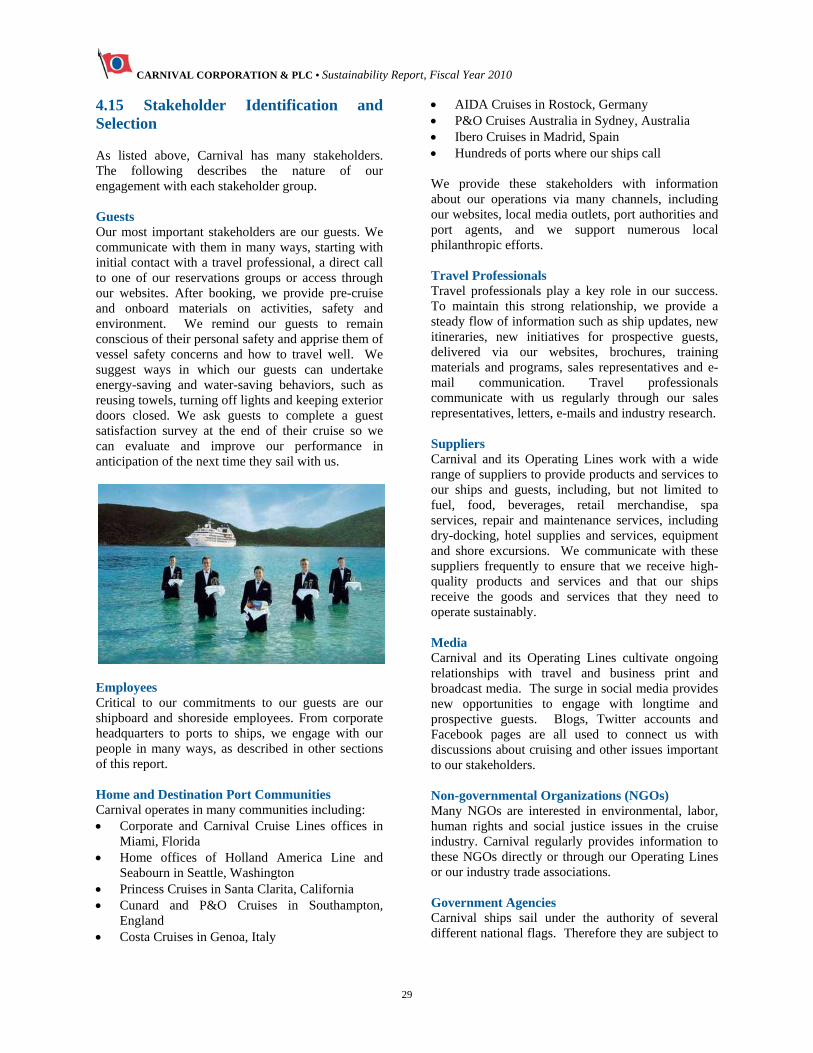
CARNIVAL CORPORATION & PLC • Sustainability Report, Fiscal Year 2010
29
4.15 Stakeholder Identification and Selection As listed above, Carnival has many stakeholders. The following describes the nature of our engagement with each stakeholder group. Guests Our most important stakeholders are our guests. We communicate with them in many ways, starting with initial contact with a travel professional, a direct call to one of our reservations groups or access through our websites. After booking, we provide pre-cruise and onboard materials on activities, safety and environment. We remind our guests to remain conscious of their personal safety and apprise them of vessel safety concerns and how to travel well. We suggest ways in which our guests can undertake energy-saving and water-saving behaviors, such as reusing towels, turning off lights and keeping exterior doors closed. We ask guests to complete a guest satisfaction survey at the end of their cruise so we can evaluate and improve our performance in anticipation of the next time they sail with us.
Employees Critical to our commitments to our guests are our shipboard and shoreside employees. From corporate headquarters to ports to ships, we engage with our people in many ways, as described in other sections of this report. Home and Destination Port Communities Carnival operates in many communities including: Corporate and Carnival Cruise Lines offices in
Miami, Florida Home offices of Holland America Line and
Seabourn in Seattle, Washington Princess Cruises in Santa Clarita, California Cunard and P&O Cruises in Southampton,
England Costa Cruises in Genoa, Italy
AIDA Cruises in Rostock, Germany P&O Cruises Australia in Sydney, Australia Ibero Cruises in Madrid, Spain Hundreds of ports where our ships call
We provide these stakeholders with information about our operations via many channels, including our websites, local media outlets, port authorities and port agents, and we support numerous local philanthropic efforts. Travel Professionals Travel professionals play a key role in our success. To maintain this strong relationship, we provide a steady flow of information such as ship updates, new itineraries, new initiatives for prospective guests, delivered via our websites, brochures, training materials and programs, sales representatives and e-mail communication. Travel professionals communicate with us regularly through our sales representatives, letters, e-mails and industry research. Suppliers Carnival and its Operating Lines work with a wide range of suppliers to provide products and services to our ships and guests, including, but not limited to fuel, food, beverages, retail merchandise, spa services, repair and maintenance services, including dry-docking, hotel supplies and services, equipment and shore excursions. We communicate with these suppliers frequently to ensure that we receive high-quality products and services and that our ships receive the goods and services that they need to operate sustainably. Media Carnival and its Operating Lines cultivate ongoing relationships with travel and business print and broadcast media. The surge in social media provides new opportunities to engage with longtime and prospective guests. Blogs, Twitter accounts and Facebook pages are all used to connect us with discussions about cruising and other issues important to our stakeholders. Non-governmental Organizations (NGOs) Many NGOs are interested in environmental, labor, human rights and social justice issues in the cruise industry. Carnival regularly provides information to these NGOs directly or through our Operating Lines or our industry trade associations. Government Agencies Carnival ships sail under the authority of several different national flags. Therefore they are subject to
CARNIVAL CORPORATION & PLC • Sustainability Report, Fiscal Year 2010
30
the maritime laws of these nations wherever our ships are located. International, national and local regulations may also govern our shipboard and land-based operations. We are often involved with the development of regulations that apply to our business either directly, through our Operating Lines or through our industry trade associations. Carnival provides information to elected officials to keep them informed about issues of importance to our company, our employees and our industry. We may provide this information directly, through Carnival, through our Operating Lines or through our industry associations. Investors Carnival Corporation & plc manages all of its shareholder communications. Carnival routinely responds to and engages with investors, investor groups and investor advisory groups inquiring about Carnival’s sustainability, corporate social responsibility and environmental policies, practices and performance. Business Organizations Carnival participates in public policy development and lobbying on behalf of all of its subsidiary Operating Lines both directly and through our associations with a number of business organizations, including those listed in Section 4.13. Public policy positions to which Carnival subscribes are expressed on the websites of these organizations.
4.16 Approaches to Stakeholder Engagement Carnival has identified the issues and stakeholders that appear to be most important for long-term success. Through active, ongoing communications, we develop common understandings of the issues relevant to the challenges faced, including industry-specific aspects and technical terminology. There is usually mutual agreement on the type of engagement between Carnival and stakeholders such as types of meetings (group meetings, one-on-ones, meeting frequency, information exchanges, roles of each party, etc.). The engagement process ensures that all stakeholders can raise their concerns. Results of the engagement process are reported to the stakeholders involved. 4.17 Stakeholder Engagement Results The contents of this report reflect the key topics and concerns that have been raised through our stakeholder engagements and how Carnival has responded to these topics and concerns. The contents of this report were defined as a result of the processes detailed in Section 3.5.
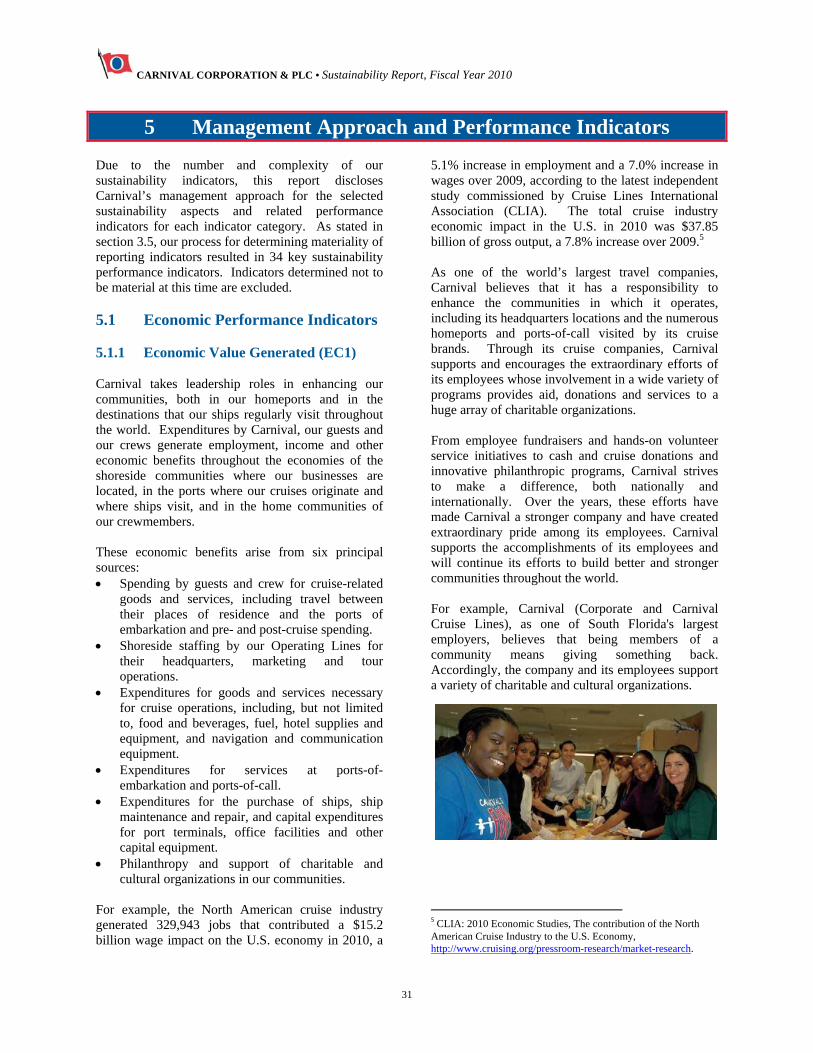
CARNIVAL CORPORATION & PLC • Sustainability Report, Fiscal Year 2010
31
5 Management Approach and Performance Indicators Due to the number and complexity of our sustainability indicators, this report discloses Carnival’s management approach for the selected sustainability aspects and related performance indicators for each indicator category. As stated in section 3.5, our process for determining materiality of reporting indicators resulted in 34 key sustainability performance indicators. Indicators determined not to be material at this time are excluded. 5.1 Economic Performance Indicators 5.1.1 Economic Value Generated (EC1) Carnival takes leadership roles in enhancing our communities, both in our homeports and in the destinations that our ships regularly visit throughout the world. Expenditures by Carnival, our guests and our crews generate employment, income and other economic benefits throughout the economies of the shoreside communities where our businesses are located, in the ports where our cruises originate and where ships visit, and in the home communities of our crewmembers. These economic benefits arise from six principal sources: Spending by guests and crew for cruise-related
goods and services, including travel between their places of residence and the ports of embarkation and pre- and post-cruise spending.
Shoreside staffing by our Operating Lines for their headquarters, marketing and tour operations.
Expenditures for goods and services necessary for cruise operations, including, but not limited to, food and beverages, fuel, hotel supplies and equipment, and navigation and communication equipment.
Expenditures for services at ports-of-embarkation and ports-of-call.
Expenditures for the purchase of ships, ship maintenance and repair, and capital expenditures for port terminals, office facilities and other capital equipment.
Philanthropy and support of charitable and cultural organizations in our communities.
For example, the North American cruise industry generated 329,943 jobs that contributed a $15.2 billion wage impact on the U.S. economy in 2010, a
5.1% increase in employment and a 7.0% increase in wages over 2009, according to the latest independent study commissioned by Cruise Lines International Association (CLIA). The total cruise industry economic impact in the U.S. in 2010 was $37.85 billion of gross output, a 7.8% increase over 2009.5 As one of the world’s largest travel companies, Carnival believes that it has a responsibility to enhance the communities in which it operates, including its headquarters locations and the numerous homeports and ports-of-call visited by its cruise brands. Through its cruise companies, Carnival supports and encourages the extraordinary efforts of its employees whose involvement in a wide variety of programs provides aid, donations and services to a huge array of charitable organizations. From employee fundraisers and hands-on volunteer service initiatives to cash and cruise donations and innovative philanthropic programs, Carnival strives to make a difference, both nationally and internationally. Over the years, these efforts have made Carnival a stronger company and have created extraordinary pride among its employees. Carnival supports the accomplishments of its employees and will continue its efforts to build better and stronger communities throughout the world. For example, Carnival (Corporate and Carnival Cruise Lines), as one of South Florida's largest employers, believes that being members of a community means giving something back. Accordingly, the company and its employees support a variety of charitable and cultural organizations.
5 CLIA: 2010 Economic Studies, The contribution of the North
American Cruise Industry to the U.S. Economy, http://www.cruising.org/pressroom-research/market-research.
CARNIVAL CORPORATION & PLC • Sustainability Report, Fiscal Year 2010
32
Carnival's support is coordinated through the Carnival Foundation, which oversees the company's many philanthropic efforts, as well as its employee-driven service group, the "Friends Uniting Neighbors (F.U.N.) Team." Although Carnival's contributions are wide-ranging, the Carnival Foundation primarily focuses on organizations that are based in South Florida, where the company is headquartered, and in its homeport communities throughout the U.S. During times of crisis, Carnival works closely with various national and international relief organizations, coordinating corporate and employee donations for emergencies such as hurricanes in the U.S. and Caribbean. Carnival Cruise Lines shipboard personnel also do their part to help our communities, participating in beach clean ups and donating their time and talent to orphanages and children's charities throughout the Caribbean and other regions.
Over the past five years, Carnival and its employees have contributed more than $30 million in financial contributions and in-kind donations to a variety of local and national charities. We follow the example set by Carnival's founder, the late Ted Arison, and continued by his son, Chairman and CEO Micky Arison. Carnival and its employees strive to make South Florida and other homeport communities’ a better place to live and work. Further information on the economic and social impact of Carnival’s operations on our communities is found in Section 5.5.1 and on the websites of Carnival’s subsidiary Operating Lines.
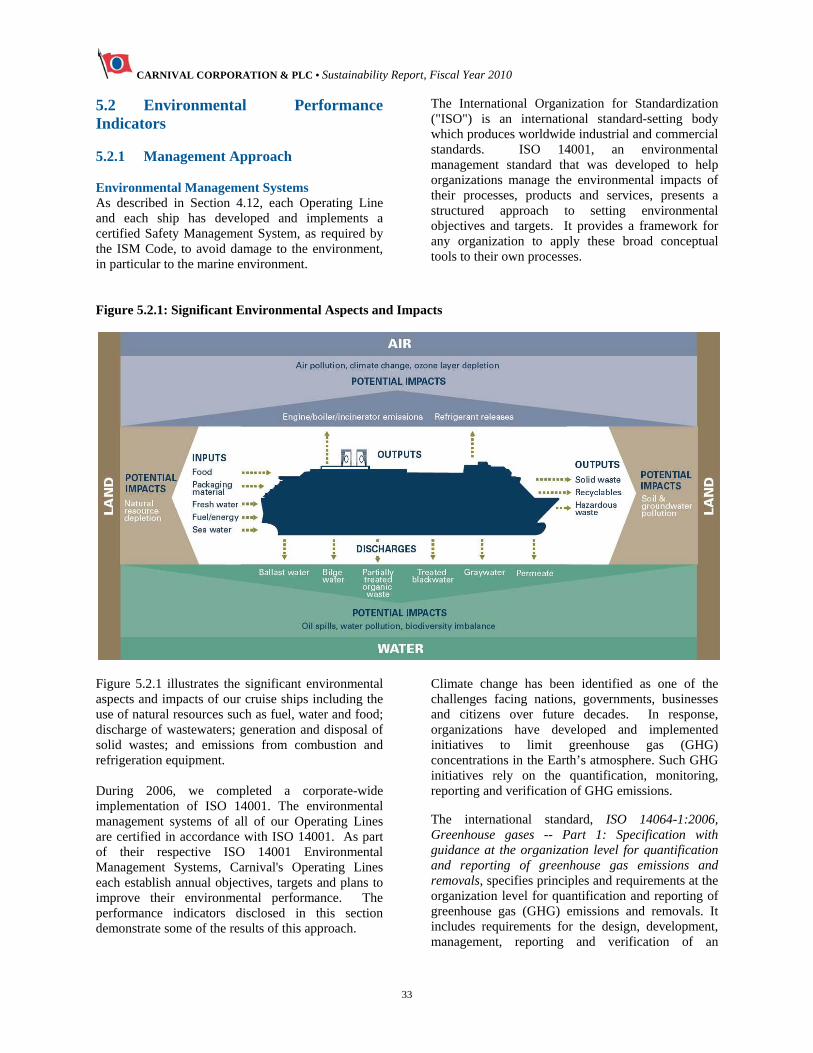
CARNIVAL CORPORATION & PLC • Sustainability Report, Fiscal Year 2010
33
5.2 Environmental Performance Indicators 5.2.1 Management Approach Environmental Management Systems As described in Section 4.12, each Operating Line and each ship has developed and implements a certified Safety Management System, as required by the ISM Code, to avoid damage to the environment, in particular to the marine environment.
The International Organization for Standardization ("ISO") is an international standard-setting body which produces worldwide industrial and commercial standards. ISO 14001, an environmental management standard that was developed to help organizations manage the environmental impacts of their processes, products and services, presents a structured approach to setting environmental objectives and targets. It provides a framework for any organization to apply these broad conceptual tools to their own processes.
Figure 5.2.1: Significant Environmental Aspects and Impacts
Figure 5.2.1 illustrates the significant environmental aspects and impacts of our cruise ships including the use of natural resources such as fuel, water and food; discharge of wastewaters; generation and disposal of solid wastes; and emissions from combustion and refrigeration equipment. During 2006, we completed a corporate-wide implementation of ISO 14001. The environmental management systems of all of our Operating Lines are certified in accordance with ISO 14001. As part of their respective ISO 14001 Environmental Management Systems, Carnival's Operating Lines each establish annual objectives, targets and plans to improve their environmental performance. The performance indicators disclosed in this section demonstrate some of the results of this approach.
Climate change has been identified as one of the challenges facing nations, governments, businesses and citizens over future decades. In response, organizations have developed and implemented initiatives to limit greenhouse gas (GHG) concentrations in the Earth’s atmosphere. Such GHG initiatives rely on the quantification, monitoring, reporting and verification of GHG emissions.
The international standard, ISO 14064-1:2006, Greenhouse gases -- Part 1: Specification with guidance at the organization level for quantification and reporting of greenhouse gas emissions and removals, specifies principles and requirements at the organization level for quantification and reporting of greenhouse gas (GHG) emissions and removals. It includes requirements for the design, development, management, reporting and verification of an
CARNIVAL CORPORATION & PLC • Sustainability Report, Fiscal Year 2010
34
organization's GHG inventory. The Greenhouse Gas Protocol Corporate Standard provides standards and guidance for companies and other organizations preparing a GHG emissions inventory.
Carnival has developed a GHG Inventory Management Plan (GHG IMP) in accordance with the requirements of the ISO 14064-1:2006 and The Greenhouse Gas Protocol. The plan also meets the requirements specified by the independent third party GHG verifier selected by Carnival.
Carnival’s GHG IMP describes the policies, procedures, and other management system elements that are used to design and develop, collect, calculate, verify, manage, and report information about Carnival’s GHG inventory and emissions. The GHG IMP applies to related material activities (shipboard and shore) that result in GHG emissions.
Corporate Environmental Standards Carnival has developed and implemented a series of Corporate Standards that go considerably beyond the requirements of current environmental laws and regulations. These standards address: Refrigeration Technician Training Refrigerant Recovery Units Black and Gray Water Management Bilgewater and Oily Waste Management Underwater Paint Coatings Grease Trap – Grease/Oil/Residue Disposal Waste Management Hazardous Materials Management & Hazard
Communications Environmental Management System (EMS)
Certification Environmental Organization and Reporting
Structure Environmental Awareness and Training Corporate Environmental Auditing and
Monitoring Environmental Accountability and Reporting Reporting of Ship and Shore Facility Incidents Waste Reduction We use the classic three-pronged management approach to effectively minimize our waste generation: Reducing: We take steps to reduce the volume
and toxicity of our waste. o Volume of waste is reduced by: Bulk purchasing Acquiring only what we need when
we need it
Working with suppliers to reduce packaging.
Using alternative products to accomplish the same job
o Treating waste onboard to minimize volume by stacking, shredding, crushing and incinerating
o Toxicity of waste is reduced by: Purchasing non-toxic products Controlling material purchases with
an “approved chemicals list” o Replacing older equipment with new
equipment designed for non-toxic products
Reusing: We look for opportunities to reuse
materials and equipment onboard or find others who can use things we no longer need. For example:
o Carnival ships calling on ports around the world donated over 23 tons of usable items such as mattresses and clothing.
o In 2010, Holland America Line’s “Ship to Shelter” program donated partially used toiletries and other reusable goods to non-profit organizations in home ports around the U.S.
Recycling: We off-load solid wastes and liquid
waste (sludge oil and used cooking oil) for recycling at ports around the world.
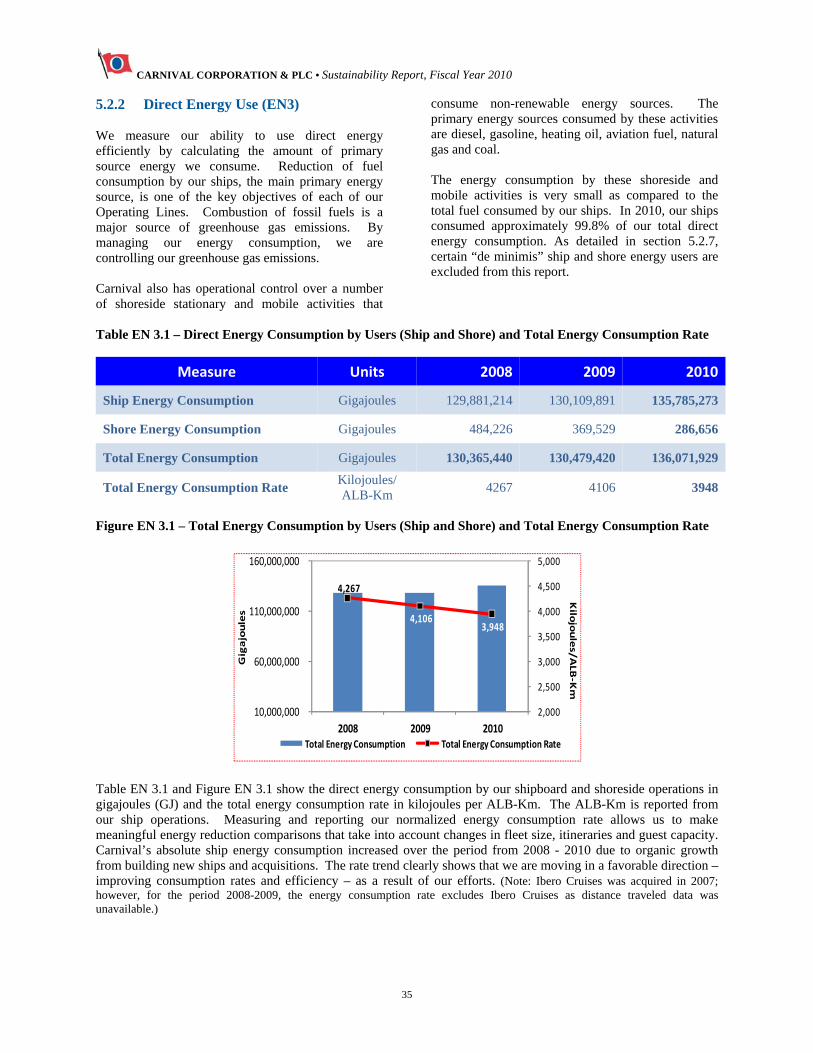
CARNIVAL CORPORATION & PLC • Sustainability Report, Fiscal Year 2010
35
5.2.2 Direct Energy Use (EN3) We measure our ability to use direct energy efficiently by calculating the amount of primary source energy we consume. Reduction of fuel consumption by our ships, the main primary energy source, is one of the key objectives of each of our Operating Lines. Combustion of fossil fuels is a major source of greenhouse gas emissions. By managing our energy consumption, we are controlling our greenhouse gas emissions. Carnival also has operational control over a number of shoreside stationary and mobile activities that
consume non-renewable energy sources. The primary energy sources consumed by these activities are diesel, gasoline, heating oil, aviation fuel, natural gas and coal. The energy consumption by these shoreside and mobile activities is very small as compared to the total fuel consumed by our ships. In 2010, our ships consumed approximately 99.8% of our total direct energy consumption. As detailed in section 5.2.7, certain “de minimis” ship and shore energy users are excluded from this report.
Table EN 3.1 – Direct Energy Consumption by Users (Ship and Shore) and Total Energy Consumption Rate
Measure Units 2008 2009 2010
Ship Energy Consumption Gigajoules 129,881,214 130,109,891 135,785,273
Shore Energy Consumption Gigajoules 484,226 369,529 286,656
Total Energy Consumption Gigajoules 130,365,440 130,479,420 136,071,929
Total Energy Consumption Rate Kilojoules/ ALB-Km
4267 4106 3948
Figure EN 3.1 – Total Energy Consumption by Users (Ship and Shore) and Total Energy Consumption Rate
Table EN 3.1 and Figure EN 3.1 show the direct energy consumption by our shipboard and shoreside operations in gigajoules (GJ) and the total energy consumption rate in kilojoules per ALB-Km. The ALB-Km is reported from our ship operations. Measuring and reporting our normalized energy consumption rate allows us to make meaningful energy reduction comparisons that take into account changes in fleet size, itineraries and guest capacity. Carnival’s absolute ship energy consumption increased over the period from 2008 - 2010 due to organic growth from building new ships and acquisitions. The rate trend clearly shows that we are moving in a favorable direction – improving consumption rates and efficiency – as a result of our efforts. (Note: Ibero Cruises was acquired in 2007; however, for the period 2008-2009, the energy consumption rate excludes Ibero Cruises as distance traveled data was unavailable.)
4,267
4,106 3,948
2,000
2,500
3,000
3,500
4,000
4,500
5,000
10,000,000
60,000,000
110,000,000
160,000,000
2008 2009 2010
Kilojoules/ALB‐Km
Gigajoules
Total Energy Consumption Total Energy Consumption Rate
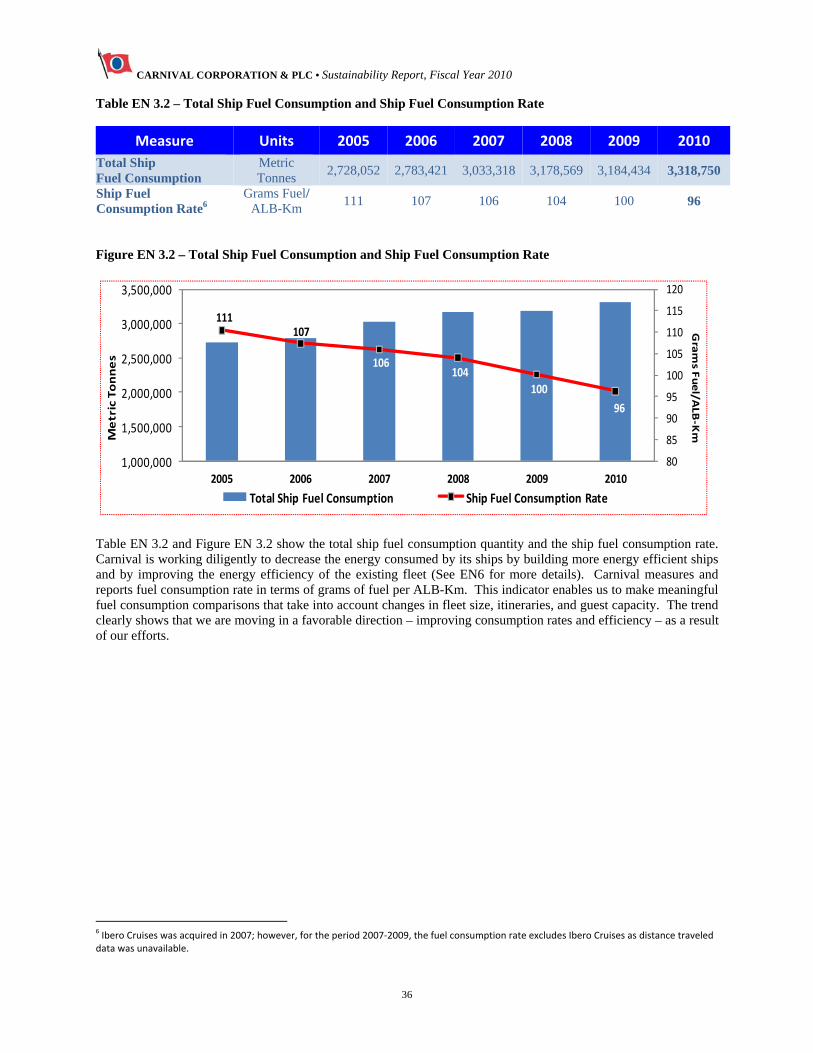
CARNIVAL CORPORATION & PLC • Sustainability Report, Fiscal Year 2010
36
Table EN 3.2 – Total Ship Fuel Consumption and Ship Fuel Consumption Rate
Measure Units 2005 2006 2007 2008 2009 2010
Total Ship Fuel Consumption
Metric Tonnes
2,728,052 2,783,421 3,033,318 3,178,569 3,184,434 3,318,750
Ship Fuel Consumption Rate6
Grams Fuel/ ALB-Km
111 107 106 104 100 96
Figure EN 3.2 – Total Ship Fuel Consumption and Ship Fuel Consumption Rate
Table EN 3.2 and Figure EN 3.2 show the total ship fuel consumption quantity and the ship fuel consumption rate. Carnival is working diligently to decrease the energy consumed by its ships by building more energy efficient ships and by improving the energy efficiency of the existing fleet (See EN6 for more details). Carnival measures and reports fuel consumption rate in terms of grams of fuel per ALB-Km. This indicator enables us to make meaningful fuel consumption comparisons that take into account changes in fleet size, itineraries, and guest capacity. The trend clearly shows that we are moving in a favorable direction – improving consumption rates and efficiency – as a result of our efforts.
6 Ibero Cruises was acquired in 2007; however, for the period 2007‐2009, the fuel consumption rate excludes Ibero Cruises as distance traveled data was unavailable.
111107
106104
100
96
80
85
90
95
100
105
110
115
120
1,000,000
1,500,000
2,000,000
2,500,000
3,000,000
3,500,000
2005 2006 2007 2008 2009 2010
Grams F
uel/A
LB‐Km
Metric Tonnes
Total Ship Fuel Consumption Ship Fuel Consumption Rate
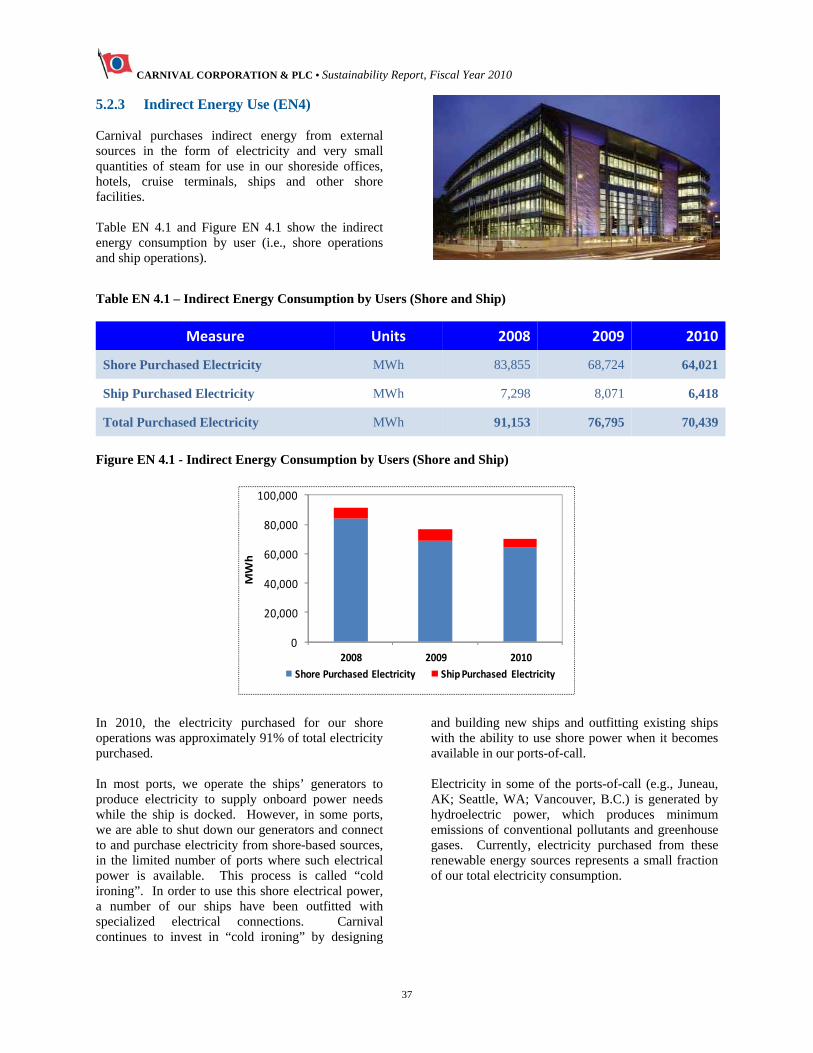
CARNIVAL CORPORATION & PLC • Sustainability Report, Fiscal Year 2010
37
5.2.3 Indirect Energy Use (EN4) Carnival purchases indirect energy from external sources in the form of electricity and very small quantities of steam for use in our shoreside offices, hotels, cruise terminals, ships and other shore facilities. Table EN 4.1 and Figure EN 4.1 show the indirect energy consumption by user (i.e., shore operations and ship operations).
Table EN 4.1 – Indirect Energy Consumption by Users (Shore and Ship)
Measure Units 2008 2009 2010
Shore Purchased Electricity MWh 83,855 68,724 64,021
Ship Purchased Electricity MWh 7,298 8,071 6,418
Total Purchased Electricity MWh 91,153 76,795 70,439
Figure EN 4.1 - Indirect Energy Consumption by Users (Shore and Ship)
0
20,000
40,000
60,000
80,000
100,000
2008 2009 2010
MWh
Shore Purchased Electricity Ship Purchased Electricity
In 2010, the electricity purchased for our shore operations was approximately 91% of total electricity purchased. In most ports, we operate the ships’ generators to produce electricity to supply onboard power needs while the ship is docked. However, in some ports, we are able to shut down our generators and connect to and purchase electricity from shore-based sources, in the limited number of ports where such electrical power is available. This process is called “cold ironing”. In order to use this shore electrical power, a number of our ships have been outfitted with specialized electrical connections. Carnival continues to invest in “cold ironing” by designing
and building new ships and outfitting existing ships with the ability to use shore power when it becomes available in our ports-of-call. Electricity in some of the ports-of-call (e.g., Juneau, AK; Seattle, WA; Vancouver, B.C.) is generated by hydroelectric power, which produces minimum emissions of conventional pollutants and greenhouse gases. Currently, electricity purchased from these renewable energy sources represents a small fraction of our total electricity consumption.
CARNIVAL CORPORATION & PLC • Sustainability Report, Fiscal Year 2010
38
5.2.4 Energy Savings Initiatives and Results (EN6) Each Carnival Operating Line sets annual energy savings objectives and targets (ranging from 0.25 - 2.5%) in accordance with their respective ISO 14001 Environmental Management Systems, including reducing energy consumption, which yields corresponding CO2 and CO2e emissions reductions. Carnival has taken a number of proactive actions to improve energy efficiency through: Process redesign Conversion and retrofitting of equipment Changes in personnel behavior Fuel consumption by our ships is the most significant contributor to Carnival’s energy footprint. Our current strategy for saving energy is addressed through the environmental management systems of our subsidiaries. Some components of this strategy include: Installing best available energy reduction
technologies in new ships Research and development of alternative fuels Research and development in emission reduction
technologies The efforts to save energy are managed by a Corporate-level working group with both Operating Line and senior corporate management participation. The goal of this group is to identify both current and long-term opportunities for saving fuel. An important decision made in this reporting period was to expand our cross-brand efforts to address technical innovation through a corporately-funded research and development (R&D) process. This new process is addressing, among other critical technical issues, new technologies to address fuel savings and greenhouse emissions for both our existing fleet and for new ships. Carnival is investing in a broad range of voluntary energy reduction initiatives that go considerably
beyond the requirements of current laws and regulations. These initiatives include: Ship Structures Cleaning ship’s hull, deck surface and propeller
in dry-dock and during operation Enhancing hull coatings and paints Applying silicone-based anti-fouling paints Applying heat reflecting paints on dark hulls Using light colored paints on upper decks Optimizing hull forms using transom trim
wedges Shipboard Heating, Ventilation, and Air Conditioning (HVAC) Systems Using HVAC plant variable air volume systems Using time-based control programs permitting
centralized remote control of AC systems for public areas, stairs, etc
Using network based solutions for guest cabins Pump Efficiency Optimizing plant energy consumption Utilizing larger pumps, impellers and electrical
motors to save energy and improve efficiencies Process Efficiency Improving efficiency of heat exchanger plates in
fresh water production systems Increasing use of waste heat from engine exhaust
for fresh water production and steam generation Optimizing use of diesel generators at sea and in
port Optimizing ship’s trim using dynamic trimming
software solutions Engine Room Ventilation Reducing power required by engine room
ventilation fans through use of variable frequency fan drive motors, and related pressure and temperature control systems
Other Energy Saving Initiatives: Designing more fuel efficient itineraries Using voyage optimization tools Installing more energy efficient lighting Improving evaporator management Increasing energy use awareness through
education and training of guests and crew Developing capability to use alternative fuels Using vessel shore power installations (“Cold
Ironing”)
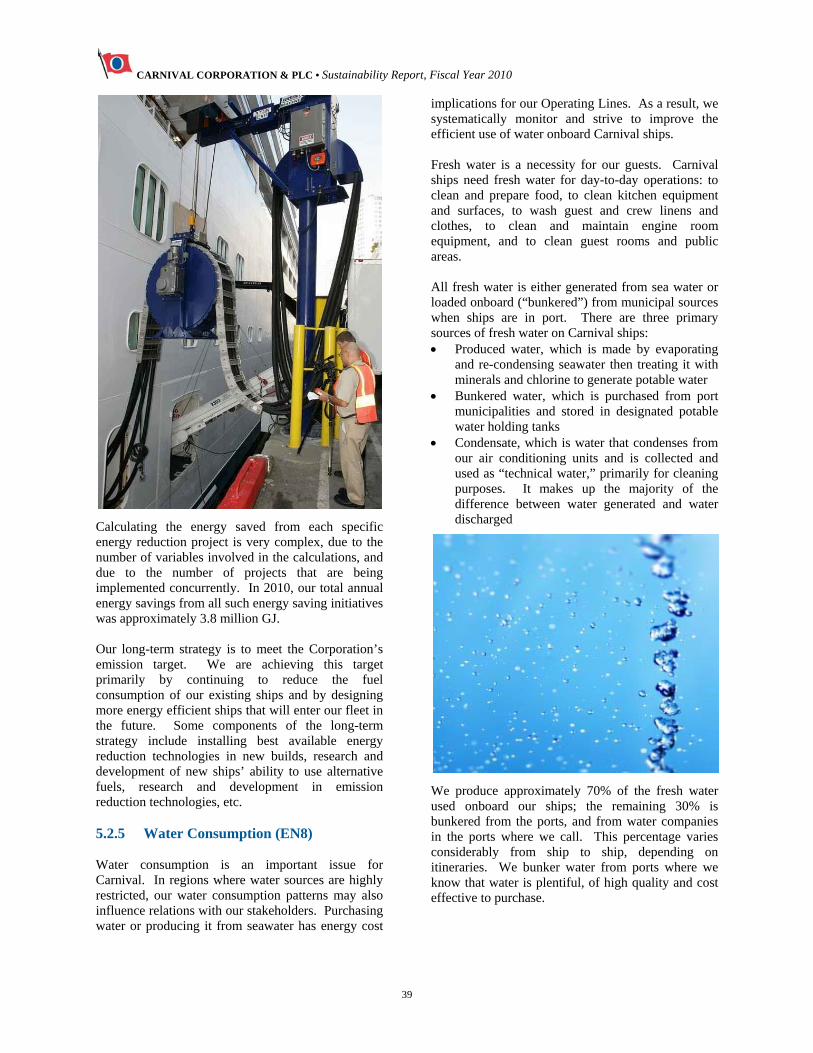
CARNIVAL CORPORATION & PLC • Sustainability Report, Fiscal Year 2010
39
Calculating the energy saved from each specific energy reduction project is very complex, due to the number of variables involved in the calculations, and due to the number of projects that are being implemented concurrently. In 2010, our total annual energy savings from all such energy saving initiatives was approximately 3.8 million GJ. Our long-term strategy is to meet the Corporation’s emission target. We are achieving this target primarily by continuing to reduce the fuel consumption of our existing ships and by designing more energy efficient ships that will enter our fleet in the future. Some components of the long-term strategy include installing best available energy reduction technologies in new builds, research and development of new ships’ ability to use alternative fuels, research and development in emission reduction technologies, etc. 5.2.5 Water Consumption (EN8) Water consumption is an important issue for Carnival. In regions where water sources are highly restricted, our water consumption patterns may also influence relations with our stakeholders. Purchasing water or producing it from seawater has energy cost
implications for our Operating Lines. As a result, we systematically monitor and strive to improve the efficient use of water onboard Carnival ships. Fresh water is a necessity for our guests. Carnival ships need fresh water for day-to-day operations: to clean and prepare food, to clean kitchen equipment and surfaces, to wash guest and crew linens and clothes, to clean and maintain engine room equipment, and to clean guest rooms and public areas. All fresh water is either generated from sea water or loaded onboard (“bunkered”) from municipal sources when ships are in port. There are three primary sources of fresh water on Carnival ships: Produced water, which is made by evaporating
and re-condensing seawater then treating it with minerals and chlorine to generate potable water
Bunkered water, which is purchased from port municipalities and stored in designated potable water holding tanks
Condensate, which is water that condenses from our air conditioning units and is collected and used as “technical water,” primarily for cleaning purposes. It makes up the majority of the difference between water generated and water discharged
We produce approximately 70% of the fresh water used onboard our ships; the remaining 30% is bunkered from the ports, and from water companies in the ports where we call. This percentage varies considerably from ship to ship, depending on itineraries. We bunker water from ports where we know that water is plentiful, of high quality and cost effective to purchase.
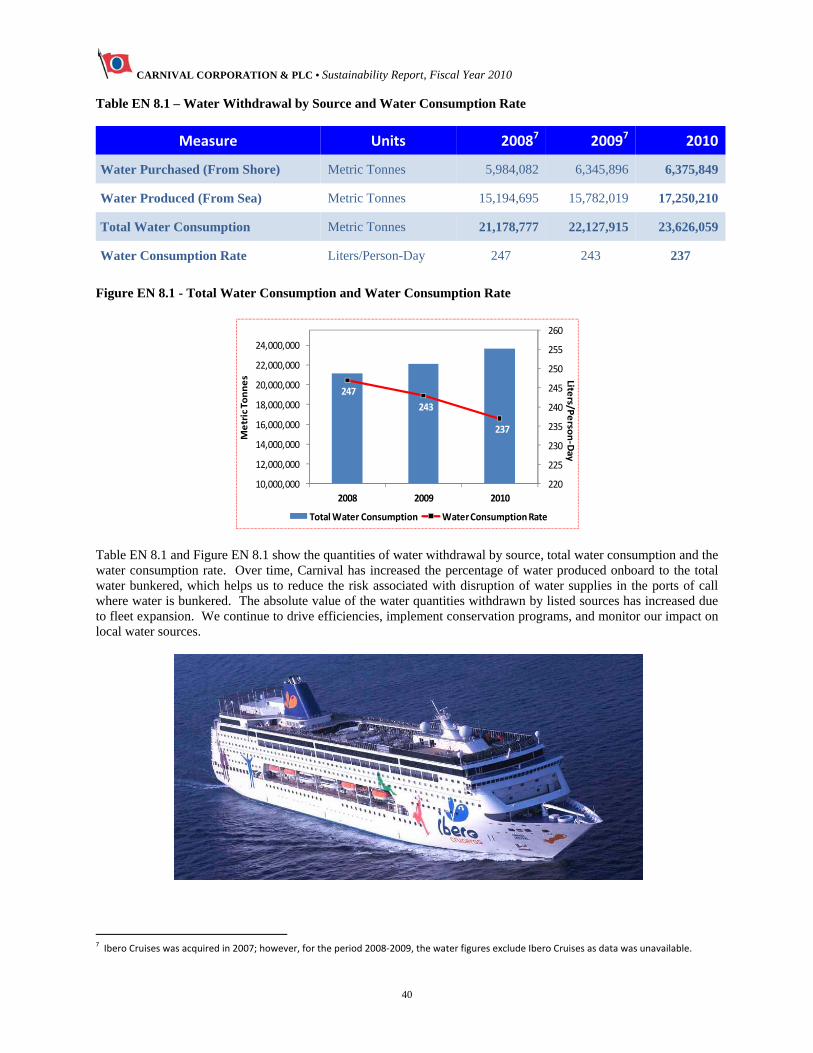
CARNIVAL CORPORATION & PLC • Sustainability Report, Fiscal Year 2010
40
Table EN 8.1 – Water Withdrawal by Source and Water Consumption Rate
Measure Units 20087 20097 2010
Water Purchased (From Shore) Metric Tonnes 5,984,082 6,345,896 6,375,849
Water Produced (From Sea) Metric Tonnes 15,194,695 15,782,019 17,250,210
Total Water Consumption Metric Tonnes 21,178,777 22,127,915 23,626,059
Water Consumption Rate Liters/Person-Day 247 243 237
Figure EN 8.1 - Total Water Consumption and Water Consumption Rate
247
243
237
220
225
230
235
240
245
250
255
260
10,000,000
12,000,000
14,000,000
16,000,000
18,000,000
20,000,000
22,000,000
24,000,000
2008 2009 2010
Liters/P
erso
n‐Day
Metric Tonnes
Total Water Consumption Water Consumption Rate
Table EN 8.1 and Figure EN 8.1 show the quantities of water withdrawal by source, total water consumption and the water consumption rate. Over time, Carnival has increased the percentage of water produced onboard to the total water bunkered, which helps us to reduce the risk associated with disruption of water supplies in the ports of call where water is bunkered. The absolute value of the water quantities withdrawn by listed sources has increased due to fleet expansion. We continue to drive efficiencies, implement conservation programs, and monitor our impact on local water sources.
7 Ibero Cruises was acquired in 2007; however, for the period 2008‐2009, the water figures exclude Ibero Cruises as data was unavailable.
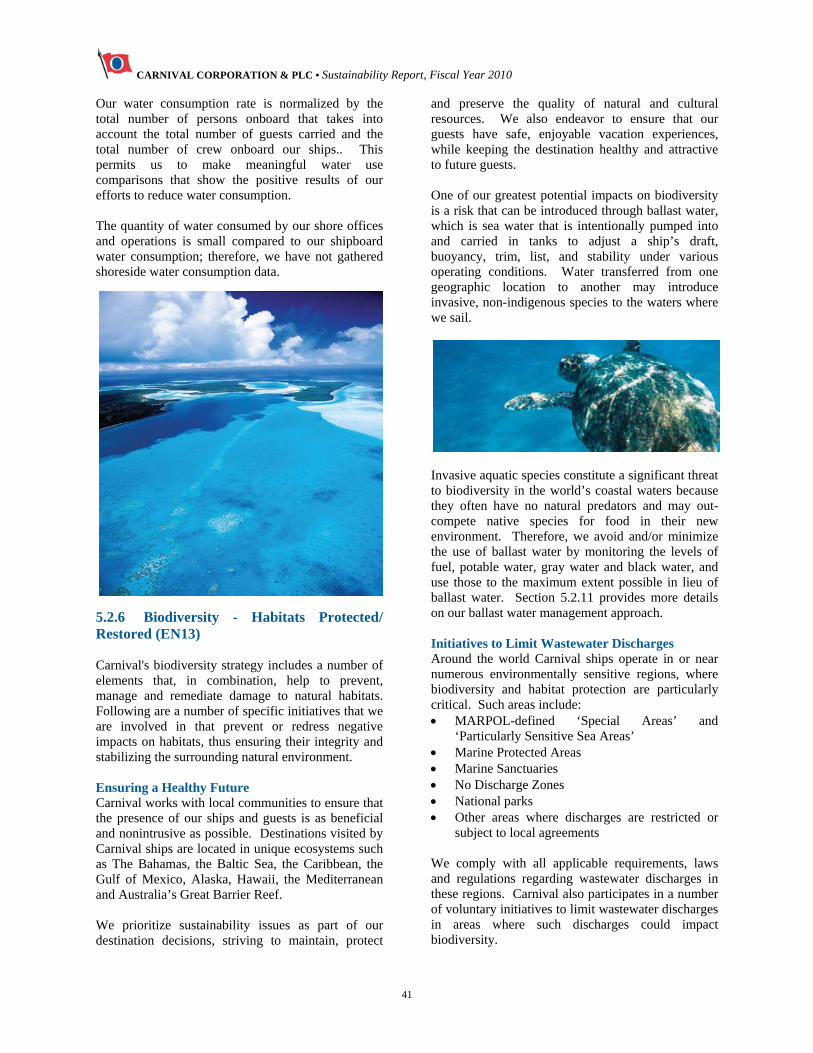
CARNIVAL CORPORATION & PLC • Sustainability Report, Fiscal Year 2010
41
Our water consumption rate is normalized by the total number of persons onboard that takes into account the total number of guests carried and the total number of crew onboard our ships.. This permits us to make meaningful water use comparisons that show the positive results of our efforts to reduce water consumption. The quantity of water consumed by our shore offices and operations is small compared to our shipboard water consumption; therefore, we have not gathered shoreside water consumption data.
5.2.6 Biodiversity - Habitats Protected/ Restored (EN13) Carnival's biodiversity strategy includes a number of elements that, in combination, help to prevent, manage and remediate damage to natural habitats. Following are a number of specific initiatives that we are involved in that prevent or redress negative impacts on habitats, thus ensuring their integrity and stabilizing the surrounding natural environment. Ensuring a Healthy Future Carnival works with local communities to ensure that the presence of our ships and guests is as beneficial and nonintrusive as possible. Destinations visited by Carnival ships are located in unique ecosystems such as The Bahamas, the Baltic Sea, the Caribbean, the Gulf of Mexico, Alaska, Hawaii, the Mediterranean and Australia’s Great Barrier Reef. We prioritize sustainability issues as part of our destination decisions, striving to maintain, protect
and preserve the quality of natural and cultural resources. We also endeavor to ensure that our guests have safe, enjoyable vacation experiences, while keeping the destination healthy and attractive to future guests. One of our greatest potential impacts on biodiversity is a risk that can be introduced through ballast water, which is sea water that is intentionally pumped into and carried in tanks to adjust a ship’s draft, buoyancy, trim, list, and stability under various operating conditions. Water transferred from one geographic location to another may introduce invasive, non-indigenous species to the waters where we sail.
Invasive aquatic species constitute a significant threat to biodiversity in the world’s coastal waters because they often have no natural predators and may out-compete native species for food in their new environment. Therefore, we avoid and/or minimize the use of ballast water by monitoring the levels of fuel, potable water, gray water and black water, and use those to the maximum extent possible in lieu of ballast water. Section 5.2.11 provides more details on our ballast water management approach. Initiatives to Limit Wastewater Discharges Around the world Carnival ships operate in or near numerous environmentally sensitive regions, where biodiversity and habitat protection are particularly critical. Such areas include: MARPOL-defined ‘Special Areas’ and
‘Particularly Sensitive Sea Areas’ Marine Protected Areas Marine Sanctuaries No Discharge Zones National parks Other areas where discharges are restricted or
subject to local agreements We comply with all applicable requirements, laws and regulations regarding wastewater discharges in these regions. Carnival also participates in a number of voluntary initiatives to limit wastewater discharges in areas where such discharges could impact biodiversity.
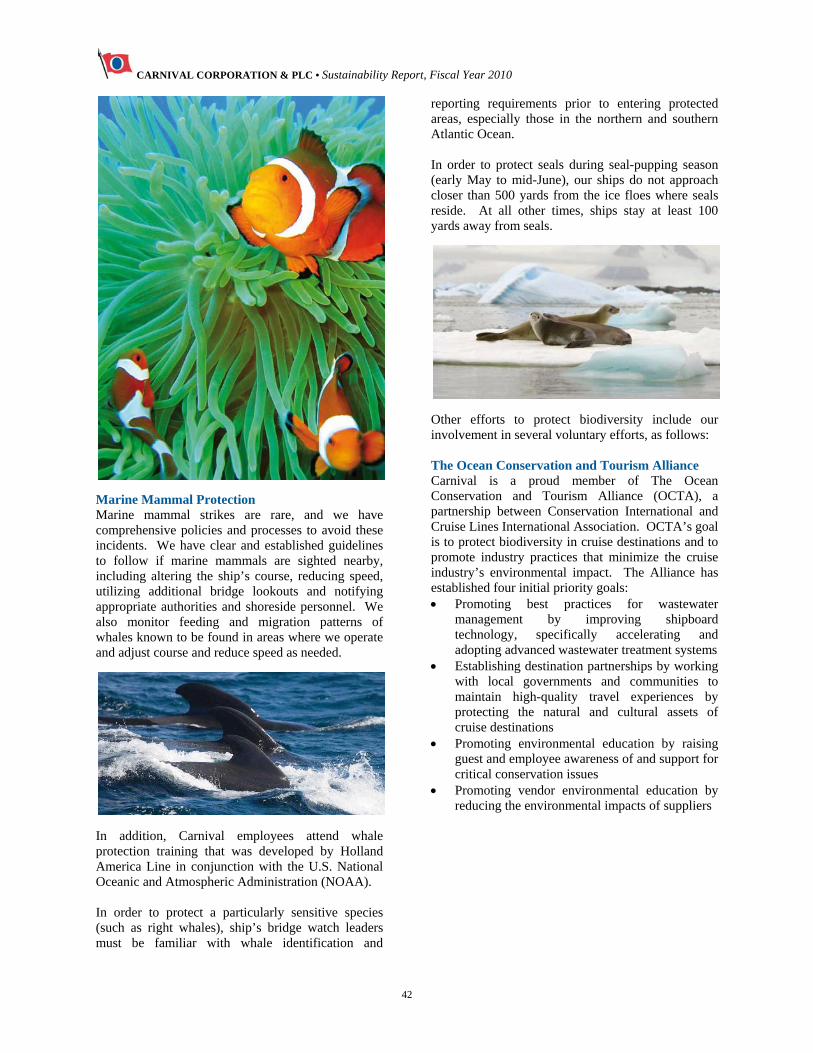
CARNIVAL CORPORATION & PLC • Sustainability Report, Fiscal Year 2010
42
Marine Mammal Protection Marine mammal strikes are rare, and we have comprehensive policies and processes to avoid these incidents. We have clear and established guidelines to follow if marine mammals are sighted nearby, including altering the ship’s course, reducing speed, utilizing additional bridge lookouts and notifying appropriate authorities and shoreside personnel. We also monitor feeding and migration patterns of whales known to be found in areas where we operate and adjust course and reduce speed as needed.
In addition, Carnival employees attend whale protection training that was developed by Holland America Line in conjunction with the U.S. National Oceanic and Atmospheric Administration (NOAA). In order to protect a particularly sensitive species (such as right whales), ship’s bridge watch leaders must be familiar with whale identification and
reporting requirements prior to entering protected areas, especially those in the northern and southern Atlantic Ocean. In order to protect seals during seal-pupping season (early May to mid-June), our ships do not approach closer than 500 yards from the ice floes where seals reside. At all other times, ships stay at least 100 yards away from seals.
Other efforts to protect biodiversity include our involvement in several voluntary efforts, as follows: The Ocean Conservation and Tourism Alliance Carnival is a proud member of The Ocean Conservation and Tourism Alliance (OCTA), a partnership between Conservation International and Cruise Lines International Association. OCTA’s goal is to protect biodiversity in cruise destinations and to promote industry practices that minimize the cruise industry’s environmental impact. The Alliance has established four initial priority goals: Promoting best practices for wastewater
management by improving shipboard technology, specifically accelerating and adopting advanced wastewater treatment systems
Establishing destination partnerships by working with local governments and communities to maintain high-quality travel experiences by protecting the natural and cultural assets of cruise destinations
Promoting environmental education by raising guest and employee awareness of and support for critical conservation issues
Promoting vendor environmental education by reducing the environmental impacts of suppliers
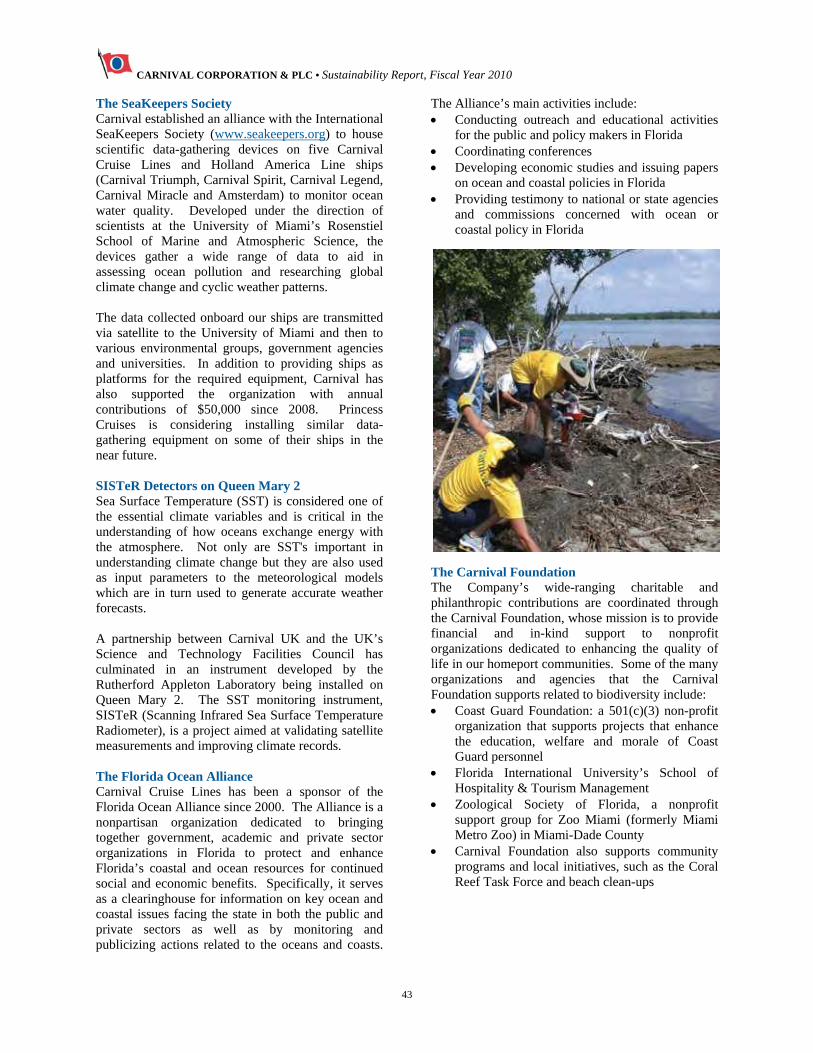
CARNIVAL CORPORATION & PLC • Sustainability Report, Fiscal Year 2010
43
The SeaKeepers Society Carnival established an alliance with the International SeaKeepers Society (www.seakeepers.org) to house scientific data-gathering devices on five Carnival Cruise Lines and Holland America Line ships (Carnival Triumph, Carnival Spirit, Carnival Legend, Carnival Miracle and Amsterdam) to monitor ocean water quality. Developed under the direction of scientists at the University of Miami’s Rosenstiel School of Marine and Atmospheric Science, the devices gather a wide range of data to aid in assessing ocean pollution and researching global climate change and cyclic weather patterns. The data collected onboard our ships are transmitted via satellite to the University of Miami and then to various environmental groups, government agencies and universities. In addition to providing ships as platforms for the required equipment, Carnival has also supported the organization with annual contributions of $50,000 since 2008. Princess Cruises is considering installing similar data-gathering equipment on some of their ships in the near future. SISTeR Detectors on Queen Mary 2 Sea Surface Temperature (SST) is considered one of the essential climate variables and is critical in the understanding of how oceans exchange energy with the atmosphere. Not only are SST's important in understanding climate change but they are also used as input parameters to the meteorological models which are in turn used to generate accurate weather forecasts. A partnership between Carnival UK and the UK’s Science and Technology Facilities Council has culminated in an instrument developed by the Rutherford Appleton Laboratory being installed on Queen Mary 2. The SST monitoring instrument, SISTeR (Scanning Infrared Sea Surface Temperature Radiometer), is a project aimed at validating satellite measurements and improving climate records. The Florida Ocean Alliance Carnival Cruise Lines has been a sponsor of the Florida Ocean Alliance since 2000. The Alliance is a nonpartisan organization dedicated to bringing together government, academic and private sector organizations in Florida to protect and enhance Florida’s coastal and ocean resources for continued social and economic benefits. Specifically, it serves as a clearinghouse for information on key ocean and coastal issues facing the state in both the public and private sectors as well as by monitoring and publicizing actions related to the oceans and coasts.
The Alliance’s main activities include: Conducting outreach and educational activities
for the public and policy makers in Florida Coordinating conferences Developing economic studies and issuing papers
on ocean and coastal policies in Florida Providing testimony to national or state agencies
and commissions concerned with ocean or coastal policy in Florida
The Carnival Foundation The Company’s wide-ranging charitable and philanthropic contributions are coordinated through the Carnival Foundation, whose mission is to provide financial and in-kind support to nonprofit organizations dedicated to enhancing the quality of life in our homeport communities. Some of the many organizations and agencies that the Carnival Foundation supports related to biodiversity include: Coast Guard Foundation: a 501(c)(3) non-profit
organization that supports projects that enhance the education, welfare and morale of Coast Guard personnel
Florida International University’s School of Hospitality & Tourism Management
Zoological Society of Florida, a nonprofit support group for Zoo Miami (formerly Miami Metro Zoo) in Miami-Dade County
Carnival Foundation also supports community programs and local initiatives, such as the Coral Reef Task Force and beach clean-ups
CARNIVAL CORPORATION & PLC • Sustainability Report, Fiscal Year 2010
44
5.2.7 Direct and Indirect Greenhouse Gas Emissions (EN16) Climate change is at the top of the agendas of many governments, businesses and individuals. Carnival actively participates in and contributes to the process of determining our industry’s role in addressing climate change. We have publicly disclosed our carbon footprint since 2006 and are taking specific and proactive steps to reduce this footprint. Carnival is actively participating in the discussions on greenhouse gas emissions and climate change currently underway in the International Maritime Organization and in Europe through its membership in organizations such as the European Cruise Council, the UK Chamber of Shipping, the International Chamber of Shipping, and the Cruise Lines International Association. Carnival has also participated in various industry seminars related to improving fuel efficiency, use of cleaner fuels and carbon trading. Carnival is a sponsoring member of the UK-based Shipping Emissions Abatement and Trading (SEAaT) organization (www.seaat.org). This unique, pro-active and self-funded cross-industry group has a mission to encourage and facilitate efficient reduction of harmful emissions from shipping. Formed in 2002, SEAaT raises awareness and promotes acceptance of solutions for emissions reductions that are sustainable, cost effective, and achievable. Founding sponsors include shipping and oil companies committed to exploring and implementing cost effective methods of reducing emissions. SEAaT membership represents the broader shipping
community and includes ship owners, brokers, technology companies and fuel suppliers. In May 2011, Carnival responded, for the sixth consecutive year, to the well-known Carbon Disclosure Project (CDP; www.cdproject.net), which provides visibility of companies' carbon footprint and activities regarding carbon emissions. The CDP rates companies on the depth and scope of their disclosures and the quality of their reporting. Our response to CDP2011, based on fiscal year 2010 (December 1, 2009 – November 30. 2010), was publicly released by the CDP in September 2011. It included details of Carnival’s most recently compiled emissions data and reduction efforts, along with two recent accomplishments: The setting of an overall corporate target of 20%
reduction from our 2005 baseline in the intensity of carbon dioxide emissions from shipboard operations by 2015
The completion of an independent, third-party verification of our corporate-wide greenhouse gas emissions inventory
Based on our CDP responses, Carnival has been named to the Carbon Disclosure Leadership Index (CDLI) every year since 2008. In addition to this report and the CDP, each Carnival Operating Line discloses their carbon footprints in their respective sustainability reports. These reports provide additional detail on the numerous voluntary management and technical initiatives implemented to address climate change and other significant environmental aspects.
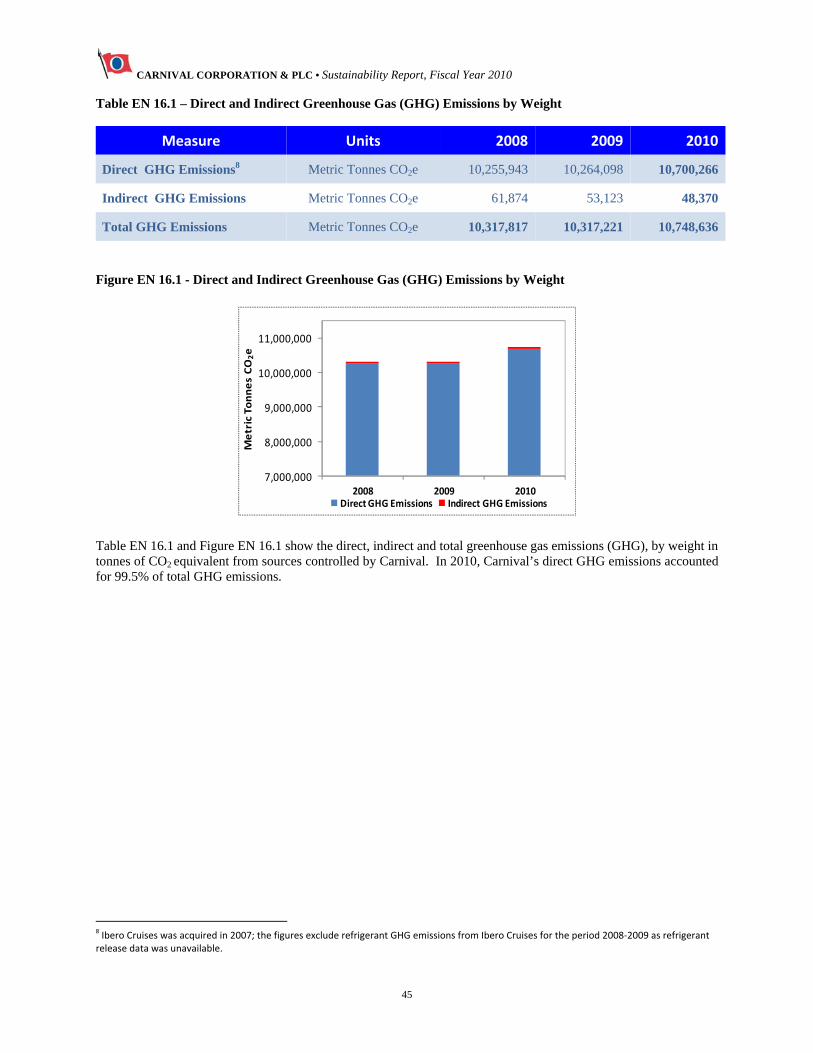
CARNIVAL CORPORATION & PLC • Sustainability Report, Fiscal Year 2010
45
Table EN 16.1 – Direct and Indirect Greenhouse Gas (GHG) Emissions by Weight
Measure Units 2008 2009 2010
Direct GHG Emissions8 Metric Tonnes CO2e 10,255,943 10,264,098 10,700,266
Indirect GHG Emissions Metric Tonnes CO2e 61,874 53,123 48,370
Total GHG Emissions Metric Tonnes CO2e 10,317,817 10,317,221 10,748,636
Figure EN 16.1 - Direct and Indirect Greenhouse Gas (GHG) Emissions by Weight
7,000,000
8,000,000
9,000,000
10,000,000
11,000,000
2008 2009 2010
Metric Tonnes CO2e
Direct GHG Emissions Indirect GHG Emissions
Table EN 16.1 and Figure EN 16.1 show the direct, indirect and total greenhouse gas emissions (GHG), by weight in tonnes of CO2 equivalent from sources controlled by Carnival. In 2010, Carnival’s direct GHG emissions accounted for 99.5% of total GHG emissions.
8 Ibero Cruises was acquired in 2007; the figures exclude refrigerant GHG emissions from Ibero Cruises for the period 2008‐2009 as refrigerant release data was unavailable.
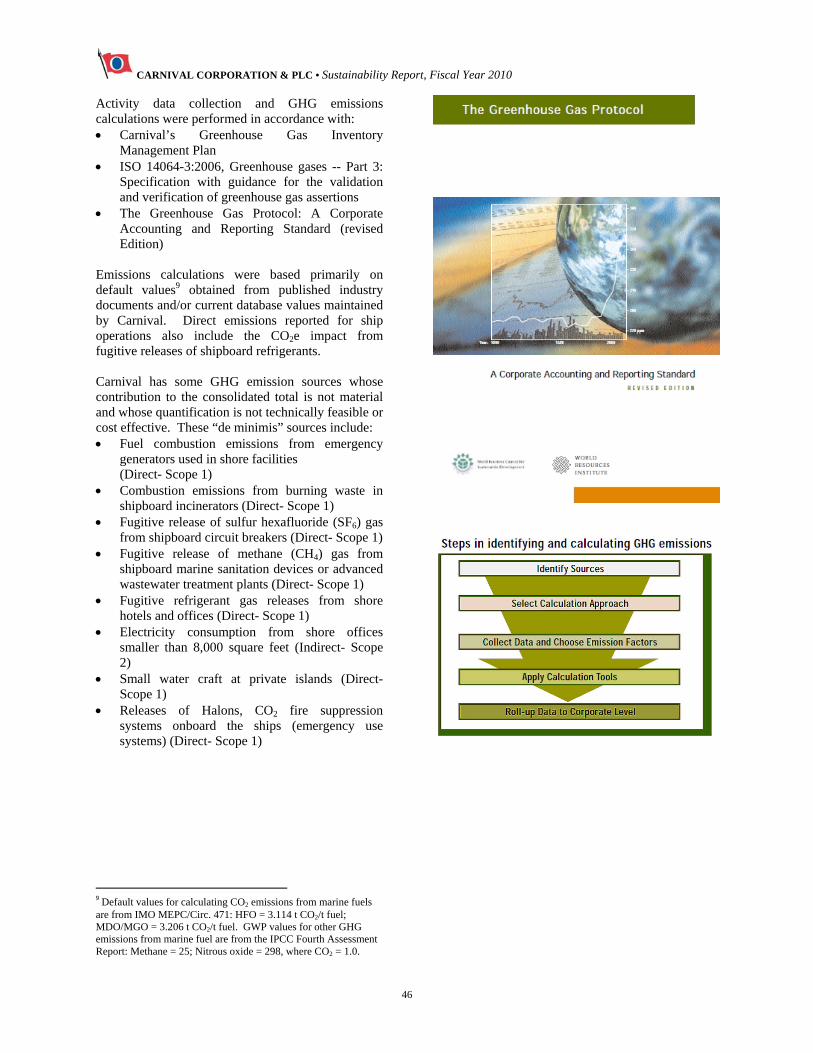
CARNIVAL CORPORATION & PLC • Sustainability Report, Fiscal Year 2010
46
Activity data collection and GHG emissions calculations were performed in accordance with: Carnival’s Greenhouse Gas Inventory
Management Plan ISO 14064-3:2006, Greenhouse gases -- Part 3:
Specification with guidance for the validation and verification of greenhouse gas assertions
The Greenhouse Gas Protocol: A Corporate Accounting and Reporting Standard (revised Edition)
Emissions calculations were based primarily on default values9 obtained from published industry documents and/or current database values maintained by Carnival. Direct emissions reported for ship operations also include the CO2e impact from fugitive releases of shipboard refrigerants. Carnival has some GHG emission sources whose contribution to the consolidated total is not material and whose quantification is not technically feasible or cost effective. These “de minimis” sources include: Fuel combustion emissions from emergency
generators used in shore facilities (Direct- Scope 1)
Combustion emissions from burning waste in shipboard incinerators (Direct- Scope 1)
Fugitive release of sulfur hexafluoride (SF6) gas from shipboard circuit breakers (Direct- Scope 1)
Fugitive release of methane (CH4) gas from shipboard marine sanitation devices or advanced wastewater treatment plants (Direct- Scope 1)
Fugitive refrigerant gas releases from shore hotels and offices (Direct- Scope 1)
Electricity consumption from shore offices smaller than 8,000 square feet (Indirect- Scope 2)
Small water craft at private islands (Direct- Scope 1)
Releases of Halons, CO2 fire suppression systems onboard the ships (emergency use systems) (Direct- Scope 1)
9 Default values for calculating CO2 emissions from marine fuels
are from IMO MEPC/Circ. 471: HFO = 3.114 t CO2/t fuel; MDO/MGO = 3.206 t CO2/t fuel. GWP values for other GHG emissions from marine fuel are from the IPCC Fourth Assessment Report: Methane = 25; Nitrous oxide = 298, where CO2 = 1.0.
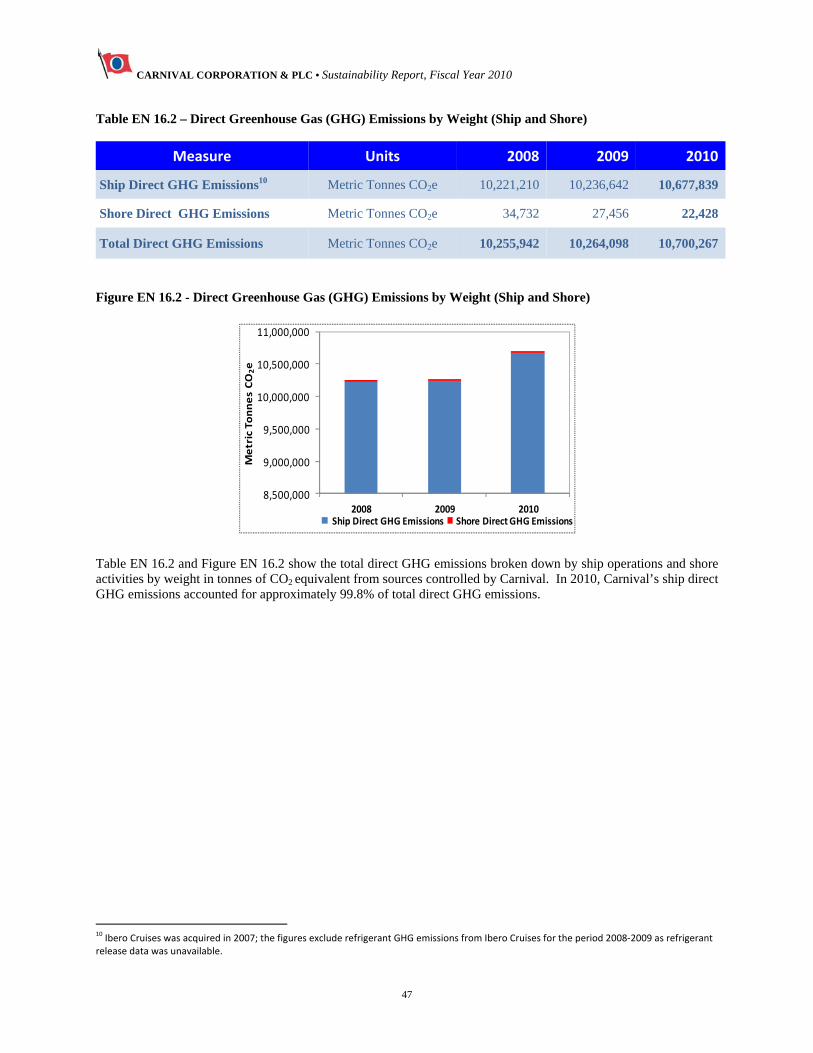
CARNIVAL CORPORATION & PLC • Sustainability Report, Fiscal Year 2010
47
Table EN 16.2 – Direct Greenhouse Gas (GHG) Emissions by Weight (Ship and Shore)
Measure Units 2008 2009 2010
Ship Direct GHG Emissions10 Metric Tonnes CO2e 10,221,210 10,236,642 10,677,839
Shore Direct GHG Emissions Metric Tonnes CO2e 34,732 27,456 22,428
Total Direct GHG Emissions Metric Tonnes CO2e 10,255,942 10,264,098 10,700,267
Figure EN 16.2 - Direct Greenhouse Gas (GHG) Emissions by Weight (Ship and Shore)
8,500,000
9,000,000
9,500,000
10,000,000
10,500,000
11,000,000
2008 2009 2010
Metric Tonnes CO2e
Ship Direct GHG Emissions Shore Direct GHG Emissions
Table EN 16.2 and Figure EN 16.2 show the total direct GHG emissions broken down by ship operations and shore activities by weight in tonnes of CO2 equivalent from sources controlled by Carnival. In 2010, Carnival’s ship direct GHG emissions accounted for approximately 99.8% of total direct GHG emissions.
10 Ibero Cruises was acquired in 2007; the figures exclude refrigerant GHG emissions from Ibero Cruises for the period 2008‐2009 as refrigerant
release data was unavailable.
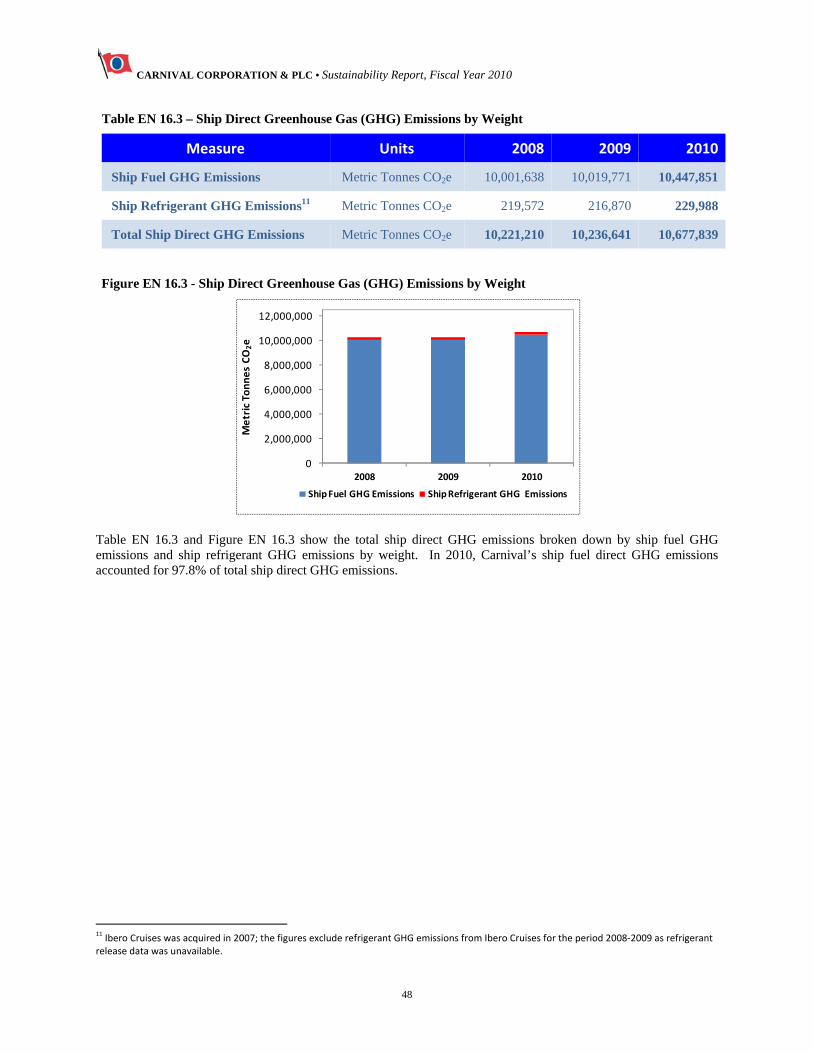
CARNIVAL CORPORATION & PLC • Sustainability Report, Fiscal Year 2010
48
Table EN 16.3 – Ship Direct Greenhouse Gas (GHG) Emissions by Weight
Measure Units 2008 2009 2010
Ship Fuel GHG Emissions Metric Tonnes CO2e 10,001,638 10,019,771 10,447,851
Ship Refrigerant GHG Emissions11 Metric Tonnes CO2e 219,572 216,870 229,988
Total Ship Direct GHG Emissions Metric Tonnes CO2e 10,221,210 10,236,641 10,677,839
Figure EN 16.3 - Ship Direct Greenhouse Gas (GHG) Emissions by Weight
Table EN 16.3 and Figure EN 16.3 show the total ship direct GHG emissions broken down by ship fuel GHG emissions and ship refrigerant GHG emissions by weight. In 2010, Carnival’s ship fuel direct GHG emissions accounted for 97.8% of total ship direct GHG emissions.
11 Ibero Cruises was acquired in 2007; the figures exclude refrigerant GHG emissions from Ibero Cruises for the period 2008‐2009 as refrigerant
release data was unavailable.
0
2,000,000
4,000,000
6,000,000
8,000,000
10,000,000
12,000,000
2008 2009 2010
Metric Tonnes CO2e
Ship Fuel GHG Emissions Ship Refrigerant GHG Emissions
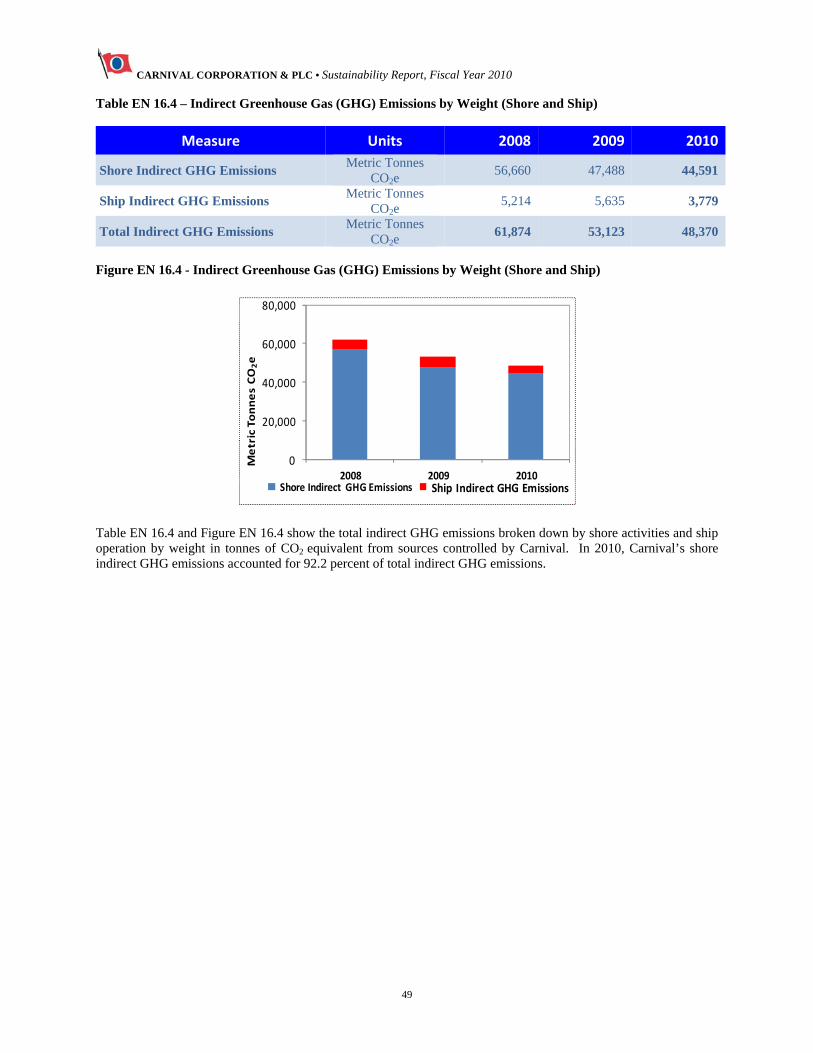
CARNIVAL CORPORATION & PLC • Sustainability Report, Fiscal Year 2010
49
Table EN 16.4 – Indirect Greenhouse Gas (GHG) Emissions by Weight (Shore and Ship)
Measure Units 2008 2009 2010
Shore Indirect GHG Emissions Metric Tonnes
CO2e 56,660 47,488 44,591
Ship Indirect GHG Emissions Metric Tonnes
CO2e 5,214 5,635 3,779
Total Indirect GHG Emissions Metric Tonnes
CO2e 61,874 53,123 48,370
Figure EN 16.4 - Indirect Greenhouse Gas (GHG) Emissions by Weight (Shore and Ship)
0
20,000
40,000
60,000
80,000
2008 2009 2010
Metric Tonnes CO2e
Shore Indirect GHG Emissions Ship Indirect GHG Emissions
Table EN 16.4 and Figure EN 16.4 show the total indirect GHG emissions broken down by shore activities and ship operation by weight in tonnes of CO2 equivalent from sources controlled by Carnival. In 2010, Carnival’s shore indirect GHG emissions accounted for 92.2 percent of total indirect GHG emissions.
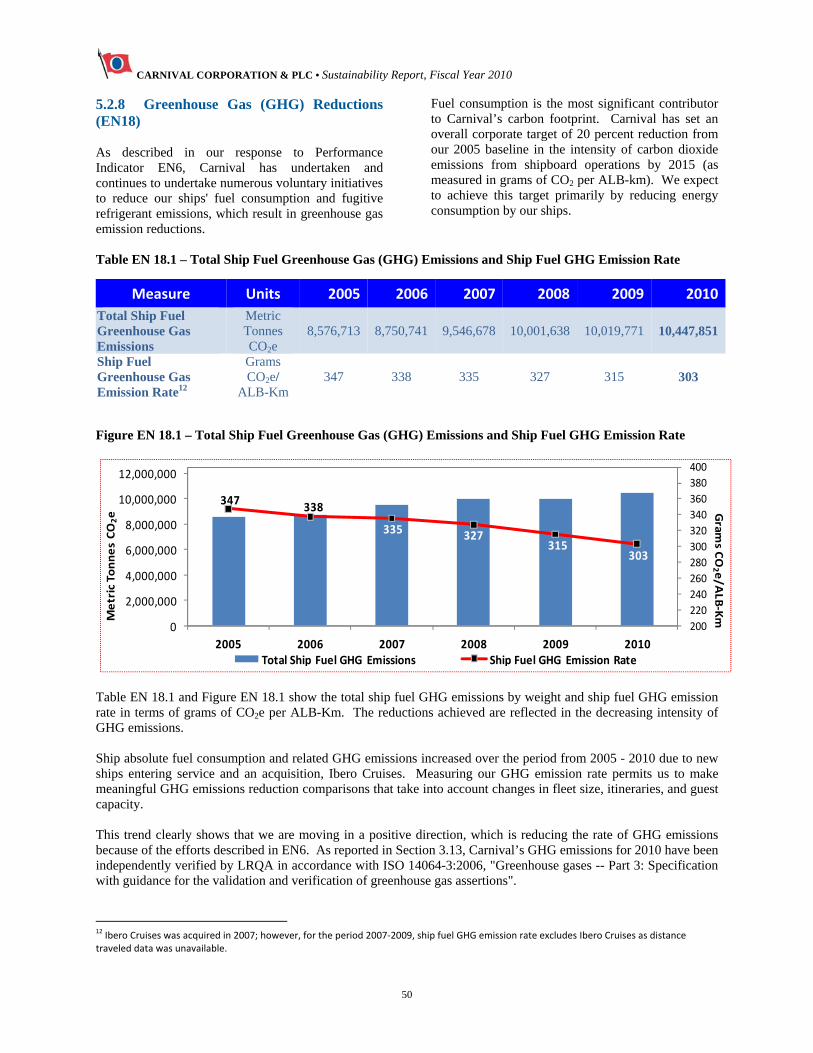
CARNIVAL CORPORATION & PLC • Sustainability Report, Fiscal Year 2010
50
5.2.8 Greenhouse Gas (GHG) Reductions (EN18) As described in our response to Performance Indicator EN6, Carnival has undertaken and continues to undertake numerous voluntary initiatives to reduce our ships' fuel consumption and fugitive refrigerant emissions, which result in greenhouse gas emission reductions.
Fuel consumption is the most significant contributor to Carnival’s carbon footprint. Carnival has set an overall corporate target of 20 percent reduction from our 2005 baseline in the intensity of carbon dioxide emissions from shipboard operations by 2015 (as measured in grams of CO2 per ALB-km). We expect to achieve this target primarily by reducing energy consumption by our ships.
Table EN 18.1 – Total Ship Fuel Greenhouse Gas (GHG) Emissions and Ship Fuel GHG Emission Rate
Measure Units 2005 2006 2007 2008 2009 2010
Total Ship Fuel Greenhouse Gas Emissions
Metric Tonnes CO2e
8,576,713 8,750,741 9,546,678 10,001,638 10,019,771 10,447,851
Ship Fuel Greenhouse Gas Emission Rate12
Grams CO2e/
ALB-Km 347 338 335 327 315 303
Figure EN 18.1 – Total Ship Fuel Greenhouse Gas (GHG) Emissions and Ship Fuel GHG Emission Rate
347338
335 327315
303
200
220
240
260
280
300
320
340
360
380
400
0
2,000,000
4,000,000
6,000,000
8,000,000
10,000,000
12,000,000
2005 2006 2007 2008 2009 2010
Gram
s CO2 e/A
LB‐KmM
etric Tonnes CO2e
Total Ship Fuel GHG Emissions Ship Fuel GHG Emission Rate
Table EN 18.1 and Figure EN 18.1 show the total ship fuel GHG emissions by weight and ship fuel GHG emission rate in terms of grams of CO2e per ALB-Km. The reductions achieved are reflected in the decreasing intensity of GHG emissions. Ship absolute fuel consumption and related GHG emissions increased over the period from 2005 - 2010 due to new ships entering service and an acquisition, Ibero Cruises. Measuring our GHG emission rate permits us to make meaningful GHG emissions reduction comparisons that take into account changes in fleet size, itineraries, and guest capacity. This trend clearly shows that we are moving in a positive direction, which is reducing the rate of GHG emissions because of the efforts described in EN6. As reported in Section 3.13, Carnival’s GHG emissions for 2010 have been independently verified by LRQA in accordance with ISO 14064-3:2006, "Greenhouse gases -- Part 3: Specification with guidance for the validation and verification of greenhouse gas assertions".
12 Ibero Cruises was acquired in 2007; however, for the period 2007‐2009, ship fuel GHG emission rate excludes Ibero Cruises as distance
traveled data was unavailable.
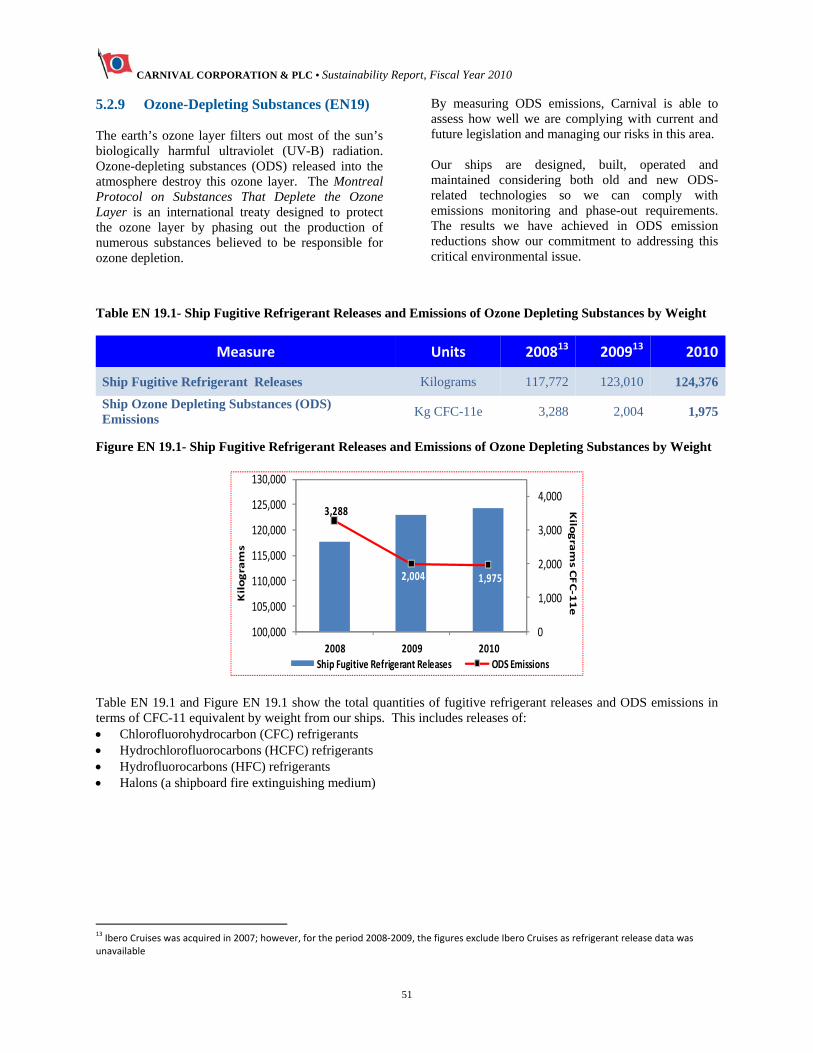
CARNIVAL CORPORATION & PLC • Sustainability Report, Fiscal Year 2010
51
5.2.9 Ozone-Depleting Substances (EN19) The earth’s ozone layer filters out most of the sun’s biologically harmful ultraviolet (UV-B) radiation. Ozone-depleting substances (ODS) released into the atmosphere destroy this ozone layer. The Montreal Protocol on Substances That Deplete the Ozone Layer is an international treaty designed to protect the ozone layer by phasing out the production of numerous substances believed to be responsible for ozone depletion.
By measuring ODS emissions, Carnival is able to assess how well we are complying with current and future legislation and managing our risks in this area. Our ships are designed, built, operated and maintained considering both old and new ODS-related technologies so we can comply with emissions monitoring and phase-out requirements. The results we have achieved in ODS emission reductions show our commitment to addressing this critical environmental issue.
Table EN 19.1- Ship Fugitive Refrigerant Releases and Emissions of Ozone Depleting Substances by Weight
Measure Units 200813 200913 2010
Ship Fugitive Refrigerant Releases Kilograms 117,772 123,010 124,376
Ship Ozone Depleting Substances (ODS) Emissions
Kg CFC-11e 3,288 2,004 1,975
Figure EN 19.1- Ship Fugitive Refrigerant Releases and Emissions of Ozone Depleting Substances by Weight
3,288
2,004 1,975
0
1,000
2,000
3,000
4,000
100,000
105,000
110,000
115,000
120,000
125,000
130,000
2008 2009 2010
Kilograms CFC‐11e
Kilograms
Ship Fugitive Refrigerant Releases ODS Emissions
Table EN 19.1 and Figure EN 19.1 show the total quantities of fugitive refrigerant releases and ODS emissions in terms of CFC-11 equivalent by weight from our ships. This includes releases of: Chlorofluorohydrocarbon (CFC) refrigerants Hydrochlorofluorocarbons (HCFC) refrigerants Hydrofluorocarbons (HFC) refrigerants Halons (a shipboard fire extinguishing medium)
13 Ibero Cruises was acquired in 2007; however, for the period 2008‐2009, the figures exclude Ibero Cruises as refrigerant release data was
unavailable
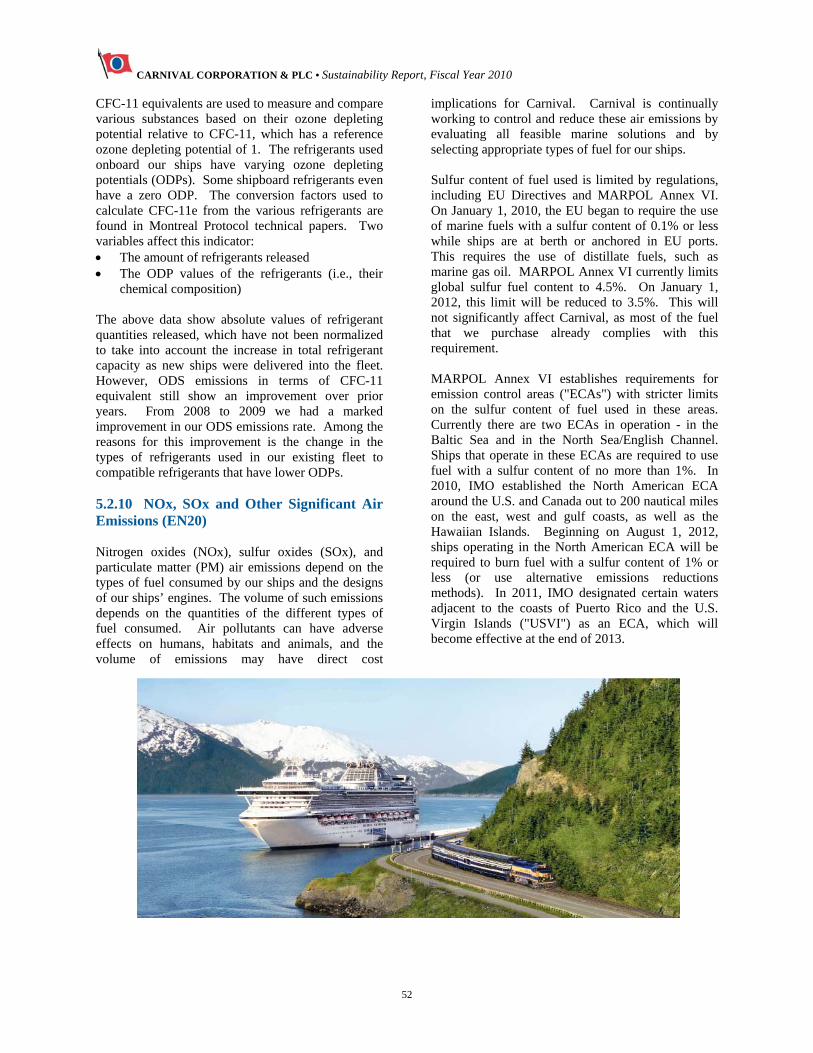
CARNIVAL CORPORATION & PLC • Sustainability Report, Fiscal Year 2010
52
CFC-11 equivalents are used to measure and compare various substances based on their ozone depleting potential relative to CFC-11, which has a reference ozone depleting potential of 1. The refrigerants used onboard our ships have varying ozone depleting potentials (ODPs). Some shipboard refrigerants even have a zero ODP. The conversion factors used to calculate CFC-11e from the various refrigerants are found in Montreal Protocol technical papers. Two variables affect this indicator: The amount of refrigerants released The ODP values of the refrigerants (i.e., their
chemical composition)
The above data show absolute values of refrigerant quantities released, which have not been normalized to take into account the increase in total refrigerant capacity as new ships were delivered into the fleet. However, ODS emissions in terms of CFC-11 equivalent still show an improvement over prior years. From 2008 to 2009 we had a marked improvement in our ODS emissions rate. Among the reasons for this improvement is the change in the types of refrigerants used in our existing fleet to compatible refrigerants that have lower ODPs. 5.2.10 NOx, SOx and Other Significant Air Emissions (EN20) Nitrogen oxides (NOx), sulfur oxides (SOx), and particulate matter (PM) air emissions depend on the types of fuel consumed by our ships and the designs of our ships’ engines. The volume of such emissions depends on the quantities of the different types of fuel consumed. Air pollutants can have adverse effects on humans, habitats and animals, and the volume of emissions may have direct cost
implications for Carnival. Carnival is continually working to control and reduce these air emissions by evaluating all feasible marine solutions and by selecting appropriate types of fuel for our ships. Sulfur content of fuel used is limited by regulations, including EU Directives and MARPOL Annex VI. On January 1, 2010, the EU began to require the use of marine fuels with a sulfur content of 0.1% or less while ships are at berth or anchored in EU ports. This requires the use of distillate fuels, such as marine gas oil. MARPOL Annex VI currently limits global sulfur fuel content to 4.5%. On January 1, 2012, this limit will be reduced to 3.5%. This will not significantly affect Carnival, as most of the fuel that we purchase already complies with this requirement. MARPOL Annex VI establishes requirements for emission control areas ("ECAs") with stricter limits on the sulfur content of fuel used in these areas. Currently there are two ECAs in operation - in the Baltic Sea and in the North Sea/English Channel. Ships that operate in these ECAs are required to use fuel with a sulfur content of no more than 1%. In 2010, IMO established the North American ECA around the U.S. and Canada out to 200 nautical miles on the east, west and gulf coasts, as well as the Hawaiian Islands. Beginning on August 1, 2012, ships operating in the North American ECA will be required to burn fuel with a sulfur content of 1% or less (or use alternative emissions reductions methods). In 2011, IMO designated certain waters adjacent to the coasts of Puerto Rico and the U.S. Virgin Islands ("USVI") as an ECA, which will become effective at the end of 2013.
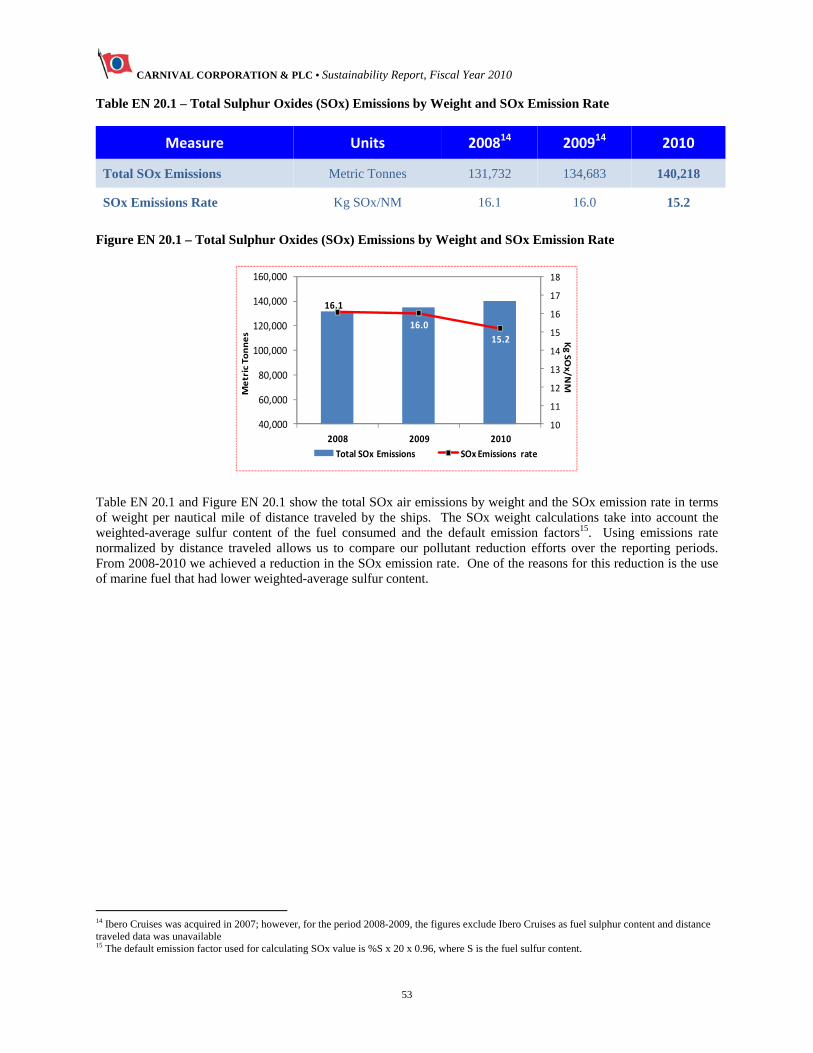
CARNIVAL CORPORATION & PLC • Sustainability Report, Fiscal Year 2010
53
Table EN 20.1 – Total Sulphur Oxides (SOx) Emissions by Weight and SOx Emission Rate
Measure Units 200814 200914 2010
Total SOx Emissions Metric Tonnes 131,732 134,683 140,218
SOx Emissions Rate Kg SOx/NM 16.1 16.0 15.2
Figure EN 20.1 – Total Sulphur Oxides (SOx) Emissions by Weight and SOx Emission Rate
16.1
16.0
15.2
10
11
12
13
14
15
16
17
18
40,000
60,000
80,000
100,000
120,000
140,000
160,000
2008 2009 2010
Kg SO
x/NM
Metric Tonnes
Total SOx Emissions SOx Emissions rate
Table EN 20.1 and Figure EN 20.1 show the total SOx air emissions by weight and the SOx emission rate in terms of weight per nautical mile of distance traveled by the ships. The SOx weight calculations take into account the weighted-average sulfur content of the fuel consumed and the default emission factors15. Using emissions rate normalized by distance traveled allows us to compare our pollutant reduction efforts over the reporting periods. From 2008-2010 we achieved a reduction in the SOx emission rate. One of the reasons for this reduction is the use of marine fuel that had lower weighted-average sulfur content.
14 Ibero Cruises was acquired in 2007; however, for the period 2008-2009, the figures exclude Ibero Cruises as fuel sulphur content and distance traveled data was unavailable 15 The default emission factor used for calculating SOx value is %S x 20 x 0.96, where S is the fuel sulfur content.
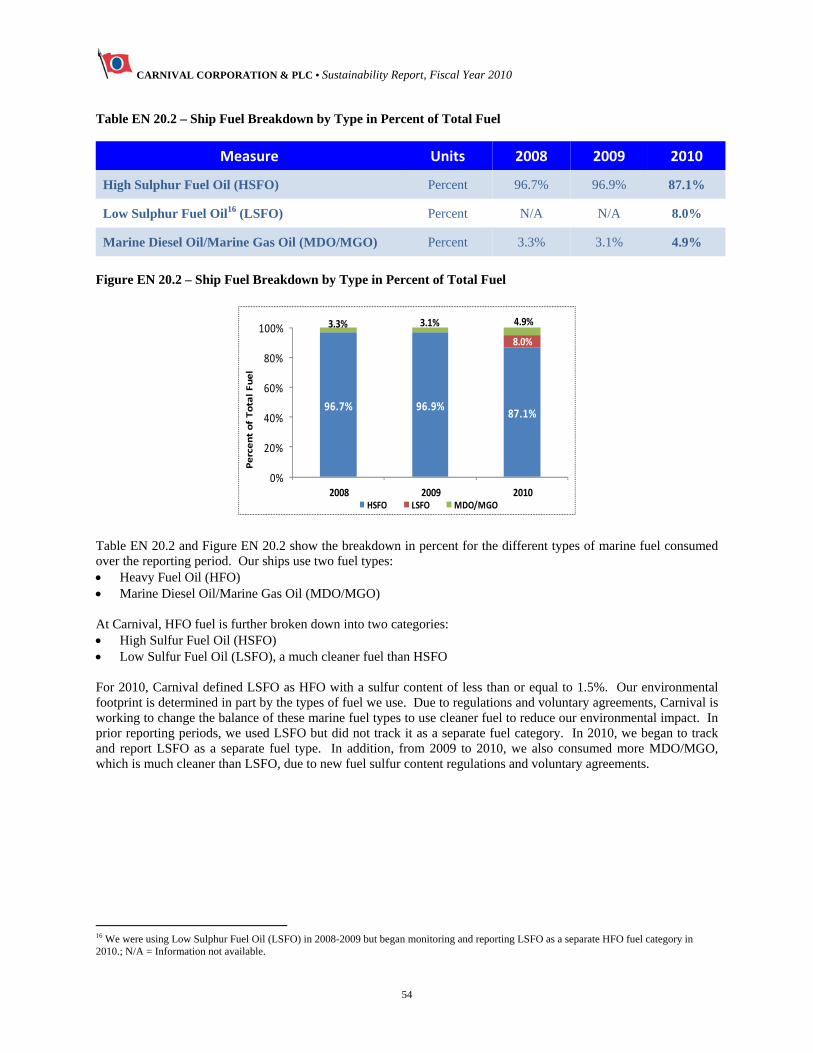
CARNIVAL CORPORATION & PLC • Sustainability Report, Fiscal Year 2010
54
Table EN 20.2 – Ship Fuel Breakdown by Type in Percent of Total Fuel
Measure Units 2008 2009 2010
High Sulphur Fuel Oil (HSFO) Percent 96.7% 96.9% 87.1%
Low Sulphur Fuel Oil16 (LSFO) Percent N/A N/A 8.0%
Marine Diesel Oil/Marine Gas Oil (MDO/MGO) Percent 3.3% 3.1% 4.9%
Figure EN 20.2 – Ship Fuel Breakdown by Type in Percent of Total Fuel
96.7% 96.9%87.1%
0.0% 0.0% 8.0%
3.3% 3.1% 4.9%
0%
20%
40%
60%
80%
100%
2008 2009 2010
Percent of Total Fuel
HSFO LSFO MDO/MGO
Table EN 20.2 and Figure EN 20.2 show the breakdown in percent for the different types of marine fuel consumed over the reporting period. Our ships use two fuel types: Heavy Fuel Oil (HFO) Marine Diesel Oil/Marine Gas Oil (MDO/MGO) At Carnival, HFO fuel is further broken down into two categories: High Sulfur Fuel Oil (HSFO) Low Sulfur Fuel Oil (LSFO), a much cleaner fuel than HSFO For 2010, Carnival defined LSFO as HFO with a sulfur content of less than or equal to 1.5%. Our environmental footprint is determined in part by the types of fuel we use. Due to regulations and voluntary agreements, Carnival is working to change the balance of these marine fuel types to use cleaner fuel to reduce our environmental impact. In prior reporting periods, we used LSFO but did not track it as a separate fuel category. In 2010, we began to track and report LSFO as a separate fuel type. In addition, from 2009 to 2010, we also consumed more MDO/MGO, which is much cleaner than LSFO, due to new fuel sulfur content regulations and voluntary agreements.
16 We were using Low Sulphur Fuel Oil (LSFO) in 2008-2009 but began monitoring and reporting LSFO as a separate HFO fuel category in 2010.; N/A = Information not available.
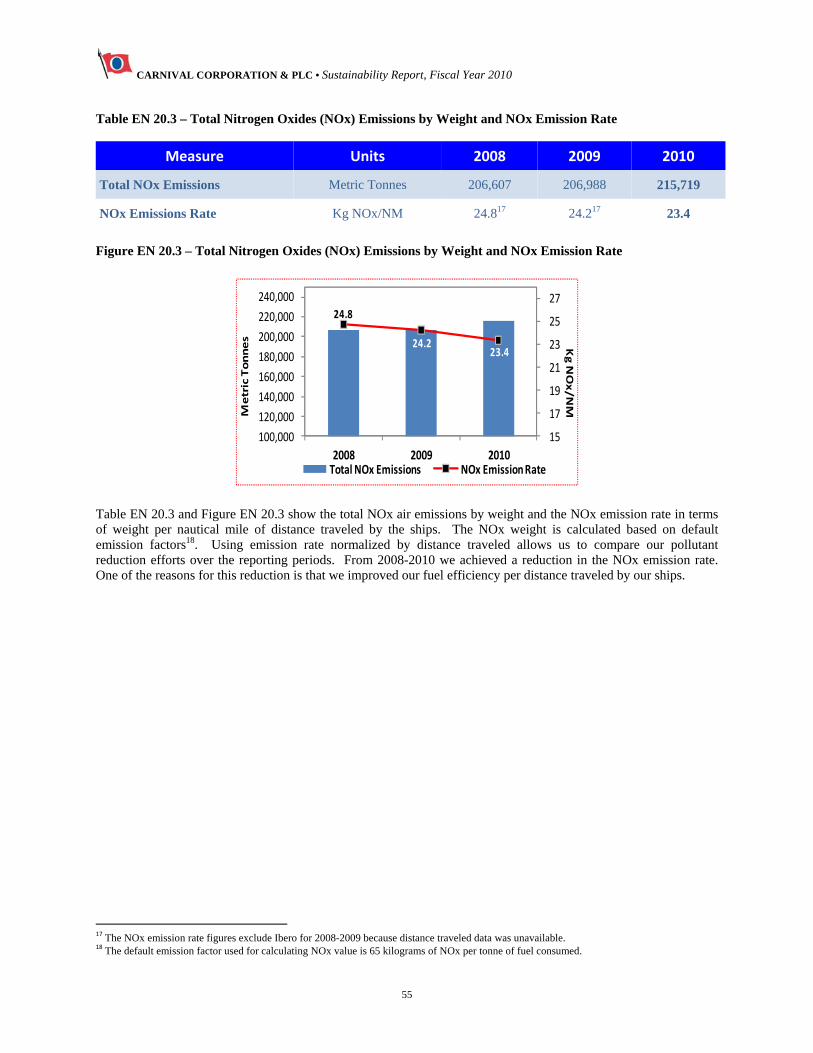
CARNIVAL CORPORATION & PLC • Sustainability Report, Fiscal Year 2010
55
Table EN 20.3 – Total Nitrogen Oxides (NOx) Emissions by Weight and NOx Emission Rate
Measure Units 2008 2009 2010
Total NOx Emissions Metric Tonnes 206,607 206,988 215,719
NOx Emissions Rate Kg NOx/NM 24.817 24.217 23.4
Figure EN 20.3 – Total Nitrogen Oxides (NOx) Emissions by Weight and NOx Emission Rate
24.8
24.223.4
15
17
19
21
23
25
27
100,000
120,000
140,000
160,000
180,000
200,000
220,000
240,000
2008 2009 2010
Kg NOx/NM
Metric Tonnes
Total NOx Emissions NOx Emission Rate
Table EN 20.3 and Figure EN 20.3 show the total NOx air emissions by weight and the NOx emission rate in terms of weight per nautical mile of distance traveled by the ships. The NOx weight is calculated based on default emission factors18. Using emission rate normalized by distance traveled allows us to compare our pollutant reduction efforts over the reporting periods. From 2008-2010 we achieved a reduction in the NOx emission rate. One of the reasons for this reduction is that we improved our fuel efficiency per distance traveled by our ships.
17 The NOx emission rate figures exclude Ibero for 2008-2009 because distance traveled data was unavailable.
18 The default emission factor used for calculating NOx value is 65 kilograms of NOx per tonne of fuel consumed.
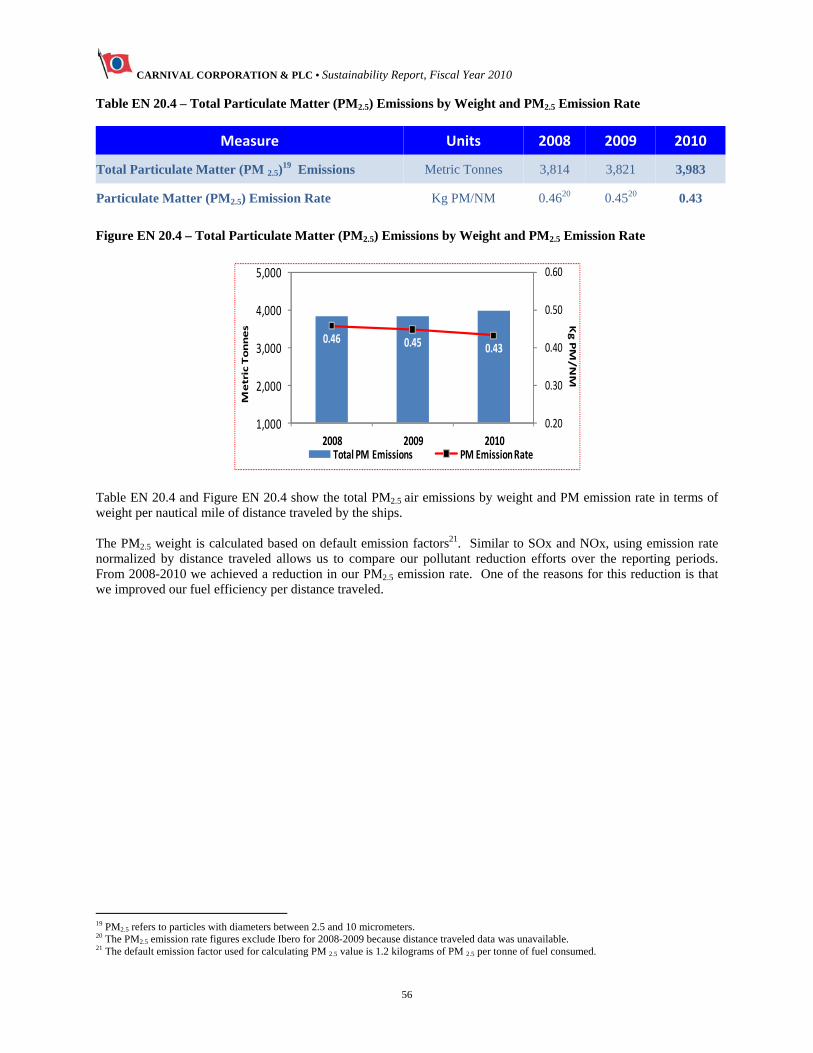
CARNIVAL CORPORATION & PLC • Sustainability Report, Fiscal Year 2010
56
Table EN 20.4 – Total Particulate Matter (PM2.5) Emissions by Weight and PM2.5 Emission Rate
Measure Units 2008 2009 2010
Total Particulate Matter (PM 2.5)19 Emissions Metric Tonnes 3,814 3,821 3,983
Particulate Matter (PM2.5) Emission Rate Kg PM/NM 0.4620 0.4520 0.43
Figure EN 20.4 – Total Particulate Matter (PM2.5) Emissions by Weight and PM2.5 Emission Rate
0.46 0.45 0.43
0.20
0.30
0.40
0.50
0.60
1,000
2,000
3,000
4,000
5,000
2008 2009 2010
Kg PM/NM
Metric Tonnes
Total PM Emissions PM Emission Rate
Table EN 20.4 and Figure EN 20.4 show the total PM2.5 air emissions by weight and PM emission rate in terms of weight per nautical mile of distance traveled by the ships. The PM2.5 weight is calculated based on default emission factors21. Similar to SOx and NOx, using emission rate normalized by distance traveled allows us to compare our pollutant reduction efforts over the reporting periods. From 2008-2010 we achieved a reduction in our PM2.5 emission rate. One of the reasons for this reduction is that we improved our fuel efficiency per distance traveled.
19 PM2.5 refers to particles with diameters between 2.5 and 10 micrometers. 20 The PM2.5 emission rate figures exclude Ibero for 2008-2009 because distance traveled data was unavailable. 21 The default emission factor used for calculating PM 2.5 value is 1.2 kilograms of PM 2.5 per tonne of fuel consumed.
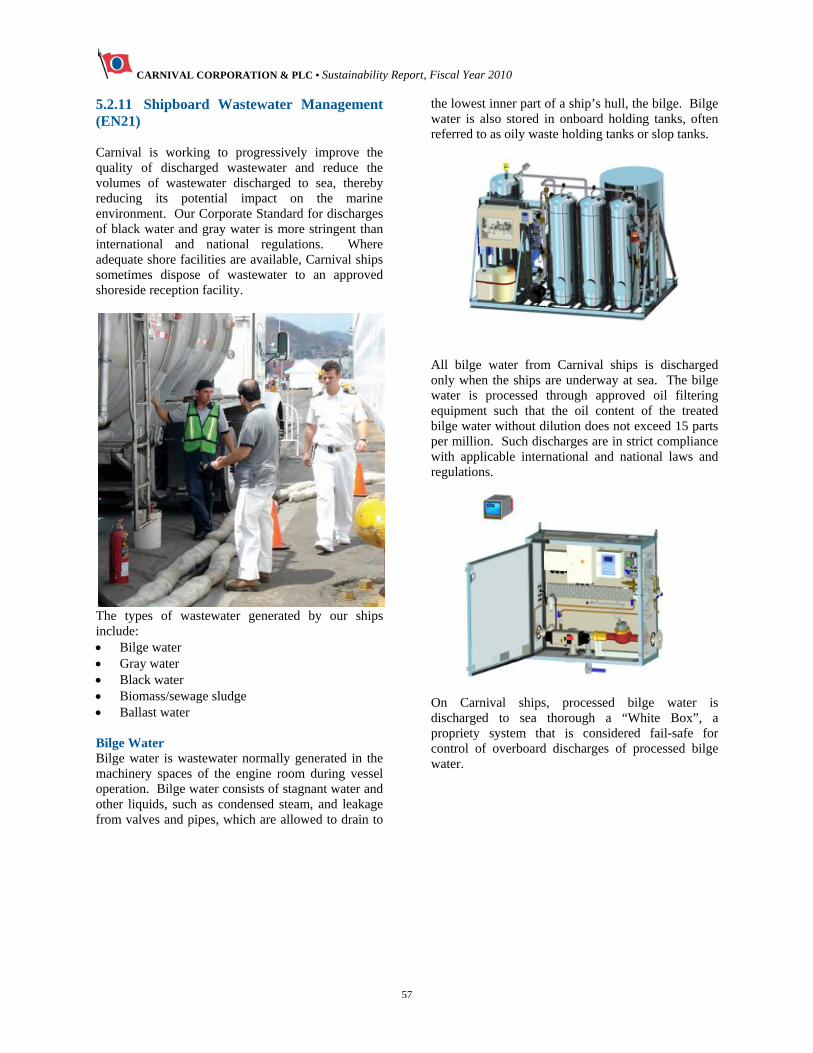
CARNIVAL CORPORATION & PLC • Sustainability Report, Fiscal Year 2010
57
5.2.11 Shipboard Wastewater Management (EN21) Carnival is working to progressively improve the quality of discharged wastewater and reduce the volumes of wastewater discharged to sea, thereby reducing its potential impact on the marine environment. Our Corporate Standard for discharges of black water and gray water is more stringent than international and national regulations. Where adequate shore facilities are available, Carnival ships sometimes dispose of wastewater to an approved shoreside reception facility.
The types of wastewater generated by our ships include: Bilge water Gray water Black water Biomass/sewage sludge Ballast water Bilge Water Bilge water is wastewater normally generated in the machinery spaces of the engine room during vessel operation. Bilge water consists of stagnant water and other liquids, such as condensed steam, and leakage from valves and pipes, which are allowed to drain to
the lowest inner part of a ship’s hull, the bilge. Bilge water is also stored in onboard holding tanks, often referred to as oily waste holding tanks or slop tanks.
All bilge water from Carnival ships is discharged only when the ships are underway at sea. The bilge water is processed through approved oil filtering equipment such that the oil content of the treated bilge water without dilution does not exceed 15 parts per million. Such discharges are in strict compliance with applicable international and national laws and regulations.
On Carnival ships, processed bilge water is discharged to sea thorough a “White Box”, a propriety system that is considered fail-safe for control of overboard discharges of processed bilge water.
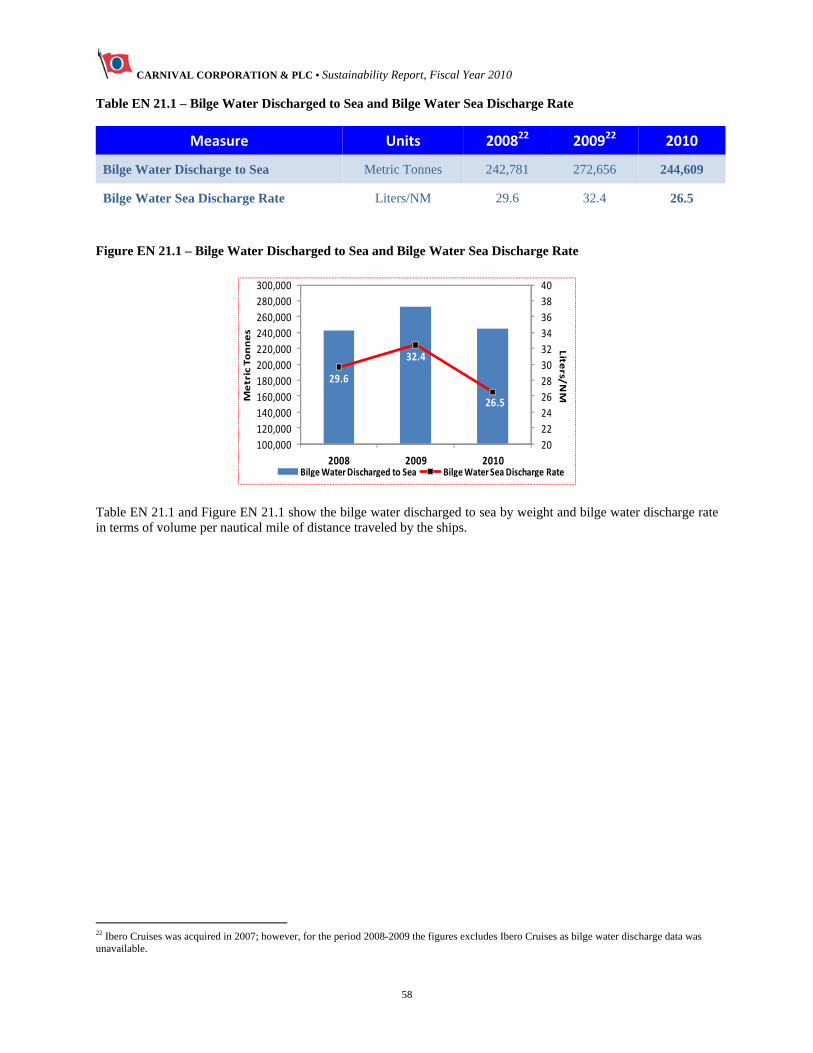
CARNIVAL CORPORATION & PLC • Sustainability Report, Fiscal Year 2010
58
Table EN 21.1 – Bilge Water Discharged to Sea and Bilge Water Sea Discharge Rate
Measure Units 200822 200922 2010
Bilge Water Discharge to Sea Metric Tonnes 242,781 272,656 244,609
Bilge Water Sea Discharge Rate Liters/NM 29.6 32.4 26.5
Figure EN 21.1 – Bilge Water Discharged to Sea and Bilge Water Sea Discharge Rate
29.6
32.4
26.5
20
22
24
26
28
30
32
34
36
38
40
100,000
120,000
140,000
160,000
180,000
200,000
220,000
240,000
260,000
280,000
300,000
2008 2009 2010
Lite
rs/NM
Metric Tonnes
Bilge Water Discharged to Sea Bilge Water Sea Discharge Rate
Table EN 21.1 and Figure EN 21.1 show the bilge water discharged to sea by weight and bilge water discharge rate in terms of volume per nautical mile of distance traveled by the ships.
22 Ibero Cruises was acquired in 2007; however, for the period 2008-2009 the figures excludes Ibero Cruises as bilge water discharge data was unavailable.
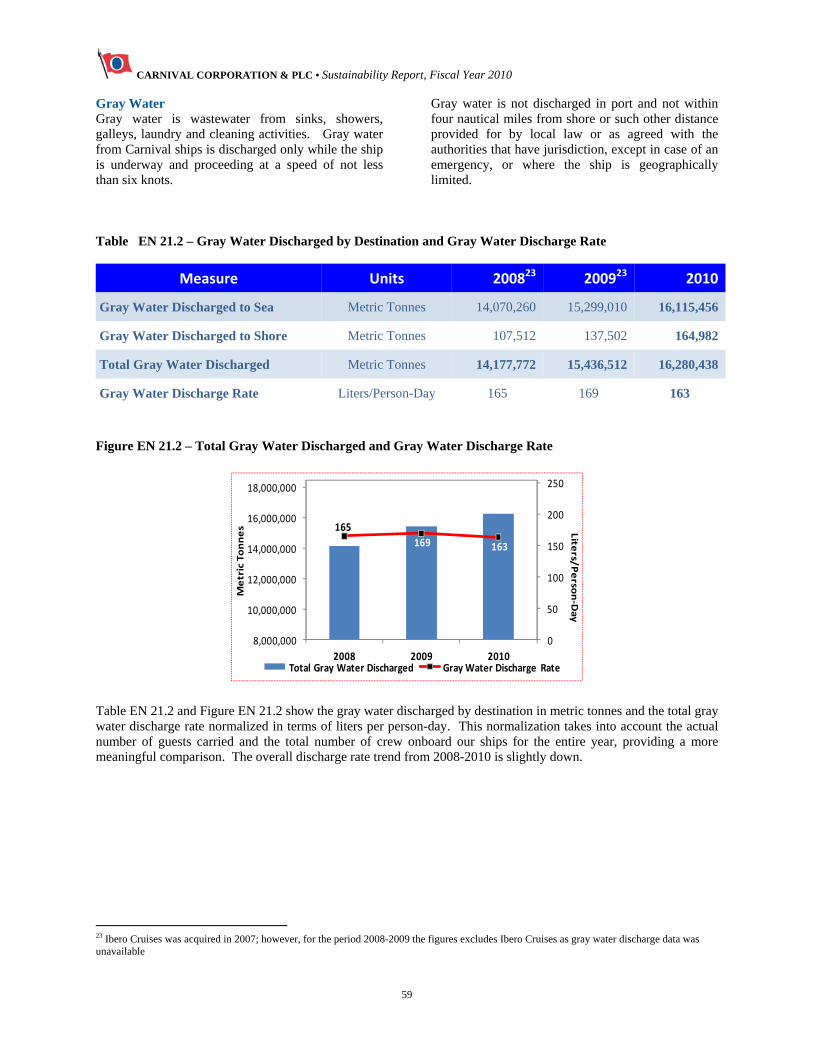
CARNIVAL CORPORATION & PLC • Sustainability Report, Fiscal Year 2010
59
Gray Water Gray water is wastewater from sinks, showers, galleys, laundry and cleaning activities. Gray water from Carnival ships is discharged only while the ship is underway and proceeding at a speed of not less than six knots.
Gray water is not discharged in port and not within four nautical miles from shore or such other distance provided for by local law or as agreed with the authorities that have jurisdiction, except in case of an emergency, or where the ship is geographically limited.
Table EN 21.2 – Gray Water Discharged by Destination and Gray Water Discharge Rate
Measure Units 200823 200923 2010
Gray Water Discharged to Sea Metric Tonnes 14,070,260 15,299,010 16,115,456
Gray Water Discharged to Shore Metric Tonnes 107,512 137,502 164,982
Total Gray Water Discharged Metric Tonnes 14,177,772 15,436,512 16,280,438
Gray Water Discharge Rate Liters/Person-Day 165 169 163
Figure EN 21.2 – Total Gray Water Discharged and Gray Water Discharge Rate
165
169 163
0
50
100
150
200
250
8,000,000
10,000,000
12,000,000
14,000,000
16,000,000
18,000,000
2008 2009 2010
Lite
rs/Perso
n‐Day
Metric Tonnes
Total Gray Water Discharged Gray Water Discharge Rate
Table EN 21.2 and Figure EN 21.2 show the gray water discharged by destination in metric tonnes and the total gray water discharge rate normalized in terms of liters per person-day. This normalization takes into account the actual number of guests carried and the total number of crew onboard our ships for the entire year, providing a more meaningful comparison. The overall discharge rate trend from 2008-2010 is slightly down.
23 Ibero Cruises was acquired in 2007; however, for the period 2008-2009 the figures excludes Ibero Cruises as gray water discharge data was unavailable
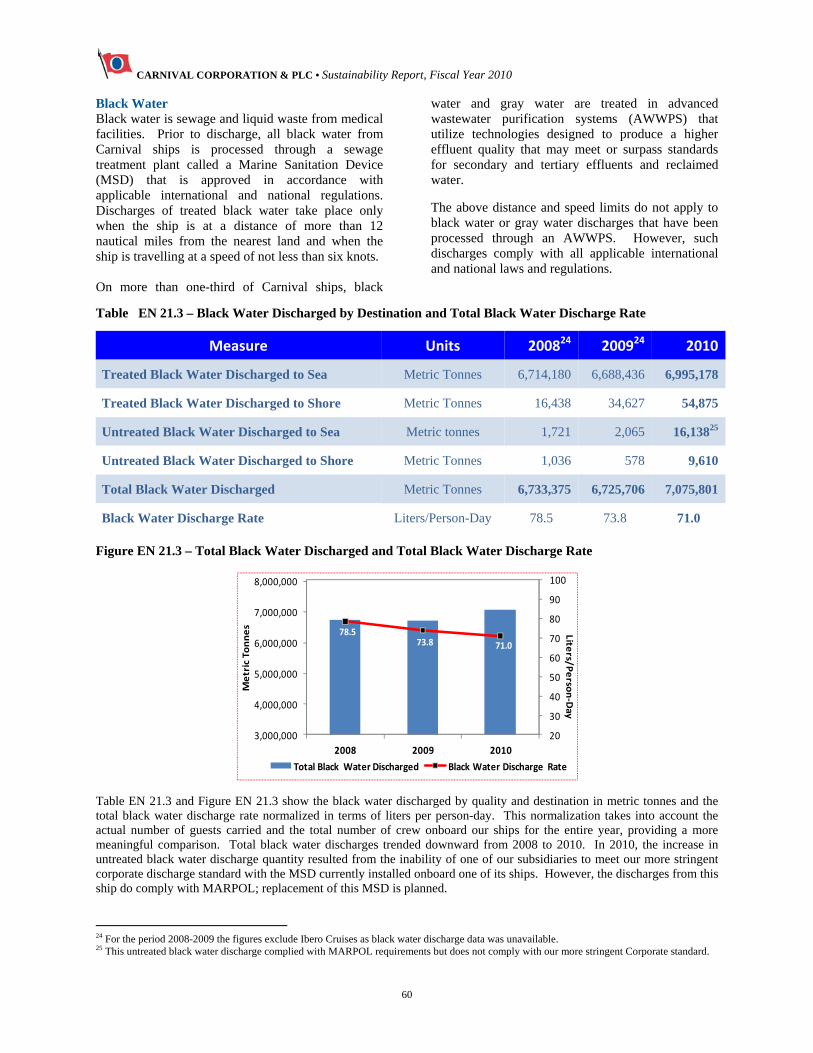
CARNIVAL CORPORATION & PLC • Sustainability Report, Fiscal Year 2010
60
Black Water Black water is sewage and liquid waste from medical facilities. Prior to discharge, all black water from Carnival ships is processed through a sewage treatment plant called a Marine Sanitation Device (MSD) that is approved in accordance with applicable international and national regulations. Discharges of treated black water take place only when the ship is at a distance of more than 12 nautical miles from the nearest land and when the ship is travelling at a speed of not less than six knots. On more than one-third of Carnival ships, black
water and gray water are treated in advanced wastewater purification systems (AWWPS) that utilize technologies designed to produce a higher effluent quality that may meet or surpass standards for secondary and tertiary effluents and reclaimed water.
The above distance and speed limits do not apply to black water or gray water discharges that have been processed through an AWWPS. However, such discharges comply with all applicable international and national laws and regulations.
Table EN 21.3 – Black Water Discharged by Destination and Total Black Water Discharge Rate
Measure Units 200824 200924 2010
Treated Black Water Discharged to Sea Metric Tonnes 6,714,180 6,688,436 6,995,178
Treated Black Water Discharged to Shore Metric Tonnes 16,438 34,627 54,875
Untreated Black Water Discharged to Sea Metric tonnes 1,721 2,065 16,13825
Untreated Black Water Discharged to Shore Metric Tonnes 1,036 578 9,610
Total Black Water Discharged Metric Tonnes 6,733,375 6,725,706 7,075,801
Black Water Discharge Rate Liters/Person-Day 78.5 73.8 71.0
Figure EN 21.3 – Total Black Water Discharged and Total Black Water Discharge Rate
78.573.8 71.0
20
30
40
50
60
70
80
90
100
3,000,000
4,000,000
5,000,000
6,000,000
7,000,000
8,000,000
2008 2009 2010
Liters/P
erso
n‐Day
Metric Tonnes
Total Black Water Discharged Black Water Discharge Rate
Table EN 21.3 and Figure EN 21.3 show the black water discharged by quality and destination in metric tonnes and the total black water discharge rate normalized in terms of liters per person-day. This normalization takes into account the actual number of guests carried and the total number of crew onboard our ships for the entire year, providing a more meaningful comparison. Total black water discharges trended downward from 2008 to 2010. In 2010, the increase in untreated black water discharge quantity resulted from the inability of one of our subsidiaries to meet our more stringent corporate discharge standard with the MSD currently installed onboard one of its ships. However, the discharges from this ship do comply with MARPOL; replacement of this MSD is planned.
24 For the period 2008-2009 the figures exclude Ibero Cruises as black water discharge data was unavailable. 25 This untreated black water discharge complied with MARPOL requirements but does not comply with our more stringent Corporate standard.
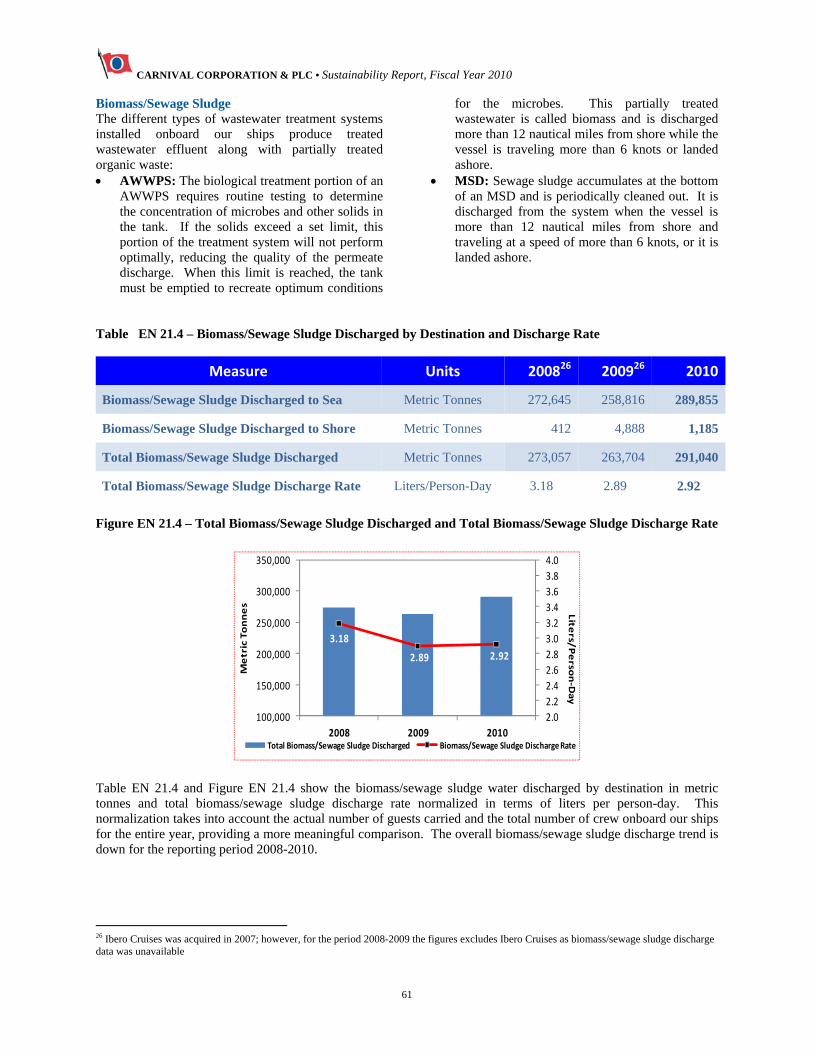
CARNIVAL CORPORATION & PLC • Sustainability Report, Fiscal Year 2010
61
Biomass/Sewage Sludge The different types of wastewater treatment systems installed onboard our ships produce treated wastewater effluent along with partially treated organic waste: AWWPS: The biological treatment portion of an
AWWPS requires routine testing to determine the concentration of microbes and other solids in the tank. If the solids exceed a set limit, this portion of the treatment system will not perform optimally, reducing the quality of the permeate discharge. When this limit is reached, the tank must be emptied to recreate optimum conditions
for the microbes. This partially treated wastewater is called biomass and is discharged more than 12 nautical miles from shore while the vessel is traveling more than 6 knots or landed ashore.
MSD: Sewage sludge accumulates at the bottom of an MSD and is periodically cleaned out. It is discharged from the system when the vessel is more than 12 nautical miles from shore and traveling at a speed of more than 6 knots, or it is landed ashore.
Table EN 21.4 – Biomass/Sewage Sludge Discharged by Destination and Discharge Rate
Measure Units 200826 200926 2010
Biomass/Sewage Sludge Discharged to Sea Metric Tonnes 272,645 258,816 289,855
Biomass/Sewage Sludge Discharged to Shore Metric Tonnes 412 4,888 1,185
Total Biomass/Sewage Sludge Discharged Metric Tonnes 273,057 263,704 291,040
Total Biomass/Sewage Sludge Discharge Rate Liters/Person-Day 3.18 2.89 2.92
Figure EN 21.4 – Total Biomass/Sewage Sludge Discharged and Total Biomass/Sewage Sludge Discharge Rate
3.18
2.89 2.92
2.0
2.2
2.4
2.6
2.8
3.0
3.2
3.4
3.6
3.8
4.0
100,000
150,000
200,000
250,000
300,000
350,000
2008 2009 2010
Lite
rs/Perso
n‐Day
Metric Tonnes
Total Biomass/Sewage Sludge Discharged Biomass/Sewage Sludge Discharge Rate
Table EN 21.4 and Figure EN 21.4 show the biomass/sewage sludge water discharged by destination in metric tonnes and total biomass/sewage sludge discharge rate normalized in terms of liters per person-day. This normalization takes into account the actual number of guests carried and the total number of crew onboard our ships for the entire year, providing a more meaningful comparison. The overall biomass/sewage sludge discharge trend is down for the reporting period 2008-2010.
26 Ibero Cruises was acquired in 2007; however, for the period 2008-2009 the figures excludes Ibero Cruises as biomass/sewage sludge discharge data was unavailable
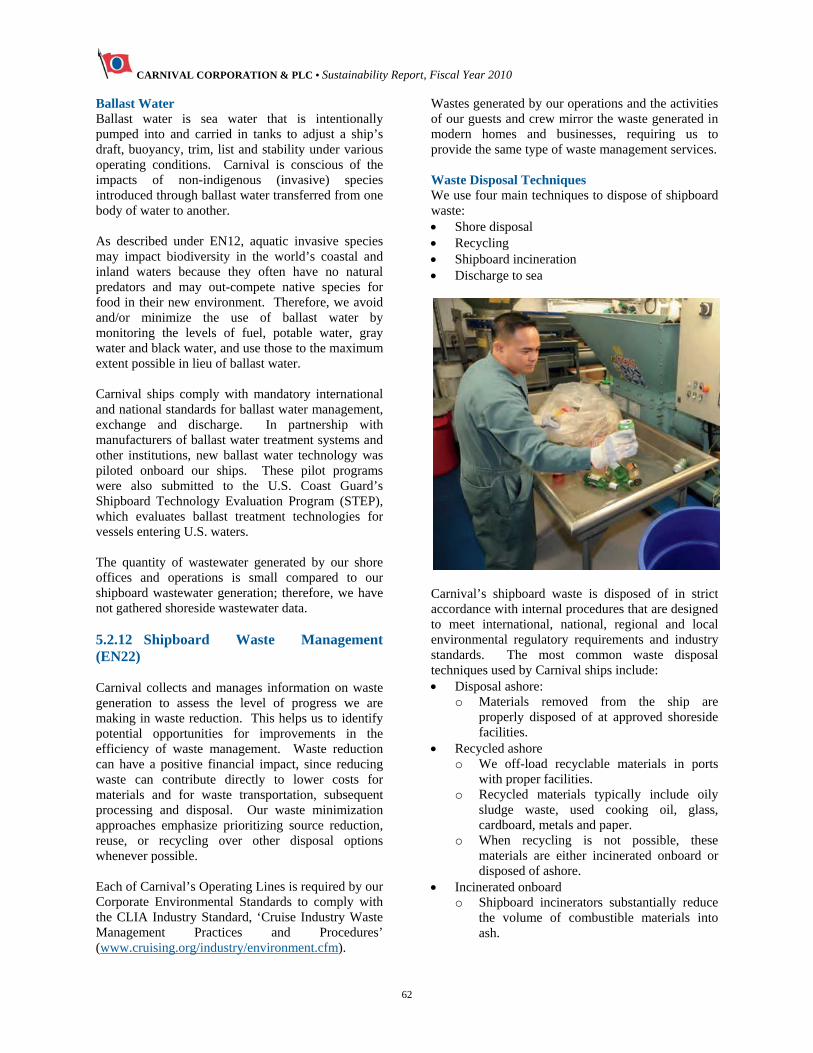
CARNIVAL CORPORATION & PLC • Sustainability Report, Fiscal Year 2010
62
Ballast Water Ballast water is sea water that is intentionally pumped into and carried in tanks to adjust a ship’s draft, buoyancy, trim, list and stability under various operating conditions. Carnival is conscious of the impacts of non-indigenous (invasive) species introduced through ballast water transferred from one body of water to another. As described under EN12, aquatic invasive species may impact biodiversity in the world’s coastal and inland waters because they often have no natural predators and may out-compete native species for food in their new environment. Therefore, we avoid and/or minimize the use of ballast water by monitoring the levels of fuel, potable water, gray water and black water, and use those to the maximum extent possible in lieu of ballast water. Carnival ships comply with mandatory international and national standards for ballast water management, exchange and discharge. In partnership with manufacturers of ballast water treatment systems and other institutions, new ballast water technology was piloted onboard our ships. These pilot programs were also submitted to the U.S. Coast Guard’s Shipboard Technology Evaluation Program (STEP), which evaluates ballast treatment technologies for vessels entering U.S. waters. The quantity of wastewater generated by our shore offices and operations is small compared to our shipboard wastewater generation; therefore, we have not gathered shoreside wastewater data. 5.2.12 Shipboard Waste Management (EN22) Carnival collects and manages information on waste generation to assess the level of progress we are making in waste reduction. This helps us to identify potential opportunities for improvements in the efficiency of waste management. Waste reduction can have a positive financial impact, since reducing waste can contribute directly to lower costs for materials and for waste transportation, subsequent processing and disposal. Our waste minimization approaches emphasize prioritizing source reduction, reuse, or recycling over other disposal options whenever possible. Each of Carnival’s Operating Lines is required by our Corporate Environmental Standards to comply with the CLIA Industry Standard, ‘Cruise Industry Waste Management Practices and Procedures’ (www.cruising.org/industry/environment.cfm).
Wastes generated by our operations and the activities of our guests and crew mirror the waste generated in modern homes and businesses, requiring us to provide the same type of waste management services. Waste Disposal Techniques We use four main techniques to dispose of shipboard waste: Shore disposal Recycling Shipboard incineration Discharge to sea
Carnival’s shipboard waste is disposed of in strict accordance with internal procedures that are designed to meet international, national, regional and local environmental regulatory requirements and industry standards. The most common waste disposal techniques used by Carnival ships include: Disposal ashore:
o Materials removed from the ship are properly disposed of at approved shoreside facilities.
Recycled ashore o We off-load recyclable materials in ports
with proper facilities. o Recycled materials typically include oily
sludge waste, used cooking oil, glass, cardboard, metals and paper.
o When recycling is not possible, these materials are either incinerated onboard or disposed of ashore.
Incinerated onboard o Shipboard incinerators substantially reduce
the volume of combustible materials into ash.
CARNIVAL CORPORATION & PLC • Sustainability Report, Fiscal Year 2010
63
o Waste is carefully sorted to assure that only proper materials are introduced to the incinerator, a vast majority of which are paper and cardboard.
o The ash is tested annually to confirm that it is not a hazardous waste, and then it is properly disposed of ashore.
Discharged to sea o Only food waste and ground glass are
discharged to the sea from Carnival ships. o These materials are discharged at more than
12 nautical miles (nm) from shore, or 3 nm if the waste is ground to no more than 25 millimeters.
o Food waste is consumed by creatures in the sea.
o Ground glass is environmentally benign.
There are two main types of shipboard waste: Hazardous. Non-hazardous. It is a challenge to report waste data in terms of weight in the maritime industry because MARPOL specifies an internationally recognized volumetric unit of measurement - cubic meters. We use standard density factors for the various waste types to convert the amounts of waste normally measured and reported in cubic meters to metric tonnes. Hazardous waste is waste that poses a risk to human health or the environment. We classify shipboard waste as “hazardous” based on the requirements of the jurisdiction where the waste is offloaded for disposal. Some jurisdictions classify oily sludge as hazardous waste. In jurisdictions that classify oily sludge as hazardous waste, oily sludge makes up the majority of hazardous waste offloaded for disposal. There are two main methods for hazardous waste disposal: disposal ashore and recycling, while a very small quantity is incinerated. Hazardous waste disposal is normally less than 5% of total waste disposal and is transferred to licensed shoreside waste contractors for correct disposal.
Table EN 22.1 – Total Weight of Waste by Type and Disposal Method
Table EN 22.1 shows the total weight of waste by type and disposal method generated from our shipboard operations. The ‘hazardous waste incinerated shipboard’ reported above is limited to used cooking oil, bio-hazardous waste from the ships’ medical facilities and oily rags from machinery space cleaning. These items may be classified as hazardous waste if landed in some jurisdictions.
27 Ibero Cruises was acquired in 2007; however, for the period 2008-2009 the figures excludes Ibero Cruises as waste data was unavailable.
Measure Units 200827 200927 2010
Hazardous Waste Disposed to Shore Metric Tonnes 13,429 16,829 6,394
Hazardous Waste Recycled Metric Tonnes 1,300 1,429 17,919
Hazardous Waste Incinerated Shipboard Metric Tonnes 483 833 1,150
Non-Hazardous Waste Disposed to Shore Metric Tonnes 192,666 161,842 135,067
Non-Hazardous Waste Recycled Metric Tonnes 25,281 50,670 109,099
Non-Hazardous Waste Discharged to Sea Metric Tonnes 103,803 107,030 123,760
Non-Hazardous Waste Incinerated Shipboard Metric Tonnes 180,105 108,686 95,686
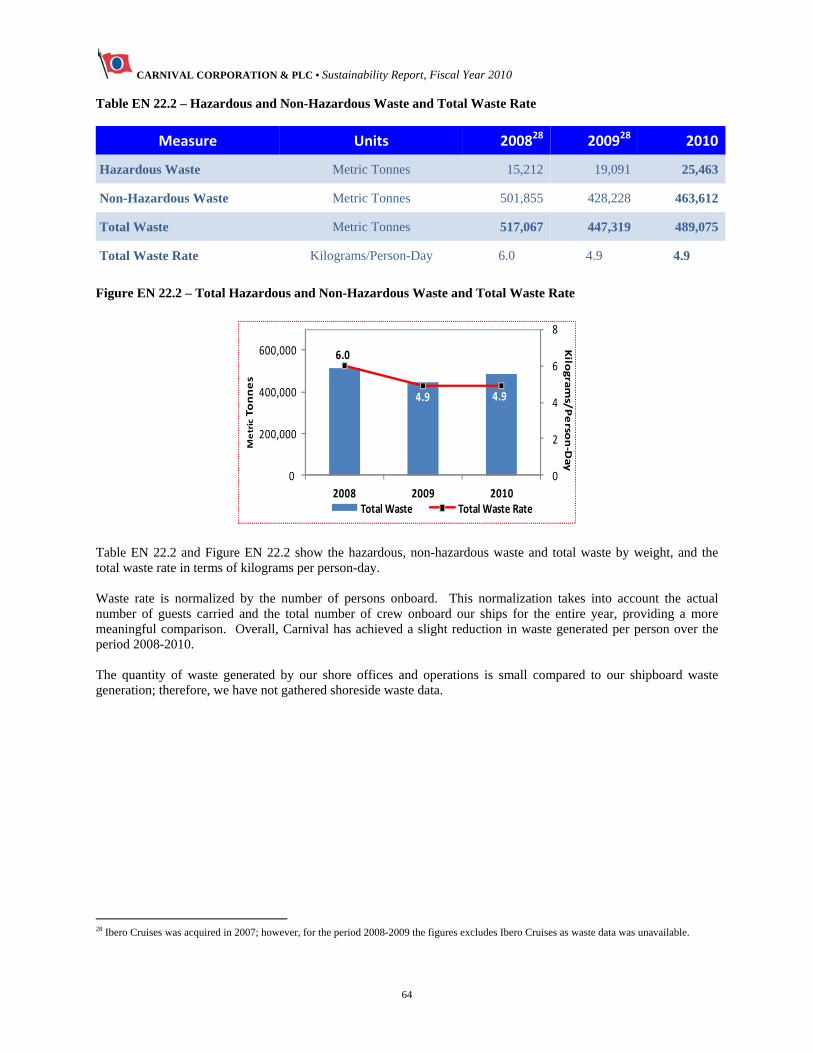
CARNIVAL CORPORATION & PLC • Sustainability Report, Fiscal Year 2010
64
Table EN 22.2 – Hazardous and Non-Hazardous Waste and Total Waste Rate
Measure Units 200828 200928 2010
Hazardous Waste Metric Tonnes 15,212 19,091 25,463
Non-Hazardous Waste Metric Tonnes 501,855 428,228 463,612
Total Waste Metric Tonnes 517,067 447,319 489,075
Total Waste Rate Kilograms/Person-Day 6.0 4.9 4.9
Figure EN 22.2 – Total Hazardous and Non-Hazardous Waste and Total Waste Rate
6.0
4.9 4.9
0
2
4
6
8
0
200,000
400,000
600,000
2008 2009 2010
Kilo
grams/Perso
n‐Day
Metric Tonnes
Total Waste Total Waste Rate
Table EN 22.2 and Figure EN 22.2 show the hazardous, non-hazardous waste and total waste by weight, and the total waste rate in terms of kilograms per person-day. Waste rate is normalized by the number of persons onboard. This normalization takes into account the actual number of guests carried and the total number of crew onboard our ships for the entire year, providing a more meaningful comparison. Overall, Carnival has achieved a slight reduction in waste generated per person over the period 2008-2010. The quantity of waste generated by our shore offices and operations is small compared to our shipboard waste generation; therefore, we have not gathered shoreside waste data.
28 Ibero Cruises was acquired in 2007; however, for the period 2008-2009 the figures excludes Ibero Cruises as waste data was unavailable.
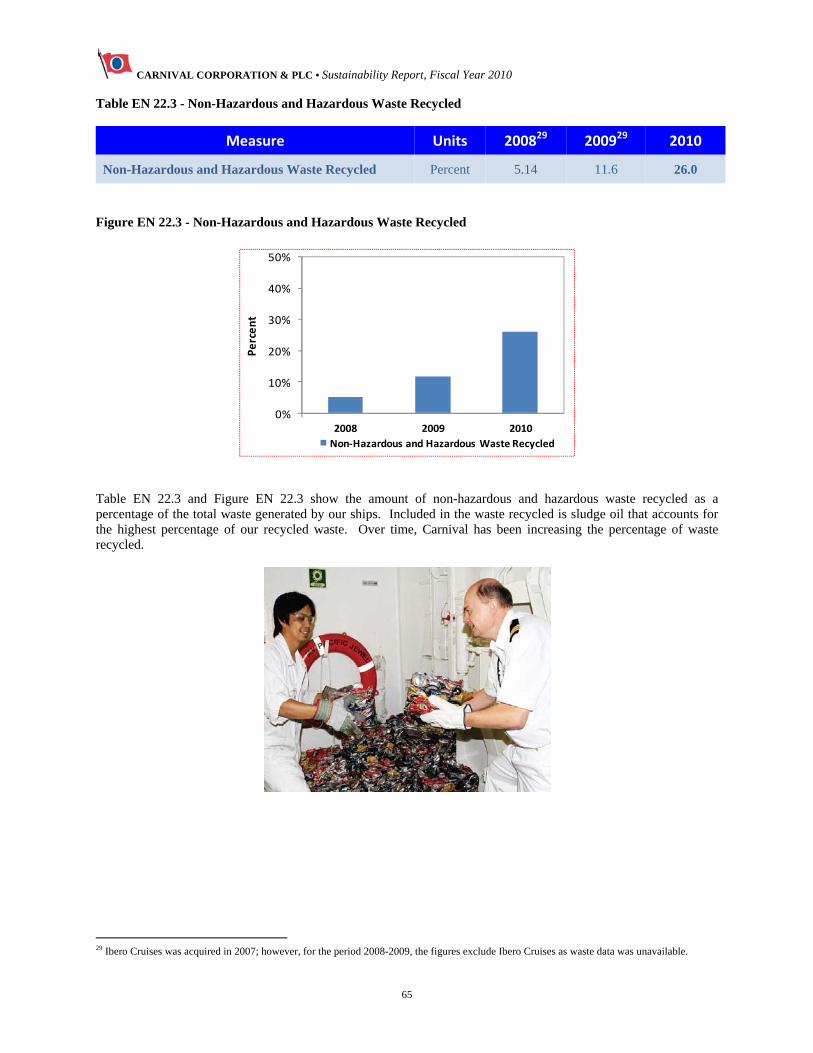
CARNIVAL CORPORATION & PLC • Sustainability Report, Fiscal Year 2010
65
Table EN 22.3 - Non-Hazardous and Hazardous Waste Recycled
Measure Units 200829 200929 2010
Non-Hazardous and Hazardous Waste Recycled Percent 5.14 11.6 26.0
Figure EN 22.3 - Non-Hazardous and Hazardous Waste Recycled
Table EN 22.3 and Figure EN 22.3 show the amount of non-hazardous and hazardous waste recycled as a percentage of the total waste generated by our ships. Included in the waste recycled is sludge oil that accounts for the highest percentage of our recycled waste. Over time, Carnival has been increasing the percentage of waste recycled.
29 Ibero Cruises was acquired in 2007; however, for the period 2008-2009, the figures exclude Ibero Cruises as waste data was unavailable.
0%
10%
20%
30%
40%
50%
2008 2009 2010
Percent
Non‐Hazardous and Hazardous Waste Recycled

CARNIVAL CORPORATION & PLC • Sustainability Report, Fiscal Year 2010
66
5.2.13 Significant Spills (EN23) Carnival recognizes that spills of fuels, oils, chemicals, wastewater and other materials can have significant negative impacts on the environments in which we operate. We make systematic efforts to avoid spills in order to comply with applicable regulations, to reduce financial risk from loss of materials and remediation costs, to reduce the risk of regulatory action, and to protect our reputation. We have a rigorous internal incident reporting system that requires the reporting of unintended or unexpected spills, releases or discharges (into the
bilge or overboard) of chemicals, oils, refrigerants or other ozone depleting substances (ODS), solid waste/materials, and non-hazardous liquid waste. We also use this indicator to indirectly evaluate the effectiveness of our compliance monitoring systems. Spills, releases or discharges are reported to external authorities as required by applicable regulations. Carnival had no significant spills in Fiscal Year 2010. A “significant spill” is defined as a spill for which the monetary sanctions are $100,000 or greater and is reportable in the Carnival Corporation & plc Annual Report on Form 10-K.
Table EN 23.1 – Total Number and Volume of Reportable Spills
Measure Units 200830 200930 2010
Total Number of Reportable Spills Number 55 54 26
Total Volume of Reportable Spills Liters 2,294 4,333 984
Figure EN 23.1 – Total Number and Volume of Reportable Spills
2,294
4,333
984
0
1,000
2,000
3,000
4,000
5,000
0
10
20
30
40
50
60
2008 2009 2010
Liters
Number
Total # of Reportable Spills Total Volume of Reportable Spills
Table EN 23.1 and Figure EN 23.1 show the total number and volume in liters of reportable spills of chemicals, oils and fuels reported in accordance with Carnival’s incident reporting standard. Typically, spills occur due to the accidental discharge or operational leak of fuel/hydraulic oil, paint or chemicals. Most spills are inadvertent releases of hydraulic oil or lubricating oil from our shipboard equipment and systems. These systems operate under high pressure. Their repeated operation causes wear that sometimes results in leaks. For internal reporting purposes, Carnival has defined a “reportable spill” as a release that is in excess of 0.5 liter (500 ml). However, in U.S. waters, a spill that causes oil sheen is also reported and included in the total number of spills recorded, even though the volume may be less than 0.5 liters.
30 Ibero Cruises was acquired in 2007; however, for the period 2008-2009, the figures exclude Ibero Cruises as spill data was unavailable.
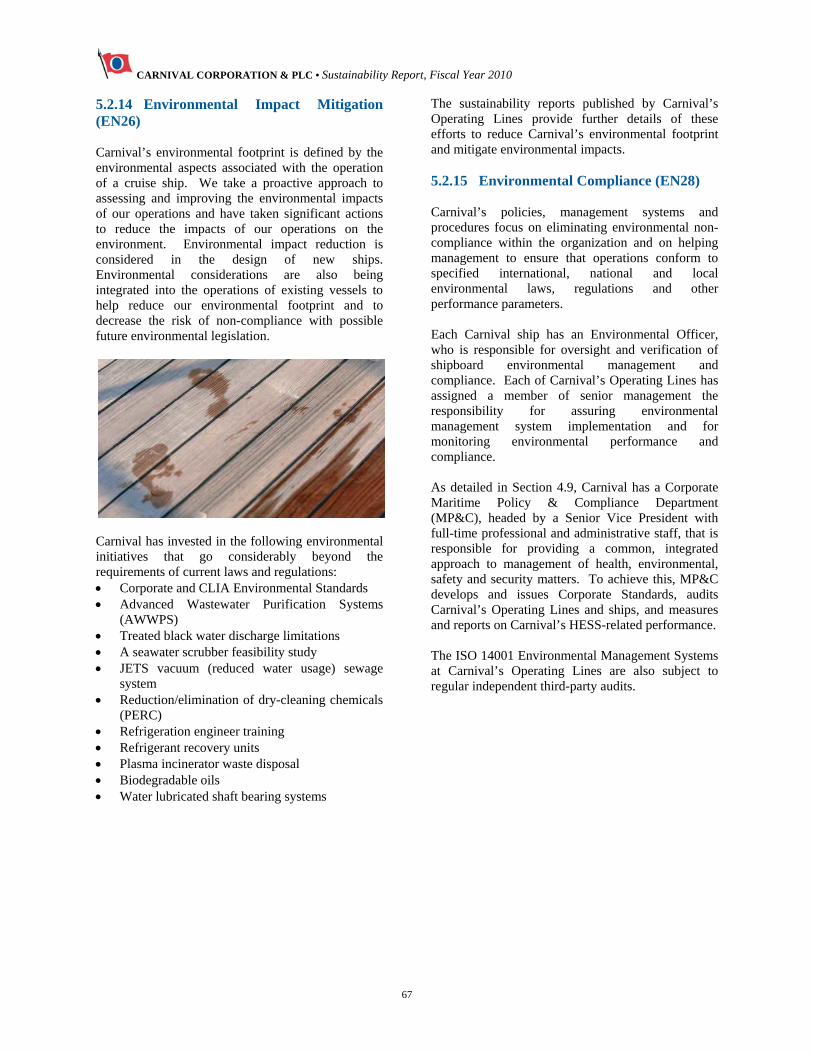
CARNIVAL CORPORATION & PLC • Sustainability Report, Fiscal Year 2010
67
5.2.14 Environmental Impact Mitigation (EN26) Carnival’s environmental footprint is defined by the environmental aspects associated with the operation of a cruise ship. We take a proactive approach to assessing and improving the environmental impacts of our operations and have taken significant actions to reduce the impacts of our operations on the environment. Environmental impact reduction is considered in the design of new ships. Environmental considerations are also being integrated into the operations of existing vessels to help reduce our environmental footprint and to decrease the risk of non-compliance with possible future environmental legislation.
Carnival has invested in the following environmental initiatives that go considerably beyond the requirements of current laws and regulations: Corporate and CLIA Environmental Standards Advanced Wastewater Purification Systems
(AWWPS) Treated black water discharge limitations A seawater scrubber feasibility study JETS vacuum (reduced water usage) sewage
system Reduction/elimination of dry-cleaning chemicals
(PERC) Refrigeration engineer training Refrigerant recovery units Plasma incinerator waste disposal Biodegradable oils Water lubricated shaft bearing systems
The sustainability reports published by Carnival’s Operating Lines provide further details of these efforts to reduce Carnival’s environmental footprint and mitigate environmental impacts. 5.2.15 Environmental Compliance (EN28) Carnival’s policies, management systems and procedures focus on eliminating environmental non-compliance within the organization and on helping management to ensure that operations conform to specified international, national and local environmental laws, regulations and other performance parameters. Each Carnival ship has an Environmental Officer, who is responsible for oversight and verification of shipboard environmental management and compliance. Each of Carnival’s Operating Lines has assigned a member of senior management the responsibility for assuring environmental management system implementation and for monitoring environmental performance and compliance. As detailed in Section 4.9, Carnival has a Corporate Maritime Policy & Compliance Department (MP&C), headed by a Senior Vice President with full-time professional and administrative staff, that is responsible for providing a common, integrated approach to management of health, environmental, safety and security matters. To achieve this, MP&C develops and issues Corporate Standards, audits Carnival’s Operating Lines and ships, and measures and reports on Carnival’s HESS-related performance. The ISO 14001 Environmental Management Systems at Carnival’s Operating Lines are also subject to regular independent third-party audits.
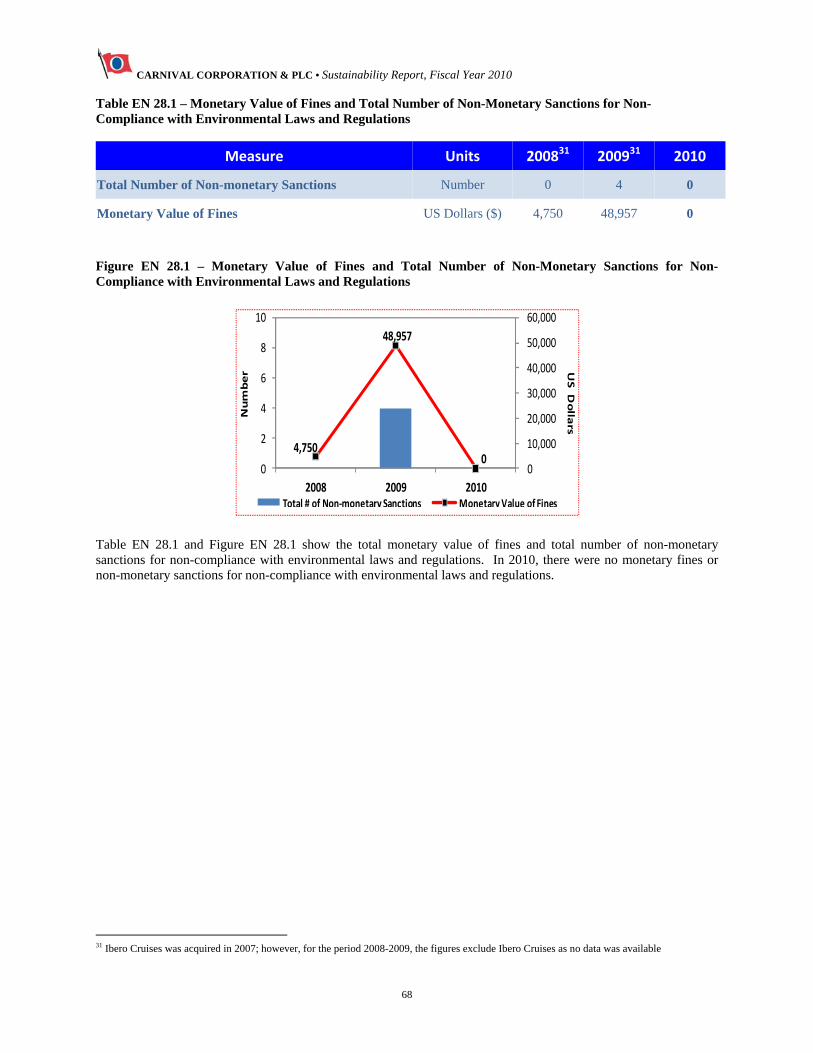
CARNIVAL CORPORATION & PLC • Sustainability Report, Fiscal Year 2010
68
Table EN 28.1 – Monetary Value of Fines and Total Number of Non-Monetary Sanctions for Non-Compliance with Environmental Laws and Regulations
Measure Units 200831 200931 2010
Total Number of Non-monetary Sanctions Number 0 4 0
Monetary Value of Fines US Dollars ($) 4,750 48,957 0
Figure EN 28.1 – Monetary Value of Fines and Total Number of Non-Monetary Sanctions for Non-Compliance with Environmental Laws and Regulations
4,750
48,957
00
10,000
20,000
30,000
40,000
50,000
60,000
0
2
4
6
8
10
2008 2009 2010
US D
ollars
Number
Total # of Non‐monetary Sanctions Monetary Value of Fines
Table EN 28.1 and Figure EN 28.1 show the total monetary value of fines and total number of non-monetary sanctions for non-compliance with environmental laws and regulations. In 2010, there were no monetary fines or non-monetary sanctions for non-compliance with environmental laws and regulations.
31 Ibero Cruises was acquired in 2007; however, for the period 2008-2009, the figures exclude Ibero Cruises as no data was available
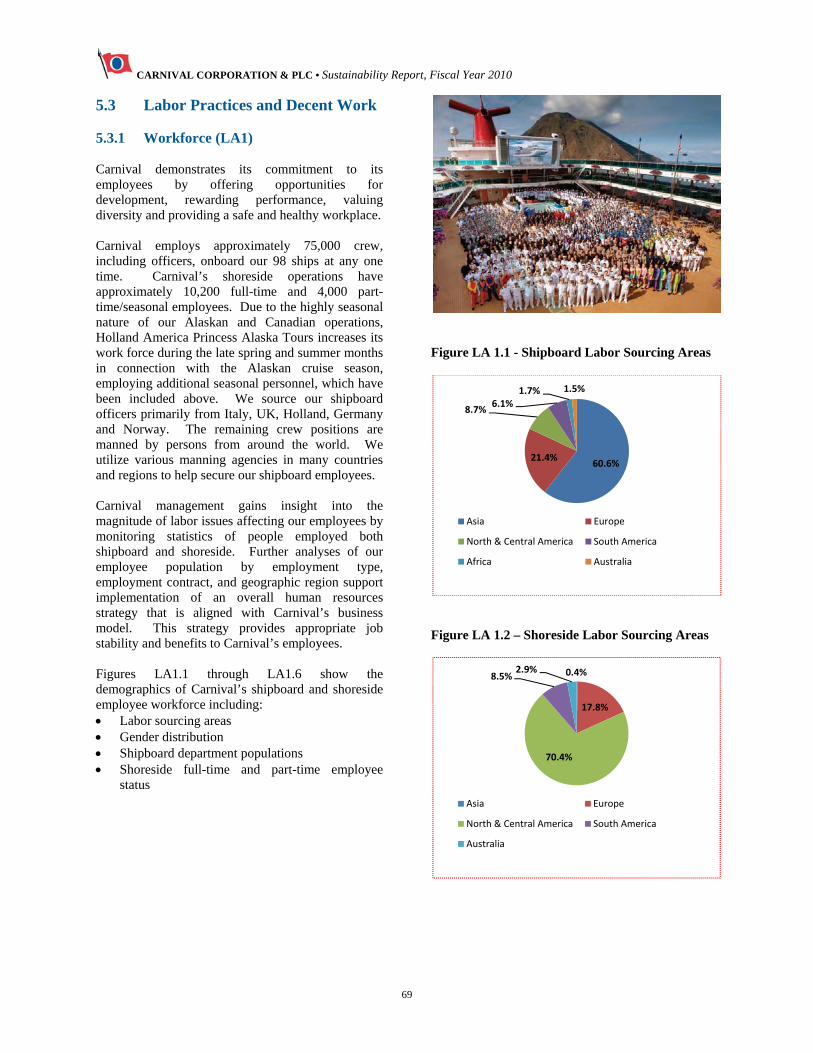
CARNIVAL CORPORATION & PLC • Sustainability Report, Fiscal Year 2010
69
5.3 Labor Practices and Decent Work 5.3.1 Workforce (LA1) Carnival demonstrates its commitment to its employees by offering opportunities for development, rewarding performance, valuing diversity and providing a safe and healthy workplace. Carnival employs approximately 75,000 crew, including officers, onboard our 98 ships at any one time. Carnival’s shoreside operations have approximately 10,200 full-time and 4,000 part-time/seasonal employees. Due to the highly seasonal nature of our Alaskan and Canadian operations, Holland America Princess Alaska Tours increases its work force during the late spring and summer months in connection with the Alaskan cruise season, employing additional seasonal personnel, which have been included above. We source our shipboard officers primarily from Italy, UK, Holland, Germany and Norway. The remaining crew positions are manned by persons from around the world. We utilize various manning agencies in many countries and regions to help secure our shipboard employees. Carnival management gains insight into the magnitude of labor issues affecting our employees by monitoring statistics of people employed both shipboard and shoreside. Further analyses of our employee population by employment type, employment contract, and geographic region support implementation of an overall human resources strategy that is aligned with Carnival’s business model. This strategy provides appropriate job stability and benefits to Carnival’s employees. Figures LA1.1 through LA1.6 show the demographics of Carnival’s shipboard and shoreside employee workforce including: Labor sourcing areas Gender distribution Shipboard department populations Shoreside full-time and part-time employee
status
Figure LA 1.1 - Shipboard Labor Sourcing Areas
Figure LA 1.2 – Shoreside Labor Sourcing Areas
60.6%21.4%
8.7%6.1%
1.7% 1.5%
Asia Europe
North & Central America South America
Africa Australia
0.4%
17.8%
70.4%
8.5%2.9%
Asia Europe
North & Central America South America
Australia
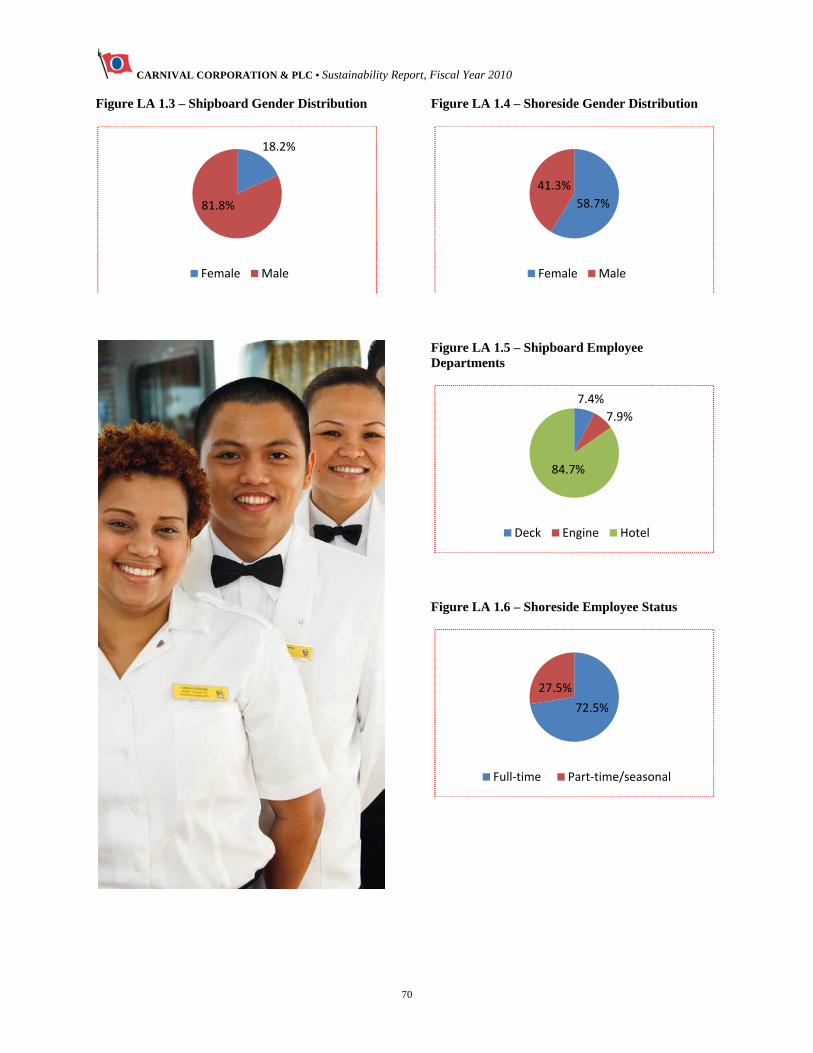
CARNIVAL CORPORATION & PLC • Sustainability Report, Fiscal Year 2010
70
Figure LA 1.3 – Shipboard Gender Distribution
Figure LA 1.4 – Shoreside Gender Distribution
Figure LA 1.5 – Shipboard Employee Departments
Figure LA 1.6 – Shoreside Employee Status
18.2%
81.8%
Female Male
58.7%
41.3%
Female Male
7.4%
7.9%
84.7%
Deck Engine Hotel
72.5%
27.5%
Full‐time Part‐time/seasonal
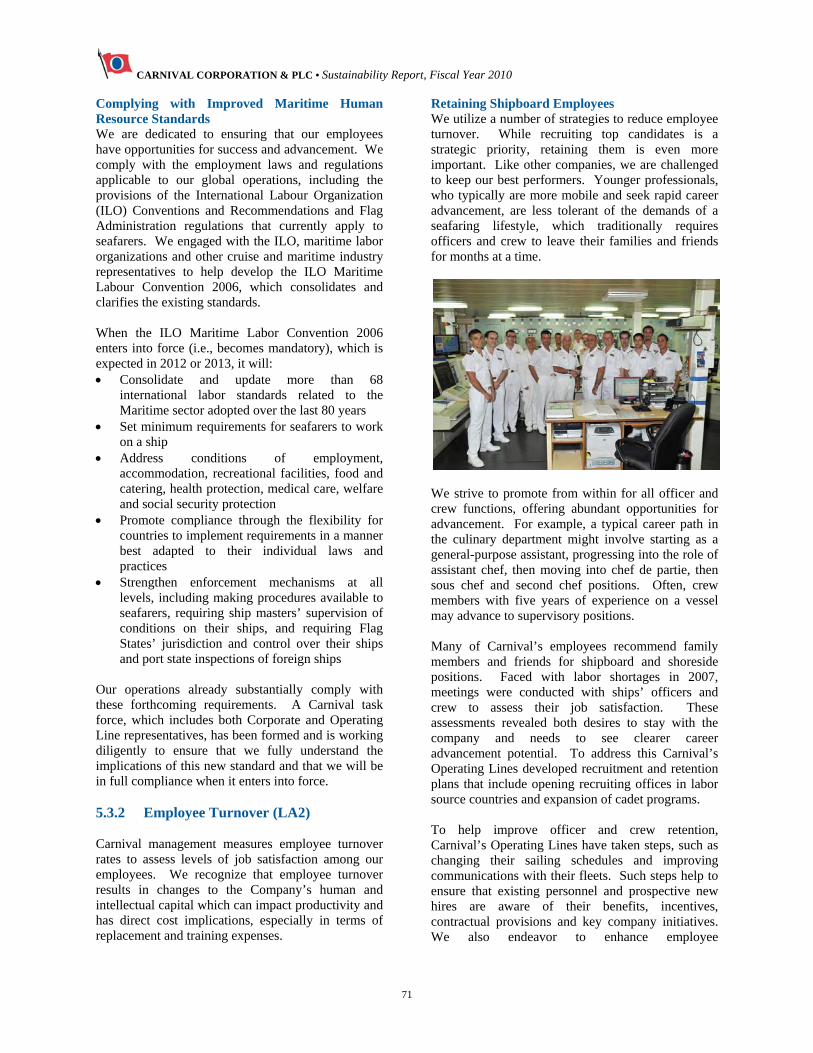
CARNIVAL CORPORATION & PLC • Sustainability Report, Fiscal Year 2010
71
Complying with Improved Maritime Human Resource Standards We are dedicated to ensuring that our employees have opportunities for success and advancement. We comply with the employment laws and regulations applicable to our global operations, including the provisions of the International Labour Organization (ILO) Conventions and Recommendations and Flag Administration regulations that currently apply to seafarers. We engaged with the ILO, maritime labor organizations and other cruise and maritime industry representatives to help develop the ILO Maritime Labour Convention 2006, which consolidates and clarifies the existing standards. When the ILO Maritime Labor Convention 2006 enters into force (i.e., becomes mandatory), which is expected in 2012 or 2013, it will: Consolidate and update more than 68
international labor standards related to the Maritime sector adopted over the last 80 years
Set minimum requirements for seafarers to work on a ship
Address conditions of employment, accommodation, recreational facilities, food and catering, health protection, medical care, welfare and social security protection
Promote compliance through the flexibility for countries to implement requirements in a manner best adapted to their individual laws and practices
Strengthen enforcement mechanisms at all levels, including making procedures available to seafarers, requiring ship masters’ supervision of conditions on their ships, and requiring Flag States’ jurisdiction and control over their ships and port state inspections of foreign ships
Our operations already substantially comply with these forthcoming requirements. A Carnival task force, which includes both Corporate and Operating Line representatives, has been formed and is working diligently to ensure that we fully understand the implications of this new standard and that we will be in full compliance when it enters into force. 5.3.2 Employee Turnover (LA2) Carnival management measures employee turnover rates to assess levels of job satisfaction among our employees. We recognize that employee turnover results in changes to the Company’s human and intellectual capital which can impact productivity and has direct cost implications, especially in terms of replacement and training expenses.
Retaining Shipboard Employees We utilize a number of strategies to reduce employee turnover. While recruiting top candidates is a strategic priority, retaining them is even more important. Like other companies, we are challenged to keep our best performers. Younger professionals, who typically are more mobile and seek rapid career advancement, are less tolerant of the demands of a seafaring lifestyle, which traditionally requires officers and crew to leave their families and friends for months at a time.
We strive to promote from within for all officer and crew functions, offering abundant opportunities for advancement. For example, a typical career path in the culinary department might involve starting as a general-purpose assistant, progressing into the role of assistant chef, then moving into chef de partie, then sous chef and second chef positions. Often, crew members with five years of experience on a vessel may advance to supervisory positions. Many of Carnival’s employees recommend family members and friends for shipboard and shoreside positions. Faced with labor shortages in 2007, meetings were conducted with ships’ officers and crew to assess their job satisfaction. These assessments revealed both desires to stay with the company and needs to see clearer career advancement potential. To address this Carnival’s Operating Lines developed recruitment and retention plans that include opening recruiting offices in labor source countries and expansion of cadet programs. To help improve officer and crew retention, Carnival’s Operating Lines have taken steps, such as changing their sailing schedules and improving communications with their fleets. Such steps help to ensure that existing personnel and prospective new hires are aware of their benefits, incentives, contractual provisions and key company initiatives. We also endeavor to enhance employee
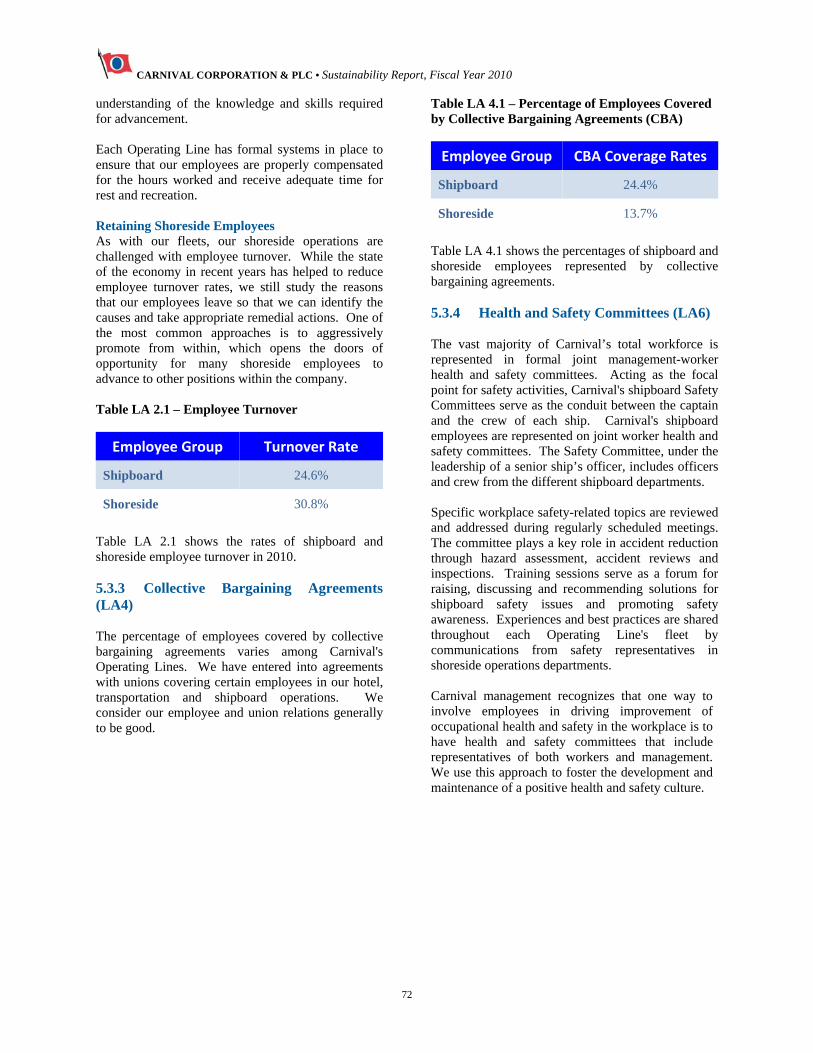
CARNIVAL CORPORATION & PLC • Sustainability Report, Fiscal Year 2010
72
understanding of the knowledge and skills required for advancement. Each Operating Line has formal systems in place to ensure that our employees are properly compensated for the hours worked and receive adequate time for rest and recreation. Retaining Shoreside Employees As with our fleets, our shoreside operations are challenged with employee turnover. While the state of the economy in recent years has helped to reduce employee turnover rates, we still study the reasons that our employees leave so that we can identify the causes and take appropriate remedial actions. One of the most common approaches is to aggressively promote from within, which opens the doors of opportunity for many shoreside employees to advance to other positions within the company. Table LA 2.1 – Employee Turnover
Employee Group Turnover Rate
Shipboard 24.6%
Shoreside 30.8%
Table LA 2.1 shows the rates of shipboard and shoreside employee turnover in 2010. 5.3.3 Collective Bargaining Agreements (LA4) The percentage of employees covered by collective bargaining agreements varies among Carnival's Operating Lines. We have entered into agreements with unions covering certain employees in our hotel, transportation and shipboard operations. We consider our employee and union relations generally to be good.
Table LA 4.1 – Percentage of Employees Covered by Collective Bargaining Agreements (CBA)
Employee Group CBA Coverage Rates
Shipboard 24.4%
Shoreside 13.7%
Table LA 4.1 shows the percentages of shipboard and shoreside employees represented by collective bargaining agreements. 5.3.4 Health and Safety Committees (LA6) The vast majority of Carnival’s total workforce is represented in formal joint management-worker health and safety committees. Acting as the focal point for safety activities, Carnival's shipboard Safety Committees serve as the conduit between the captain and the crew of each ship. Carnival's shipboard employees are represented on joint worker health and safety committees. The Safety Committee, under the leadership of a senior ship’s officer, includes officers and crew from the different shipboard departments. Specific workplace safety-related topics are reviewed and addressed during regularly scheduled meetings. The committee plays a key role in accident reduction through hazard assessment, accident reviews and inspections. Training sessions serve as a forum for raising, discussing and recommending solutions for shipboard safety issues and promoting safety awareness. Experiences and best practices are shared throughout each Operating Line's fleet by communications from safety representatives in shoreside operations departments. Carnival management recognizes that one way to involve employees in driving improvement of occupational health and safety in the workplace is to have health and safety committees that include representatives of both workers and management. We use this approach to foster the development and maintenance of a positive health and safety culture.
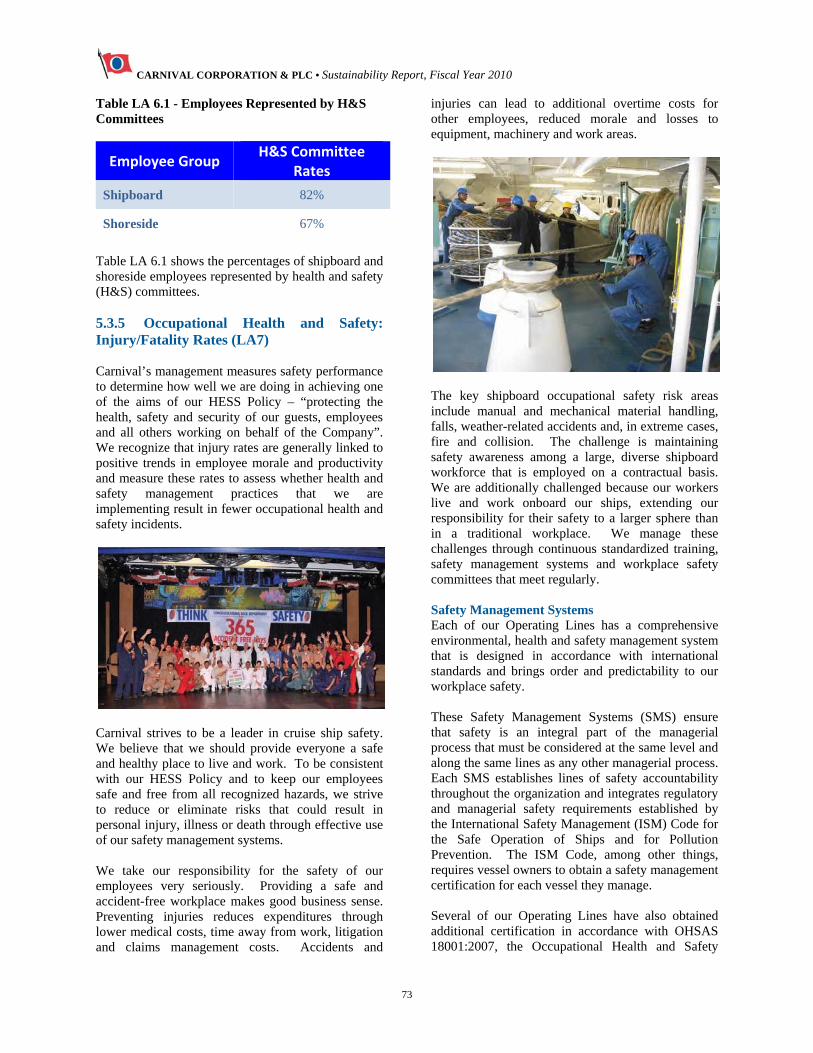
CARNIVAL CORPORATION & PLC • Sustainability Report, Fiscal Year 2010
73
Table LA 6.1 - Employees Represented by H&S Committees
Employee Group H&S Committee
Rates
Shipboard 82%
Shoreside 67%
Table LA 6.1 shows the percentages of shipboard and shoreside employees represented by health and safety (H&S) committees. 5.3.5 Occupational Health and Safety: Injury/Fatality Rates (LA7) Carnival’s management measures safety performance to determine how well we are doing in achieving one of the aims of our HESS Policy – “protecting the health, safety and security of our guests, employees and all others working on behalf of the Company”. We recognize that injury rates are generally linked to positive trends in employee morale and productivity and measure these rates to assess whether health and safety management practices that we are implementing result in fewer occupational health and safety incidents.
Carnival strives to be a leader in cruise ship safety. We believe that we should provide everyone a safe and healthy place to live and work. To be consistent with our HESS Policy and to keep our employees safe and free from all recognized hazards, we strive to reduce or eliminate risks that could result in personal injury, illness or death through effective use of our safety management systems. We take our responsibility for the safety of our employees very seriously. Providing a safe and accident-free workplace makes good business sense. Preventing injuries reduces expenditures through lower medical costs, time away from work, litigation and claims management costs. Accidents and
injuries can lead to additional overtime costs for other employees, reduced morale and losses to equipment, machinery and work areas.
The key shipboard occupational safety risk areas include manual and mechanical material handling, falls, weather-related accidents and, in extreme cases, fire and collision. The challenge is maintaining safety awareness among a large, diverse shipboard workforce that is employed on a contractual basis. We are additionally challenged because our workers live and work onboard our ships, extending our responsibility for their safety to a larger sphere than in a traditional workplace. We manage these challenges through continuous standardized training, safety management systems and workplace safety committees that meet regularly. Safety Management Systems Each of our Operating Lines has a comprehensive environmental, health and safety management system that is designed in accordance with international standards and brings order and predictability to our workplace safety. These Safety Management Systems (SMS) ensure that safety is an integral part of the managerial process that must be considered at the same level and along the same lines as any other managerial process. Each SMS establishes lines of safety accountability throughout the organization and integrates regulatory and managerial safety requirements established by the International Safety Management (ISM) Code for the Safe Operation of Ships and for Pollution Prevention. The ISM Code, among other things, requires vessel owners to obtain a safety management certification for each vessel they manage. Several of our Operating Lines have also obtained additional certification in accordance with OHSAS 18001:2007, the Occupational Health and Safety
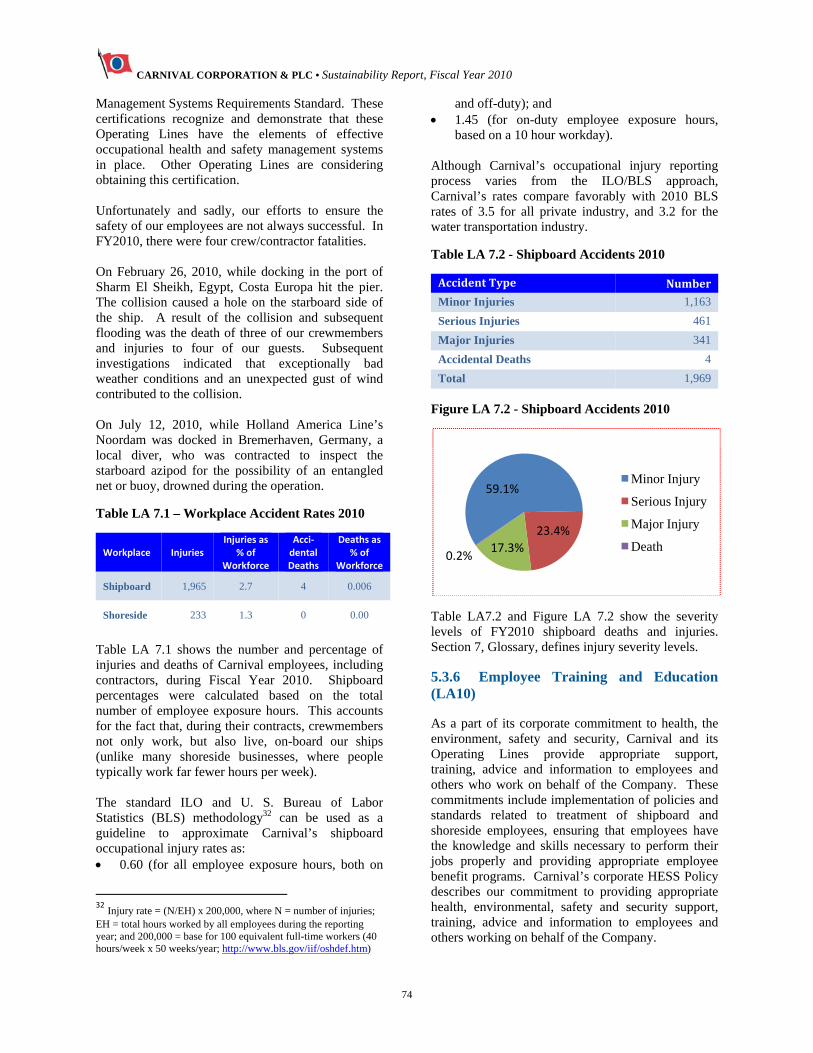
CARNIVAL CORPORATION & PLC • Sustainability Report, Fiscal Year 2010
74
Management Systems Requirements Standard. These certifications recognize and demonstrate that these Operating Lines have the elements of effective occupational health and safety management systems in place. Other Operating Lines are considering obtaining this certification. Unfortunately and sadly, our efforts to ensure the safety of our employees are not always successful. In FY2010, there were four crew/contractor fatalities. On February 26, 2010, while docking in the port of Sharm El Sheikh, Egypt, Costa Europa hit the pier. The collision caused a hole on the starboard side of the ship. A result of the collision and subsequent flooding was the death of three of our crewmembers and injuries to four of our guests. Subsequent investigations indicated that exceptionally bad weather conditions and an unexpected gust of wind contributed to the collision. On July 12, 2010, while Holland America Line’s Noordam was docked in Bremerhaven, Germany, a local diver, who was contracted to inspect the starboard azipod for the possibility of an entangled net or buoy, drowned during the operation.
Table LA 7.1 – Workplace Accident Rates 2010
Workplace Injuries Injuries as
% of Workforce
Acci‐dental Deaths
Deaths as % of
Workforce
Shipboard 1,965 2.7 4 0.006
Shoreside 233 1.3 0 0.00
Table LA 7.1 shows the number and percentage of injuries and deaths of Carnival employees, including contractors, during Fiscal Year 2010. Shipboard percentages were calculated based on the total number of employee exposure hours. This accounts for the fact that, during their contracts, crewmembers not only work, but also live, on-board our ships (unlike many shoreside businesses, where people typically work far fewer hours per week). The standard ILO and U. S. Bureau of Labor Statistics (BLS) methodology32 can be used as a guideline to approximate Carnival’s shipboard occupational injury rates as: 0.60 (for all employee exposure hours, both on
32 Injury rate = (N/EH) x 200,000, where N = number of injuries; EH = total hours worked by all employees during the reporting year; and 200,000 = base for 100 equivalent full-time workers (40 hours/week x 50 weeks/year; http://www.bls.gov/iif/oshdef.htm)
and off-duty); and 1.45 (for on-duty employee exposure hours,
based on a 10 hour workday). Although Carnival’s occupational injury reporting process varies from the ILO/BLS approach, Carnival’s rates compare favorably with 2010 BLS rates of 3.5 for all private industry, and 3.2 for the water transportation industry.
Table LA 7.2 - Shipboard Accidents 2010
Accident Type Number
Minor Injuries 1,163
Serious Injuries 461
Major Injuries 341
Accidental Deaths 4
Total 1,969 Figure LA 7.2 - Shipboard Accidents 2010
Table LA7.2 and Figure LA 7.2 show the severity levels of FY2010 shipboard deaths and injuries. Section 7, Glossary, defines injury severity levels. 5.3.6 Employee Training and Education (LA10) As a part of its corporate commitment to health, the environment, safety and security, Carnival and its Operating Lines provide appropriate support, training, advice and information to employees and others who work on behalf of the Company. These commitments include implementation of policies and standards related to treatment of shipboard and shoreside employees, ensuring that employees have the knowledge and skills necessary to perform their jobs properly and providing appropriate employee benefit programs. Carnival’s corporate HESS Policy describes our commitment to providing appropriate health, environmental, safety and security support, training, advice and information to employees and others working on behalf of the Company.
59.1%
23.4%
17.3%0.2%
Minor Injury
Serious Injury
Major Injury
Death
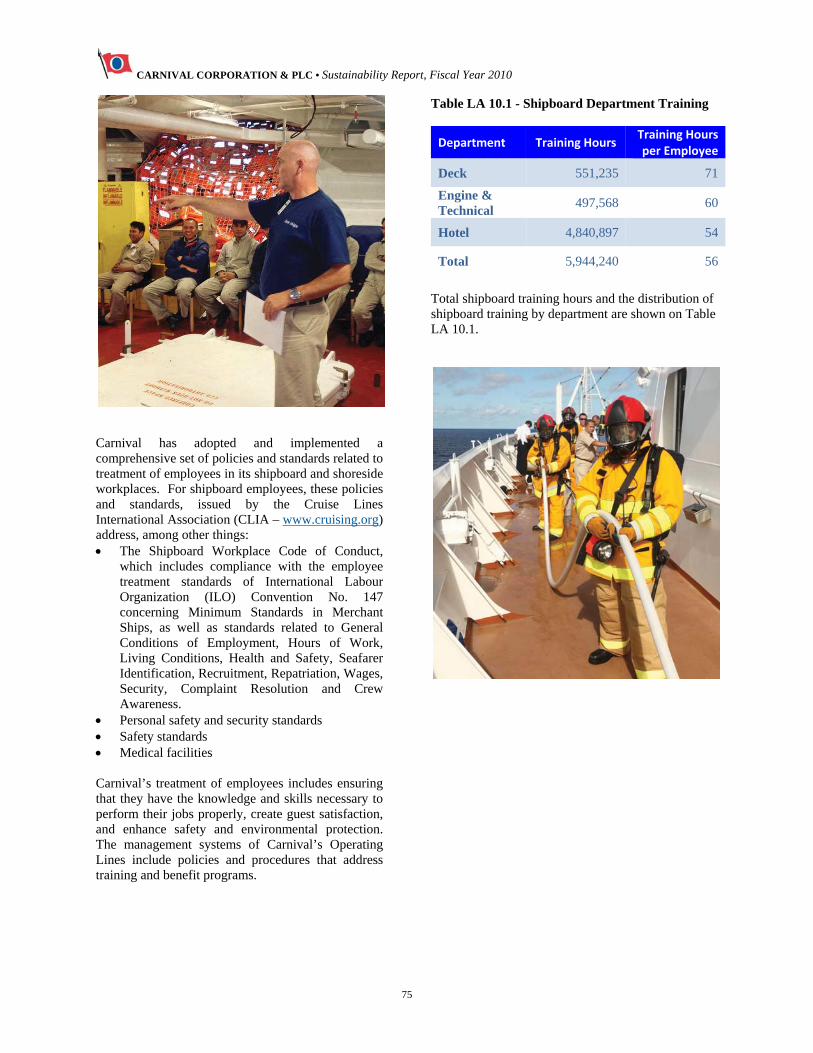
CARNIVAL CORPORATION & PLC • Sustainability Report, Fiscal Year 2010
75
Carnival has adopted and implemented a comprehensive set of policies and standards related to treatment of employees in its shipboard and shoreside workplaces. For shipboard employees, these policies and standards, issued by the Cruise Lines International Association (CLIA – www.cruising.org) address, among other things: The Shipboard Workplace Code of Conduct,
which includes compliance with the employee treatment standards of International Labour Organization (ILO) Convention No. 147 concerning Minimum Standards in Merchant Ships, as well as standards related to General Conditions of Employment, Hours of Work, Living Conditions, Health and Safety, Seafarer Identification, Recruitment, Repatriation, Wages, Security, Complaint Resolution and Crew Awareness.
Personal safety and security standards Safety standards Medical facilities Carnival’s treatment of employees includes ensuring that they have the knowledge and skills necessary to perform their jobs properly, create guest satisfaction, and enhance safety and environmental protection. The management systems of Carnival’s Operating Lines include policies and procedures that address training and benefit programs.
Table LA 10.1 - Shipboard Department Training
Department Training Hours Training Hours per Employee
Deck 551,235 71
Engine & Technical
497,568 60
Hotel 4,840,897 54
Total 5,944,240 56
Total shipboard training hours and the distribution of shipboard training by department are shown on Table LA 10.1.
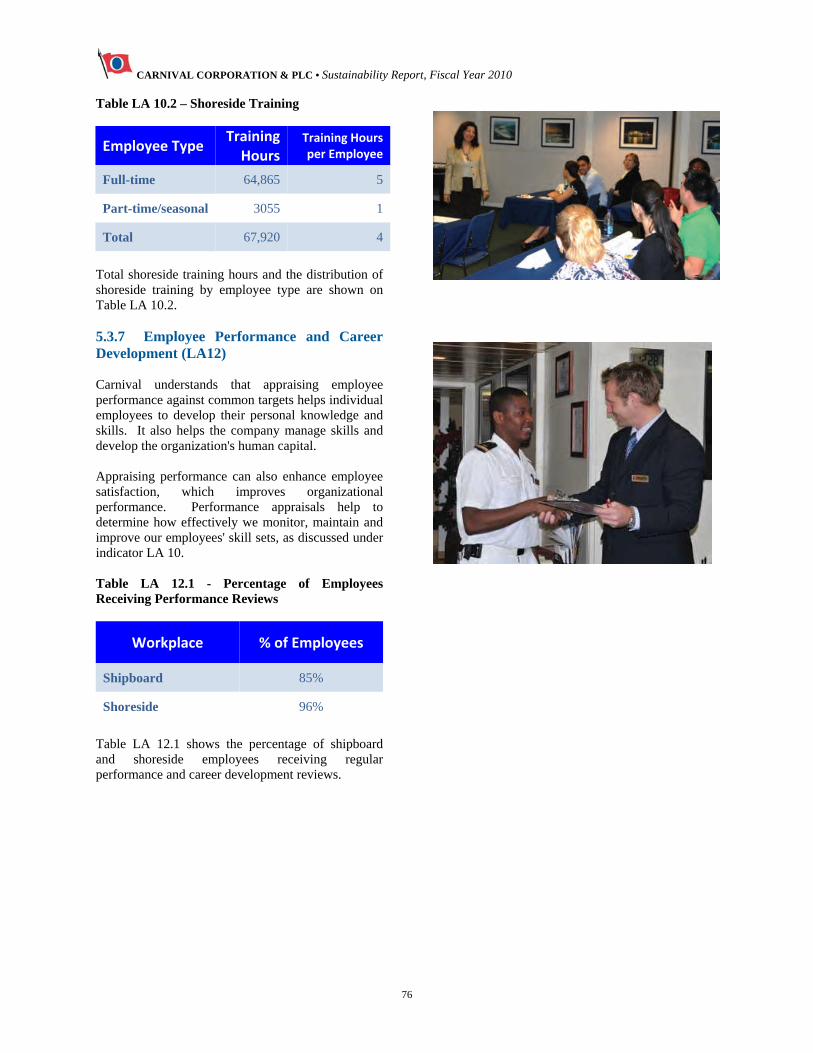
CARNIVAL CORPORATION & PLC • Sustainability Report, Fiscal Year 2010
76
Table LA 10.2 – Shoreside Training
Employee Type Training Hours
Training Hours per Employee
Full-time 64,865 5
Part-time/seasonal 3055 1
Total 67,920 4
Total shoreside training hours and the distribution of shoreside training by employee type are shown on Table LA 10.2. 5.3.7 Employee Performance and Career Development (LA12) Carnival understands that appraising employee performance against common targets helps individual employees to develop their personal knowledge and skills. It also helps the company manage skills and develop the organization's human capital. Appraising performance can also enhance employee satisfaction, which improves organizational performance. Performance appraisals help to determine how effectively we monitor, maintain and improve our employees' skill sets, as discussed under indicator LA 10. Table LA 12.1 - Percentage of Employees Receiving Performance Reviews
Workplace % of Employees
Shipboard 85%
Shoreside 96%
Table LA 12.1 shows the percentage of shipboard and shoreside employees receiving regular performance and career development reviews.

CARNIVAL CORPORATION & PLC • Sustainability Report, Fiscal Year 2010
77
5.4 Human Rights 5.4.1 Non-Discrimination (HR4) Creating Positive Work Environments To maintain harmony in Carnival's diverse workplace, we take positive steps to make sure it is free from unlawful acts of discrimination.
We also work to ensure that our workplace is free from harassment, which would include any form of unwelcome conduct towards another person that has the purpose or effect of creating an intimidating, hostile or offensive work environment for that person. While the definition of harassment may vary in the locations where we do business, our Company will not tolerate any form of harassing behavior. Maintaining a diverse workforce promotes an open, tolerant, and more positive work environment where everyone’s different talents and strengths are utilized. Our Company encourages such diversity and expects that we treat each other in a respectful, professional, and friendly manner. All Carnival employees are encouraged to report any harassment or discrimination concerns immediately. Reports are investigated and corrective actions issued as appropriate. Employees do not face retaliation for making a report in good faith.
Carnival has established a website (www.carnivalcompliance.com) that allows employees to report suspected issues of non-compliance and have their report reviewed and investigated by the Company. These principles are formalized in our Code of Business Conduct and Ethics, which can be viewed in the Corporate Governance section of our website. 5.4.2 Freedom of Association and Collective Bargaining (HR5) Carnival’s management recognizes our employees’ rights to freedom of association and to participate in collective bargaining. Freedom of association is a human right as defined by International Labour Organization (ILO) Conventions 87 and 98, and in the ILO Maritime Labour Convention 2006. The percentage of employees covered by collective bargaining agreements varies among Carnival's Operating Lines. We have entered into agreements with unions covering certain employees in our hotel, transportation and shipboard operations. We consider our employee and union relations to be good. All of Carnival's shipboard employees are offered written employment contracts based on their positions. Employment contract terms differ among officers, staff and crew and are based primarily on the needs and requirements of the departments where they work.
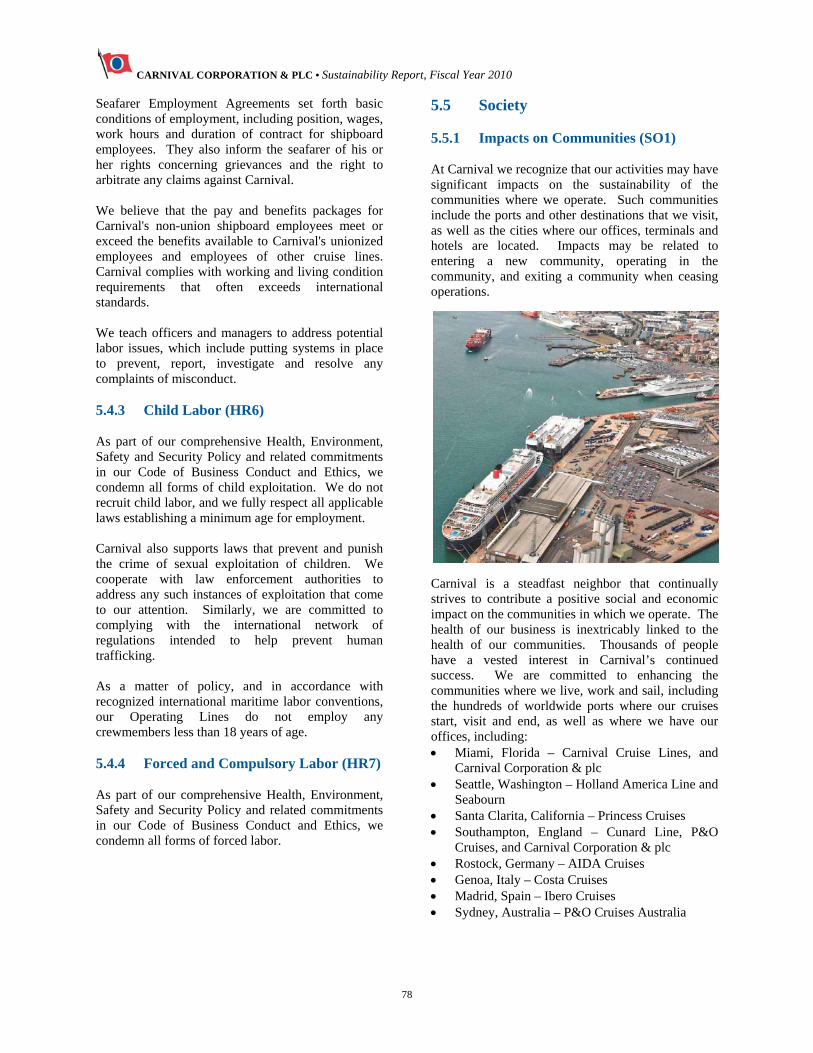
CARNIVAL CORPORATION & PLC • Sustainability Report, Fiscal Year 2010
78
Seafarer Employment Agreements set forth basic conditions of employment, including position, wages, work hours and duration of contract for shipboard employees. They also inform the seafarer of his or her rights concerning grievances and the right to arbitrate any claims against Carnival. We believe that the pay and benefits packages for Carnival's non-union shipboard employees meet or exceed the benefits available to Carnival's unionized employees and employees of other cruise lines. Carnival complies with working and living condition requirements that often exceeds international standards. We teach officers and managers to address potential labor issues, which include putting systems in place to prevent, report, investigate and resolve any complaints of misconduct. 5.4.3 Child Labor (HR6) As part of our comprehensive Health, Environment, Safety and Security Policy and related commitments in our Code of Business Conduct and Ethics, we condemn all forms of child exploitation. We do not recruit child labor, and we fully respect all applicable laws establishing a minimum age for employment. Carnival also supports laws that prevent and punish the crime of sexual exploitation of children. We cooperate with law enforcement authorities to address any such instances of exploitation that come to our attention. Similarly, we are committed to complying with the international network of regulations intended to help prevent human trafficking. As a matter of policy, and in accordance with recognized international maritime labor conventions, our Operating Lines do not employ any crewmembers less than 18 years of age. 5.4.4 Forced and Compulsory Labor (HR7) As part of our comprehensive Health, Environment, Safety and Security Policy and related commitments in our Code of Business Conduct and Ethics, we condemn all forms of forced labor.
5.5 Society 5.5.1 Impacts on Communities (SO1) At Carnival we recognize that our activities may have significant impacts on the sustainability of the communities where we operate. Such communities include the ports and other destinations that we visit, as well as the cities where our offices, terminals and hotels are located. Impacts may be related to entering a new community, operating in the community, and exiting a community when ceasing operations.
Carnival is a steadfast neighbor that continually strives to contribute a positive social and economic impact on the communities in which we operate. The health of our business is inextricably linked to the health of our communities. Thousands of people have a vested interest in Carnival’s continued success. We are committed to enhancing the communities where we live, work and sail, including the hundreds of worldwide ports where our cruises start, visit and end, as well as where we have our offices, including: Miami, Florida – Carnival Cruise Lines, and
Carnival Corporation & plc Seattle, Washington – Holland America Line and
Seabourn Santa Clarita, California – Princess Cruises Southampton, England – Cunard Line, P&O
Cruises, and Carnival Corporation & plc Rostock, Germany – AIDA Cruises Genoa, Italy – Costa Cruises Madrid, Spain – Ibero Cruises Sydney, Australia – P&O Cruises Australia
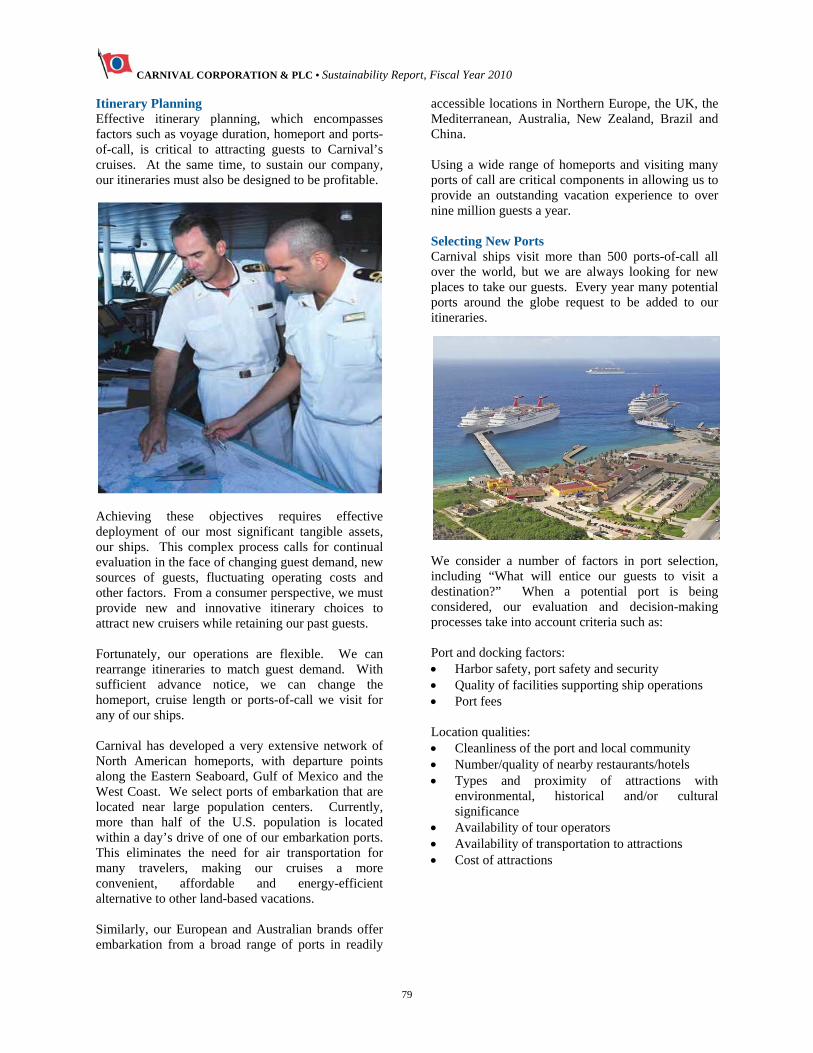
CARNIVAL CORPORATION & PLC • Sustainability Report, Fiscal Year 2010
79
Itinerary Planning Effective itinerary planning, which encompasses factors such as voyage duration, homeport and ports-of-call, is critical to attracting guests to Carnival’s cruises. At the same time, to sustain our company, our itineraries must also be designed to be profitable.
Achieving these objectives requires effective deployment of our most significant tangible assets, our ships. This complex process calls for continual evaluation in the face of changing guest demand, new sources of guests, fluctuating operating costs and other factors. From a consumer perspective, we must provide new and innovative itinerary choices to attract new cruisers while retaining our past guests. Fortunately, our operations are flexible. We can rearrange itineraries to match guest demand. With sufficient advance notice, we can change the homeport, cruise length or ports-of-call we visit for any of our ships. Carnival has developed a very extensive network of North American homeports, with departure points along the Eastern Seaboard, Gulf of Mexico and the West Coast. We select ports of embarkation that are located near large population centers. Currently, more than half of the U.S. population is located within a day’s drive of one of our embarkation ports. This eliminates the need for air transportation for many travelers, making our cruises a more convenient, affordable and energy-efficient alternative to other land-based vacations. Similarly, our European and Australian brands offer embarkation from a broad range of ports in readily
accessible locations in Northern Europe, the UK, the Mediterranean, Australia, New Zealand, Brazil and China. Using a wide range of homeports and visiting many ports of call are critical components in allowing us to provide an outstanding vacation experience to over nine million guests a year. Selecting New Ports Carnival ships visit more than 500 ports-of-call all over the world, but we are always looking for new places to take our guests. Every year many potential ports around the globe request to be added to our itineraries.
We consider a number of factors in port selection, including “What will entice our guests to visit a destination?” When a potential port is being considered, our evaluation and decision-making processes take into account criteria such as: Port and docking factors: Harbor safety, port safety and security Quality of facilities supporting ship operations Port fees Location qualities: Cleanliness of the port and local community Number/quality of nearby restaurants/hotels Types and proximity of attractions with
environmental, historical and/or cultural significance
Availability of tour operators Availability of transportation to attractions Cost of attractions
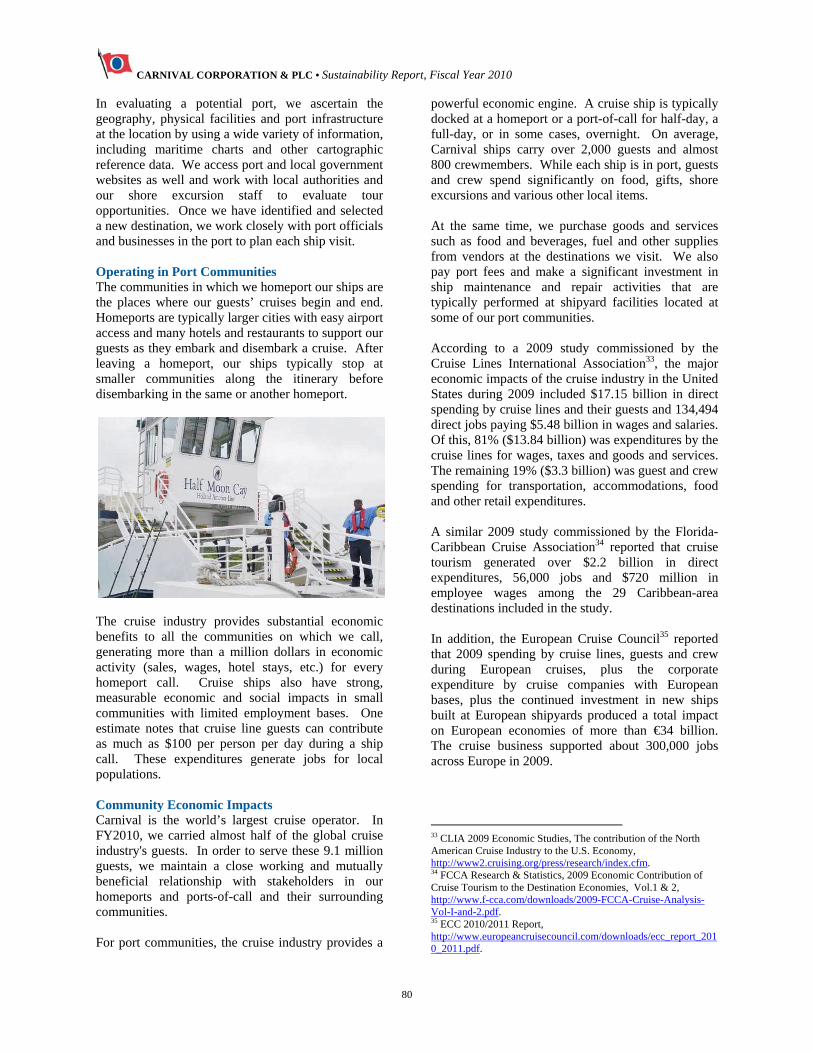
CARNIVAL CORPORATION & PLC • Sustainability Report, Fiscal Year 2010
80
In evaluating a potential port, we ascertain the geography, physical facilities and port infrastructure at the location by using a wide variety of information, including maritime charts and other cartographic reference data. We access port and local government websites as well and work with local authorities and our shore excursion staff to evaluate tour opportunities. Once we have identified and selected a new destination, we work closely with port officials and businesses in the port to plan each ship visit. Operating in Port Communities The communities in which we homeport our ships are the places where our guests’ cruises begin and end. Homeports are typically larger cities with easy airport access and many hotels and restaurants to support our guests as they embark and disembark a cruise. After leaving a homeport, our ships typically stop at smaller communities along the itinerary before disembarking in the same or another homeport.
The cruise industry provides substantial economic benefits to all the communities on which we call, generating more than a million dollars in economic activity (sales, wages, hotel stays, etc.) for every homeport call. Cruise ships also have strong, measurable economic and social impacts in small communities with limited employment bases. One estimate notes that cruise line guests can contribute as much as $100 per person per day during a ship call. These expenditures generate jobs for local populations. Community Economic Impacts Carnival is the world’s largest cruise operator. In FY2010, we carried almost half of the global cruise industry's guests. In order to serve these 9.1 million guests, we maintain a close working and mutually beneficial relationship with stakeholders in our homeports and ports-of-call and their surrounding communities. For port communities, the cruise industry provides a
powerful economic engine. A cruise ship is typically docked at a homeport or a port-of-call for half-day, a full-day, or in some cases, overnight. On average, Carnival ships carry over 2,000 guests and almost 800 crewmembers. While each ship is in port, guests and crew spend significantly on food, gifts, shore excursions and various other local items. At the same time, we purchase goods and services such as food and beverages, fuel and other supplies from vendors at the destinations we visit. We also pay port fees and make a significant investment in ship maintenance and repair activities that are typically performed at shipyard facilities located at some of our port communities. According to a 2009 study commissioned by the Cruise Lines International Association33, the major economic impacts of the cruise industry in the United States during 2009 included $17.15 billion in direct spending by cruise lines and their guests and 134,494 direct jobs paying $5.48 billion in wages and salaries. Of this, 81% ($13.84 billion) was expenditures by the cruise lines for wages, taxes and goods and services. The remaining 19% ($3.3 billion) was guest and crew spending for transportation, accommodations, food and other retail expenditures. A similar 2009 study commissioned by the Florida-Caribbean Cruise Association34 reported that cruise tourism generated over $2.2 billion in direct expenditures, 56,000 jobs and $720 million in employee wages among the 29 Caribbean-area destinations included in the study. In addition, the European Cruise Council35 reported that 2009 spending by cruise lines, guests and crew during European cruises, plus the corporate expenditure by cruise companies with European bases, plus the continued investment in new ships built at European shipyards produced a total impact on European economies of more than €34 billion. The cruise business supported about 300,000 jobs across Europe in 2009.
33 CLIA 2009 Economic Studies, The contribution of the North American Cruise Industry to the U.S. Economy, http://www2.cruising.org/press/research/index.cfm. 34 FCCA Research & Statistics, 2009 Economic Contribution of Cruise Tourism to the Destination Economies, Vol.1 & 2, http://www.f-cca.com/downloads/2009-FCCA-Cruise-Analysis-Vol-I-and-2.pdf. 35 ECC 2010/2011 Report, http://www.europeancruisecouncil.com/downloads/ecc_report_2010_2011.pdf.
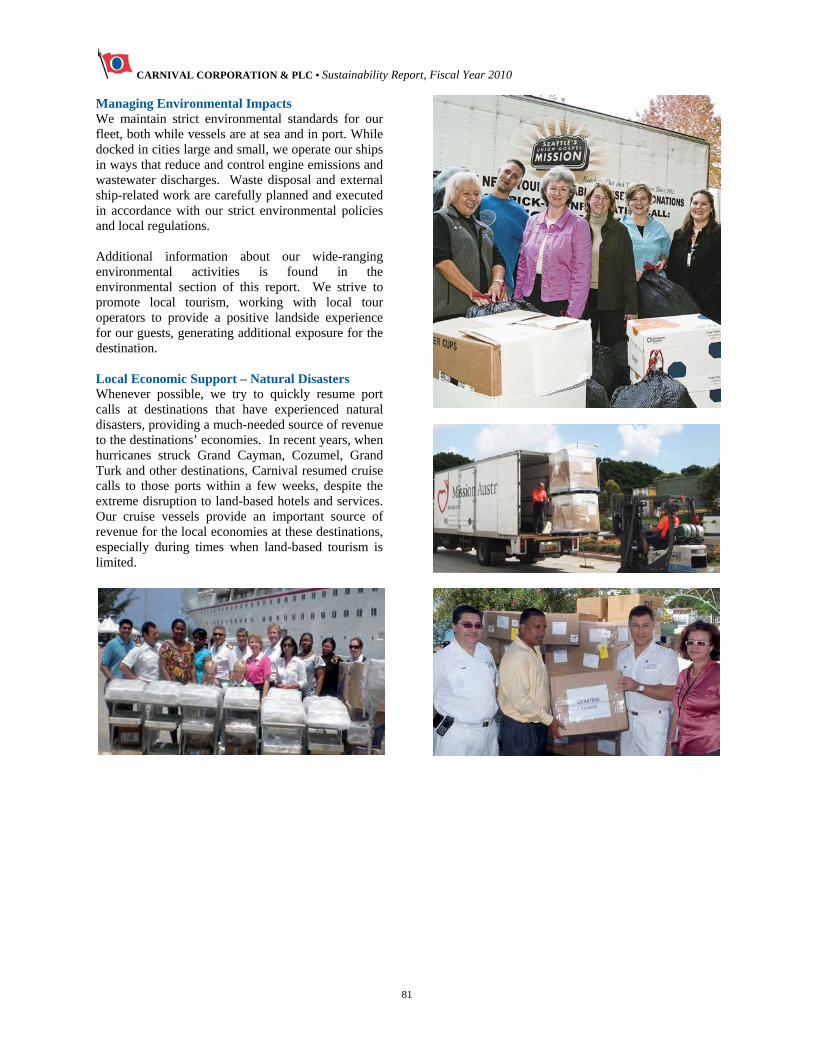
CARNIVAL CORPORATION & PLC • Sustainability Report, Fiscal Year 2010
81
Managing Environmental Impacts We maintain strict environmental standards for our fleet, both while vessels are at sea and in port. While docked in cities large and small, we operate our ships in ways that reduce and control engine emissions and wastewater discharges. Waste disposal and external ship-related work are carefully planned and executed in accordance with our strict environmental policies and local regulations. Additional information about our wide-ranging environmental activities is found in the environmental section of this report. We strive to promote local tourism, working with local tour operators to provide a positive landside experience for our guests, generating additional exposure for the destination. Local Economic Support – Natural Disasters Whenever possible, we try to quickly resume port calls at destinations that have experienced natural disasters, providing a much-needed source of revenue to the destinations’ economies. In recent years, when hurricanes struck Grand Cayman, Cozumel, Grand Turk and other destinations, Carnival resumed cruise calls to those ports within a few weeks, despite the extreme disruption to land-based hotels and services. Our cruise vessels provide an important source of revenue for the local economies at these destinations, especially during times when land-based tourism is limited.
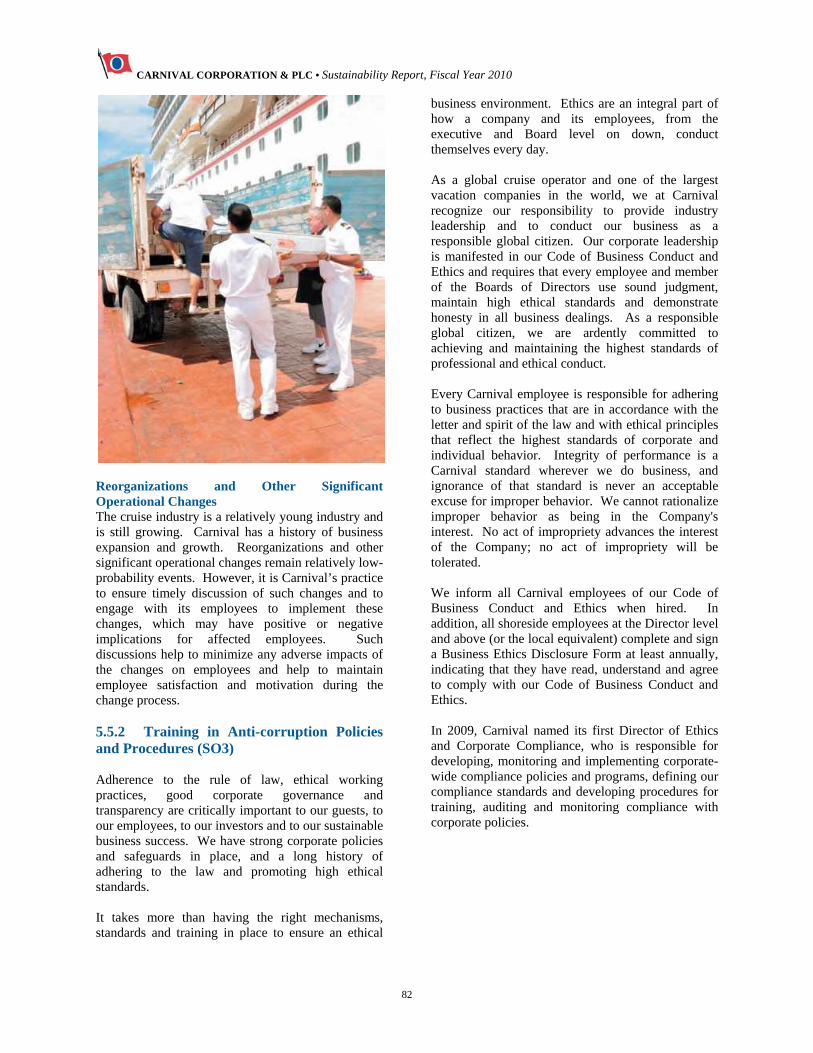
CARNIVAL CORPORATION & PLC • Sustainability Report, Fiscal Year 2010
82
Reorganizations and Other Significant Operational Changes The cruise industry is a relatively young industry and is still growing. Carnival has a history of business expansion and growth. Reorganizations and other significant operational changes remain relatively low-probability events. However, it is Carnival’s practice to ensure timely discussion of such changes and to engage with its employees to implement these changes, which may have positive or negative implications for affected employees. Such discussions help to minimize any adverse impacts of the changes on employees and help to maintain employee satisfaction and motivation during the change process. 5.5.2 Training in Anti-corruption Policies and Procedures (SO3) Adherence to the rule of law, ethical working practices, good corporate governance and transparency are critically important to our guests, to our employees, to our investors and to our sustainable business success. We have strong corporate policies and safeguards in place, and a long history of adhering to the law and promoting high ethical standards. It takes more than having the right mechanisms, standards and training in place to ensure an ethical
business environment. Ethics are an integral part of how a company and its employees, from the executive and Board level on down, conduct themselves every day. As a global cruise operator and one of the largest vacation companies in the world, we at Carnival recognize our responsibility to provide industry leadership and to conduct our business as a responsible global citizen. Our corporate leadership is manifested in our Code of Business Conduct and Ethics and requires that every employee and member of the Boards of Directors use sound judgment, maintain high ethical standards and demonstrate honesty in all business dealings. As a responsible global citizen, we are ardently committed to achieving and maintaining the highest standards of professional and ethical conduct. Every Carnival employee is responsible for adhering to business practices that are in accordance with the letter and spirit of the law and with ethical principles that reflect the highest standards of corporate and individual behavior. Integrity of performance is a Carnival standard wherever we do business, and ignorance of that standard is never an acceptable excuse for improper behavior. We cannot rationalize improper behavior as being in the Company's interest. No act of impropriety advances the interest of the Company; no act of impropriety will be tolerated. We inform all Carnival employees of our Code of Business Conduct and Ethics when hired. In addition, all shoreside employees at the Director level and above (or the local equivalent) complete and sign a Business Ethics Disclosure Form at least annually, indicating that they have read, understand and agree to comply with our Code of Business Conduct and Ethics. In 2009, Carnival named its first Director of Ethics and Corporate Compliance, who is responsible for developing, monitoring and implementing corporate-wide compliance policies and programs, defining our compliance standards and developing procedures for training, auditing and monitoring compliance with corporate policies.
CARNIVAL CORPORATION & PLC • Sustainability Report, Fiscal Year 2010
83
To reinforce the Company’s commitment to ethical business behavior, Carnival will introduce mandatory ethics training during 2011. Training courses offered will cover the Company’s policies and expectations in three key risk areas: the Code of Business Conduct and Ethics, antitrust and anti-corruption. These courses will be assigned to appropriate employees based on their exposure to relevant risks, and completion rates will be tracked and reported to the Boards of Directors. 5.5.3 Public Policy Positions (SO5) Carnival establishes its public policy positions and participates in public policy development and lobbying on behalf of Carnival’s subsidiary Operating Lines through the organizations listed below. Details of Carnival’s public policy positions on significant issues beyond those disclosed in this Sustainability Report are addressed on the websites of these organizations. Cruise Lines International Association Florida Caribbean Cruise Association European Cruise Council International Chamber of Shipping/International
Shipping Federation European Community Shipowners’ Associations The Chamber of Shipping (UK) Ship Emission Abatement and Trading (SEAaT) Global Environmental Management Initiative
(GEMI) Cruise Lines International Association (CLIA, http://www.cruising.org) Carnival is a member of and actively participates in CLIA, the world’s largest cruise association, which is dedicated to the promotion and growth of the cruise industry. CLIA includes 23 of the major cruise lines serving North America and serves as a non-governmental consultative organization to the International Maritime Organization. CLIA was formed in 1975 and in 2006 merged with the International Council of Cruise Lines (ICCL), a sister entity created in 1990 dedicated to participating in the regulatory and policy development process of the cruise industry. CLIA exists to promote all measures that foster a safe, secure and healthy cruise ship environment, educate, train its travel agent members, and promote and explain the value, desirability and affordability of the cruise vacation experience.
Florida Caribbean Cruise Association (FCCA, http://www.f-cca.com) Carnival is a member of and actively participates in the FCCA, a not-for-profit trade organization composed of 14 member cruise lines operating more than 100 vessels in the waters of Florida, the Caribbean and Latin American. Created in 1972, the FCCA’s mandate is to provide a forum for discussion on legislation, tourism development, ports, tour operations, safety, security and other cruise industry issues. By fostering an understanding of the cruise industry and its operating practices, the FCCA seeks to build cooperative relationships with its partner destinations and to develop productive bilateral partnerships with every sector. The FCCA works with governments, ports and all private/public sector representatives to maximize spending by cruise guests, cruise lines and cruise line employees, and to enhance the destination experience and the number of cruise guests returning as stay-over visitors. European Cruise Council (ECC, http://www.europeancruisecouncil.com) Carnival is a member of and actively participates in the ECC, which represents the leading cruise companies operating in Europe, and aims to promote the interests of cruise operators with the EU Institutions (European Parliament, Council of the European Union, and European Commission) in all matters of shipping policy and ship operations. The ECC also promotes cruising by the European public and encourages expansion of the European cruise market. To accomplish this, the ECC: Encourages high standards of operation and the
provision of high quality and efficient shipping services
Strives for an EU regulatory environment that supports safe shipping operations and protection of the environment, and that recognizes the international dimension of the sector and the role played by IMO/ILO in particular
Works for an regulatory environment to foster the continued growth of the cruise sector
Raises the profile of the cruise sector with the EU Institutions in relation to its economic and social contribution to Europe
Promotes cruising with the general public and the travel trade as a reliable, affordable and enjoyable holiday experience
Cooperates with the EU Institutions and non-governmental organizations in the pursuit of these objectives
Anticipates whenever possible and responds wherever appropriate to policies and actions which conflict with the above
CARNIVAL CORPORATION & PLC • Sustainability Report, Fiscal Year 2010
84
International Chamber of Shipping (ICS) and the International Shipping Federation (ISF) (http://www.marisec.org) Carnival actively participates in the International Chamber of Shipping (ICS) and the International Shipping Federation (ISF). ICS is the principal international trade association for the shipping industry, representing all sectors and trades, and is concerned with all technical, legal and policy issues that may have an impact on international shipping. ISF is the principal international employers’ organization for the shipping industry, representing all sectors and trades, and is concerned with all labor affairs, manpower and training, and seafarers’ health and welfare issues that may have an impact on international shipping. ICS and ISF enjoy close relationships with national maritime authorities throughout the world and with relevant departments and agencies of the European Union. European Community Shipowners’ Associations (ECSA, http://www.ecsa.be) Carnival participates in ECSA, formed in 1965, which is comprised of the national shipowners’ associations of the EU and Norway. ECSA works through a permanent secretariat in Brussels and a Board of Directors, as well as a number of specialized committees. Its aim is to promote the interests of European shipping so that the industry can best serve European and international trade and commerce in a competitive free enterprise environment to the benefit of shippers and consumers. Most ECSA members are also members of ICS. The Chamber of Shipping (UK) (http://www.british-shipping.org) Carnival is an active member in The Chamber of Shipping, the trade association for the UK shipping industry, which works to promote and protect the interests of its members both nationally and internationally. With 144 members and associate members, the Chamber represents over 860 ships of about 23 million gross tonnes and is recognized as the voice of the UK shipping industry. The Chamber works with government, Parliament, international organizations, unions and the general public on behalf of the sectors that make up the shipping industry (including deep-sea bulk, short-sea bulk, containers, ferry, cruise, offshore support and specialized operators) to ensure that the UK
continues to be a global center for shipping business with world-class standards and an internationally competitive and consistent fiscal and policy environment. Ship Emission Abatement and Trading (SEAaT, http://www.seaat.org) Carnival is a sponsoring member of SEAaT, a unique, proactive and self-funding cross-industry group, whose mission is to encourage and facilitate efficient reduction of harmful emissions to air from shipping. Formed in 2002, SEAaT raises awareness and promotes acceptance of solutions for emissions reductions that are sustainable, cost effective and achievable. Founding sponsors include shipping and oil companies committed to exploring and implementing cost effective methods of reducing emissions. SEAaT membership represents the broader shipping community and includes ship owners, brokers, technology companies and fuel suppliers. Global Environmental Management Initiative (GEMI, www.gemi.org) Carnival is an active member of GEMI, an organization of leading companies dedicated to fostering global environmental, health and safety (EHS) and sustainability excellence through the sharing of tools and information to help business achieve environmental sustainability excellence. GEMI currently has 25 member companies representing more than 12 business sectors. Through the collaborative efforts of its members, GEMI promotes a worldwide business ethic for EHS management and sustainable development through example and leadership. GEMI is unique in that it provides a way for companies in a wide range of industrial sectors to work together in a cost effective manner. Members address strategic and tactical issues impacting progressive corporate environmental, health and safety activities in their companies around the world. 5.5.4 Noncompliance with Laws and Regulations (SO8) As indicated in our Corporate Health, Environmental, Safety and Security Policy, Carnival and its Operating Lines are committed to fully complying with or exceeding all legal and statutory requirements related to health, environment, safety and security throughout all of our business activities. To implement this policy, we promptly report and properly investigate all health, environmental, safety
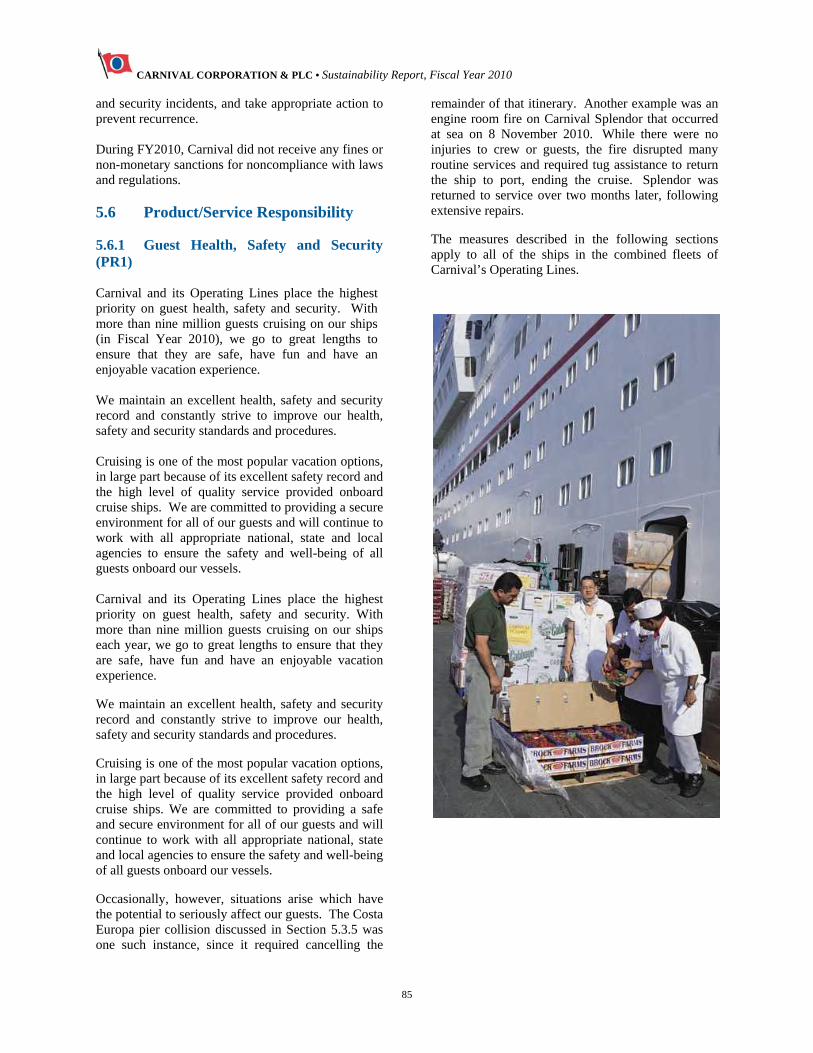
CARNIVAL CORPORATION & PLC • Sustainability Report, Fiscal Year 2010
85
and security incidents, and take appropriate action to prevent recurrence. During FY2010, Carnival did not receive any fines or non-monetary sanctions for noncompliance with laws and regulations. 5.6 Product/Service Responsibility 5.6.1 Guest Health, Safety and Security (PR1) Carnival and its Operating Lines place the highest priority on guest health, safety and security. With more than nine million guests cruising on our ships (in Fiscal Year 2010), we go to great lengths to ensure that they are safe, have fun and have an enjoyable vacation experience. We maintain an excellent health, safety and security record and constantly strive to improve our health, safety and security standards and procedures. Cruising is one of the most popular vacation options, in large part because of its excellent safety record and the high level of quality service provided onboard cruise ships. We are committed to providing a secure environment for all of our guests and will continue to work with all appropriate national, state and local agencies to ensure the safety and well-being of all guests onboard our vessels. Carnival and its Operating Lines place the highest priority on guest health, safety and security. With more than nine million guests cruising on our ships each year, we go to great lengths to ensure that they are safe, have fun and have an enjoyable vacation experience.
We maintain an excellent health, safety and security record and constantly strive to improve our health, safety and security standards and procedures.
Cruising is one of the most popular vacation options, in large part because of its excellent safety record and the high level of quality service provided onboard cruise ships. We are committed to providing a safe and secure environment for all of our guests and will continue to work with all appropriate national, state and local agencies to ensure the safety and well-being of all guests onboard our vessels.
Occasionally, however, situations arise which have the potential to seriously affect our guests. The Costa Europa pier collision discussed in Section 5.3.5 was one such instance, since it required cancelling the
remainder of that itinerary. Another example was an engine room fire on Carnival Splendor that occurred at sea on 8 November 2010. While there were no injuries to crew or guests, the fire disrupted many routine services and required tug assistance to return the ship to port, ending the cruise. Splendor was returned to service over two months later, following extensive repairs.
The measures described in the following sections apply to all of the ships in the combined fleets of Carnival’s Operating Lines.
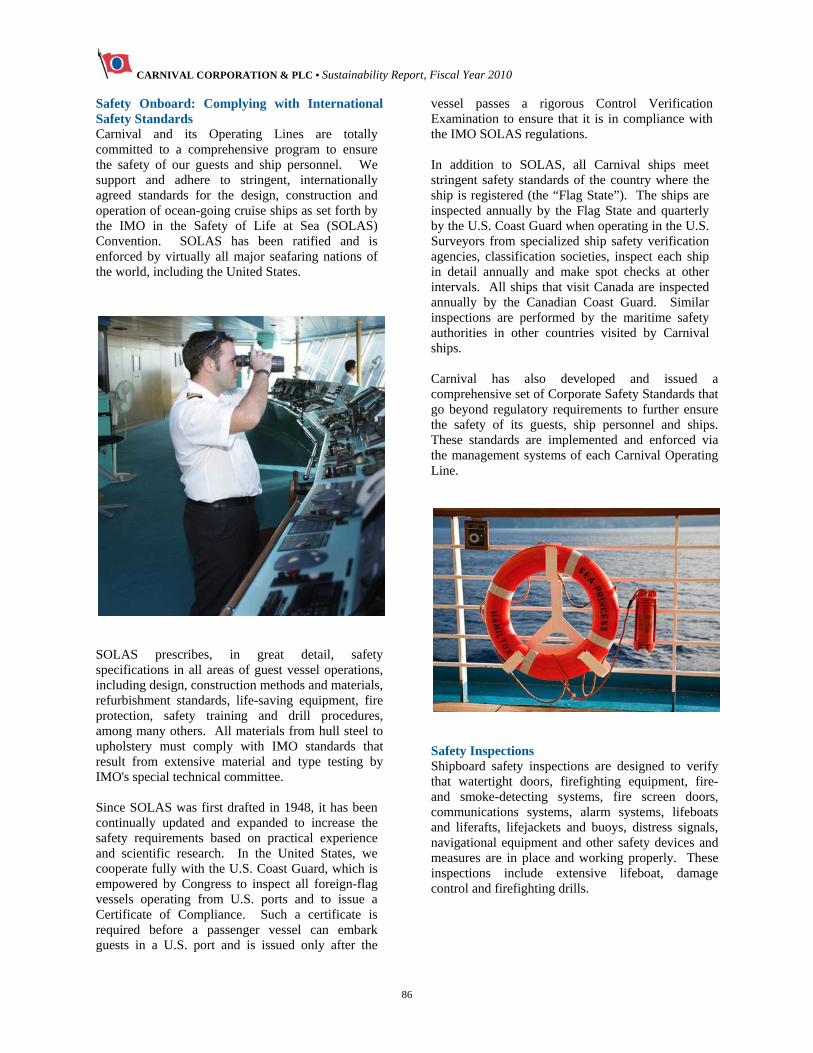
CARNIVAL CORPORATION & PLC • Sustainability Report, Fiscal Year 2010
86
Safety Onboard: Complying with International Safety Standards Carnival and its Operating Lines are totally committed to a comprehensive program to ensure the safety of our guests and ship personnel. We support and adhere to stringent, internationally agreed standards for the design, construction and operation of ocean-going cruise ships as set forth by the IMO in the Safety of Life at Sea (SOLAS) Convention. SOLAS has been ratified and is enforced by virtually all major seafaring nations of the world, including the United States.
SOLAS prescribes, in great detail, safety specifications in all areas of guest vessel operations, including design, construction methods and materials, refurbishment standards, life-saving equipment, fire protection, safety training and drill procedures, among many others. All materials from hull steel to upholstery must comply with IMO standards that result from extensive material and type testing by IMO's special technical committee. Since SOLAS was first drafted in 1948, it has been continually updated and expanded to increase the safety requirements based on practical experience and scientific research. In the United States, we cooperate fully with the U.S. Coast Guard, which is empowered by Congress to inspect all foreign-flag vessels operating from U.S. ports and to issue a Certificate of Compliance. Such a certificate is required before a passenger vessel can embark guests in a U.S. port and is issued only after the
vessel passes a rigorous Control Verification Examination to ensure that it is in compliance with the IMO SOLAS regulations. In addition to SOLAS, all Carnival ships meet stringent safety standards of the country where the ship is registered (the “Flag State”). The ships are inspected annually by the Flag State and quarterly by the U.S. Coast Guard when operating in the U.S. Surveyors from specialized ship safety verification agencies, classification societies, inspect each ship in detail annually and make spot checks at other intervals. All ships that visit Canada are inspected annually by the Canadian Coast Guard. Similar inspections are performed by the maritime safety authorities in other countries visited by Carnival ships. Carnival has also developed and issued a comprehensive set of Corporate Safety Standards that go beyond regulatory requirements to further ensure the safety of its guests, ship personnel and ships. These standards are implemented and enforced via the management systems of each Carnival Operating Line.
Safety Inspections Shipboard safety inspections are designed to verify that watertight doors, firefighting equipment, fire- and smoke-detecting systems, fire screen doors, communications systems, alarm systems, lifeboats and liferafts, lifejackets and buoys, distress signals, navigational equipment and other safety devices and measures are in place and working properly. These inspections include extensive lifeboat, damage control and firefighting drills.
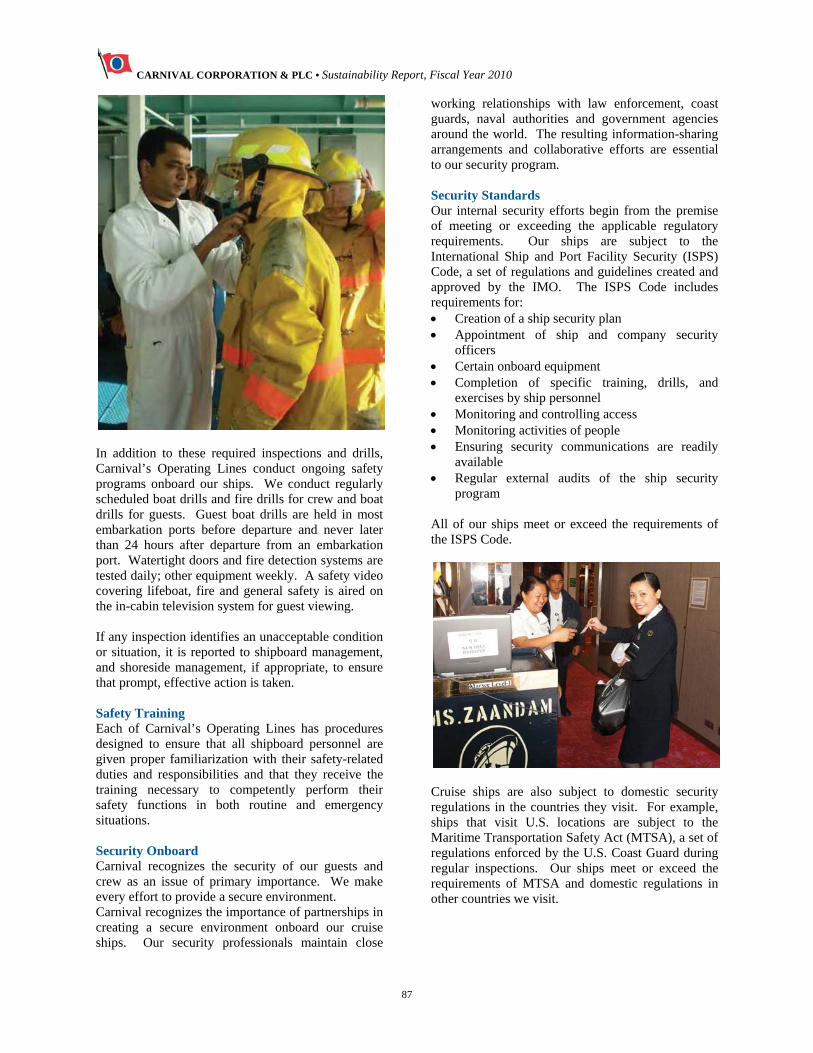
CARNIVAL CORPORATION & PLC • Sustainability Report, Fiscal Year 2010
87
In addition to these required inspections and drills, Carnival’s Operating Lines conduct ongoing safety programs onboard our ships. We conduct regularly scheduled boat drills and fire drills for crew and boat drills for guests. Guest boat drills are held in most embarkation ports before departure and never later than 24 hours after departure from an embarkation port. Watertight doors and fire detection systems are tested daily; other equipment weekly. A safety video covering lifeboat, fire and general safety is aired on the in-cabin television system for guest viewing. If any inspection identifies an unacceptable condition or situation, it is reported to shipboard management, and shoreside management, if appropriate, to ensure that prompt, effective action is taken. Safety Training Each of Carnival’s Operating Lines has procedures designed to ensure that all shipboard personnel are given proper familiarization with their safety-related duties and responsibilities and that they receive the training necessary to competently perform their safety functions in both routine and emergency situations. Security Onboard Carnival recognizes the security of our guests and crew as an issue of primary importance. We make every effort to provide a secure environment. Carnival recognizes the importance of partnerships in creating a secure environment onboard our cruise ships. Our security professionals maintain close
working relationships with law enforcement, coast guards, naval authorities and government agencies around the world. The resulting information-sharing arrangements and collaborative efforts are essential to our security program. Security Standards Our internal security efforts begin from the premise of meeting or exceeding the applicable regulatory requirements. Our ships are subject to the International Ship and Port Facility Security (ISPS) Code, a set of regulations and guidelines created and approved by the IMO. The ISPS Code includes requirements for: Creation of a ship security plan Appointment of ship and company security
officers Certain onboard equipment Completion of specific training, drills, and
exercises by ship personnel Monitoring and controlling access Monitoring activities of people Ensuring security communications are readily
available Regular external audits of the ship security
program All of our ships meet or exceed the requirements of the ISPS Code.
Cruise ships are also subject to domestic security regulations in the countries they visit. For example, ships that visit U.S. locations are subject to the Maritime Transportation Safety Act (MTSA), a set of regulations enforced by the U.S. Coast Guard during regular inspections. Our ships meet or exceed the requirements of MTSA and domestic regulations in other countries we visit.
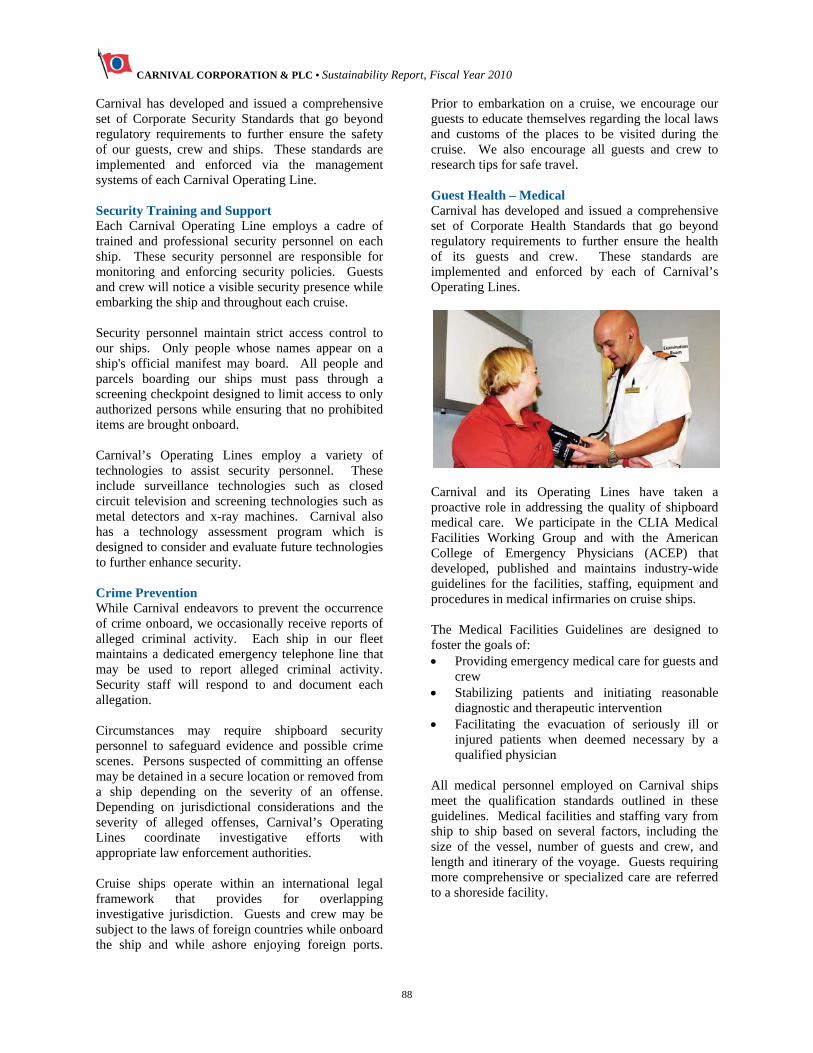
CARNIVAL CORPORATION & PLC • Sustainability Report, Fiscal Year 2010
88
Carnival has developed and issued a comprehensive set of Corporate Security Standards that go beyond regulatory requirements to further ensure the safety of our guests, crew and ships. These standards are implemented and enforced via the management systems of each Carnival Operating Line. Security Training and Support Each Carnival Operating Line employs a cadre of trained and professional security personnel on each ship. These security personnel are responsible for monitoring and enforcing security policies. Guests and crew will notice a visible security presence while embarking the ship and throughout each cruise. Security personnel maintain strict access control to our ships. Only people whose names appear on a ship's official manifest may board. All people and parcels boarding our ships must pass through a screening checkpoint designed to limit access to only authorized persons while ensuring that no prohibited items are brought onboard. Carnival’s Operating Lines employ a variety of technologies to assist security personnel. These include surveillance technologies such as closed circuit television and screening technologies such as metal detectors and x-ray machines. Carnival also has a technology assessment program which is designed to consider and evaluate future technologies to further enhance security. Crime Prevention While Carnival endeavors to prevent the occurrence of crime onboard, we occasionally receive reports of alleged criminal activity. Each ship in our fleet maintains a dedicated emergency telephone line that may be used to report alleged criminal activity. Security staff will respond to and document each allegation. Circumstances may require shipboard security personnel to safeguard evidence and possible crime scenes. Persons suspected of committing an offense may be detained in a secure location or removed from a ship depending on the severity of an offense. Depending on jurisdictional considerations and the severity of alleged offenses, Carnival’s Operating Lines coordinate investigative efforts with appropriate law enforcement authorities. Cruise ships operate within an international legal framework that provides for overlapping investigative jurisdiction. Guests and crew may be subject to the laws of foreign countries while onboard the ship and while ashore enjoying foreign ports.
Prior to embarkation on a cruise, we encourage our guests to educate themselves regarding the local laws and customs of the places to be visited during the cruise. We also encourage all guests and crew to research tips for safe travel. Guest Health – Medical Carnival has developed and issued a comprehensive set of Corporate Health Standards that go beyond regulatory requirements to further ensure the health of its guests and crew. These standards are implemented and enforced by each of Carnival’s Operating Lines.
Carnival and its Operating Lines have taken a proactive role in addressing the quality of shipboard medical care. We participate in the CLIA Medical Facilities Working Group and with the American College of Emergency Physicians (ACEP) that developed, published and maintains industry-wide guidelines for the facilities, staffing, equipment and procedures in medical infirmaries on cruise ships. The Medical Facilities Guidelines are designed to foster the goals of: Providing emergency medical care for guests and
crew Stabilizing patients and initiating reasonable
diagnostic and therapeutic intervention Facilitating the evacuation of seriously ill or
injured patients when deemed necessary by a qualified physician
All medical personnel employed on Carnival ships meet the qualification standards outlined in these guidelines. Medical facilities and staffing vary from ship to ship based on several factors, including the size of the vessel, number of guests and crew, and length and itinerary of the voyage. Guests requiring more comprehensive or specialized care are referred to a shoreside facility.
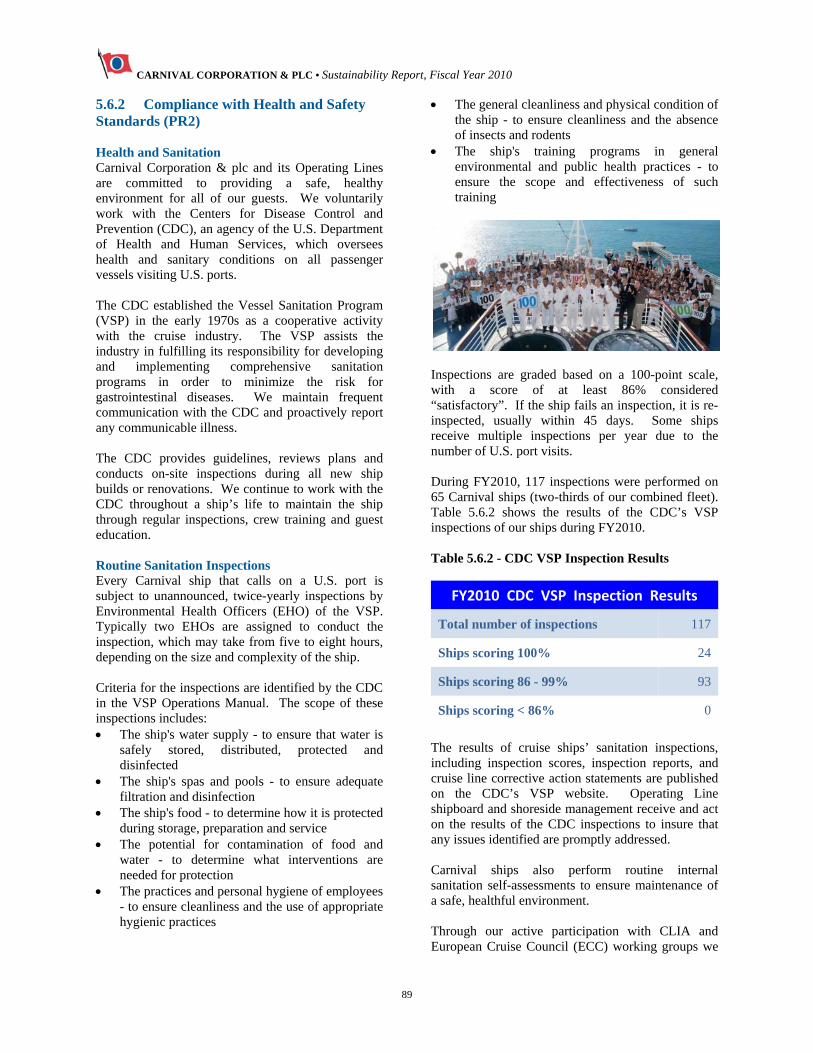
CARNIVAL CORPORATION & PLC • Sustainability Report, Fiscal Year 2010
89
5.6.2 Compliance with Health and Safety Standards (PR2) Health and Sanitation Carnival Corporation & plc and its Operating Lines are committed to providing a safe, healthy environment for all of our guests. We voluntarily work with the Centers for Disease Control and Prevention (CDC), an agency of the U.S. Department of Health and Human Services, which oversees health and sanitary conditions on all passenger vessels visiting U.S. ports. The CDC established the Vessel Sanitation Program (VSP) in the early 1970s as a cooperative activity with the cruise industry. The VSP assists the industry in fulfilling its responsibility for developing and implementing comprehensive sanitation programs in order to minimize the risk for gastrointestinal diseases. We maintain frequent communication with the CDC and proactively report any communicable illness. The CDC provides guidelines, reviews plans and conducts on-site inspections during all new ship builds or renovations. We continue to work with the CDC throughout a ship’s life to maintain the ship through regular inspections, crew training and guest education. Routine Sanitation Inspections Every Carnival ship that calls on a U.S. port is subject to unannounced, twice-yearly inspections by Environmental Health Officers (EHO) of the VSP. Typically two EHOs are assigned to conduct the inspection, which may take from five to eight hours, depending on the size and complexity of the ship. Criteria for the inspections are identified by the CDC in the VSP Operations Manual. The scope of these inspections includes: The ship's water supply - to ensure that water is
safely stored, distributed, protected and disinfected
The ship's spas and pools - to ensure adequate filtration and disinfection
The ship's food - to determine how it is protected during storage, preparation and service
The potential for contamination of food and water - to determine what interventions are needed for protection
The practices and personal hygiene of employees - to ensure cleanliness and the use of appropriate hygienic practices
The general cleanliness and physical condition of the ship - to ensure cleanliness and the absence of insects and rodents
The ship's training programs in general environmental and public health practices - to ensure the scope and effectiveness of such training
Inspections are graded based on a 100-point scale, with a score of at least 86% considered “satisfactory”. If the ship fails an inspection, it is re-inspected, usually within 45 days. Some ships receive multiple inspections per year due to the number of U.S. port visits. During FY2010, 117 inspections were performed on 65 Carnival ships (two-thirds of our combined fleet). Table 5.6.2 shows the results of the CDC’s VSP inspections of our ships during FY2010. Table 5.6.2 - CDC VSP Inspection Results
FY2010 CDC VSP Inspection Results
Total number of inspections 117
Ships scoring 100% 24
Ships scoring 86 - 99% 93
Ships scoring < 86% 0
The results of cruise ships’ sanitation inspections, including inspection scores, inspection reports, and cruise line corrective action statements are published on the CDC’s VSP website. Operating Line shipboard and shoreside management receive and act on the results of the CDC inspections to insure that any issues identified are promptly addressed. Carnival ships also perform routine internal sanitation self-assessments to ensure maintenance of a safe, healthful environment. Through our active participation with CLIA and European Cruise Council (ECC) working groups we
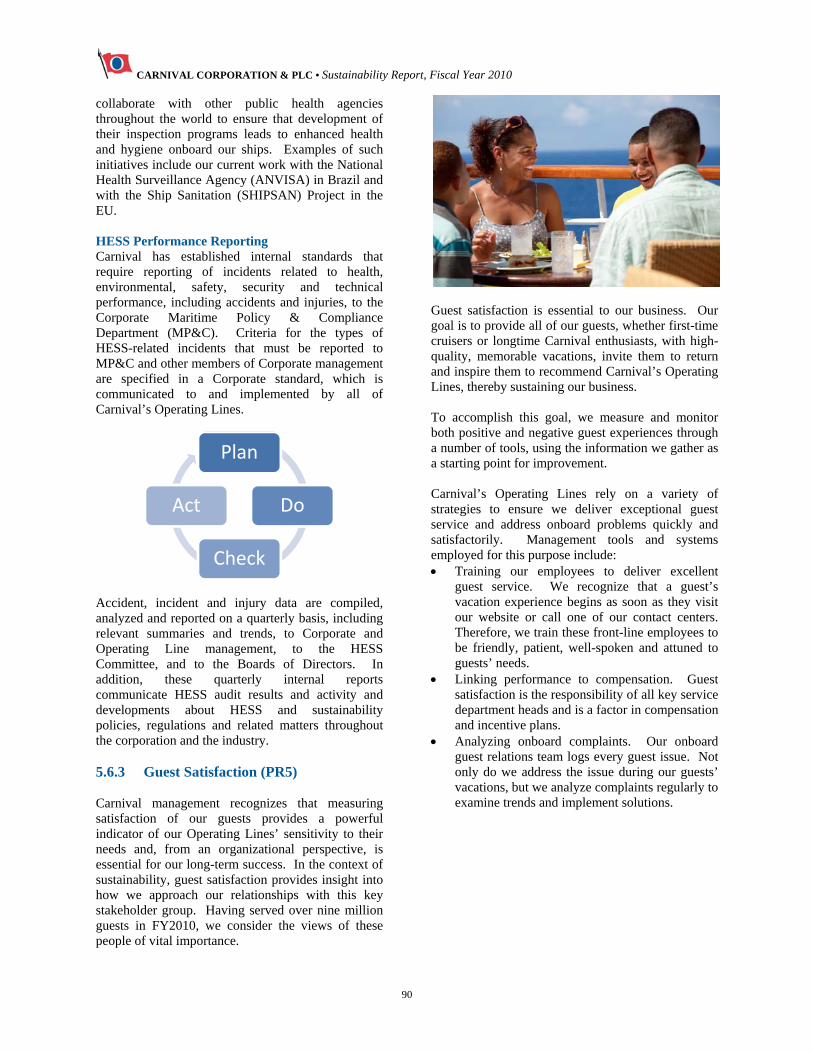
CARNIVAL CORPORATION & PLC • Sustainability Report, Fiscal Year 2010
90
collaborate with other public health agencies throughout the world to ensure that development of their inspection programs leads to enhanced health and hygiene onboard our ships. Examples of such initiatives include our current work with the National Health Surveillance Agency (ANVISA) in Brazil and with the Ship Sanitation (SHIPSAN) Project in the EU. HESS Performance Reporting Carnival has established internal standards that require reporting of incidents related to health, environmental, safety, security and technical performance, including accidents and injuries, to the Corporate Maritime Policy & Compliance Department (MP&C). Criteria for the types of HESS-related incidents that must be reported to MP&C and other members of Corporate management are specified in a Corporate standard, which is communicated to and implemented by all of Carnival’s Operating Lines.
Accident, incident and injury data are compiled, analyzed and reported on a quarterly basis, including relevant summaries and trends, to Corporate and Operating Line management, to the HESS Committee, and to the Boards of Directors. In addition, these quarterly internal reports communicate HESS audit results and activity and developments about HESS and sustainability policies, regulations and related matters throughout the corporation and the industry. 5.6.3 Guest Satisfaction (PR5) Carnival management recognizes that measuring satisfaction of our guests provides a powerful indicator of our Operating Lines’ sensitivity to their needs and, from an organizational perspective, is essential for our long-term success. In the context of sustainability, guest satisfaction provides insight into how we approach our relationships with this key stakeholder group. Having served over nine million guests in FY2010, we consider the views of these people of vital importance.
Guest satisfaction is essential to our business. Our goal is to provide all of our guests, whether first-time cruisers or longtime Carnival enthusiasts, with high-quality, memorable vacations, invite them to return and inspire them to recommend Carnival’s Operating Lines, thereby sustaining our business. To accomplish this goal, we measure and monitor both positive and negative guest experiences through a number of tools, using the information we gather as a starting point for improvement. Carnival’s Operating Lines rely on a variety of strategies to ensure we deliver exceptional guest service and address onboard problems quickly and satisfactorily. Management tools and systems employed for this purpose include: Training our employees to deliver excellent
guest service. We recognize that a guest’s vacation experience begins as soon as they visit our website or call one of our contact centers. Therefore, we train these front-line employees to be friendly, patient, well-spoken and attuned to guests’ needs.
Linking performance to compensation. Guest satisfaction is the responsibility of all key service department heads and is a factor in compensation and incentive plans.
Analyzing onboard complaints. Our onboard guest relations team logs every guest issue. Not only do we address the issue during our guests’ vacations, but we analyze complaints regularly to examine trends and implement solutions.
Plan
Do
Check
Act
CARNIVAL CORPORATION & PLC • Sustainability Report, Fiscal Year 2010
91
Guest Service Realizing that today’s consumers are very comfortable with online processes and the convenience they provide, Carnival’s Operating Lines have focused on adding more self-service options to their websites so our guests can have additional access to shopping or servicing their reservation. Whether booking a cabin, making a payment, reserving shore excursions, or changing their dining request, our guests can typically manage their booking any time, day or night, from their desktop.
In addition, once guests book a cruise, they will receive a series of e-mails, from their initial reservation until just before the cruise departs, helping to build excitement and prepare them for their upcoming vacation experience on one of Carnival’s cruise ships. However, we know there may be instances when guests need to talk to someone directly, so our experienced service professionals are available to assist with inquiries on pre- or post-cruise matters, as well as during the cruise. Providing excellent service and guest satisfaction is at the heart of our guest service strategy. Although many guests still prefer to call, many more are e-mailing or engaging in social forums to discuss issues that are important to them. Our goal is to engage with our guests through whatever medium they choose and provide them with a first-contact resolution along with a timely response.
Guest Feedback and Complaint Resolution While pre-cruise and post-cruise service is important, guests’ overall satisfaction with their onboard cruise experience is by far the most critical component of Carnival’s success. Each of Carnival’s Operating Lines continues to upgrade and enhance the vacation experiences they offer with new features as part of our effort to attract first-time cruisers and keep our product fresh for repeat guests. Although the vast majority of guests are satisfied with their Carnival vacation, there are occasional complaints. Each Carnival Operating Line has undertaken a number of initiatives to reduce onboard complaints and to provide guests with expedient resolutions to their issues. Guest feedback is a vital component of these efforts, and guests are encouraged to voice their opinions, positive or negative, of their experience cruising with Carnival. This input is collected and reviewed by the ship’s senior management, led by the Hotel Director, who evaluates each comment from guests to identify trends and anticipate problems before they arise. Feedback from our guests is also an important part of employees’ review process. Correspondence from guests related to particular employees is included in their personnel files. Carnival’s Operating Lines provide guests with a variety of different means to convey their opinions and their degree of satisfaction. A most commonly used tool is a guest comment/survey form handed out to guests at the end of the cruise, on which the guests may express their opinions about the various aspects of the service and assign a performance score to each aspect. Email surveys are also used. We take these guest comments and surveys very seriously. The results are summarized and sent to the ship’s senior staff and to our Operating Line headquarters for prompt review. Any score that falls below standards is carefully scrutinized by shipboard staff, who develop action plans, as necessary, to improve performance on the very next cruise. Average scores are regularly reported to Operating Line senior executives. Carnival’s Operating Lines actively engage in the collection of complaints and suggestions from their guests on how to continuously improve the services offered. Guests wishing to complain about unsatisfactory service while they are still onboard can do so by approaching the appropriate crewmember, by phoning the Front/Reception Desk, or by filling
CARNIVAL CORPORATION & PLC • Sustainability Report, Fiscal Year 2010
92
out a complaint form. Shipboard personnel will do everything in their power to solve any problem reported, as swiftly and effectively as possible, in keeping with the corporate policy of excellent guest service and satisfaction. Resolving issues in an expedient manner during the cruise, rather than having guests wait until they return home to make contact, enables guests to more fully enjoy their vacations. This approach also provides the Operating Line management with a valuable on-the-spot learning tool that enables us to improve our policies, procedures and cruise product. Guests who are not satisfied with the service received onboard can send their complaints to the Company, either directly by letter, e-mail or phone, or indirectly through their travel agencies. Guest feedback has been instrumental in implementing many new onboard facilities and features. Innovations based at least partially on guest feedback include: Large-scale poolside LED screens Flexible dining options Behind-the-scenes tours Karaoke bars Adults-only areas Dining upgrades such as wine packages and
unlimited soda cards Updated smoking policies Enhanced programming for children 2010 Performance The global recession affected the cruise industry, and Carnival was not immune to the decline in travel demand. We sought to maintain the quality of our brands while offering competitively priced cruises and promoting the value of our products. Our shorter duration cruises provided an advantage by attracting guests who could only afford brief getaways. Our guest counts increased almost 12% from FY2008 to FY2010.
5.6.4 Guest Privacy (PR8) Carnival Corporate Privacy Program Carnival has established standards and guidelines to be observed by each of Carnival's Operating Lines in their respective privacy programs. Based on these standards and guidelines, each Operating Line has developed its own privacy policy, describing the principles and practices that guide the way personal information is collected, used, shared, safeguarded, and disposed of during the normal course of business.
Each Operating Line has developed processes, policies and procedures to support the principles established in the privacy policy, while providing training to employees to create and maintain awareness of our privacy practices. Each Operating Line has also developed a privacy incident response plan designed to address incidents of unauthorized access, disclosure, or use of personal information, maintained by the Operating Line or its service providers. Carnival’s privacy standards require the performance of annual reviews of the adequacy of the privacy program that address key issues such as estimated losses incurred by Carnival or its guests due to breaches, training status of employees, attempted and actual unauthorized access to personal information, and management response.
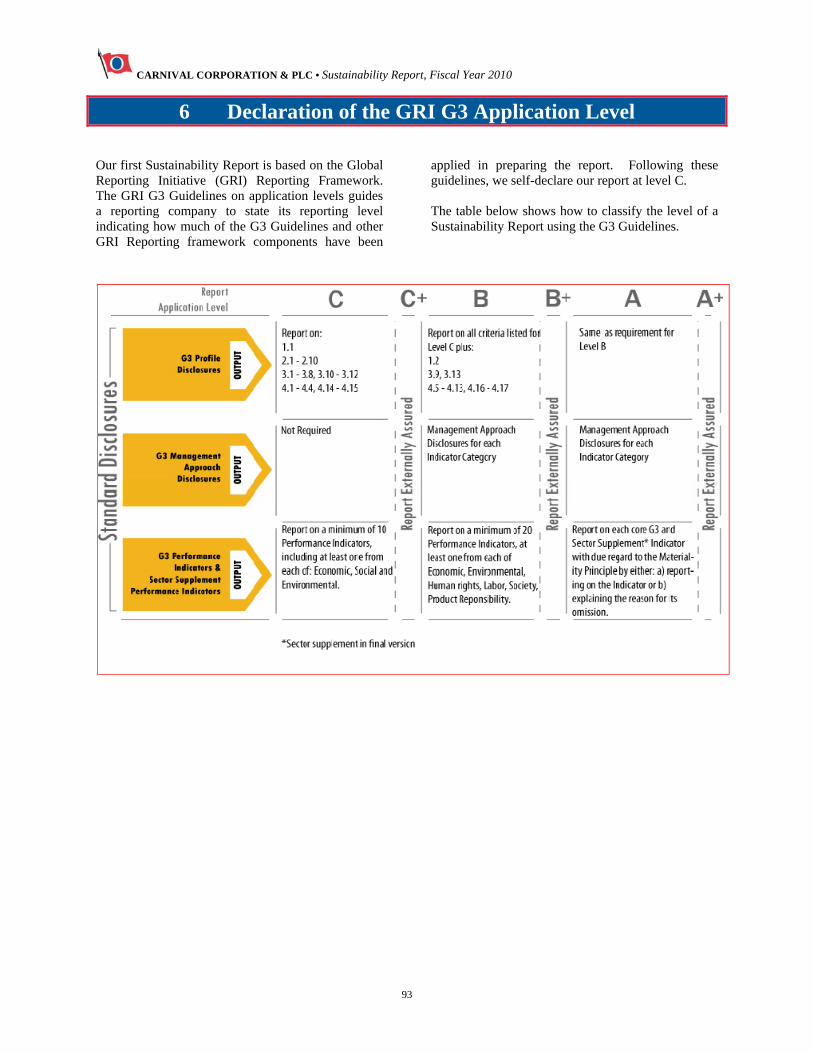
CARNIVAL CORPORATION & PLC • Sustainability Report, Fiscal Year 2010
93
6 Declaration of the GRI G3 Application Level
Our first Sustainability Report is based on the Global Reporting Initiative (GRI) Reporting Framework. The GRI G3 Guidelines on application levels guides a reporting company to state its reporting level indicating how much of the G3 Guidelines and other GRI Reporting framework components have been
applied in preparing the report. Following these guidelines, we self-declare our report at level C. The table below shows how to classify the level of a Sustainability Report using the G3 Guidelines.
CARNIVAL CORPORATION & PLC • Sustainability Report, Fiscal Year 2010
94
7 Glossary A Audit Systematic, documented, periodic and objective assessment of an organization’s performance, management systems and processes. Available Lower Berth (ALB) Guest beds available on a cruise ship, assuming two people occupy a cabin. Azipod An electric propulsion unit in which a variable speed electric motor drives a fixed pitch propeller in a submerged pod outside the ship’s hull. The pod may be configured to be rotated around its vertical axis, providing thrust in any direction. Ships with azipods do not need rudders, stern transverse thrusters or long propulsion shafts inside the ship’s hull. B Ballast Water Seawater that is taken onboard a ship and stored in tanks to control draft, list, trim, and stability. Bilge Water Water from equipment maintenance and minor leaks that collects in the lowest part of the ship. Black Water Wastewater from toilets, urinals and medical sinks. Bunkered Water Potable water that is purchased from a municipal or private system at a port and stored onboard in tanks. C CFC-11 Equivalent A measure used to compare various substances based on their relative ozone depletion potential. The reference level of 1 is the potential of CFC-11 and CFC-12 to cause ozone depletion. Chlorofluorocarbons (CFCs) Commonly known by the trade name “freon”, used primarily as a refrigerant in air conditioning and refrigeration systems and equipment. CFCs are known to have destructive effects on the ozone layer. For this reason their use has now been banned by legislation.
CO2 (Carbon Dioxide) A naturally occurring chemical compound composed of two oxygen atoms covalently bonded to a single carbon atom. It is a gas at standard temperature and pressure and exists in Earth’s atmosphere in this state, as a trace gas at a concentration of 0.39% by volume. CO2e (Carbon Dioxide Equivalent) A measure used to compare the emissions from various greenhouse gases based on their global warming potential (GWP). The CO2 equivalent for a gas is derived by multiplying the tonnes of the gas by the associated GWP. D Direct Emissions (Scope 1 Emissions) Emissions from sources that are owned or controlled by the reporting organization. For example, direct emissions related to combustion would arise from burning fuel for energy within the reporting organization’s boundaries. E Energy Saved The reduced amount of energy needed to carry out the same processes or tasks. The term does not include overall reduction in energy consumption from reduced organizational activities. Environmental Aspect Element of company activities that may have a significant impact on the environment directly and/or indirectly. Environmental Impact How an environmental aspect may affect the environment. Environmental Management System (EMS) An EMS refers to the management of an organization's environmental programs in a comprehensive, systematic, planned and documented manner. It includes the organizational structure, planning and resources for developing, implementing and maintaining policy for environmental protection.
CARNIVAL CORPORATION & PLC • Sustainability Report, Fiscal Year 2010
95
F Footprint The amount of environmental impact related to a specific resource. G Global Reporting Initiative (GRI) A network-based organization that produces a comprehensive sustainability reporting framework that is widely used around the world. GRI is committed to the framework’s continuous improvement and application worldwide. GRI’s core goals include the mainstreaming of disclosure on environmental, social and governance performance. Global Warming Potential (GWP) A relative measure of how much heat a greenhouse gas traps in the atmosphere. It compares the amount of heat trapped by a certain mass of the gas in question to the amount of heat trapped by a similar mass of carbon dioxide. A GWP is calculated over a specific time interval, commonly 20, 100 or 500 years. Governance The set of rules (laws and corporate regulations), organizational structures, processes and relationships that affect the way a company is directed and administered. The concept of governance also embraces the structure used to decide corporate objectives and the means to achieve and measure results. Gray Water Wastewater that is generated from activities such as laundry, bathing, cooking and dishwashing. Greenhouse Gas (GHG) A gas in the atmosphere that absorbs and emits radiation within the thermal infrared range. This process is the fundamental cause of the greenhouse effect, which many believe is the cause of global warming. The primary greenhouse gases in the Earth’s atmosphere are water vapor, carbon dioxide, methane, nitrous oxide, and ozone. Greenhouse gases greatly affect the temperature of the Earth; without them, Earth's surface would be on average about 33 degrees C (59 degrees F) colder than at present. The greenhouse gases thought to be major contributors to global warming are carbon dioxide (CO2); methane & biomethane emissions (CH4); nitrogen oxide (N2O) and chlorofluorocarbons (CFC).
Greenhouse Gas (GHG) Protocol Initiative The Greenhouse Gas Protocol Initiative’s vision is to harmonize greenhouse gas emission accounting and reporting standards internationally. It aims to provide a multi-stakeholder framework ensuring that different trading schemes and other climate related initiatives adopt consistent approaches to GHG accounting. H Heating, Ventilation and Air Conditioning (HVAC) System The technology used for indoor environmental climate control. Heavy Fuel Oil (HFO) A type of blended oil used in ship’s engines, made from the residues from various refinery distillation and cracking processes. I Indicator A means used to measure the effects of sustainability management initiatives or the condition of environmental, social or governance issues. Indirect Emissions (Scope 2 Emissions) Emissions that result from the activities of the reporting organization but are generated at sources owned or controlled by another organization. In the context of this indicator, indirect emissions refer to greenhouse gas emissions from the generation of electricity, heat or steam that is imported and consumed by the reporting organization. Indirect Energy Energy produced outside the reporting organization’s organizational boundary that is consumed to supply energy for the organization’s energy needs (e.g., electricity, or for heating and cooling). The most common example is fuel consumed outside the reporting organization’s boundary in order to generate electricity to be used inside the organization’s boundary.
CARNIVAL CORPORATION & PLC • Sustainability Report, Fiscal Year 2010
96
Injury Severity Levels Work-related crewmember and contractor injuries are classified as major, serious or minor, based on the following criteria: Major injury: Any fracture, loss of any body
part, loss of vision (temporary or permanent), dislocation of a joint or a ruptured ligament or tendon, hypothermia or hyperthermia secondary to environmental exposure which requires medical treatment, an injury resulting in trauma which requires advanced life support or any other injury requiring hospitalization onboard or ashore for more than 24 hours following the injury.
Serious injury: Any injury, other than a major injury, which results in time off work for more than three consecutive days following the injury or which results in disembarkation without return onboard.
Minor injury: Any injury that is not a serious or major injury and that results in time off work of 24 hours or more following the injury.
International Labour Organization (ILO) The United Nations’ agency that seeks the promotion of social justice and internationally recognized human and labor rights. International Maritime Organization (IMO) The United Nations’ agency responsible for improving maritime safety and preventing pollution from ships. International Organization for Standardization (ISO) An international standard-setting body composed of representatives from various national standards organizations. An ISO Standard is an international specification that establishes a common framework of reference or a common technical language between suppliers and customers, thus facilitating trade and the transfer of technology. International Safety Management (ISM) Code International code for the safe management and operation of ships and for pollution prevention. ISO 14001 Global standards for environmental management systems developed by the ISO. International Ship and Port Security (ISPS) Code A part of SOLAS that prescribes responsibilities of governments, shipping companies, shipboard personnel, and port/facility personnel to "detect
security threats and take preventative measures against security incidents affecting ships or port facilities used in international trade." M Marine Sanitation Devices (MSD) A system that employs filtration, maceration and chlorination technologies to treat black water. Maritime Labour Convention 2006 (MLC 2006) An international treaty that provides comprehensive rights and protection at work for the world’s seafarers. The convention sets out seafarers’ rights to decent conditions of work on a wide range of subjects and aims to be globally applicable, easily understandable, readily updatable and uniformly enforced. MARPOL The International Convention for the Prevention of Pollution from Ships. MARPOL is one of the most important marine environmental conventions, which was designed to minimize pollution of the seas. Metric Tonne 1 metric tonne = 2204.62 pounds (lbs) = 1000 kilograms. N NOx Oxides of nitrogen that are a family of gases released from the combustion of fuel. O Ozone Depleting Potential (ODP) The relative potential of various gases to deplete the ozone in the atmosphere. Ozone Depleting Substance (ODS) Any substance with an ozone depletion potential greater than zero that can deplete the stratospheric ozone layer. Most ozone-depleting substances are regulated under the Montreal Protocol and its amendments, and include CFCs, HCFCs, halons, and methyl bromide.
CARNIVAL CORPORATION & PLC • Sustainability Report, Fiscal Year 2010
97
P Primary Source The initial form of energy consumed to satisfy the reporting organization’s energy demand. This energy is used either to provide final energy services (e.g., space heating, transport) or to produce intermediate forms of energy, such as electricity and heat. Protected Area A geographically defined area that is designated, regulated, or managed to achieve specific conservation objectives. R Refrigerants Gases that are used in HVAC systems onboard. Renewable Energy Renewable energy is derived from natural processes that are replenished constantly. This includes electricity and heat generated from solar, wind, ocean currents, hydropower, biomass, geothermal resources or biofuels, as well as hydrogen derived from renewable resources. S Safety Management System (SMS) ISM code-certified system that informs employees how to perform their duties in accordance with all safety and environmental laws. Safety of Life at Sea (SOLAS) Convention The most important and comprehensive international treaty governing the safety of merchant ships.
Significant Air Emissions Air emissions that are regulated under international conventions and/or national laws or regulations, including those listed on environmental permits for the reporting organization’s operations. Solid Waste All used and discarded solid material produced onboard during ship operations. SOx Oxides of sulfur are a family of gases produced by the combustion of fuel which contains sulfur. The quantity of oxides of sulfur is proportional to the quantity of sulfur in the fuel. Stakeholder Any individual or group, within or outside a company, that has an interest in or may be impacted by that company, and that accordingly has expectations, requires information or holds legitimate economic interests. STCW The International Convention on Standards of Training, Certification and Watchkeeping for Seafarers, which sets qualification standards for masters, officers and watch personnel on seagoing merchant ships. T Total Water Withdrawal The sum of all water drawn into the boundaries of the reporting organization from all sources (including surface water, ground water, rainwater, and municipal water supply) for any use over the course of the reporting period. Turnover The ratio of the number of terminations to the average employee count during the reporting period.
CARNIVAL CORPORATION & PLC • Sustainability Report, Fiscal Year 2010
98
Please help us to protect the planet. Consider the environment before printing this report.
Our Global Brands
www.aida.com www.costacruises.comwww.carnival.com
www.cunard.com www.hollandamerica.com
www.iberocruceros.com www.pocruises.com www.pocruises.com.au
www.princess.com www.seabourn.com
Carnival Corporation & plcCarnival Place, 3655 NW 87th Avenue
Miami, Florida 33178-2428
Carnival Corporation & plc5 Gainsford Street,
London SE1 2NE, United Kingdom