supplementary slides
DESCRIPTION
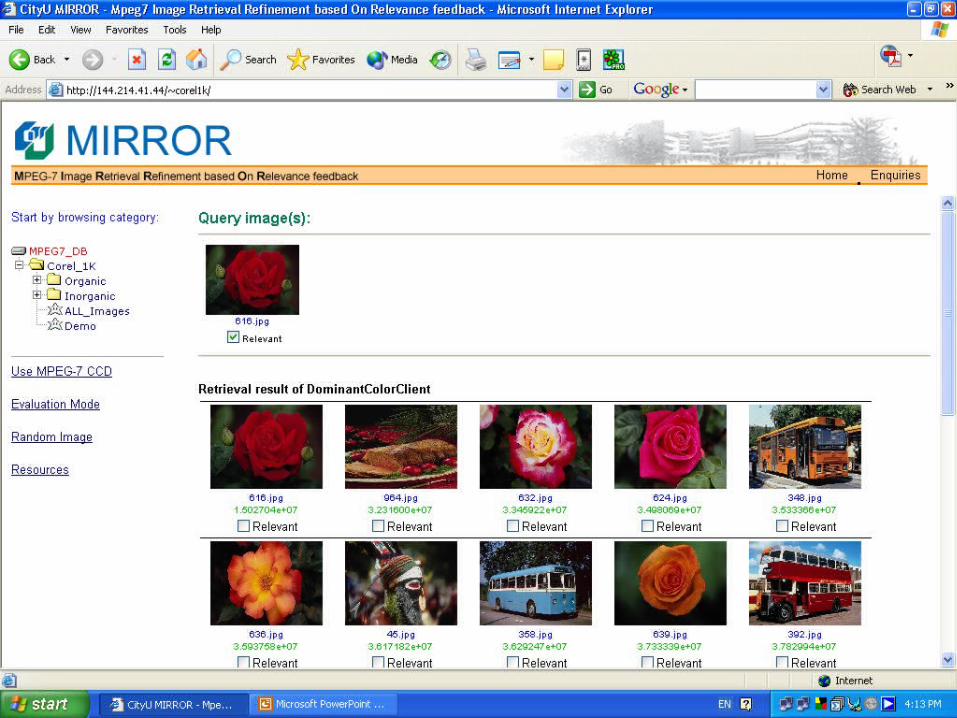
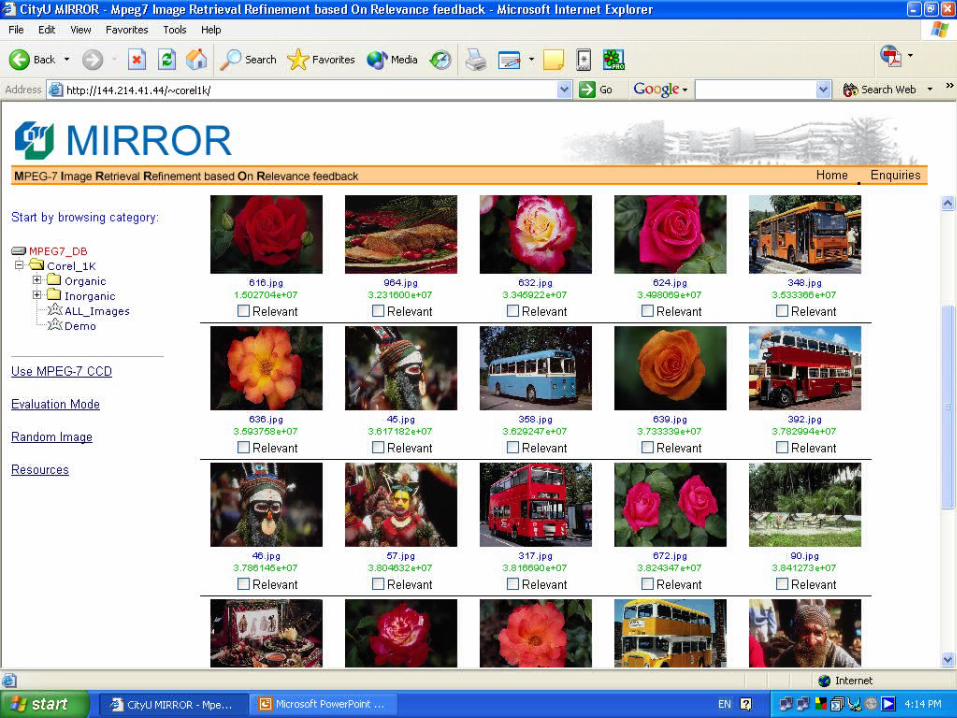
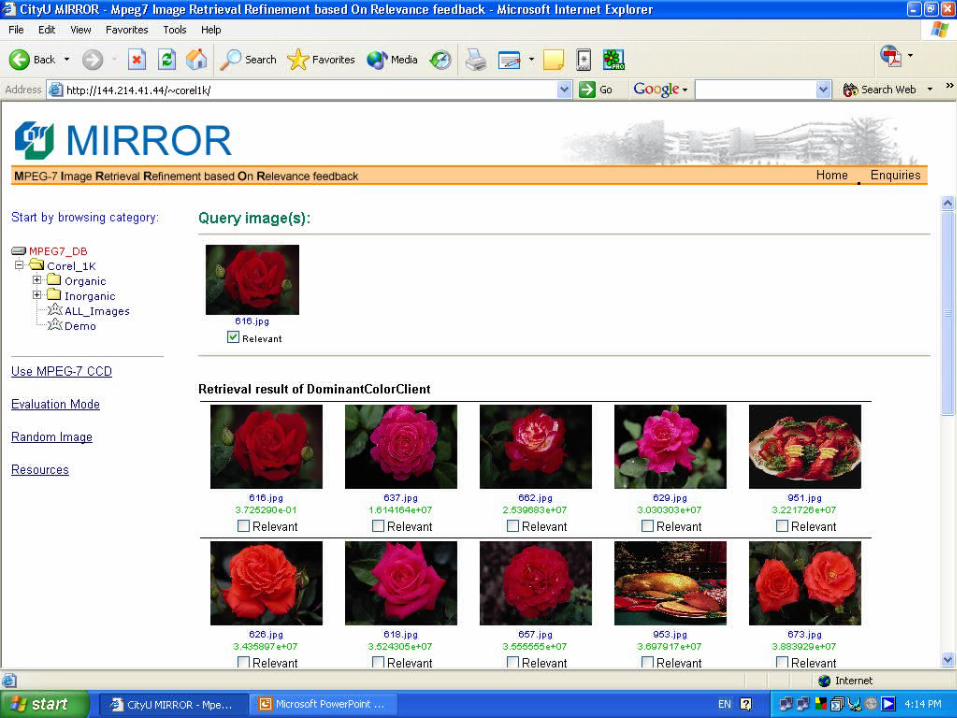
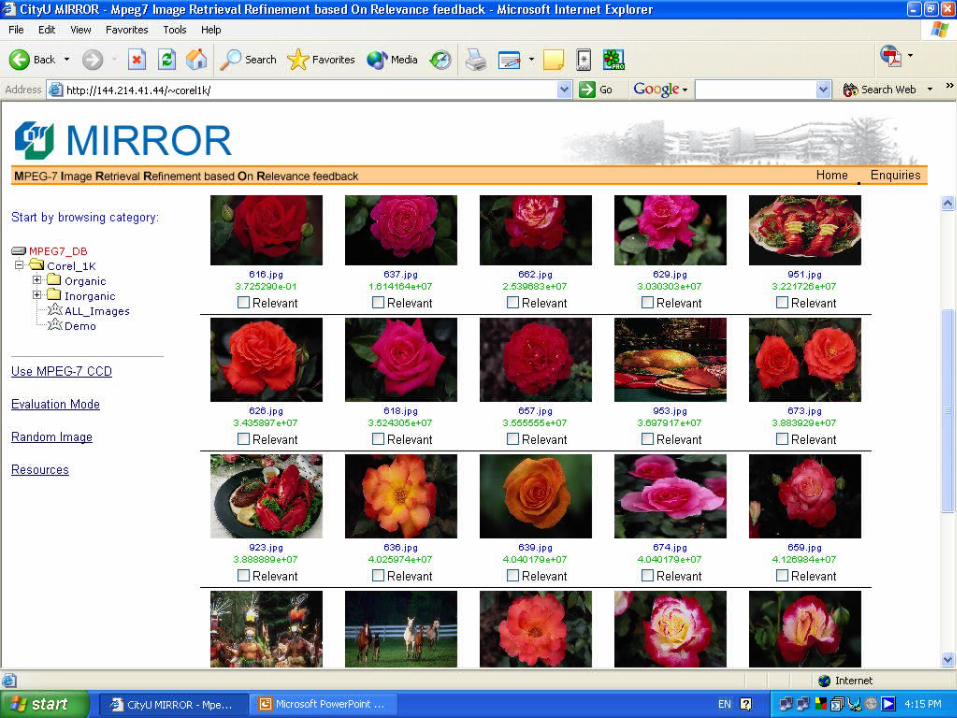
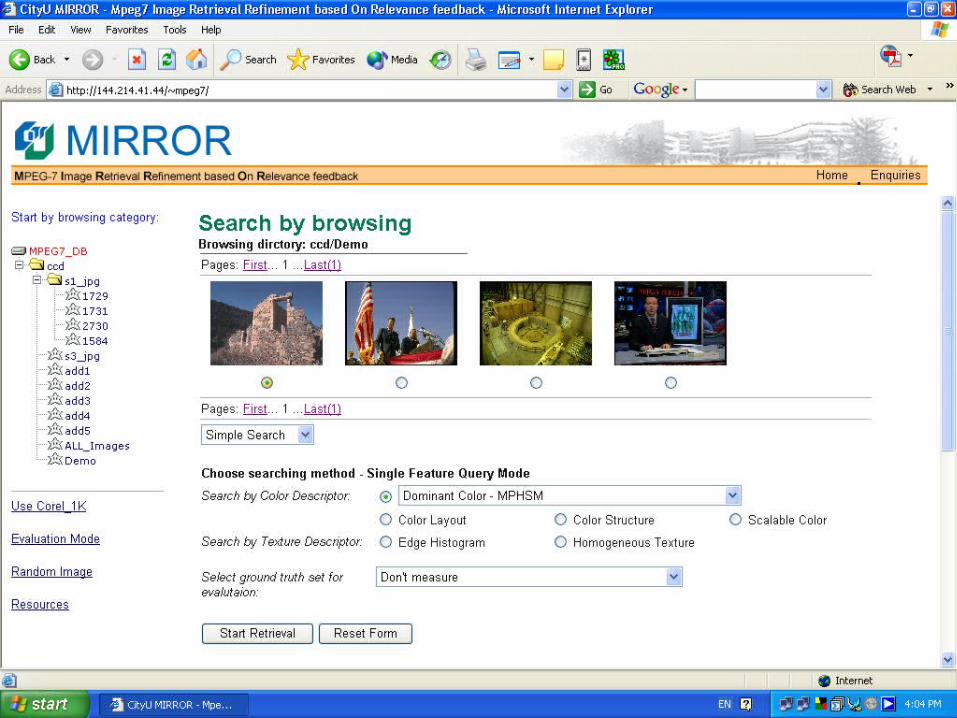
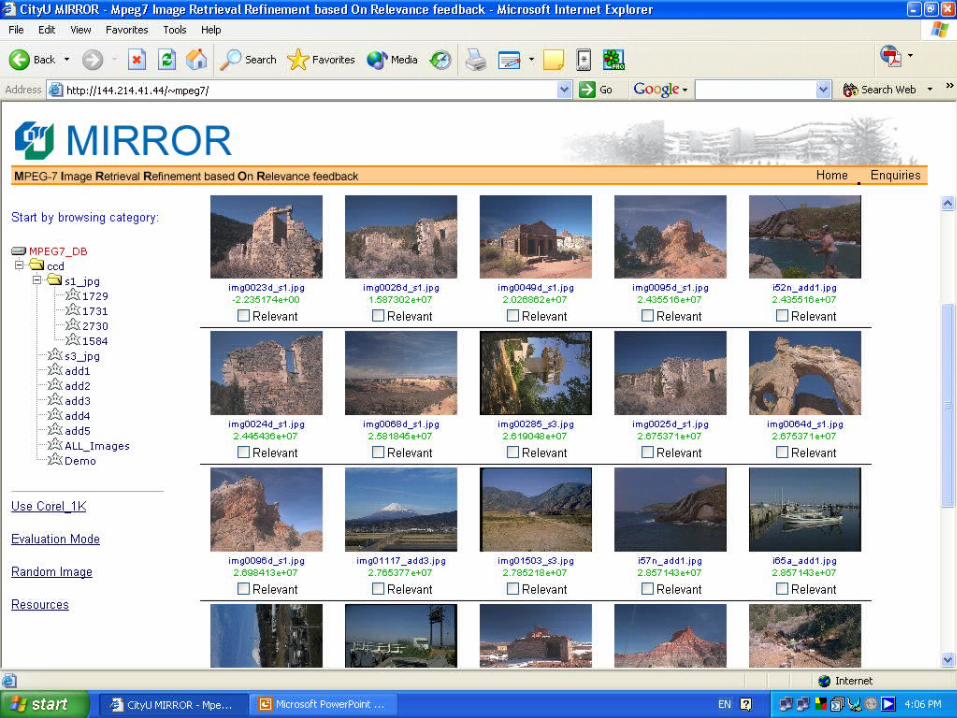
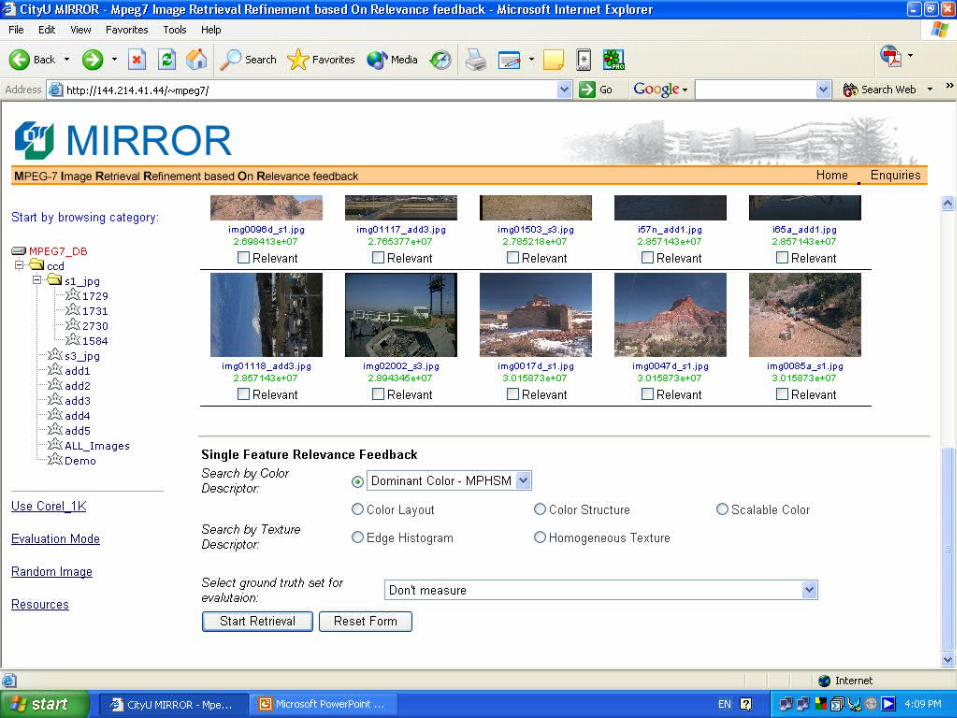
Supplementary Slides. More experiment al results. MPHSM already push out many irrelevant images. Query image. QHDM result, 4 of 36 ground truth found ANMRR= 0.6464. MPHSM result, 9 of 36 ground truth found ANMRR= 0.4819. More about experimental results. - PowerPoint PPT PresentationTRANSCRIPT
Supplementary Slides

More experimental results MPHSM already push out many irrelevant
images
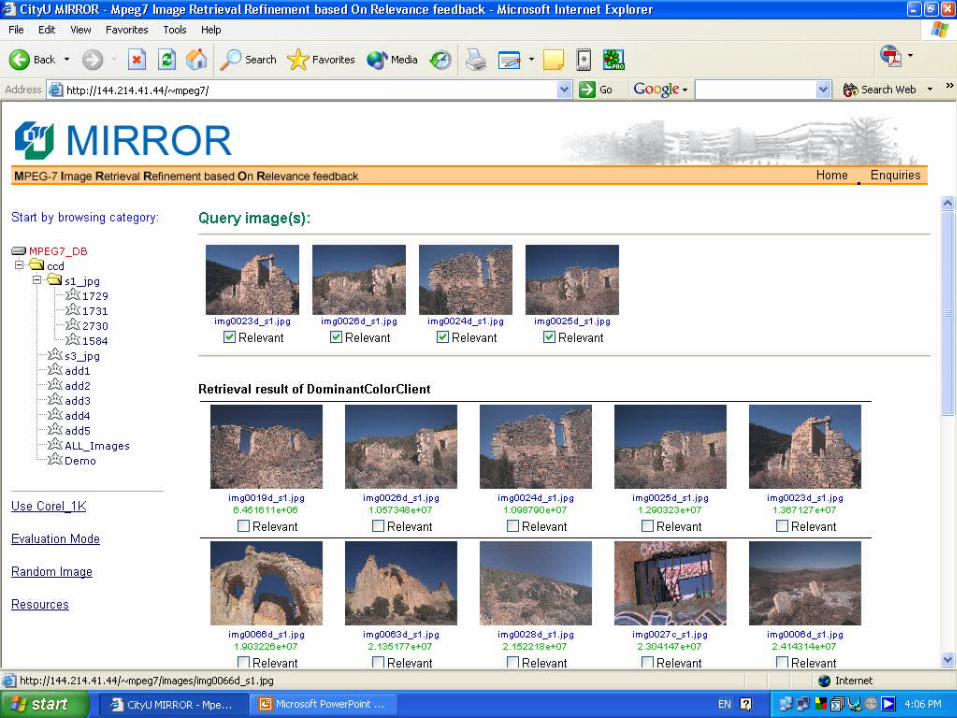
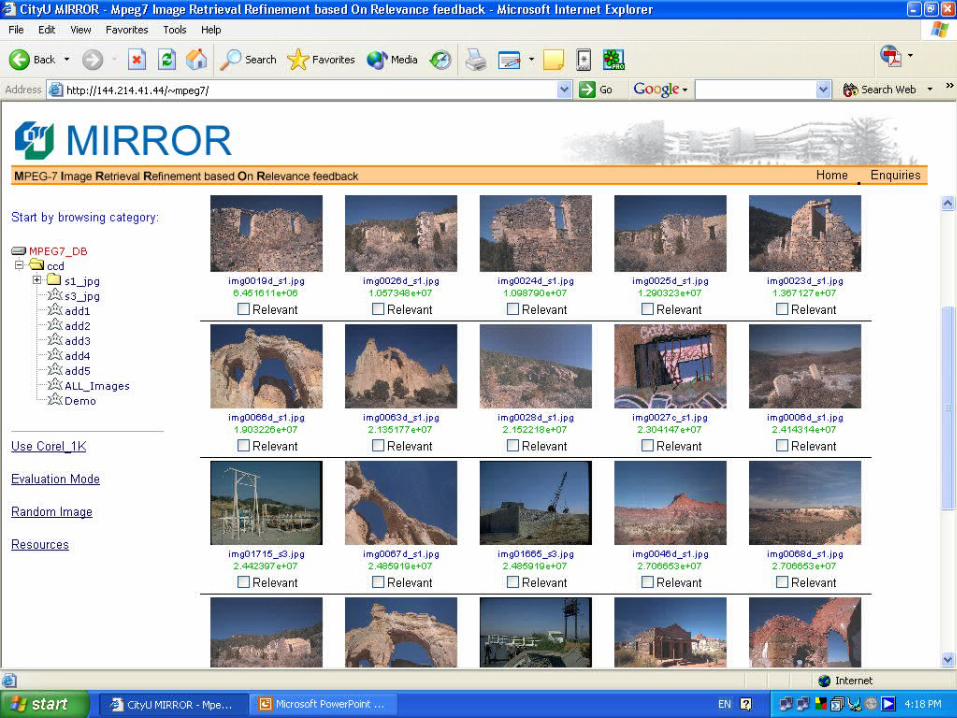
Query image
QHDM result, 4 of 36 ground truth found ANMRR=0.6464
MPHSM result, 9 of 36 ground truth foundANMRR=0.4819

More about experimental results Still some irrelevant image found
No spatial information Cannot identify background colors Does not account for unmatched colors Initial query might not be accurate
BlackBackground
GreenBackground

More about experimental results Can be improved by
Relevance Feedback Makes relevant images to have higher ranks
Irrelevant normally can’t have higher similarity by RF
But relevant images does Give more information about the interested objects Inconsistent backgrounds can be averaged out

More on experimental results Irrelevant images got lower rank / out of top
20 after RF
Query image
Ground truth images
Initial retrieval, 7 of 11 ground truths hit, NMRR=0.3043
First RF retrieval, 9 of 11 ground truths hit, NMRR=0.1688
Second RF retrieval, 9 of 11 ground truths hit, NMRR=0.1688
B D
E F G
A
E
B D
A
B D
CA
E
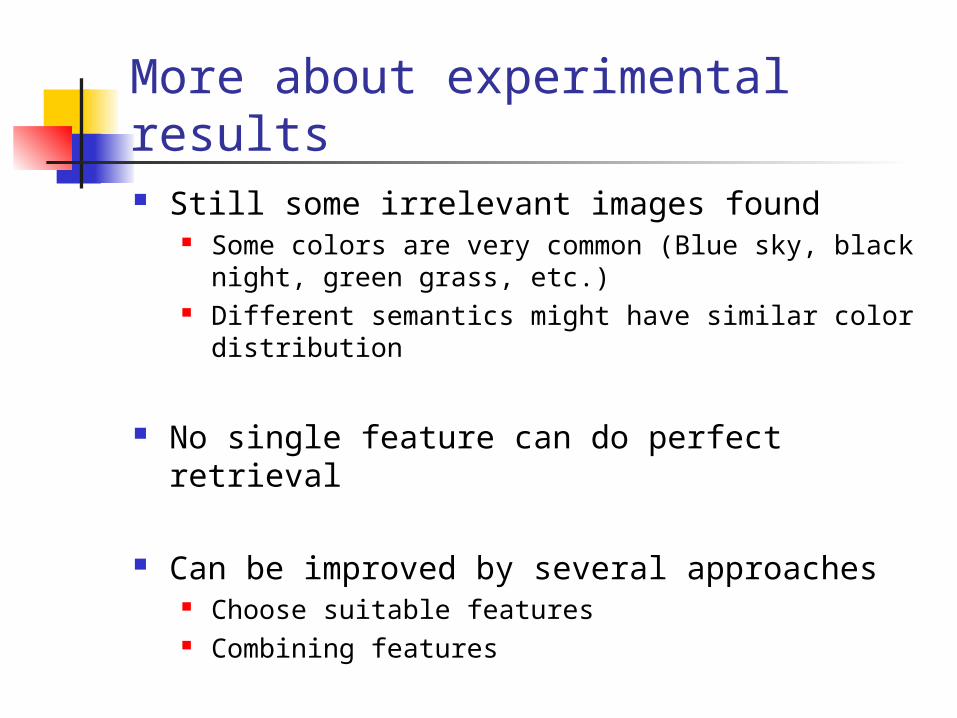
More about experimental results Still some irrelevant images found
Some colors are very common (Blue sky, black night, green grass, etc.)
Different semantics might have similar color distribution
No single feature can do perfect retrieval
Can be improved by several approaches Choose suitable features Combining features

Suggestions on further developments For DCD
Use unmatched colors Challenge 1: Did the unmatched colors representing object
of interest? Or just a obstacle? Challenge 2: How to define the similarity function?
Separate foreground/background Challenge 1: Can we identify it by only using DCD? Or in
RF? Challenge 2: Or we need to combine other shape/texture
descriptors? The DCD generation is not very accurate
GLA generates an optimal for quantizing the image, it might not be accurate dominant colors.
Can quantize up to 16 or more colors, and then approximate the least significant colors to obtain an 8 color DCD
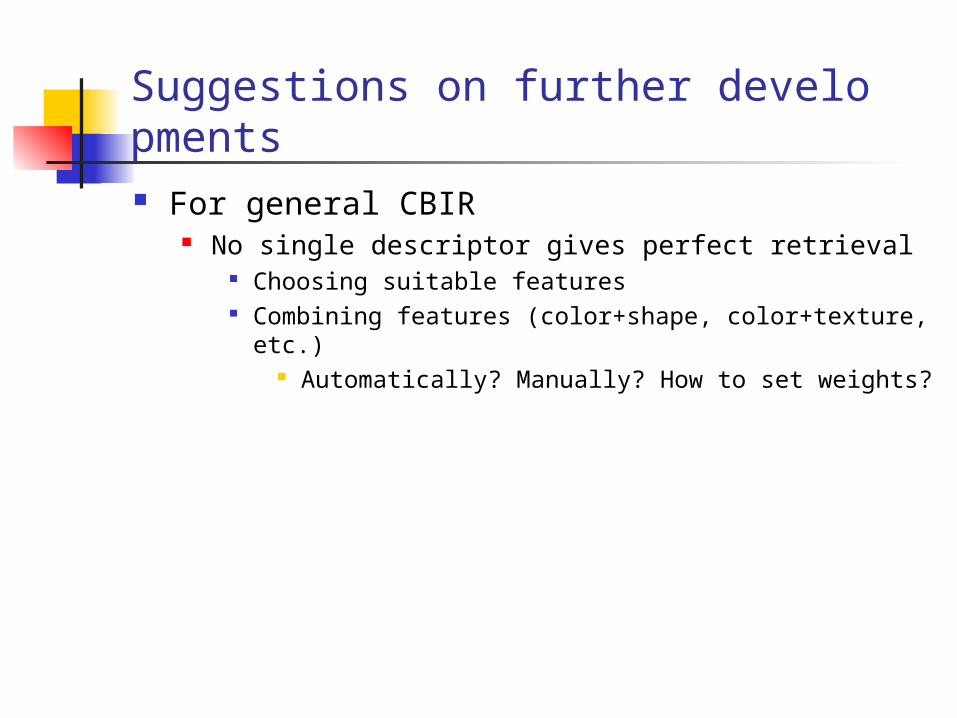
Suggestions on further developments For general CBIR
No single descriptor gives perfect retrieval Choosing suitable features Combining features (color+shape, color+texture, etc.)
Automatically? Manually? How to set weights?

Visual description about a CBIR System flow of a CBIR system
Online Process
Offline Process
Image DB Stored Features
Feature extractionUser initial input Results outputSimilarity measure
Similarity= 50%
Similarity= 100%
= 50%
= 30%...…
Feature extraction
…
… …

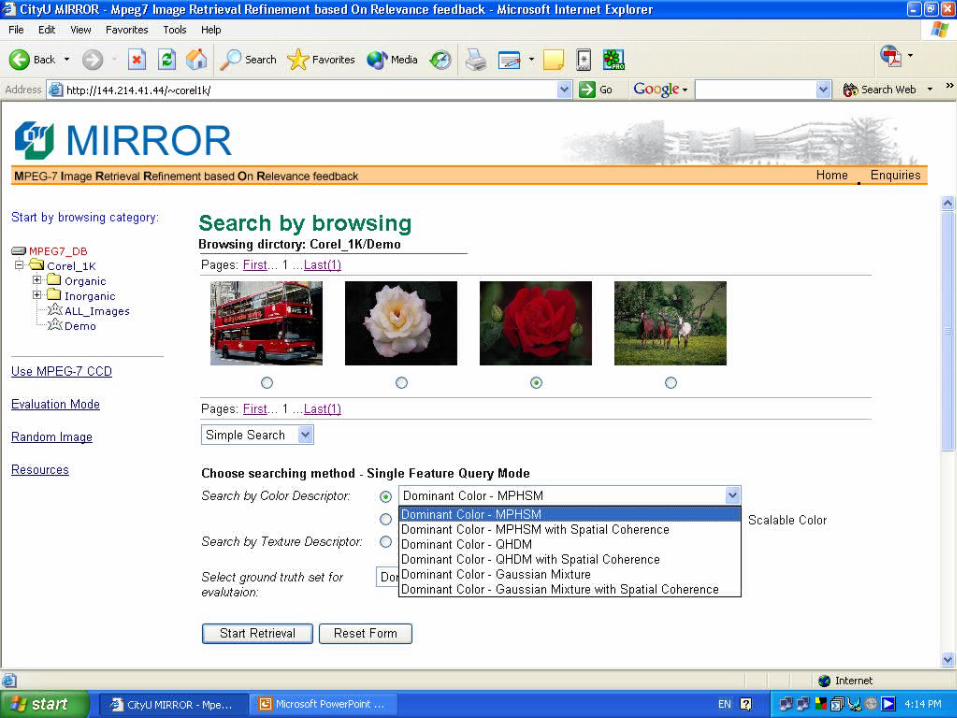
Color based CBIR approaches Three major approach of CBIR based on colors
Area of matching – Count the area with matched colors (CSD, SCD, DCD)
Color distance – Use color distance to adjust the similarity (DCD-QHDM)
Spatial distribution – Matches colors having similar layout (CLD)

Optional parameters Spatial coherence
obtained by a simple connected component analysis. A smooth surface gives a higher spatial coherence value.
Color variances computed as variances of the pixel values within each
cluster. But this parameter is for a dedicated similarity measure algorithm. So it is not commonly used.
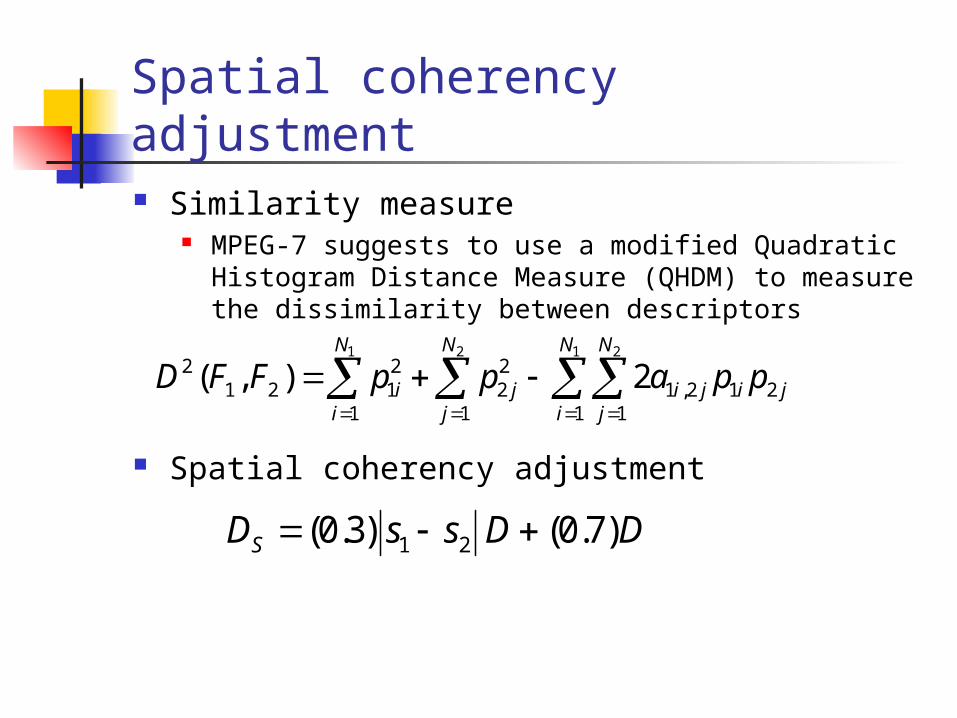
Spatial coherency adjustment Similarity measure
MPEG-7 suggests to use a modified Quadratic Histogram Distance Measure (QHDM) to measure the dissimilarity between descriptors
Spatial coherency adjustment
1 2 1 22 2 2
1 2 1 2 1 ,2 1 21 1 1 1
( , ) 2 N N N N
i j i j i ji j i j
D F F p p a p p
1 2(0.3) (0.7) SD s s D D
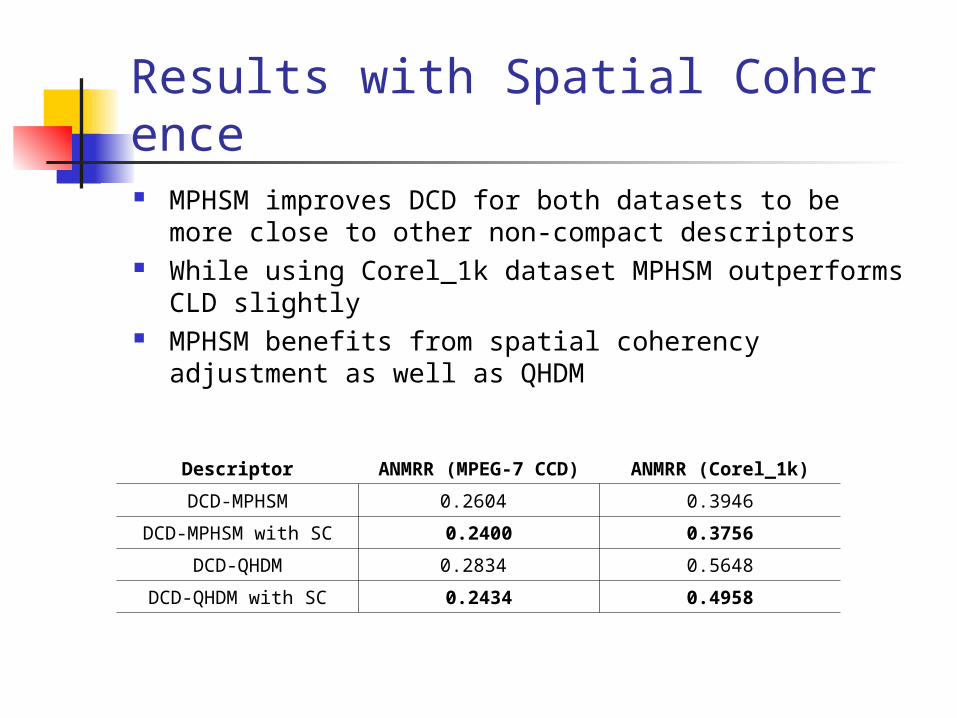
Results with Spatial Coherence MPHSM improves DCD for both datasets to be more
close to other non-compact descriptors While using Corel_1k dataset MPHSM outperforms CLD
slightly MPHSM benefits from spatial coherency adjustment as
well as QHDM
Descriptor ANMRR (MPEG-7 CCD) ANMRR (Corel_1k)
DCD-MPHSM 0.2604 0.3946
DCD-MPHSM with SC 0.2400 0.3756
DCD-QHDM 0.2834 0.5648
DCD-QHDM with SC 0.2434 0.4958
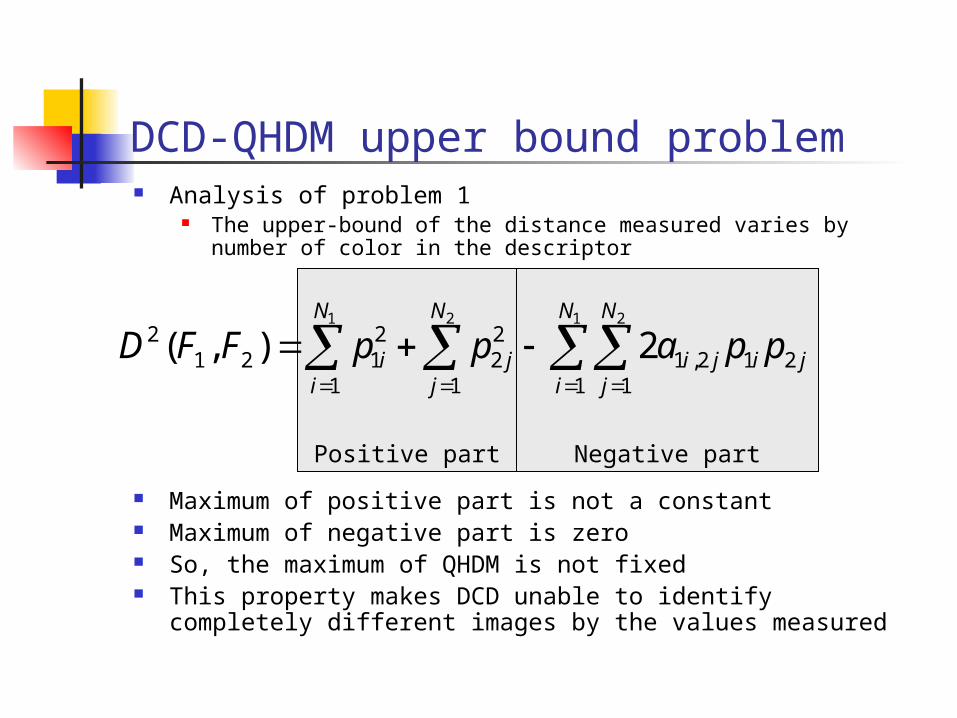
DCD-QHDM upper bound problem Analysis of problem 1
The upper-bound of the distance measured varies by number of color in the descriptor
Maximum of positive part is not a constant Maximum of negative part is zero So, the maximum of QHDM is not fixed This property makes DCD unable to identify completely
different images by the values measured
Positive part Negative part
1 2 1 22 2 2
1 2 1 2 1 ,2 1 21 1 1 1
( , ) 2 N N N N
i j i j i ji j i j
D F F p p a p p
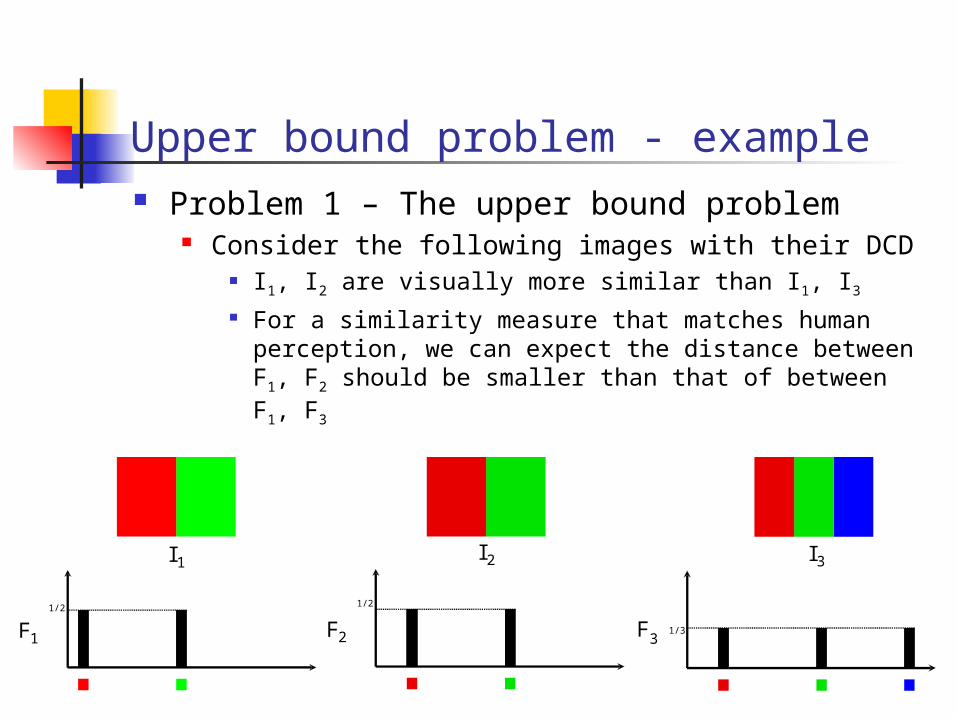
Upper bound problem - example Problem 1 – The upper bound problem
Consider the following images with their DCD I1, I2 are visually more similar than I1, I3 For a similarity measure that matches human
perception, we can expect the distance between F1, F2 should be smaller than that of between F1, F3
F1 F2
1/2
F3
1/2
1/3
I2 I3I1
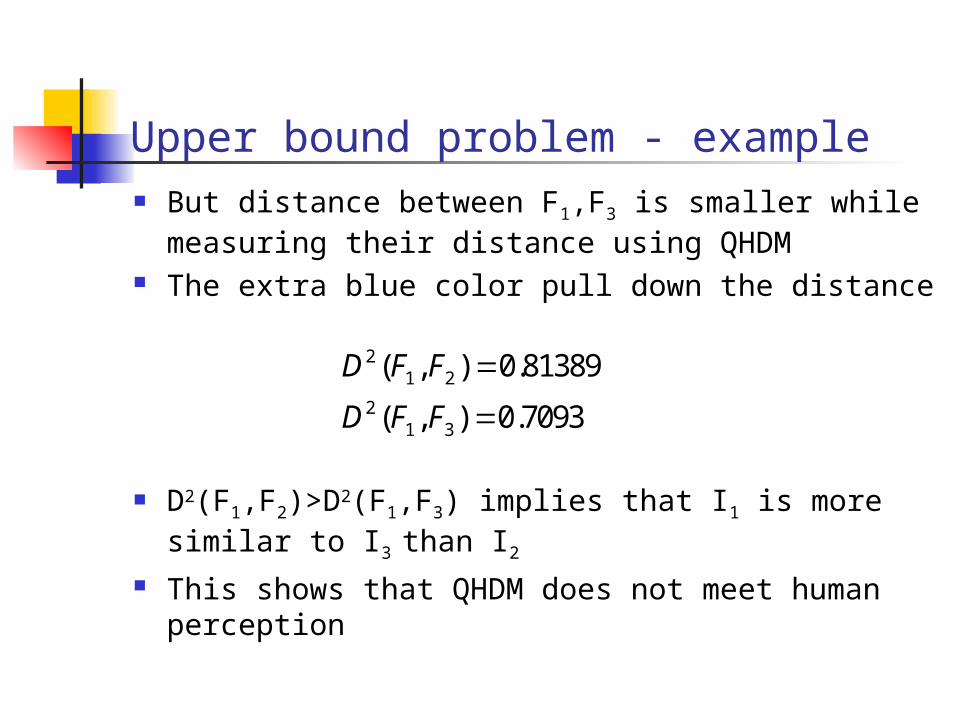
Upper bound problem - example But distance between F1,F3 is smaller while
measuring their distance using QHDM The extra blue color pull down the distance
D2(F1,F2)>D2(F1,F3) implies that I1 is more similar to I3 than I2
This shows that QHDM does not meet human perception
21 2
21 3
( , ) 0.81389
( , ) 0.7093
D F F
D F F
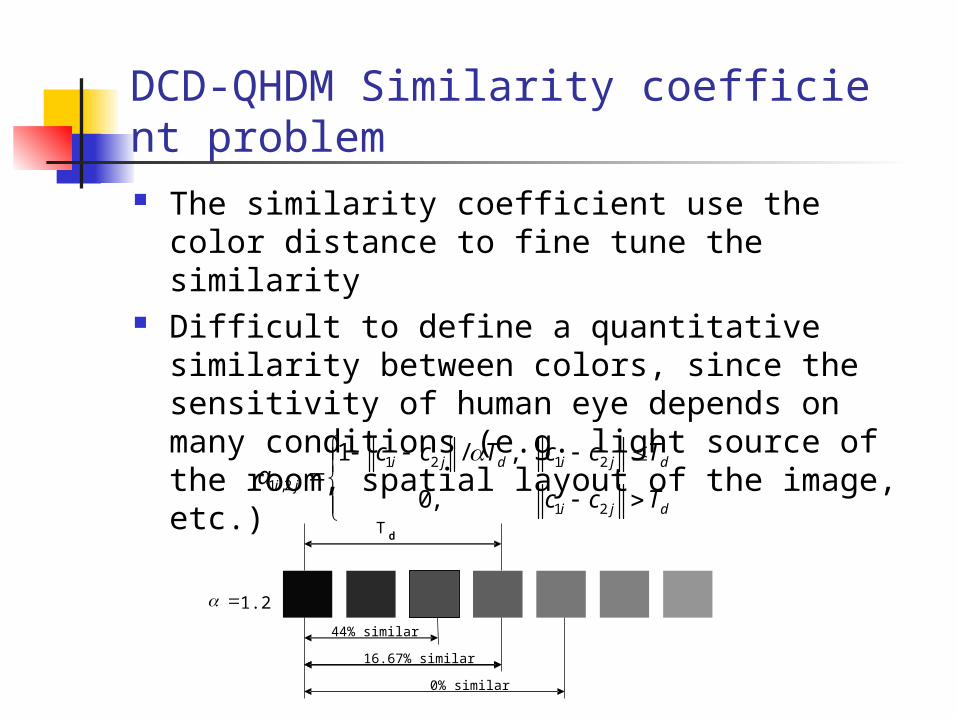
DCD-QHDM Similarity coefficient problem The similarity coefficient use the color distance
to fine tune the similarity Difficult to define a quantitative similarity
between colors, since the sensitivity of human eye depends on many conditions (e.g. light source of the room, spatial layout of the image, etc.)
1 2 1 2
1 ,2
1 2
1 / ,
0,
i j d i j d
i j
i j d
c c T c c Ta
c c T
16.67% similar
44% similar
Td
0% similar
1.2
d
Similarity coefficient problem It is easy to count 50% of area is similar.
But it is difficult to count the colors are 50% similar.
This method is unable to consider the area of matching and the color distance together.

Similarity coefficient problem - example Problem 2 – The similarity coefficient a1i,2j
problem Consider the following images
I1, I2 are visually more similar than I1, I4 For a similarity measure that matches human perception,
we can expect the distance between F1, F2 should be smaller than that of between F1, F4
F4
1
I4
F1 F2
1/2 1/2
I2I1
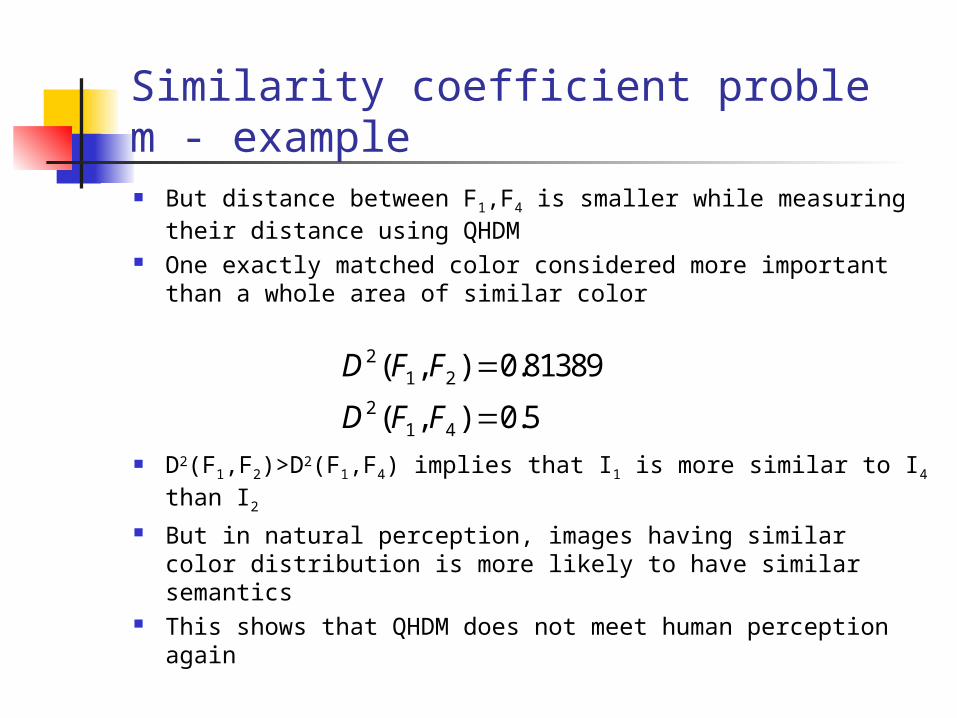
Similarity coefficient problem - example But distance between F1,F4 is smaller while measuring
their distance using QHDM One exactly matched color considered more important
than a whole area of similar color
D2(F1,F2)>D2(F1,F4) implies that I1 is more similar to I4 than I2
But in natural perception, images having similar color distribution is more likely to have similar semantics
This shows that QHDM does not meet human perception again
21 2
21 4
( , ) 0.81389
( , ) 0.5
D F F
D F F

Flow of MPHSM
Initial DCDs
Find a pair of colors with minimum
distance d
d<Td ?Merge colors havingminimum distance
Common Palette
N
Y
Update each DCD basedon the common palette
Histogram Intersection

Palette Merging process, visually Example
Two images with DCD, palette merging stage
Dominant Color Descriptor
Find the closest pair
Merge colors
CommonPaletteMerge colorsMerge colorsMerge colorsRemaining colors
If a remaining color is similar toany colors in the common palette. Itwill not included in common palette

About slide 23 Relationship between CBIR and Relevance
Feedback (RF) The key component is query update
Input Query
FeatureExtraction
SimilarityMeasure
RetrievalResult
User’sFeedback
QueryUpdate
Find allImages?
y
n
FinalRetrieval
Result
Image Retrieval
Relevance Feedback
Input Query
FeatureExtraction
SimilarityMeasure
RetrievalResult
User’sFeedback
QueryUpdate
Find allImages?
y
n
FinalRetrieval
Result
Image Retrieval
Relevance Feedback

MPH-RF flow
Load add DCDs
Append all DCD
Find closes pair of colors
Minimum distance
< Td ?
Merge colorsand percentages
A
A
Cut least significantcolors
Adjust histogramsum into 1
Updated query
Y
N
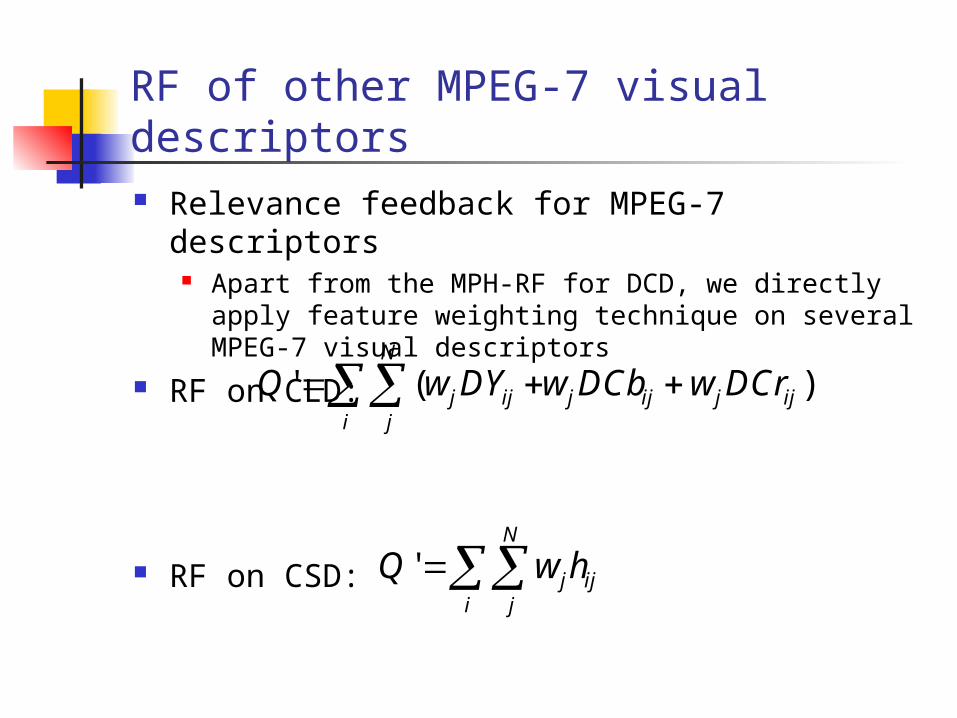
RF of other MPEG-7 visual descriptors Relevance feedback for MPEG-7 descriptors
Apart from the MPH-RF for DCD, we directly apply feature weighting technique on several MPEG-7 visual descriptors
RF on CLD:
RF on CSD:
' ( )N
j ij j ij j iji j
Q w DY w DCb w DCr
'N
j iji j
Q w h

RF of other MPEG-7 visual descriptors RF on SCD:
'N
j iji j
Q w coeff

MIRROR – A CBIR system using MPEG-7 visual descriptors A set of visual descriptors Relevance feedback functions is added Evaluation tools MIRROR is also a development platform of
MPEG-7 visual descriptors
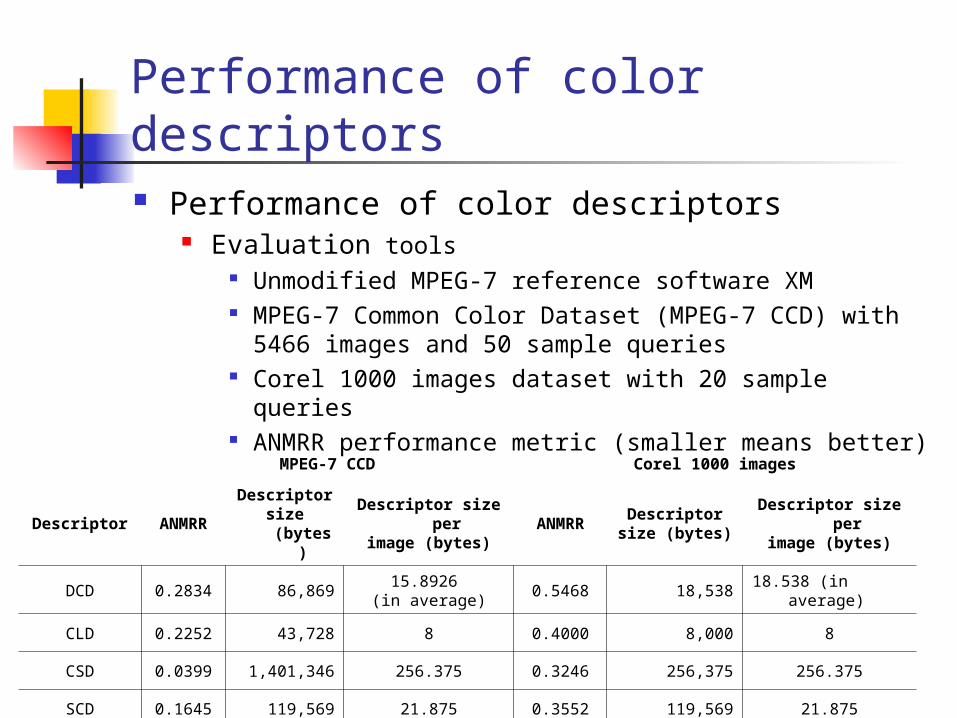
Performance of color descriptors Performance of color descriptors
Evaluation tools Unmodified MPEG-7 reference software XM MPEG-7 Common Color Dataset (MPEG-7 CCD) with
5466 images and 50 sample queries Corel 1000 images dataset with 20 sample queries ANMRR performance metric (smaller means better)
MPEG-7 CCD Corel 1000 images
DescriptorANMR
R
Descriptorsize (bytes
)
Descriptor size per
image (bytes)ANMRR
Descriptorsize (bytes)
Descriptor size per
image (bytes)
DCD 0.2834 86,86915.8926
(in average)0.5468 18,538
18.538 (in average)
CLD 0.2252 43,728 8 0.4000 8,000 8
CSD 0.0399 1,401,346 256.375 0.3246 256,375 256.375
SCD 0.1645 119,569 21.875 0.3552 119,569 21.875
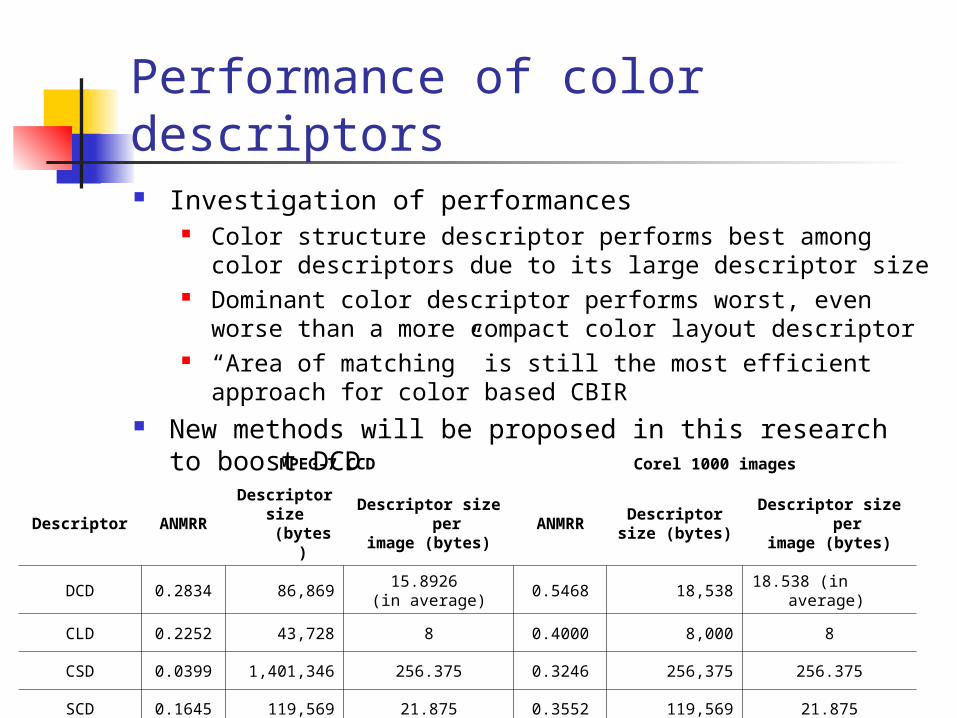
Performance of color descriptors Investigation of performances
Color structure descriptor performs best among color descriptors due to its large descriptor size
Dominant color descriptor performs worst, even worse than a more compact color layout descriptor
“Area of matching” is still the most efficient approach for color based CBIR
New methods will be proposed in this research to boost DCD MPEG-7 CCD Corel 1000 images
DescriptorANMR
R
Descriptorsize (bytes
)
Descriptor size per
image (bytes)ANMRR
Descriptorsize (bytes)
Descriptor size per
image (bytes)
DCD 0.2834 86,86915.8926
(in average)0.5468 18,538
18.538 (in average)
CLD 0.2252 43,728 8 0.4000 8,000 8
CSD 0.0399 1,401,346 256.375 0.3246 256,375 256.375
SCD 0.1645 119,569 21.875 0.3552 119,569 21.875

Complete results MPHSM improves DCD for both datasets to be more
close to other non-compact descriptors While using Corel_1k dataset MPHSM outperforms CLD
slightly MPHSM benefits from spatial coherency adjustment as
well as QHDM
Descriptor ANMRR (MPEG-7 CCD) ANMRR (Corel_1k)
DCD-MPHSM 0.2604 0.3946
DCD-MPHSM with SC 0.2400 0.3756
DCD-QHDM 0.2834 0.5648
DCD-QHDM with SC 0.2434 0.4958
CLD 0.2252 0.4000
CSD 0.0399 0.3246
SCD 0.1645 0.3552

Complete results MPR-RF gives significant improvement on all
combinations of similarity measures and datasets. By using MPH-RF DCD can perform as good as another
compact descriptor CLD, and very close to a lesser compact descriptor SCD.
Three iterations of relevance feedback give a significant result
Descriptor
MPEG-7 CCD Corel_1k
Before RF After 3 RFRF
ImprovementBefore RF After 3 RF
RF Improvement
DCD-MPHSM
0.2604 0.1752 0.0852 0.3946 0.3298 0.0648
DCD-QHDM 0.2834 0.2117 0.0717 0.5468 0.4900 0.0568
CLD 0.2252 0.4000
CSD 0.0399 0.3246
SCD 0.1645 0.3552

Complete results The MPH-RF improvement on DCD is more significant
than feature weighting for other color descriptors
Color structure descriptor gives impressive results among all color descriptor, and its only drawback is the descriptor size is too large.
Descriptor
MPEG-7 CCD Corel_1k
Before RF After 3 RFRF
ImprovementBefore RF After 3 RF
RF Improvement
DCD-MPHSM
0.2604 0.1752 0.0852 0.3946 0.3298 0.0648
DCD-QHDM
0.2834 0.2117 0.0717 0.5468 0.4900 0.0568
CLD 0.2252 0.1814 0.0438 0.4000 0.3571 0.0429
CSD 0.0399 0.0115 0.0284 0.3246 0.2366 0.0880
SCD 0.1645 0.1019 0.0626 0.3552 0.3276 0.0276