may 5, 2021 first quarter 2021 supplementary slides
TRANSCRIPT

© 2021 SunPower Corporation
First Quarter 2021 Supplementary Slides
MAY 5, 2021

SAFE HARBOR STATEMENT
This presentation contains forward-looking statements within the meaning of the
Private Securities Litigation Reform Act of 1995, including, but not limited to,
statements regarding (a) our plans and objectives for existing and future project
development and construction; (b) our technological evolution and research and
development activities; (c) our expectations and plans regarding product demand, solar
market forecasts, market traction, growth, and volume, including forecasts as they relate
to regulatory and public policy developments; (d) estimates regarding the future
performance and reliability of our products; (e) financial guidance for 2021 and onward,
including the timing and impact of COVID-19 on our operations; (f) plans to improve
execution and performance in our business; (g) our plans and expectations for our
products and planned products and services, including anticipated markets and
demand and cost impacts; (h) managing working capital; (i) residential leasing; (j) project
development and construction; and (k) securing financing for our residential lease
program and other projects. These forward-looking statements are based on our
current assumptions, expectations and beliefs and involve substantial risks and
uncertainties that may cause results, performance or achievement to materially differ
from those expressed or implied by these forward-looking statements. Factors that
could cause or contribute to such differences include, but are not limited to: (1)
competition in the solar and general energy industry and downward pressure on selling
prices and wholesale energy pricing; (2) our liquidity, substantial indebtedness, and
ability to obtain additional financing for our projects and customers; (3) changes in
public policy, including the imposition and applicability of tariffs; (4) regulatory changes
and the availability of economic incentives promoting use of solar energy; (5) challenges
inherent in constructing projects; (6) challenges in executing transactions key to our
strategic plans, including regulatory and other challenges that may arise; (7) the success
of our ongoing research and development efforts and our ability to commercialize new
products and services, including products and services developed through strategic
partnerships; (8) fluctuations in our operating results; (9) potential disruptions to our
operation and supply chain that may result from epidemics or natural disasters; (10)
appropriately forecasting product demand and containing manufacturing and logistics
difficulties that could arise; (11) challenges managing our joint ventures and
partnerships, including our ability to successfully manage acquired assets and supplier
relationships; and (12) fluctuations or declines in the performance of our solar panels
and other products and solutions. A detailed discussion of these factors and other risks
that affect our business is included in filings we make with the Securities and Exchange
Commission (SEC) from time to time, including our most recent report on Form 10-K,
particularly under the heading “Risk Factors.” Copies of these filings are available online
from the SEC or on the SEC Filings section of our Investor Relations website at
investors.sunpower.com. All forward-looking statements in this presentation are based
on information currently available to us, and we assume no obligation to update these
forward-looking statements in light of new information or future events.
© 2021 SunPower Corporation

3 © 2021 SunPower Corporation
Strong Execution; Well Positioned for GrowthQ1 EARNINGS
>30%YOY
Bookings Growth2
60%YoY $$ Gross
Margin Growth in Q1’21
>40%2022 EBITDA
Growth
Expanded TAM1, retired debt ahead of plan
Robust bookings and backlog growth
• Residential bookings growth of 25%
• CIS1 bookings + 50% YoY, backlog 275MW
Strong Q1-21 Execution
• RLC3 Q1’21 GM% at 22%
• Retired recourse debt early
2022 Tailwinds
• Executing on TAM expansion strategy
• Biden Infra plan impact incremental
1 TAM = Total Addressable Market 2 Blended bookings – RLC / CIS3 C&I Solutions (CIS), Residential Light Commercial (RLC)

4 © 2021 SunPower Corporation
Progress on TAM Expansion InitiativesQ1 EARNINGS
10x Opportunity - Additional Growth Initiatives Underway
• Extending SPWR servicing platform to loans
• SunStrong ownership of commercial projects
• Expanding platform and financing for SPWR dealers
• Partnerships to expand to wider install network
Current Focus: Solar/Storage
CIS FTMStorage
DG Platform Services
Long TailCustomers
$65B
$120B
$200B
$250B
Source: Bloomberg New Energy Finance (2020) – Long Term Customer-Sited Solar and Storage Outlook 2020-2050
• Storage solutions capability: 3rd party developers
• >20MWh backlog + >400MWh pipeline
• Expanding New Homes efforts to Multi-Family
• CIS storage: >80MWh awarded, 800MWh pipeline
May Update

5 © 2021 SunPower Corporation
Continued Residential Business MomentumQ1 EARNINGS
12,000Customers added
in Q1
$0.41/WResidential value
creation in Q1(55% full systems)
200 MWNew Homes in backlog including Multi-Family
363,000Total customer
base
22%Gross Margin
(up 780bps YoY)
>$50MSunVault™ Storage annualized
April bookings run rate
Record Q1 Margin Performance; Confirms Confidence in 2H 2021 Forecasts
6 © 2021 SunPower Corporation
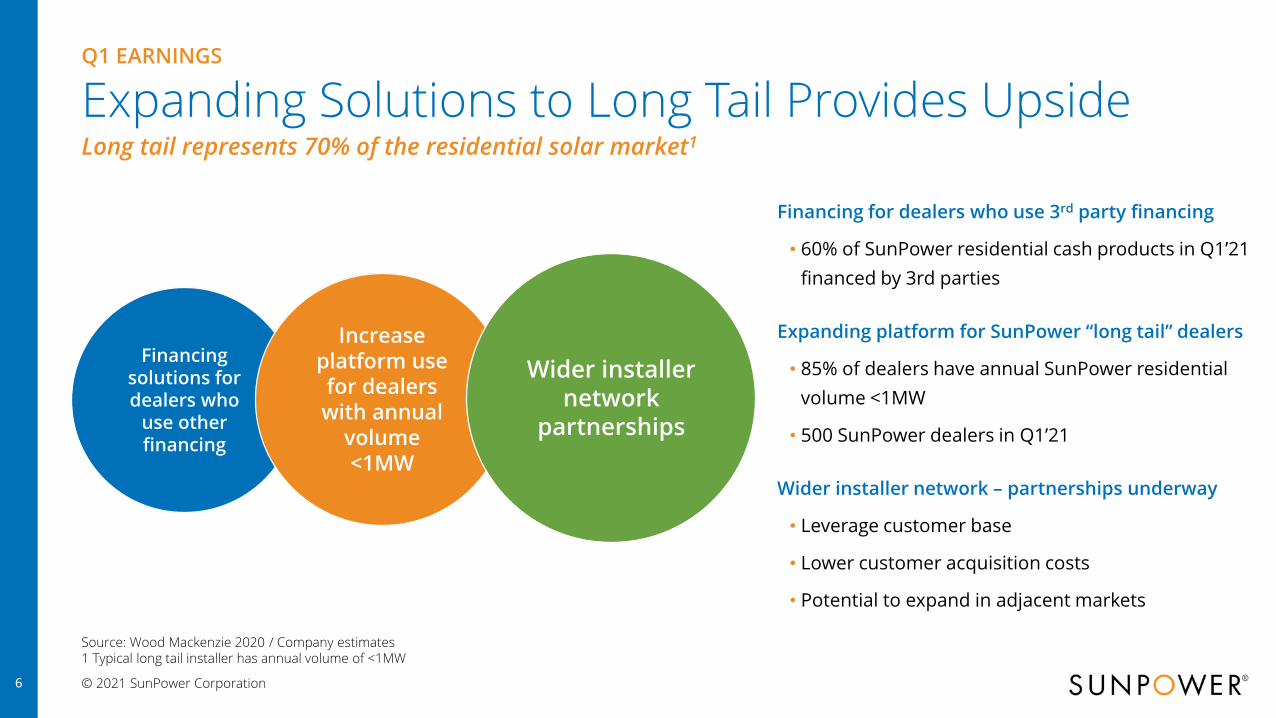
Expanding Solutions to Long Tail Provides UpsideQ1 EARNINGS
Financing for dealers who use 3rd party financing
• 60% of SunPower residential cash products in Q1’21
financed by 3rd parties
Expanding platform for SunPower “long tail” dealers
• 85% of dealers have annual SunPower residential
volume <1MW
• 500 SunPower dealers in Q1’21
Wider installer network – partnerships underway
• Leverage customer base
• Lower customer acquisition costs
• Potential to expand in adjacent markets
Long tail represents 70% of the residential solar market1
Source: Wood Mackenzie 2020 / Company estimates1 Typical long tail installer has annual volume of <1MW
Financing solutions for dealers who
use other financing
Increase platform use for dealers with annual
volume <1MW
Wider installer network
partnerships

7 © 2021 SunPower Corporation
Core C&I New Opportunities
Transit Center with Community Solar
Strong C&I Solutions PerformanceQ1 EARNINGS
FTM Storage
>20 MWh under contract;
>400 MWh awarded or shortlisted
Community Solar
>115 MW Pipeline Secured
Consumer Products Company
>275 MW Solar
and
>250 MWh Storage
Contracted & Awarded
Recognized in 2021-22
Profitable Growth
$0
$10
$20
$30
$40
$50
$60
$70
Q1 2020 Q1 2021
Revenue
+900bps Gross Margin Improvement

8 © 2021 SunPower Corporation
CIS: Significant Opportunity in Platform ExpansionQ1 EARNINGS
Origination and Development Storage Solutions and Services
Objective Profitability Invest to Grow
2021 YTD Accomplishments
• Strong pipeline growth
• Focus on cost reduction
• Increasing focus on community solar
• Joint development with financing partners
• Leading BTM provider
• >125 MWh operating or under contract
• Investing in FTM capabilities
• >20 MWh under contract
• >400 MWh awarded or shortlisted
• Focused group to develop solutions for C&I pipeline
• Synergies with residential storage
• Emerging platform to support 3rd party projects

9 © 2021 SunPower Corporation
Q1’21 Financials: >100% EBITDA Growth vs. Q1’20Q1 EARNINGS
1 Metrics adjusted for legacy business including development, Oregon and margin previously in the company’s SPT segment.
2 MWr comparison to Q1’20: Residential +10%, CIS +34%, Light Com down YOY
Q1’21 Q4’20 Q1’20
SPWR consolidated
Revenue - $M $306 $342 $296
Revenue excluding legacy1 $304 $332 $263
Adjusted EBITDA - $M $19 $39 $(3)
Net Resource Debt - $M $300 $281 $596
Devco
MW Recognized 127 153 132
Gross Margin/W (Non-GAAP) $0.42 $0.50 $0.27
Opex/W $0.34 $0.27 $0.33
Opex/W (excl. digital & products) $0.27 $0.21 $0.25
Powerco
Pipeline - $M $644 $637 $386
SPWR share of Net Retained Value - $M $216 $211 $186
Devco: Q1’21 execution, strong run rate going into 2021
• GM/W up >50% year over year
• Strong bookings – residential (25% YoY), CIS (50% YoY)
Powerco: Services pipeline ahead of 2021 analyst day targets
• Increasing TAM by adding commercial portfolio to SunStrong
• Increasing lifetime customer value through loan servicing
Balance sheet: Net debt down ~$50% from prior year
• Retired 8.5% CEDA loan early; 2021 converts retirement planned for June
• BU operating cash generation in Q1’21

10 © 2021 SunPower Corporation
Strong SunPower Value Creation in 2021and Beyond1Q1 EARNINGS
$116M
~2x
2020 2021E
SunPower Value Creation
~2x Growth in 2021, ~90% of Value Creation from Day 1 Cash Margin
1 Definition: Adjusted EBITDA of RLC and CIS excluding any products and digital investment + Net Retained Value for SPWR share (including leases)
•Residential: 60% of 2021 MWr / 85% of 2021 value
•Residential growing faster than commercial
•Residential value creation expansion driven by
• Increasing full / financed systems sales
• Further opportunities to lower cost of capital
11 © 2021 SunPower Corporation
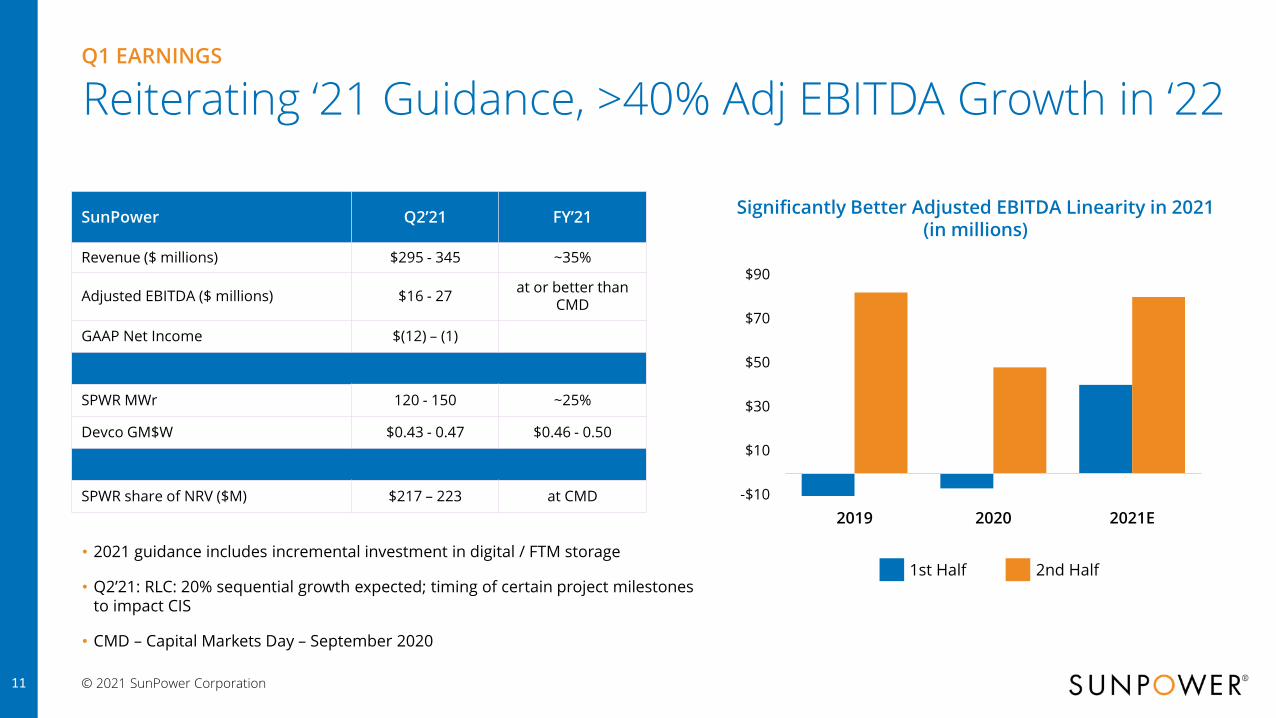
Reiterating ‘21 Guidance, >40% Adj EBITDA Growth in ‘22Q1 EARNINGS
• 2021 guidance includes incremental investment in digital / FTM storage
• Q2’21: RLC: 20% sequential growth expected; timing of certain project milestones to impact CIS
• CMD – Capital Markets Day – September 2020
SunPower Q2’21 FY’21
Revenue ($ millions) $295 - 345 ~35%
Adjusted EBITDA ($ millions) $16 - 27at or better than
CMD
GAAP Net Income $(12) – (1)
SPWR MWr 120 - 150 ~25%
Devco GM$W $0.43 - 0.47 $0.46 - 0.50
SPWR share of NRV ($M) $217 – 223 at CMD -$10
$10
$30
$50
$70
$90
2019 2020 2021E
Significantly Better Adjusted EBITDA Linearity in 2021(in millions)
1st Half 2nd Half

12 © 2021 SunPower Corporation
Q1 EARNINGS
SunPower Well Positioned to Capitalize on Biden Plan
Retrofit 2M
Buildings,
$67B
Federal Buildings
Mandate,
$28B
School
Improvements,
$112B
Clean Energy
Accelerator,
$27B
>$225 Billion Market Expansion Opportunity provides upside
SunPower Positioning
•Resi cash & loan segment: ITC extension positive for cash / loan &
ITC refundability expands the cash / loan TAM
• Light Commercial: ITC refundability reduces financing bottlenecks,
stand alone storage increases TAM
•Resi / Commercial: Stand alone storage opportunity positive for
>3GW installed base (including installed base of financing partners)
•Market Leader in federal buildings (>150MW installs) + education
sector (>150MW installs)
•Ongoing single family / multi-family affordable housing focus:
strong tailwinds from 2M buildings retrofit mandate

13 © 2021 SunPower Corporation
Summary: Building Value in Evolving DG LandscapeQ1 EARNINGS
Road Ahead
Long-TailAncillary
products/ services
Monetizing current / future customer base
Currentvaluation
TAMExpansion
Unlocking embedded
value in platform
Adjacencies Opportunity
Well Positioned for the Future
• Strong industry position
• Strong balance sheet
• Industry leading installed base
Unlocking hidden value from assets
that resemble:
Fintech
Energy Storage Systems Co

APPENDIX

15 © 2021 SunPower Corporation
Q1’21 Financial OverviewQ1 EARNINGS
$ millions, except percentages and per share data Q1’21 Q4’20 Q1’20*
Revenue (Non-GAAP) $306 $342 $296
RLC $238 $258 $232
C&I Solutions $66 $80 $51
Others $2 $4 $13
Gross Margin (Non-GAAP) 18.7% 22.3% 12.1%
RLC 22.2% 23.9% 14.4%
C&I Solutions 6.4% 17.8% -2.6%
Non-GAAP Operating Expense $44 $41 $43
Adjusted EBITDA $19 $39 $(3)
Taxes Rate (non-GAAP) (20.4)% 0.5% (0.2)%
Net Income (Loss) – GAAP $(48) $412 $22
Net Income (Loss) – (Non-GAAP) $9$27
$(15)
Diluted Wtg. Avg. Shares Out. (GAAP) 171 200 177
Diluted Wtg. Avg. Shares Out. (Non-GAAP) 192 193 169
Diluted EPS (GAAP) $(0.28) $2.08 $0.12
Diluted EPS (Non-GAAP) $0.05 $0.14 $(0.09)
*Excludes the impact of discontinued operations resulting from the spin off of Maxeon Solar Technologies in Q3’2020Note: Refer to the company’s press release dated May 5, 2021 for additional information on the GAAP to non-GAAP reconciliation
$ all figures in million, unless specified
16 © 2021 SunPower Corporation
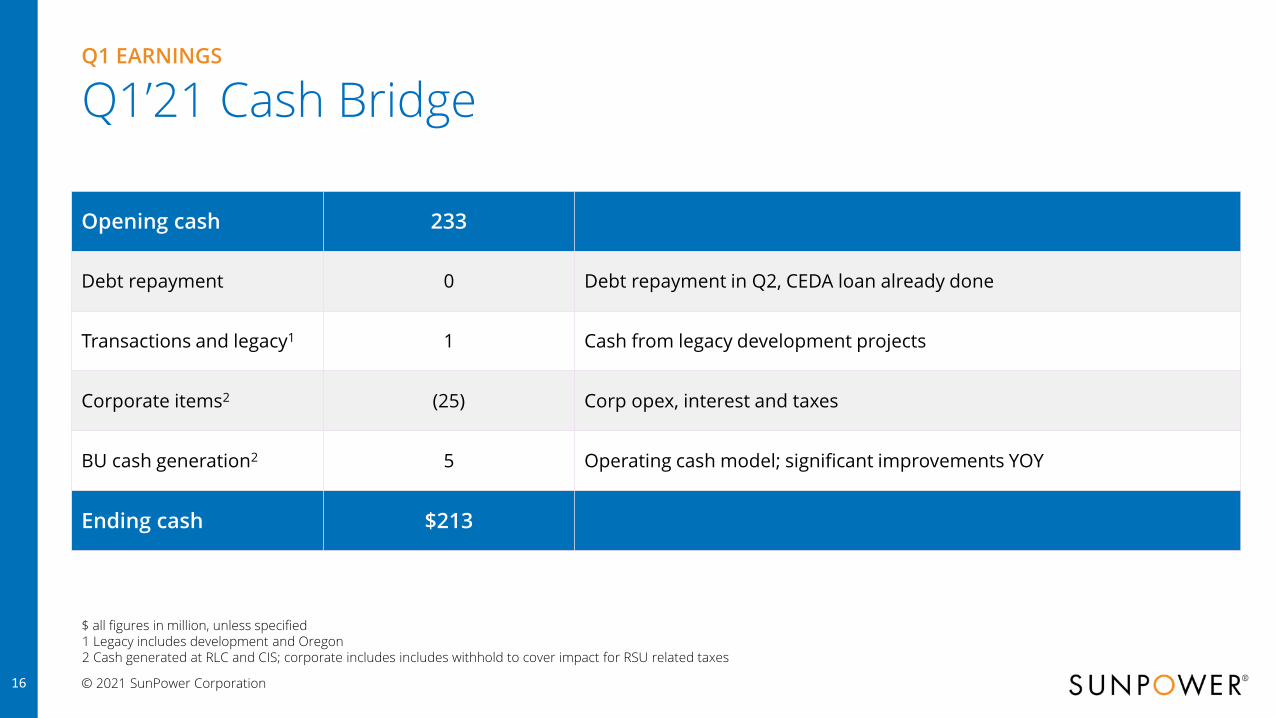
Q1’21 Cash BridgeQ1 EARNINGS
Opening cash 233
Debt repayment 0 Debt repayment in Q2, CEDA loan already done
Transactions and legacy1 1 Cash from legacy development projects
Corporate items2 (25) Corp opex, interest and taxes
BU cash generation2 5 Operating cash model; significant improvements YOY
Ending cash $213
$ all figures in million, unless specified1 Legacy includes development and Oregon2 Cash generated at RLC and CIS; corporate includes includes withhold to cover impact for RSU related taxes

17 © 2021 SunPower Corporation
Digital and Products Capital Spend - 2021 Q1 EARNINGS
35%
65%
Infrastruture Digital & Products Programs
Infrastructure
• Technology licenses
•Cloud computing investment
•Quality assurance programs
Digital & Product Programs
•mySunPower™ customer portal
• SunVault™ storage solution
• SunPower Design Studio / Dealer portal

18 © 2021 SunPower Corporation
GAAP to Non-GAAP ReconciliationQ1 EARNINGS
Results of operations of legacy business to be
exited refers to the operating results as well as
accelerated deprecation charges at our Oregon
manufacturing operations that we announced
to close and will fully exit after completion of
wind-down activities by June 2021.
Adjustments relate to non-recurring charges for
litigation expenses offset by gain on sale of
property, plant and equipment.
QTD
in millions Q1’21 Q4’20 Q1’20
GAAP net income attributable to stockholders
(48) 412 22
Interest expense, net of interest income 7 8 9
Depreciation and amortization 3 4 5
Provision for income taxes (5) 19 1
Unrealized (gain) loss on equity securities –Enphase
45 (416) (48)
Results of operations of legacy business to be exited
7 - -
Restructuring charges 4 - 2
Stock-based compensation 5 6 5
Other non-recurring items 1 6 1
Adjusted EBITDA 19 39 (3)
1
2
Note: Refer to the company’s press release dated May 5, 2021 for additional information on the GAAP to non-GAAP reconciliation
1
2
Changing the wayour world is powered
THANK YOU
© 2021 SunPower Corporation