supplementary regulatory capital information · 2019. 5. 29. · supplementary regulatory capital...
TRANSCRIPT
Supplementary RegulatoryCapital InformationFor the Quarter Ended – April 30, 2019
For further information, contact:
JILL HOMENUK CHRISTINE VIAUHead, Investor Relations Director, Investor Relations416.867.4770 [email protected] [email protected]
www.bmo.com/investorrelations
Q2 | 19

TABLE OF CONTENTS
Page Page
Notes to Users 1 Counterparty Credit Risk Schedules 29-38CCR1 - Analysis of Counterparty Credit Risk (CCR) Exposure by Approach 29
Pillar 3 Disclosure Requirements Index 2 CCR2 - Credit Valuation Adjustment (CVA) Capital Charge 30CCR3 - Standardized Approach - CCR Exposures by Regulatory Portfolio and Risk Weights 31
Overview of Regulatory Capital, Risk Weighted Assets and Capital Ratios 3-13 CCR4 - IRB - CCR Exposures by Portfolio and PD Scale 32-34CC1 - Composition of Regulatory Capital 3-4 CCR5 - Composition of Collateral for CCR Exposure 35CC2 - Reconciliation of Regulatory Capital to Balance Sheet 5 CCR6 - Credit Derivatives Exposures 36Flow Statement of Basel III Regulatory Capital 6 CCR8 - Exposures to Central Counterparties 37Capital Ratios for Significant Bank Subsidiaries 6 Derivative Instruments 38KM2 - Key Metrics - TLAC Requirements 7TLAC1 - TLAC Composition 8 Securitization Schedules 39-42TLAC3 - Resolution Entity - Creditor Ranking at Legal Entity Level 9 SEC1 - Securitization Exposures in the Banking Book 39LR1 - Summary Comparison of Accounting Assets vs. Leverage Ratio Exposure Measure 10 SEC2 - Securitization Exposures in the Trading Book 40LR2 - Leverage Ratio Common Disclosure 10 SEC3 - Securitization Exposures in the Banking Book and Associated Capital Requirements OV1 - Overview of RWA 11 SEC3 - (Bank Acting as Originator or as Sponsor) 41Common Equity Tier 1 (CET 1) Capital Risk-Weighted Assets by Operating Groups 11 SEC4 - Securitization Exposures in the Banking Book and Associated Capital RequirementsLI1 - Differences Between Accounting and Regulatory Scopes of Consolidation and Mapping SEC4 - (Bank Acting as Investor) 42 of Financial Statements with Regulatory Risk Categories 12LI2 - Main Sources of Differences Between Regulatory Exposure Amounts and Carrying Market Risk Risk-Weighted Assets (RWA) Movement by Key Drivers 43 Values in Financial Statements 13
Estimated and Actual Loss Parameters under AIRB Approach 44Credit Risk Schedules 14-28
CR1 - Credit Quality of Assets 14 Glossary 45CR2 - Changes in Stock of Defaulted Loans and Debt Securities 15CR3 - Credit Risk Mitigation Techniques - Overview 16CR4 - Standardized Approach - Credit Risk Exposure and Credit Risk Mitigation (CRM) Effects 17CR5 - Standardized Approach - Exposures by Asset Classes and Risk Weights 18CR6 - IRB - Credit Risk Exposures by Portfolio and PD Range 19-24CR7 - IRB - Effect on RWA of Credit Derivatives Used as CRM Techniques 25CR8 - RWA Flow Statements of Credit Risk and Counterparty Credit Risk Exposures 26Exposure Covered by Credit Risk Mitigation 27Credit Risk Exposure by Geographic Region 27Credit Risk Exposure by Major Asset Class 27Credit Risk by Residual Contract Maturity Breakdown 28Credit Risk Exposure by Industry 28
This report is unaudited and all amounts are in millions of Canadian dollars, unless otherwise indicated.
April 30, 2019 Supplementary Regulatory Capital Disclosure
NOTES TO USERS
Use of this DocumentThe supplemental information contained in this package is designed to improve the readers' understanding of the capital requirements of BMO Financial Group (the Bank). This information should be used in conjunction with the Bank's Second Quarter 2019 Report to Shareholders and the 2018 Annual Report.
Additional financial information is also available in the Q2 2019 Supplementary Financial Information, Q2 2019 Investor Presentation as well as the Conference Call Webcast which can be accessed at our website atwww.bmo.com/investorrelations.
This report is unaudited and all amounts are in millions of Canadian dollars, unless indicated otherwise.
Items indicated n.a. were not applicable.
ChangesFor institutions using advanced approaches for credit risk or operational risk, there is a Capital Floor as prescribedin OSFI’s CAR Guideline. OSFI revised its approach for calculating the Capital Floor effective Q2 2018. Changesinclude a shift to the Basel II standardized approach, as well as a reduction of the floor factor to 70% in Q2 2018, 72.5% in Q3 2018 and 75% in Q4 2018 and onward.
In May 2018, OSFI released the Total Loss Absorbing Capacity (TLAC) Disclosure Requirements for Canadian D-SIBs which have been adopted prospectively effective January 31, 2019.
On November 20, 2018, OSFI released the revised Leverage Ratio Disclosure Requirements Guideline. The revisions, which reflect the recent changes to the Leverage Requirements Guideline and OSFI’s CAR Guideline,incorporate a new line to capture the treatment of securitized assets that meet the operational requirements for recognition of significant risk transfer. The new guideline has been adopted prospectively effective January 31, 2019.
On April 20, 2017, OSFI released the final version of the Pillar 3 Disclosure Requirements, setting OSFI’sexpectations for Domestic Systemically Important Banks (D-SIBs) for the Revised Pillar 3 Disclosure Requirements issued by the Basel Committee on Banking Supervision in January 2015. We have adopted this guidance prospectively effective October 31, 2018. For information prior to Q4 2018, please refer to Q3 2018 and priorSupplementary Financial Information Packages.
Users may provide their comments and suggestions on the Supplementary Regulatory Capital Information document by contacting Christine Viau at (416) 867-6956 or [email protected]
April 30, 2019 Supplementary Regulatory Capital Disclosure Page 1

PILLAR 3 DISCLOSURE REQUIREMENTS INDEX
Q2 2019 Supplementary
Financial Information
Q2 2019 Supplementary
Regulatory Capital Information 2018 Annual MD&A
2018 Annual Financial
StatementsPage Reference
KM2 - Key metrics - TLAC requirements Quarterly 7OVA - Bank risk management approach Annual 69-75, 78-116OV1 - Overview of RWA Quarterly 11LI1 - Differences between accounting and regulatory scopes of consolidation and mapping of financial statement categories with regulatory risk categories Quarterly 12LI2 - Main sources of differences between regulatory exposure amounts and carrying values in financial statements Quarterly 13LIA - Explanations of differences between accounting and regulatory exposure amounts Annual 12-13 118 184-190CC1 - Composition of regulatory capital Quarterly 3-4CC2 - Reconciliation of regulatory capital to balance sheet Quarterly 5TLAC1 - TLAC composition Quarterly 8TLAC2 - Material subgroup entity - creditor ranking at legal entity levelTLAC3 - Resolution entity - creditor ranking at legal entity level Quarterly 9LR1 - Summary comparison of accounting assets vs leverage ratio exposure measure Quarterly 10LR2 - Leverage ratio common disclosure Quarterly 10CRA - General qualitative information about credit risk Annual 81-87CR1 - Credit quality of assets Quarterly 14CR2 - Changes in stock of defaulted loans and debt securities Quarterly 15CRB - Additional disclosure related to the credit quality of assets Annual 20-26, 30 27-28 157-164CRC - Qualitative disclosure requirements related to credit risk mitigation techniques Annual 88-89 173, 185CR3 - Credit risk mitigation techniques - overview Quarterly 16CRD - Qualitative disclosures on banks' use of external credit ratings under the standardized approach for credit risk Annual 18CR4 - Standardized approach - credit risk exposure and Credit Risk Mitigation (CRM) effects Quarterly 17CR5 - Standardized approach - exposures by asset classes and risk weights Quarterly 18CRE - Qualitative disclosures related to IRB models Annual 89-90, 111-112CR6 - IRB - Credit risk exposures by portfolio and PD range Quarterly 19-24CR7 - IRB - Effect on RWA of credit derivatives used as CRM techniques Quarterly 25CR8 - RWA flow statements of credit risk exposures under IRB Quarterly 26CR9 - IRB - Backtesting of probability of default (PD) per portfolio (1) Annual 88-90, 112CR10 - IRB (specialized lending and equities under the simple risk-weight method)CCRA - Qualitative disclosure related to counterparty credit risk Annual 87-88, 106CCR1 - Analysis of counterparty credit risk (CCR) exposure by approach Quarterly 29CCR2 - Credit valuation adjustment (CVA) capital charge Quarterly 30CCR3 - Standardized approach - CCR exposures by regulatory portfolio and risk weights Quarterly 31CCR4 - IRB - CCR exposures by portfolio and PD scale Quarterly 32-34CCR5 - Composition of collateral for CCR exposure Quarterly 35CCR6 - Credit derivatives exposures Quarterly 36CCR7 - RWA flow statements of CCR exposures under Internal Model Method (IMM)CCR8 - Exposures to central counterparties Quarterly 37SECA - Qualitative disclosure requirements related to securitization exposures Annual 76, 89 148, 165-167SEC1 - Securitization exposures in the banking book Quarterly 39SEC2 - Securitization exposures in the trading book Quarterly 40SEC3 - Securitization exposures in the banking book and associated regulatory capital requirements (bank acting as originator or as sponsor) Quarterly 41SEC4 - Securitization exposures in the banking book and associated capital requirements (bank acting as investor) Quarterly 42MRA - Qualitative disclosure requirements related to market riskMRB - Qualitative disclosures for banks using the Internal Models Approach (IMA)MR1 - Market risk under standardized approachMR2 - RWA flow statements of market risk exposures under an IMAMR3 - IMA values for trading portfoliosMR4 - Comparison of VaR estimates with gains/losses
Operational Risk ORA - General qualitative information on a bank’s operational risk framework Annual 109-110IRRBBA - IRRBB risk management objective and policies Annual 98-99IRRBB1 - Quantitative information on IRRBB Annual 99
(1) Refer to Q4 2018 Supplementary Financial Information for CR9 - IRB - Backtesting of probability of default (PD) per portfolio quantitative disclosure.
Leverage ratio
Tables and Templates Frequency
Composition of Capital and TLAC
Interest Rate Risk in the Banking Book
Not applicable to BMO
Counterparty credit risk
Not applicable to BMO
Securitization
Market risk BMO has deferred these disclosures as allowed per OSFI's Pillar 3 guidance issued April 2017
Overview of risk management, key prudential metrics and RWA
Linkages between financial statements and regulatory exposures
Not applicable to BMO
Credit risk
April 30, 2019 Supplementary Regulatory Capital Disclosure Page 2

CC1 - COMPOSITION OF REGULATORY CAPITAL (1) (2)Cross 2019 2019 2018 2018 2018
($ millions except as noted) reference (3) Q2 Q1 Q4 Q3 Q2
Common Equity Tier 1 Capital: instruments and reserves1 Directly issued qualifying common share capital plus related stock surplus a+b 13,246 13,222 13,229 13,226 13,230 2 Retained earnings c 27,405 26,599 25,856 24,909 24,119 3 Accumulated other comprehensive income (and other reserves) d 4,054 3,188 2,302 2,381 2,157 4 Directly issued capital subject to phase out from CET1 n.a. n.a. n.a. n.a. n.a.5 Common share capital issued by subsidiaries and held by third parties (amount allowed in group CET1) - - - - - 6 Common Equity Tier 1 Capital before regulatory adjustments 44,705 43,009 41,387 40,516 39,506
Common Equity Tier 1 Capital: regulatory adjustments7 Prudential valuation adjustments 163 156 203 149 146 8 Goodwill (net of related tax liability) e+p1-f 6,353 6,280 6,283 6,186 6,175 9 Other intangibles other than mortgage-servicing rights (net of related tax liability) g-h 2,044 1,989 1,978 1,920 1,893
10 Deferred tax assets excluding those arising from temporary differences (net of related tax liability) i-j 646 785 907 972 976 11 Cash flow hedge reserve k 202 (280) (1,074) (885) (768) 12 Shortfall of provisions to expected losses k1 267 - - - - 13 Securitization gain on sale - - - - - 14 Gains or losses due to changes in own credit risk on fair valued liabilities (4) (182) (71) (153) (140) (168) 15 Defined benefit pension fund net assets (net of related tax liability) l-m 430 424 522 626 459 16 Investments in own shares (if not already netted off paid-in capital on reported balance sheet) n 6 - - - - 17 Reciprocal cross holdings in common equity - - - - - 18 Non-significant investments in the capital of banking, financial and insurance entities, net of eligible short positions
(amount above 10% threshold) - - - - - 19 Significant investments in the common stock of banking, financial and insurance entities that are outside the scope of
regulatory consolidation, net of eligible short positions (amount above 10% threshold) - - - - - 20 Mortgage servicing rights (amount above 10% threshold) - - - - - 21 Deferred tax assets arising from temporary differences (amount above 10% threshold, net of related tax liability) - - - - - 22 Amount exceeding the 15% threshold23 of which: significant investments in the common stock financials h1 - - - - - 24 of which: mortgage servicing rights j1 - - - - - 25 of which: deferred tax assets arising from temporary differences i1 - - - - - 26 Other deductions or regulatory adjustments to CET1 as determined by OSFI - - - - - 27 Regulatory adjustments applied to Common Equity Tier 1 due to insufficient Additional Tier 1 and Tier 2 to cover
deductions - - - - - 28 Total regulatory adjustments to Common Equity Tier 1 Capital 9,929 9,283 8,666 8,828 8,713 29 Common Equity Tier 1 Capital (CET1) 34,776 33,726 32,721 31,688 30,793
Additional Tier 1 Capital: instruments30 Directly issued qualifying Additional Tier 1 instruments plus related stock surplus o1 4,400 4,050 4,050 3,650 3,650 31 of which: classified as equity under applicable accounting standards 4,400 4,050 4,050 3,650 3,650 32 of which: classified as liabilities under applicable accounting standards - - - - - 33 Directly issued capital instruments subject to phase out from Additional Tier 1 (5) p 290 290 740 740 1,040 34 Additional Tier 1 instruments (and CET1 instruments not included in row 5) issued by subsidiaries and held by third
parties (amount allowed in group AT1) - - - - - 35 of which: instruments issued by subsidiaries subject to phase out - - - - - 36 Additional Tier 1 Capital before regulatory adjustments 4,690 4,340 4,790 4,390 4,690
Additional Tier 1 Capital: regulatory adjustments37 Investments in own Additional Tier 1 instruments n1 6 6 78 140 56 38 Reciprocal cross holdings in Additional Tier 1 instruments - - - - - 39 Non-significant investments in the capital of banking, financial and insurance entities, net of eligible short positions
(amount above 10% threshold) - - - - - 40 Significant investments in the capital of banking, financial and insurance entities that are outside the scope of
regulatory consolidation, net of eligible short positions t 213 213 213 213 213 41 Other deductions from Tier 1 Capital as determined by OSFI - - - - -
41a of which: Reverse mortgages - - - - - 42 Regulatory adjustments applied to Additional Tier 1 due to insufficient Tier 2 to cover deductions - - - - - 43 Total regulatory adjustments applied to Additional Tier 1 Capital 219 219 291 353 269 44 Additional Tier 1 Capital (AT1) 4,471 4,121 4,499 4,037 4,421 45 Tier 1 Capital (T1 = CET1 + AT1) 39,247 37,847 37,220 35,725 35,214
Tier 2 Capital: instruments and provisions46 Directly issued qualifying Tier 2 instruments plus related stock surplus m1 6,809 6,676 6,639 5,468 5,511 47 Directly issued capital instruments subject to phase out from Tier 2 Capital u 144 144 143 150 116 48 Tier 2 instruments (and CET1 and AT1 instruments not included in row 5 or 34) issued by subsidiaries and held by
third parties (amount allowed in group Tier 2 Capital) v - - - - - 49 of which: instruments issued by subsidiaries subject to phase out - - - - - 50 General allowances w 187 248 235 231 222 51 Tier 2 Capital before regulatory adjustments 7,140 7,068 7,017 5,849 5,849 (1) "All-in" regulatory capital assumes that all Basel III regulatory adjustments are applied effective January 1, 2013 and that the capital value of instruments which no longer qualify as regulatory capital under Basel III rules
will be phased out at a rate of 10% per year from January 1, 2013 and continuing to January 1, 2022.(2) Row numbering, as per OSFI May 2018 advisory, is provided for consistency and comparability in the disclosure of elements of capital among banks and across jurisdictions. Banks are required to maintain the same
row numbering per OSFI advisory. Where there is no value in a row, institutions should report n.a. or nil and the row number must not change.(3) Cross reference to CC2 - Reconciliation of Regulatory Capital to Balance Sheet (page 5).(4) For regulatory capital purposes only. Not included in consolidated balance sheet.(5) $450MM of capital trust securities that were deconsolidated under IFRS and qualified as Additional Tier 1 Capital were redeemed on December 31, 2018.
April 30, 2019 Supplementary Regulatory Capital Disclosure Page 3

CC1 - COMPOSITION OF REGULATORY CAPITAL (CONTINUED)Cross 2019 2019 2018 2018 2018
($ millions except as noted) reference Q2 Q1 Q4 Q3 Q2
Tier 2 Capital: regulatory adjustments52 Investments in own Tier 2 instruments q1 29 76 71 91 72 53 Reciprocal cross holdings in Tier 2 instruments and Other TLAC-eligible instruments - - - - - 54 Non-significant investments in the capital of banking, financial and insurance entities and Other TLAC-eligible
instruments issued by G-SIBs and Canadian D-SIBs that are outside the scope of regulatory consolidation, where the institution does not own more than 10% of the issued common share capital of the entity (amount above 10% threshold) - - - - -
54a Non-significant investments in the other TLAC-eligible instruments issued by G-SIBs and Canadian D-SIBs, where the institution does not own more than 10% of the issued common share capital of the entity: amount previously designated for the 5% threshold but that no longer meets the conditions - - - - -
55 Significant investments in the capital of banking, financial and insurance entities and Other TLAC-eligible instruments issued by G-SIBs and Canadian D-SIBs that are outside the scope of regulatory consolidation, net of eligible short positions x 50 50 50 50 50
56 Other deductions from Tier 2 capital - - - - - 57 Total regulatory adjustments to Tier 2 Capital 79 126 121 141 122 58 Tier 2 Capital (T2) 7,061 6,942 6,896 5,708 5,727 59 Total Capital (TC = T1 + T2) 46,308 44,789 44,116 41,433 40,941 60 Total Risk-Weighted Assets
60a Common Equity Tier 1 (CET 1) Capital RWA (1) 308,844 296,987 289,237 277,506 273,011 60b Tier 1 Capital RWA (1) 308,844 296,987 289,420 277,681 273,184 60c Total Capital RWA (1) 308,844 296,987 289,604 277,857 273,357
Capital Ratios61 Common Equity Tier 1 (as percentage of risk-weighted assets) 11.3% 11.4% 11.3% 11.4% 11.3%62 Tier 1 (as percentage of risk-weighted assets) 12.7% 12.7% 12.9% 12.9% 12.9%63 Total Capital (as percentage of risk-weighted assets) 15.0% 15.1% 15.2% 14.9% 15.0%64 Buffer (minimum CET1 plus capital conservation buffer plus G-SIB buffer plus D-SIB buffer requirement, expressed
as a percentage of risk-weighted assets) 8.0% 8.0% 8.0% 8.0% 8.0%65 of which: capital conservation buffer 2.5% 2.5% 2.5% 2.5% 2.5%66 of which: bank specific countercyclical buffer 0.0% 0.0% 0.0% 0.0% 0.0%67 of which: G-SIB buffer n.a. n.a. n.a. n.a. n.a.
67a of which: D-SIB buffer 1.0% 1.0% 1.0% 1.0% 1.0%68 Common Equity Tier 1 available to meet buffers (as a percentage of risk weighted assets) 11.3% 11.4% 11.3% 11.4% 11.3%
OSFI target (minimum + capital conservation buffer + D-SIB buffer (if applicable))69 Common Equity Tier 1 target ratio 8.0% 8.0% 8.0% 8.0% 8.0%70 Tier 1 capital target ratio 9.5% 9.5% 9.5% 9.5% 9.5%71 Total capital target ratio 11.5% 11.5% 11.5% 11.5% 11.5%
Amounts below the thresholds for deduction (before risk weighting)72 Non-significant investments in the capital and Other TLAC-eligible instruments of other financial entities y - z 702 759 642 534 575 73 Significant investments in the common stock of financials a1 1,863 1,739 1,660 1,694 1,635 74 Mortgage servicing rights (net of related tax liability) b1 49 50 52 51 49 75 Deferred tax assets arising from temporary differences (net of related tax liability) c1 - d1 1,651 1,558 1,677 1,675 1,597
Applicable caps on the inclusion of provisions in Tier 276 Provisions eligible for inclusion in Tier 2 in respect of exposures subject to standardized approach (prior to
application of cap) 187 213 208 204 204 77 Cap on inclusion of provisions in Tier 2 under standardized approach 187 213 208 204 204 78 Provisions eligible for inclusion in Tier 2 in respect of exposures subject to internal ratings based approach (prior to
application of cap) 1,119 1,286 1,277 1,270 1,255 79 Cap on inclusion of provisions in Tier 2 under internal ratings-based approach - 35 27 27 18
Capital instruments subject to phase-out arrangements (only applicable between 1 Jan 2013 and 1 Jan 2022)
80 Current cap on CET1 instruments subject to phase out arrangements - - - - - 81 Amounts excluded from CET1 due to cap (excess over cap after redemptions and maturities) - - - - - 82 Current cap on AT1 instruments subject to phase out arrangements 1,296 1,296 1,729 1,729 1,729 83 Amounts excluded from AT1 due to cap (excess over cap after redemptions and maturities) - - - - - 84 Current cap on T2 instruments subject to phase out arrangements 1,540 1,540 2,054 2,054 2,054 85 Amounts excluded from T2 due to cap (excess over cap after redemptions and maturities) - - - - - (1) Under OSFI's CAR Guideline, which governs advanced approaches, the Bank calculates a Basel Capital Floor and increases its risk-weighted assets to the extent such floor applies.
Based on these requirements, there was no capital floor applicable for Q2 2018 through Q2 2019.
April 30, 2019 Supplementary Regulatory Capital Disclosure Page 4

CC2 - RECONCILIATION OF REGULATORY CAPITAL TO BALANCE SHEET
LINE
Balance sheet as in Report to
Shareholders
Under regulatory scope of
consolidation (1)
Cross Reference
(2) LINE
Balance sheet as in Report to
Shareholders
Under regulatory scope of
consolidation (1)
Cross Reference
(2)
($ millions) # Q2 2019 Q2 2019 # Q2 2019 Q2 2019
Assets Liabilities and EquityCash and Cash Equivalents 1 35,839 35,790 Total Deposits 38 548,837 548,837 Interest Bearing Deposits with Banks 2 7,518 7,506 Other LiabilitiesSecurities 3 191,226 181,819 Derivative instruments 39 21,549 21,337 Investments in own shares CET1 (if not already netted off paid-in capital on reported balance sheet) 4 6 n Acceptances 40 21,702 21,702 Investments in own Additional Tier 1 instruments not derecognized for accounting purposes 5 6 n1 Securities sold but not yet purchased 41 32,023 32,023 Investments in own Tier 2 instruments not derecognized for accounting purposes 6 29 q1 Non-significant investments in the capital and other TLAC-eligible instruments of other Non-significant investments in the capital and other TLAC-eligible instruments of other financial entities (3) 7 22,918 y financial entities 42 22,216 z Significant investments in deconsolidated subsidiaries and other financial institutions (4) 8 2,126 t+x+a1 Securities lent or sold under repurchase agreement 43 87,039 87,039 Significant investments in capital of other financial institutions reflected in regulatory capital Securitization and structured entities' liabilities 44 25,621 25,621 Amount exceeding the 15% threshold 9 - h1 Current tax liabilities 45 42 42 Significant investment in common stock of financials below threshold 10 518 Deferred tax liabilities (5) 46 73 70 Goodwill embedded in significant investments 11 58 p1 related to goodwill 47 205 fSecurities Borrowed or Purchased Under Resale Agreements 12 110,405 110,405 related to intangibles 48 287 hLoans related to deferred tax assets excluding those arising from temporary differences 49 60 j Residential mortgages 13 120,778 120,778 related to defined-benefit pension fund net assets 50 113 m Consumer installment and other personal 14 64,454 64,454 related to deferred tax assets arising from temporary differences, Credit cards 15 8,467 8,467 excluding those realizable through net operating loss carryback 51 155 d1 Business and governments 16 221,253 221,040 Other 52 37,236 26,454 Allowance for credit losses 17 (1,710) (1,710) of which: liabilities of subsidiaries, other than deposits 53 - Allowance reflected in Tier 2 regulatory capital 18 187 w Less: amount (of liabilities of subsidiaries) phased out 54 - Shortfall of provisions to expected loss 19 267 k1 Liabilities of subsidiaries after phase out 55 - vTotal net loans and acceptances 20 413,242 413,029 Total other liabilities 56 225,285 214,288 Other Assets Subordinated Debt Derivative instruments 21 20,627 20,625 Subordinated debt 57 6,953 6,953 Customers' liability under acceptances 22 21,702 21,702 Qualifying subordinated debt 58 6,809 m1 Premises and equipment 23 1,983 1,842 Non qualifying subordinated debt 59 144 Goodwill 24 6,500 6,500 e of which redemption has been announced (in the last month of the quarter) 60 - Intangible assets 25 2,331 2,331 g Less: regulatory amortization 61 - Current tax assets 26 1,309 1,266 Non qualifying subordinated debt subject to phase out 62 144 Deferred tax assets (5) 27 1,765 1,765 Less: amount phased out 63 -
Deferred tax assets excluding those arising from temporary differences 28 706 i Non qualifying subordinated debt after phase out 64 144 uDeferred tax assets arising from temporary differences 29 1,806 c1 Equity
of which Deferred tax assets arising from temporary differences below the threshold 30 1,806 Preferred shares 65 4,690 4,690 of which amount exceeding 15% threshold 31 - i1 Directly issued qualifying Additional Tier 1 instruments 66 4,400 o1
Other 32 16,023 14,893 Non-qualifying preferred shares for accounting purposes 67 - Defined-benefit pension fund net assets 33 543 l Non-qualifying preferred shares subject to phase out 68 290 Mortgage servicing rights 34 49 Less amount (of preferred shares) phased out 69 -
of which Mortgage servicing rights under the threshold 35 49 b1 Non qualifying preferred shares after phase out 70 290 p of which amount exceeding the 15% threshold 36 - j1 Common shares 71 12,939 12,939
Total Assets 37 830,470 819,473 Directly issued qualifying CET1 72 12,939 a(1) Balance sheet under regulatory scope does not include the following entities: BMO Life Insurance Company and BMO Reinsurance Limited. Contributed surplus 73 307 307 b BMO Life Insurance Company ($10,573 million assets and nominal equity) covers the development and marketing of individual and group life, accident and health Retained earnings 74 27,405 27,405 c insurance and annuity products in Canada. BMO Reinsurance Limited ($424 million assets and nominal equity) covers the reinsurance of life, health and disability insurance Accumulated other comprehensive income 75 4,054 4,054 d risks as well as property & casualty insurance risks, including catastrophe risks. The business reinsured is written by insurers and reinsurers principally in of which: Cash flow hedges 76 202 k North America and Europe. Other AOCI 77 3,852 (2) Cross reference to CC1 - Composition of Regulatory Capital (pages 3 and 4). Total shareholders' equity 78 49,395 49,395 (3) Includes synthetic holdings of non-significant capital investments in banking, financial and insurance entities. Total Liabilities and Equity 79 830,470 819,473 (4) Under Basel III, significant investments in financial services entities that are outside the scope of regulatory consolidation are deducted from the Bank's capital using the corresponding deduction approach (e.g. investments in non-common Tier 1 are deducted from the Bank's non-common Tier 1 capital) except that investments in common equity capital of a significant investment which represents less than 10% of the Bank's CET1 are risk weighted at 250% and are not deducted provided the sum of such investments, deferred tax assets related to timing differences and mortgage servicing rights are less than 15% of the Bank's CET1. Goodwill embedded in significant investments is separated and is shown in the corresponding line below.(5) Deferred tax assets and liabilities are presented on the balance sheet net by legal jurisdiction.
April 30, 2019 Supplementary Regulatory Capital Disclosure Page 5

FLOW STATEMENT OF BASEL III REGULATORY CAPITAL LINE 2019 2019 2018 2018 2018
($ millions) # Q2 Q1 Q4 Q3 Q2
Common Equity Tier 1 CapitalOpening Balance 1 33,726 32,721 31,688 30,793 30,165
New capital issues 2 25 5 26 18 7 Redeemed capital 3 - (90) (107) (102) (488)
Gross dividends (deduction) 4 (687) (691) (657) (664) (642)
Profit for the quarter (attributable to shareholders of the parent company) 5 1,497 1,510 1,695 1,536 1,246 Removal of own credit spread (net of tax) 6 110 (82) 13 (28) (48) Movements in other comprehensive income
– Currency translation differences 7 453 (12) 241 102 878 – Fair value through other comprehensive income securities 8 31 173 (71) 9 (128) – Other (1) 9 (100) (69) (60) 230 69
Goodwill and other intangible assets (deduction, net of related tax liability) 10 (128) (8) (155) (37) (262) Other, including regulatory adjustments and transitional arrangements
– Deferred tax assets that rely on future profitability (excluding those arising from temporary differences) 11 139 122 (65) 4 35 – Prudential valuation adjustments 12 (7) 47 (55) (3) (34) – Other (2) (3) 13 (283) 100 228 (170) (5)
Closing Balance 14 34,776 33,726 32,721 31,688 30,793
Other non-core Tier 1 (Additional Tier 1) Capital Opening Balance 15 4,121 4,499 4,037 4,421 4,438
New non-core tier 1 (Additional Tier 1) eligible capital issues 16 350 - 400 - - Redeemed capital 17 - (450) - (300) - Other, including regulatory adjustments and transitional arrangements (4) 18 - 72 62 (84) (17)
Closing Balance 19 4,471 4,121 4,499 4,037 4,421 Total Tier 1 Capital 20 39,247 37,847 37,220 35,725 35,214
Tier 2 CapitalOpening Balance 21 6,942 6,896 5,708 5,727 6,607
New Tier 2 eligible capital issues 22 - - 1,119 - - Redeemed capital 23 - - - - (900) Amortization adjustments 24 - - - - - Other, including regulatory adjustments and transitional arrangements (5) 25 119 46 69 (19) 20
Closing Balance 26 7,061 6,942 6,896 5,708 5,727 Total Regulatory Capital 27 46,308 44,789 44,116 41,433 40,941 (1) Includes: AOCI on pension and other post-employment benefits and on own credit risk financial liabilities designated at fair value.(2) Includes: Capital deductions for expected loss in excess of allowances, defined benefit pension assets (net of related deferred tax liability), investment in own shares, changes in contributed surplus and threshold deductions.(3) Includes: Impact to net income resulting from IFRS 15 retrospective adoption.(4) Includes: Changes in non-qualifying capital instruments. (5) Includes: Changes in non-qualifying capital instruments and eligible allowances.
CAPITAL RATIOS FOR SIGNIFICANT BANK SUBSIDIARIES 2019 2019 2018 2018 2018 Q2 Q1 Q4 Q3 Q2
Bank of Montreal Mortgage Corporation - All-in Basis - Basel III (1)Common Equity Tier 1 ratio 28 23.6% 22.0% 21.6% 21.8% 23.5%Tier 1 ratio 29 23.6% 22.0% 21.6% 21.8% 23.5%Total capital ratio 30 24.0% 22.4% 22.1% 22.3% 24.1%
BMO Harris Bank N.A. - Basel III (2)Tier 1 ratio 31 11.7% 12.0% 12.5% 12.5% 12.8%Total capital ratio 32 12.9% 13.1% 13.7% 13.7% 14.0%
(1) All-in capital ratios assume that all Basel III regulatory adjustments are applied effective January 1, 2013 and that the capital value of instruments which no longer qualify as regulatory capital under Basel III rules will be phased out at a rate of 10% per year from January 1, 2013, continuing to January 1, 2022.
(2) Calculated using U.S. Basel III guidelines currently in effect for U.S. regulatory purposes and based on BMO Harris N.A.'s calendar quarter ends: March 2019, December 2018, September 2018, June 2018, and March 2018.
April 30, 2019 Supplementary Regulatory Capital Disclosure Page 6
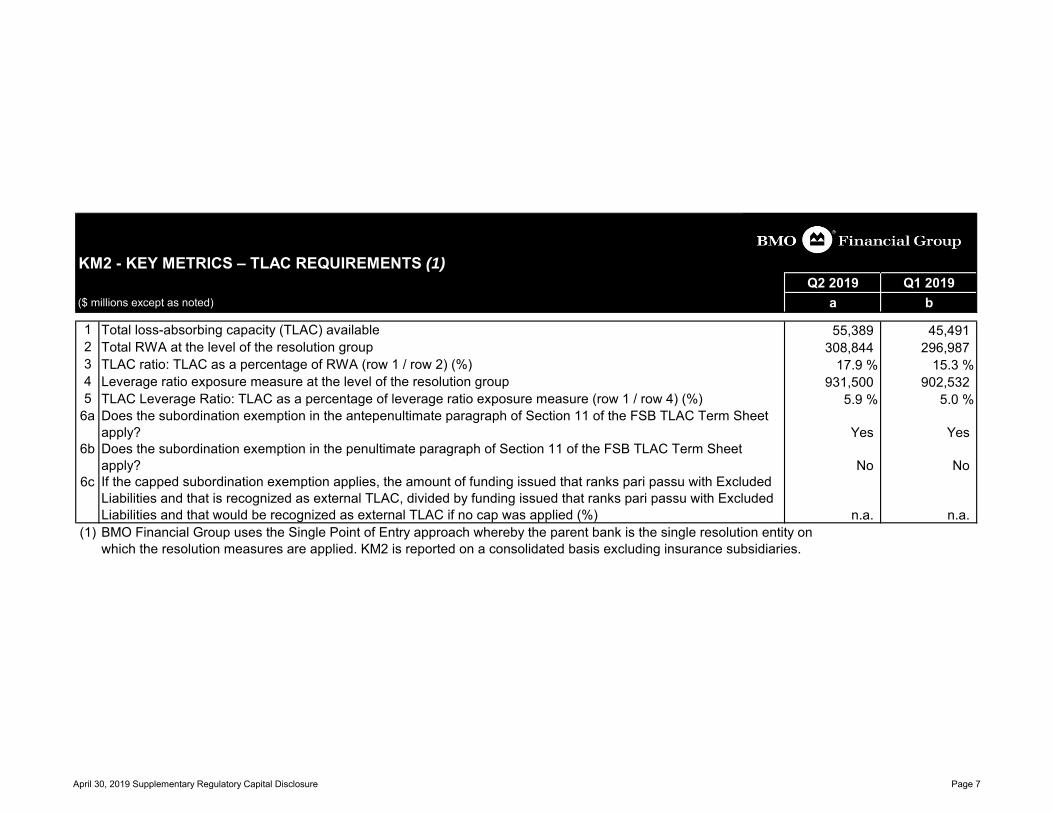
KM2 - KEY METRICS – TLAC REQUIREMENTS (1)Q2 2019 Q1 2019
($ millions except as noted) a b
1 Total loss-absorbing capacity (TLAC) available 55,389 45,4912 Total RWA at the level of the resolution group 308,844 296,9873 TLAC ratio: TLAC as a percentage of RWA (row 1 / row 2) (%) 17.9 % 15.3 %4 Leverage ratio exposure measure at the level of the resolution group 931,500 902,5325 TLAC Leverage Ratio: TLAC as a percentage of leverage ratio exposure measure (row 1 / row 4) (%) 5.9 % 5.0 %
6a Does the subordination exemption in the antepenultimate paragraph of Section 11 of the FSB TLAC Term Sheet apply? Yes Yes
6b Does the subordination exemption in the penultimate paragraph of Section 11 of the FSB TLAC Term Sheet apply? No No
6c If the capped subordination exemption applies, the amount of funding issued that ranks pari passu with Excluded Liabilities and that is recognized as external TLAC, divided by funding issued that ranks pari passu with Excluded Liabilities and that would be recognized as external TLAC if no cap was applied (%) n.a. n.a.
(1) BMO Financial Group uses the Single Point of Entry approach whereby the parent bank is the single resolution entity onwhich the resolution measures are applied. KM2 is reported on a consolidated basis excluding insurance subsidiaries.
April 30, 2019 Supplementary Regulatory Capital Disclosure Page 7

TLAC1 - TLAC COMPOSITION (1) Q2 2019 Q1 2019
($ millions except as noted) a b
Regulatory capital elements of TLAC and adjustments1 Common Equity Tier 1 capital (CET1) 34,776 33,7262 Additional Tier 1 capital (AT1) before TLAC adjustments 4,471 4,1213 AT1 ineligible as TLAC as issued out of subsidiaries to third parties - -4 Other adjustments - -5 AT1 instruments eligible under the TLAC framework 4,471 4,1216 Tier 2 capital (T2) before TLAC adjustments 7,061 6,9427 Amortized portion of T2 instruments where remaining maturity > 1 year - -8 T2 capital ineligible as TLAC as issued out of subsidiaries to third parties - -9 Other adjustments - -10 T2 instruments eligible under the TLAC framework 7,061 6,94211 TLAC arising from regulatory capital 46,308 44,789Non-regulatory capital elements of TLAC12 External TLAC instruments issued directly by the Bank and subordinated to excluded liabilities - -13 External TLAC instruments issued directly by the Bank which are not subordinated to excluded liabilities but
meet all other TLAC term sheet requirements 9,164 70614 Of which: amount eligible as TLAC after application of the caps - -15 External TLAC instruments issued by funding vehicles prior to January 1, 2022 - -16 Eligible ex ante commitments to recapitalize a G-SIB in resolution - -17 TLAC arising from non-regulatory capital instruments before adjustments 9,164 706Non-regulatory capital elements of TLAC: adjustments18 TLAC before deductions 55,472 45,49519 Deductions of exposures between MPE resolution groups that correspond to items eligible for TLAC (not
applicable to SPE G-SIBs and D-SIBs) - -20 Deduction of investments in own other TLAC liabilities (83) (4)21 Other adjustments to TLAC - -22 TLAC available after deductions 55,389 45,491Risk-weighted assets and leverage exposure measure for TLAC purposes23 Total risk-weighted assets adjusted as permitted under the TLAC regime 308,844 296,98724 Leverage exposure measure 931,500 902,532TLAC ratios and buffers25 TLAC Ratio (as a percentage of risk-weighted assets adjusted as permitted under the TLAC regime) 17.9 % 15.3 %26 TLAC Leverage Ratio (as a percentage of leverage exposure) 5.9 % 5.0 %27 CET1 (as a percentage of risk-weighted assets) available after meeting the resolution group’s minimum capital
and TLAC requirements (2) n.a. n.a.28 Institution-specific buffer (capital conservation buffer plus countercyclical buffer plus higher loss absorbency,
expressed as a percentage of risk-weighted assets) 3.5 % 3.5 %29 Of which: capital conservation buffer 2.5 % 2.5 %30 Of which: bank specific countercyclical buffer 0.0 % 0.0 %31 Of which: D-SIB / G-SIB buffer 1.0 % 1.0 %(1) BMO Financial Group uses the Single Point of Entry approach whereby the parent bank is the single resolution entity on which the
resolution measures are applied. TLAC1 is reported on a consolidated basis excluding insurance subsidiaries. (2) Completion of this row is not required by OSFI at this time.
April 30, 2019 Supplementary Regulatory Capital Disclosure Page 8

Q2 2019TLAC3 - RESOLUTION ENTITY - CREDITOR RANKING AT Creditor rankingLEGAL ENTITY LEVEL (1) 1 2 3 4 5 Sum($ millions) (most junior) (most senior) 1 to 5
1 Description of creditor ranking Common shares Preferred shares Subordinated debt Bail-in debt (2) Other liabilities (3)2 Total capital and liabilities net of credit risk mitigation 12,939 4,690 7,062 9,145 - 33,8363 Subset of row 2 that are excluded liabilities 4 6 29 83 - 1224 Total capital and liabilities less excluded liabilities (row 2 minus row 3) 12,935 4,684 7,033 9,062 - 33,7145 Subset of row 4 that are potentially eligible as TLAC 12,935 4,684 7,033 9,062 - 33,7146 Subset of row 5 with 1 year ≤ residual maturity < 2 years - - - 1,147 - 1,1477 Subset of row 5 with 2 years ≤ residual maturity < 5 years - - - 7,645 - 7,6458 Subset of row 5 with 5 years ≤ residual maturity < 10 years - - 5,270 44 - 5,3149 Subset of row 5 with residual maturity ≥ 10 years, but excluding perpetual securities - - 1,763 226 - 1,989
10 Subset of row 5 that is perpetual securities 12,935 4,684 - - - 17,619(1) Instruments are reported at nominal values.(2) Under the Bail-in Regime, Bail-in Debt which would ordinarily rank equally to Other Liabilities in liquidation, is subject to conversion under statutory resolution powers whereas Other Liabilities are not subject
to such conversion.(3) Completion of this column is not required by OSFI at this time.
April 30, 2019 Supplementary Regulatory Capital Disclosure Page 9

LR1 - SUMMARY COMPARISON OF ACCOUNTING ASSETS VS. LEVERAGE RATIO EXPOSURE MEASURE (1)2019 2019 2018 2018 2018
($ millions) Q2 Q1 Q4 Q3 Q2
1 Total consolidated assets as per published financial statements 830,470 806,597 774,048 765,318 743,569 2 Adjustment for investments in banking, financial, insurance or commercial entities that are consolidated for accounting purposes but outside the scope of regulatory consolidation (10,966) (10,552) (9,757) (9,480) (9,175) 3 Adjustment for securitized exposures that meet the operational requirements for the recognition of risk transference (2) (8,159) (6,543) - - - 4 Adjustment for fiduciary assets recognized on the balance sheet pursuant to the operative accounting framework but excluded from the leverage ratio exposure measure - - - - - 5 Adjustments for derivative financial instruments 11,836 9,880 3,761 1,506 1,775 6 Adjustment for securities financing transactions (i.e. repo assets and similar secured lending) 2,137 1,058 8,347 3,069 2,930 7 Adjustment for off-balance sheet items (i.e. credit equivalent amounts of off-balance sheet exposures) 116,512 111,665 108,817 102,792 101,147 8 Other adjustments (10,330) (9,573) (9,110) (9,320) (9,152) 9 Leverage Ratio Exposure Measure 931,500 902,532 876,106 853,885 831,094
LR2 - LEVERAGE RATIO COMMON DISCLOSURE (1)2019 2019 2018 2018 2018
($ millions except as noted) Q2 Q1 Q4 Q3 Q2
On-balance sheet exposures1 On-balance sheet items (excluding derivatives, SFTs and grandfathered securitization exposures but including collateral) 680,314 667,174 653,039 629,354 613,128 2 Gross up for derivatives collateral provided where deducted from the balance sheet assets pursuant to the operative accounting framework - - - - - 3 (Deductions of receivables assets for cash variation margin provided in derivative transactions) (4,152) (3,042) (2,624) (3,050) (2,436) 4 (Asset amounts deducted in determining transitional Tier 1 capital) (10,330) (9,573) (9,110) (9,320) (9,152) 5 Total on-balance sheet exposures (excluding derivatives and SFTs) (sum of lines 1 to 4) 665,832 654,559 641,305 616,984 601,540
Derivative exposures6 Replacement cost associated with all derivative transactions (3) 14,792 14,224 6,515 6,169 7,332 7 Add-on amounts for potential future exposure associated with all derivative transactions (4) 24,369 22,674 27,114 23,943 24,214 8 (Exempted central counterparty-leg of client cleared trade exposures) (2,557) (2,347) (1,044) (751) (751) 9 Adjusted effective notional amount of written credit derivatives 5,038 1,921 1,200 142 123
10 (Adjusted effective notional offsets and add-on deductions for written credit derivatives) (5,028) (1,921) (1,200) (142) (123) 11 Total derivative exposures (sum of lines 6 to 10) 36,614 34,551 32,585 29,361 30,795 Securities financing transaction exposures12 Gross SFT assets recognized for accounting purposes (with no recognition of netting), after adjusting for sale accounting transactions 111,825 101,314 95,159 103,311 95,313 13 (Netted amounts of cash payables and cash receivables of gross SFT assets) (5,661) (5,107) (7,675) (3,591) (3,636) 14 Counterparty credit risk (CCR) exposure for SFTs 6,378 5,550 5,914 5,028 5,935 15 Agent transaction exposures - - - - - 16 Total securities financing transaction exposures (sum of lines 12 to 15) 112,542 101,757 93,398 104,748 97,612 Other off-balance sheet exposures17 Off-balance sheet exposure at gross notional amount 363,391 353,732 343,144 326,819 322,633 18 (Adjustments for conversion to credit equivalent amounts) (246,879) (242,067) (234,326) (224,027) (221,486) 19 Off-balance sheet items (sum of lines 17 and 18) 116,512 111,665 108,818 102,792 101,147 Capital and Total Exposures20 Tier 1 capital 39,247 37,847 37,220 35,725 35,214 21 Total Exposures (sum of lines 5, 11, 16 and 19) 931,500 902,532 876,106 853,885 831,094 Leverage Ratios22 Basel III leverage ratio 4.2% 4.2% 4.2% 4.2% 4.2%(1) Q2 2019 and Q1 2019 results are disclosed in accordance with OSFI's new Leverage Ratio Disclosure Requirements guideline. (2) Represents the reduction of the leverage ratio exposure measure due to the exclusion of securitized exposures that meet the operational requirement for the recognition of risk transference.(3) Effective Q1 2019, represents replacement cost after applying alpha equal to 1.4.(4) Effective Q1 2019, represents potential future exposure after applying alpha equal to 1.4.
Leverage ratio framework
April 30, 2019 Supplementary Regulatory Capital Disclosure Page 10

OV1 - OVERVIEW OF RWA (1) (2) Minimum capital requirements
Q2 2019 Q1 2019 Q4 2018 Q2 2019($ millions) a b c d
1 Credit risk (excluding counterparty credit risk (CCR)) 231,966 219,367 215,193 18,5572 Of which standardized approach (SA) 42,281 40,403 39,288 3,3823 Of which internal rating-based (IRB) approach 189,685 178,964 175,905 15,1754 Counterparty credit risk 15,861 15,278 13,481 1,2695 Of which standardized approach for counterparty credit risk (SA-CCR) (4) 6,827 6,227 4,746 5466 Of which internal model method (IMM) - - - -6a Of which comprehensive approach for credit risk mitigation (for SFTs) 2,877 2,594 3,171 2306b Of which CVA capital charge 5,622 5,889 4,900 4506c Of which exposures to QCCP 535 568 664 437 Equity positions in banking book under market-based approach - - - -8 Equity investments in funds – look-through approach 77 89 87 69 Equity investments in funds – mandate-based approach 909 831 731 7310 Equity investments in funds – fall-back approach 139 161 118 1111 Settlement risk 3 - 15 -12 Securitization exposures in banking book 2,770 2,448 2,404 222
12a Of which subject to the transitional arrangement (5) (1,304) (1,304) - (104)13 Of which securitization internal ratings-based approach (SEC-IRBA) (6) 3,136 3,192 1,860 25114 Of which securitization external ratings-based approach (SEC-ERBA), including internal
assessment approach (IAA) (7) 221 226 544 1815 Of which securitization standardized approach (SEC-SA) 717 334 - 5716 Market risk 12,332 14,820 13,532 98617 Of which standardized approach (SA) (8) 251 211 258 2018 Of which internal model approaches (IMM) 12,081 14,609 13,274 96619 Operational risk 35,877 35,624 35,205 2,87020 Of which Basic Indicator Approach 51 50 49 421 Of which Standardized Approach 2,058 2,032 2,019 16522 Of which Advanced Measurement Approach 33,768 33,542 33,137 2,70123 Amounts below the thresholds for deduction (subject to 250% risk weight) 8,910 8,369 8,471 71324 Floor adjustment (9) - - - -25 Total 308,844 296,987 289,237 24,707(1) RWA was $308.8 billion at April 30, 2019, up from $297.0 billion at January 31, 2019, and $289.2 billion at October 31, 2018, driven by strong business growth and the impact of foreign exchange movements. (2) On October 30, 2018, OSFI released the final version of the CAR Guideline for implementation in Q1 2019. The main revisions relate to the domestic implementation of the standardized approach to counterparty
credit risk (SA-CCR), capital requirements for bank exposures to central counterparties (CCPs) and the securitization framework. The Guideline has been implemented prospectively effective Q1 2019.(3) The scaling factor is applied to the risk-weighted asset amounts as applicable.(4) Q2 2019 and Q1 2019 reflect RWA calculated under SA-CCR while Q4 2018 reflects CEM. (5) OSFI has provided grandfathering of the revised securitization capital treatment for one year through a negative adjustment to risk-weighted assets that effectively eliminates the initial increase in risk weights.(6) Q4 2018 reflects SFA.(7) Q4 2018 reflects RBA.(8) Standardized approach market risk RWA reflects specific interest rate risk on securitization positions.(9) Under OSFI's CAR Guideline, which governs advanced approaches, the Bank calculates a Capital Floor and may be required to increase its risk-weighted assets if the Capital Floor applies. Based on these
requirements, there was no capital floor applicable for Q2 2019, Q1 2019 and Q4 2018.
COMMON EQUITY TIER 1 (CET 1) CAPITAL RISK-WEIGHTED ASSETS BY OPERATING GROUPSLINE 2019 2019 2018 2018 2018
($ millions) # Q2 Q1 Q4 Q3 Q2
Personal and Commercial Banking 1 187,792 179,421 178,313 173,039 170,545 Wealth Management 2 20,381 19,239 19,069 18,560 17,538 BMO Capital Markets 3 89,790 87,246 80,606 74,663 73,875
4 10,881 11,081 11,249 11,244 11,053 Total Common Equity Tier 1 Capital Risk-Weighted Assets 5 308,844 296,987 289,237 277,506 273,011
RWA (3)
Corporate Services, including Technology and Operations
April 30, 2019 Supplementary Regulatory Capital Disclosure Page 11
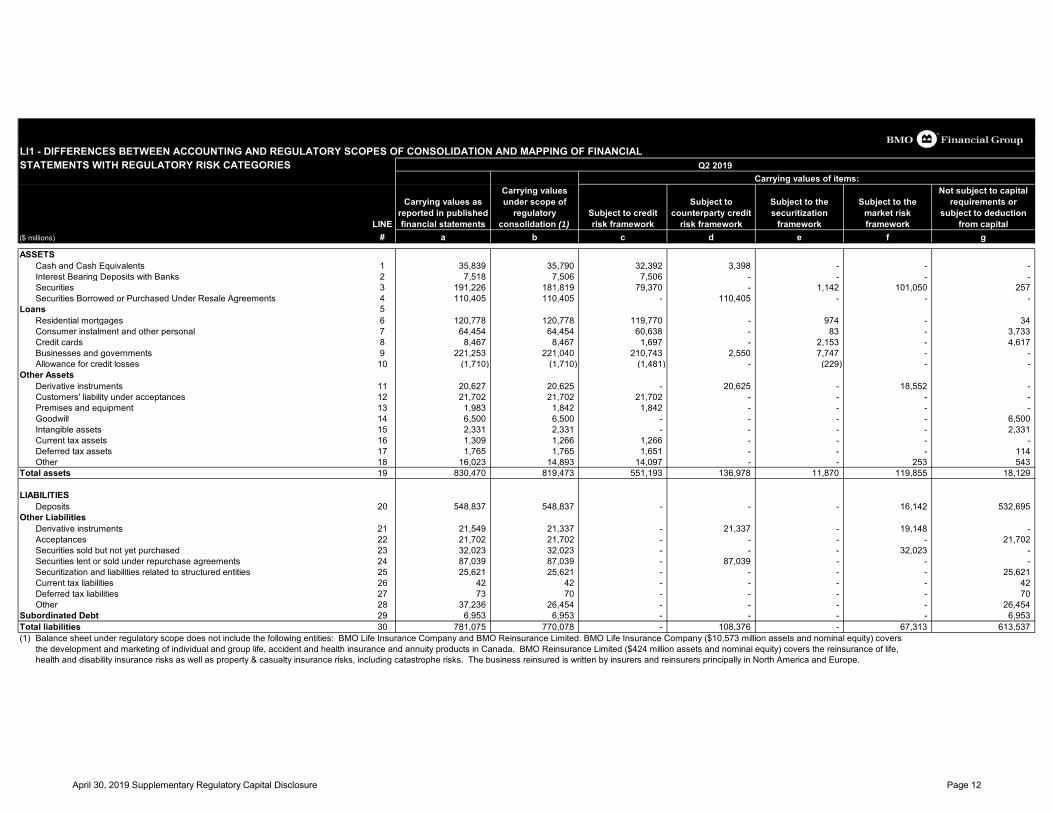
LI1 - DIFFERENCES BETWEEN ACCOUNTING AND REGULATORY SCOPES OF CONSOLIDATION AND MAPPING OF FINANCIALSTATEMENTS WITH REGULATORY RISK CATEGORIES
LINE
Carrying values as reported in published financial statements
Carrying values under scope of
regulatory consolidation (1)
Subject to credit risk framework
Subject to counterparty credit
risk framework
Subject to the securitization
framework
Subject to the market risk framework
Not subject to capital requirements or
subject to deduction from capital
($ millions) # a b c d e f g
ASSETSCash and Cash Equivalents 1 35,839 35,790 32,392 3,398 - - -Interest Bearing Deposits with Banks 2 7,518 7,506 7,506 - - - -Securities 3 191,226 181,819 79,370 - 1,142 101,050 257Securities Borrowed or Purchased Under Resale Agreements 4 110,405 110,405 - 110,405 - - -
Loans 5Residential mortgages 6 120,778 120,778 119,770 - 974 - 34Consumer instalment and other personal 7 64,454 64,454 60,638 - 83 - 3,733Credit cards 8 8,467 8,467 1,697 - 2,153 - 4,617Businesses and governments 9 221,253 221,040 210,743 2,550 7,747 - -Allowance for credit losses 10 (1,710) (1,710) (1,481) - (229) - -
Other AssetsDerivative instruments 11 20,627 20,625 - 20,625 - 18,552 -Customers' liability under acceptances 12 21,702 21,702 21,702 - - - -Premises and equipment 13 1,983 1,842 1,842 - - - -Goodwill 14 6,500 6,500 - - - - 6,500Intangible assets 15 2,331 2,331 - - - - 2,331Current tax assets 16 1,309 1,266 1,266 - - - -Deferred tax assets 17 1,765 1,765 1,651 - - - 114Other 18 16,023 14,893 14,097 - - 253 543
Total assets 19 830,470 819,473 551,193 136,978 11,870 119,855 18,129
LIABILITIESDeposits 20 548,837 548,837 - - - 16,142 532,695
Other LiabilitiesDerivative instruments 21 21,549 21,337 - 21,337 - 19,148 -Acceptances 22 21,702 21,702 - - - - 21,702Securities sold but not yet purchased 23 32,023 32,023 - - - 32,023 -Securities lent or sold under repurchase agreements 24 87,039 87,039 - 87,039 - - -Securitization and liabilities related to structured entities 25 25,621 25,621 - - - - 25,621Current tax liabilities 26 42 42 - - - - 42Deferred tax liabilities 27 73 70 - - - - 70Other 28 37,236 26,454 - - - - 26,454
Subordinated Debt 29 6,953 6,953 - - - - 6,953Total liabilities 30 781,075 770,078 - 108,376 - 67,313 613,537(1) Balance sheet under regulatory scope does not include the following entities: BMO Life Insurance Company and BMO Reinsurance Limited. BMO Life Insurance Company ($10,573 million assets and nominal equity) covers
the development and marketing of individual and group life, accident and health insurance and annuity products in Canada. BMO Reinsurance Limited ($424 million assets and nominal equity) covers the reinsurance of life,health and disability insurance risks as well as property & casualty insurance risks, including catastrophe risks. The business reinsured is written by insurers and reinsurers principally in North America and Europe.
Q2 2019Carrying values of items:
April 30, 2019 Supplementary Regulatory Capital Disclosure Page 12

LI2 - MAIN SOURCES OF DIFFERENCES BETWEEN REGULATORY EXPOSURE AMOUNTS AND CARRYING VALUES IN FINANCIAL STATEMENTS
TotalCredit risk framework
Counterparty credit risk framework
Securitization framework
Market risk framework
($ millions) a b c d e
1 Asset carrying value amount under scope of regulatory consolidation (as per template LI1) (1) 801,344 551,193 136,978 11,870 119,8552 Liabilities carrying value amount under regulatory scope of consolidation (as per template LI1) (1) 156,541 - 108,376 - 67,3133 Total net amount under regulatory scope of consolidation 644,803 551,193 28,602 11,870 52,5424 Off-balance sheet amounts 230,427 173,155 43,786 13,486 -5 Differences due to different netting rules, other than those already included in row 2 20,557 - 20,557 - -6 Differences due to consideration of provisions 1,930 1,701 - 229 -7 Exposures related to liability repo-style transactions 174,079 - 174,079 - -8 Potential future exposure on derivatives 16,758 - 16,758 - -9 Differences due to consideration of CRM (223,662) (62) (222,955) (645) -10 Exposure amounts considered for regulatory purposes (2) 864,892 725,987 60,827 24,940 52,542(1) Carrying value under scope of regulatory consolidation (column b from LI1) less amounts not subject to capital requirements or subject to deduction from capital (column g from LI1).(2) Exposure amounts considered for regulatory purposes represent the exposure at default amounts post-CRM and post-CCF, with the exception of the Market Risk framework that is reported at
accounting carrying value.
Explanations of differences between accounting and regulatory exposure amounts
The table above illustrates the main sources of differences between the financial statements’ carrying value amounts and the exposure at default post-CRM and post-CCF used for regulatory purposes.
Off-balance sheet amounts include credit exposures on committed undrawn amounts of loans and other off-balance sheet arrangements, other than derivatives, such as undrawn commitments related to Standby Letters of Credit and Documentary Credits.
Differences due to different netting rules relate to the grossing up of derivatives to reflect legally enforceable bilateral netting arrangements recognized for regulatory capital purposes.
Differences due to consideration of provisions relate to the re-inclusion of general and specific provisions in the carrying amount of exposures in the AIRB approach.
Exposures related to liability repo-style transactions relate to the grossing up of liability repo-style transactions.
Potential future exposure consists of the add-on factors for the expected volatility of the price, rate or index underlying derivative instruments. Differences due to consideration of CRM consist of the application of credit risk mitigation techniques to arrive at the net exposure at default in accordance with OSFI’s CAR Guideline, Chapter 5, Credit Risk Mitigation.
Q2 2019Items subject to:
April 30, 2019 Supplementary Regulatory Capital Disclosure Page 13

CR1 - CREDIT QUALITY OF ASSETS (1)
LINEDefaulted exposures
(2) (3)Non-defaulted
exposuresAllowances / impairments
Net values(a + b - c)
($ millions) # a b c d
Loans 1 2,515 412,035 1,481 413,069Debt securities 2 - 74,925 4 74,921Off-balance sheet exposures 3 319 167,423 243 167,499Total 4 2,834 654,383 1,728 655,489
CR1 - CREDIT QUALITY OF ASSETS (1)
LINEDefaulted exposures
(2) (3)Non-defaulted
exposuresAllowances / impairments
Net values(a + b - c)
($ millions) # a b c d
Loans 1 2,188 396,941 1,416 397,713Debt securities 2 - 72,682 3 72,679Off-balance sheet exposures 3 331 162,957 248 163,040Total 4 2,519 632,580 1,667 633,432
CR1 - CREDIT QUALITY OF ASSETS (1)
LINEDefaulted exposures
(2) (3)Non-defaulted
exposuresAllowances / impairments
Net values(a + b - c)
($ millions) # a b c d
Loans 1 2,038 383,712 1,465 384,285Debt securities 2 - 67,599 2 67,597Off-balance sheet exposures 3 241 154,558 229 154,570Total 4 2,279 605,869 1,696 606,452(1) Excludes positions subject to counterparty credit risk and securitization regulatory frameworks.(2) Exposures are considered to be in default when they are 90 days past due with the following exceptions: (i) credit card loans which are immediately
written off when principal or interest payments are 180 days past due; and (ii) residential mortgages guaranteed by the Government of Canada that are less than one year past due.
(3) There are no defaulted debt securities.
Gross carrying values of
Q1 2019Gross carrying values of
Q2 2019Gross carrying values of
Q4 2018
April 30, 2019 Supplementary Regulatory Capital Disclosure Page 14

CR2 - CHANGES IN STOCK OF DEFAULTED LOANS AND DEBT SECURITIES (1) (2) Q2 2019($ millions) a
1 Defaulted loans and debt securities at end of the previous financial reporting period 2,1882 Loans and debt securities that have defaulted since the last reporting period 6963 Returned to non-defaulted status (131)4 Amounts written off (111)5 Other charges (127)6 Defaulted loans and debt securities at end of the reporting period 2,515
CR2 - CHANGES IN STOCK OF DEFAULTED LOANS AND DEBT SECURITIES (1) (2) Q1 2019($ millions) a
1 Defaulted loans and debt securities at end of the previous financial reporting period 2,0382 Loans and debt securities that have defaulted since the last reporting period 4323 Returned to non-defaulted status (129)4 Amounts written off (119)5 Other charges (34)6 Defaulted loans and debt securities at end of the reporting period 2,188
CR2 - CHANGES IN STOCK OF DEFAULTED LOANS AND DEBT SECURITIES (1) (2) Q4 2018($ millions) a
1 Defaulted loans and debt securities at end of the previous financial reporting period 2,1692 Loans and debt securities that have defaulted since the last reporting period 4173 Returned to non-defaulted status (174)4 Amounts written off (191)5 Other charges (183)6 Defaulted loans and debt securities at end of the reporting period 2,038
(1) There are no defaulted debt securities.(2) Defaulted balances exclude off-balance sheet exposures.
April 30, 2019 Supplementary Regulatory Capital Disclosure Page 15
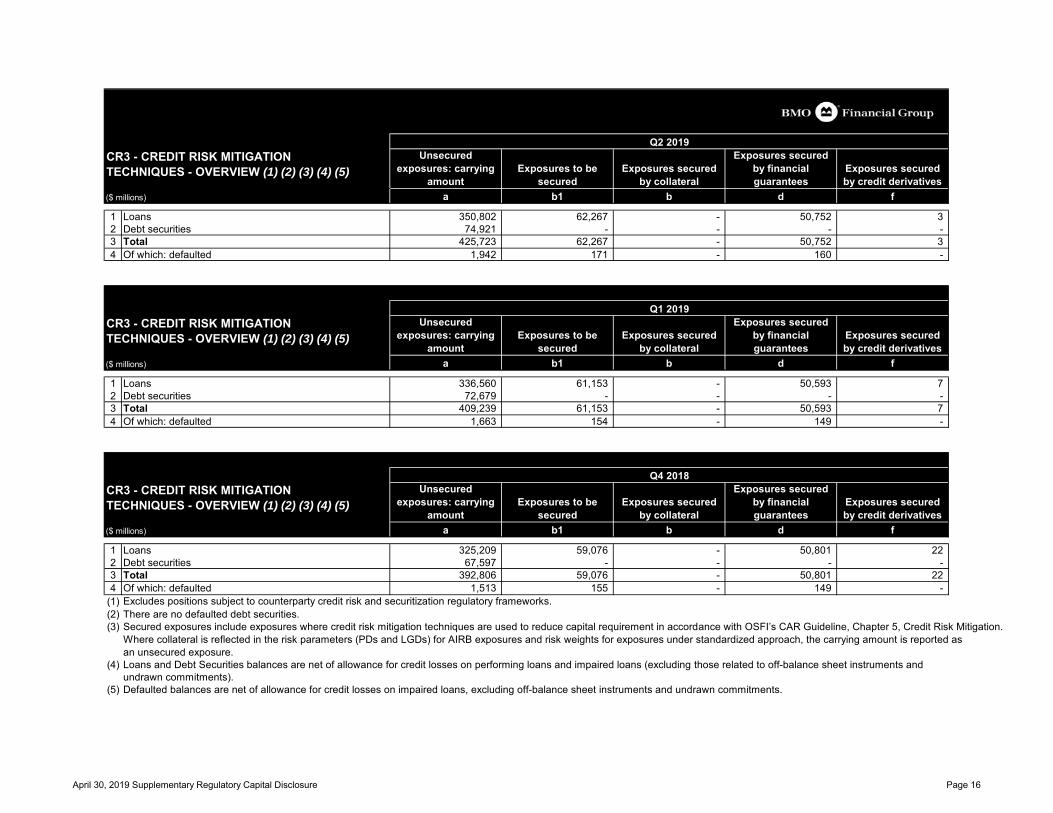
Unsecured exposures: carrying
amount Exposures to be
securedExposures secured
by collateral
Exposures secured by financial guarantees
Exposures secured by credit derivatives
($ millions) a b1 b d f
1 Loans 350,802 62,267 - 50,752 32 Debt securities 74,921 - - - -3 Total 425,723 62,267 - 50,752 34 Of which: defaulted 1,942 171 - 160 -
Unsecured exposures: carrying
amount Exposures to be
securedExposures secured
by collateral
Exposures secured by financial guarantees
Exposures secured by credit derivatives
($ millions) a b1 b d f
1 Loans 336,560 61,153 - 50,593 72 Debt securities 72,679 - - - -3 Total 409,239 61,153 - 50,593 74 Of which: defaulted 1,663 154 - 149 -
Unsecured exposures: carrying
amount Exposures to be
securedExposures secured
by collateral
Exposures secured by financial guarantees
Exposures secured by credit derivatives
($ millions) a b1 b d f
1 Loans 325,209 59,076 - 50,801 222 Debt securities 67,597 - - - -3 Total 392,806 59,076 - 50,801 224 Of which: defaulted 1,513 155 - 149 -
(1) Excludes positions subject to counterparty credit risk and securitization regulatory frameworks.(2) There are no defaulted debt securities.(3) Secured exposures include exposures where credit risk mitigation techniques are used to reduce capital requirement in accordance with OSFI’s CAR Guideline, Chapter 5, Credit Risk Mitigation.
Where collateral is reflected in the risk parameters (PDs and LGDs) for AIRB exposures and risk weights for exposures under standardized approach, the carrying amount is reported as an unsecured exposure.
(4) Loans and Debt Securities balances are net of allowance for credit losses on performing loans and impaired loans (excluding those related to off-balance sheet instruments and undrawn commitments).
(5) Defaulted balances are net of allowance for credit losses on impaired loans, excluding off-balance sheet instruments and undrawn commitments.
CR3 - CREDIT RISK MITIGATION TECHNIQUES - OVERVIEW (1) (2) (3) (4) (5)
Q1 2019CR3 - CREDIT RISK MITIGATION TECHNIQUES - OVERVIEW (1) (2) (3) (4) (5)
CR3 - CREDIT RISK MITIGATION TECHNIQUES - OVERVIEW (1) (2) (3) (4) (5)
Q2 2019
Q4 2018
April 30, 2019 Supplementary Regulatory Capital Disclosure Page 16

CR4 - STANDARDIZED APPROACH - CREDIT RISK EXPOSURE AND CREDIT RISK MITIGATION (CRM) EFFECTS (1) (2)($ millions)
On-balance sheet amount
Off-balance sheet amount
On-balance sheet amount
Off-balance sheet amount RWA RWA density
Asset classes a b c d e f
1 Sovereigns and their central banks 15 8 15 4 - 0.00%2 Non-central government public sector entities 158 11 158 5 34 20.69%3 Multilateral development banks - - - - - 0.00%4 Banks 77 299 77 138 43 20.00%5 Securities firms 7 50 7 18 5 20.00%6 Corporates 18,666 8,851 18,666 3,571 21,986 98.87%7 Regulatory retail portfolios 9,762 4,080 9,762 - 7,136 73.10%8 Secured by residential property 4,319 187 4,319 75 1,672 38.06%9 Secured by commercial real estate 617 115 617 59 676 100.00%
10 Equity 1,715 320 1,715 160 1,168 62.29%11 Defaulted exposures 633 58 633 3 899 141.49%12 Higher-risk categories (3) 133 204 133 99 348 150.00%13 Other assets 8,907 - 8,907 - 8,314 93.34%14 Total 45,009 14,183 45,009 4,132 42,281 86.04%
CR4 - STANDARDIZED APPROACH - CREDIT RISK EXPOSURE AND CREDIT RISK MITIGATION (CRM) EFFECTS (1) (2)($ millions)
On-balance sheet amount
Off-balance sheet amount
On-balance sheet amount
Off-balance sheet amount RWA RWA density
Asset classes a b c d e f
1 Sovereigns and their central banks 11 7 11 4 - 0.00%2 Non-central government public sector entities 165 7 165 3 34 20.39%3 Multilateral development banks - - - - - 0.00%4 Banks 3 186 3 90 19 20.00%5 Securities firms 10 46 10 15 5 20.00%6 Corporates 17,513 8,586 17,513 3,391 20,719 99.12%7 Regulatory retail portfolios 9,018 3,936 9,018 - 6,556 72.69%8 Secured by residential property 4,403 188 4,403 76 1,715 38.28%9 Secured by commercial real estate 675 128 675 62 736 100.00%
10 Equity 1,603 329 1,603 164 1,120 63.38%11 Defaulted exposures 600 42 600 19 849 137.10%12 Higher-risk categories (3) 127 183 127 89 323 150.00%13 Other assets 8,305 - 8,305 - 8,327 100.26%14 Total 42,433 13,638 42,433 3,913 40,403 87.17%
CR4 - STANDARDIZED APPROACH - CREDIT RISK EXPOSURE AND CREDIT RISK MITIGATION (CRM) EFFECTS (1) (2)($ millions)
On-balance sheet amount
Off-balance sheet amount
On-balance sheet amount
Off-balance sheet amount RWA RWA density
Asset classes a b c d e f
1 Sovereigns and their central banks 12 7 12 3 - 0.00%2 Non-central government public sector entities 150 23 150 12 32 20.00%3 Multilateral development banks - - - - - 0.00%4 Banks 59 207 59 80 28 20.00%5 Securities firms 7 51 7 18 5 20.00%6 Corporates 16,450 8,850 16,450 3,450 19,722 99.11%7 Regulatory retail portfolios 9,131 3,923 9,131 4 6,687 73.19%8 Secured by residential property 4,408 192 4,408 74 1,728 38.54%9 Secured by commercial real estate 694 128 694 62 756 100.00%
10 Equity 1,749 290 1,749 145 1,153 60.88%11 Defaulted exposures 468 26 468 11 647 135.12%12 Higher-risk categories (3) 96 129 96 65 241 150.00%13 Other assets 8,800 - 8,800 - 8,289 94.20%14 Total 42,024 13,826 42,024 3,924 39,288 85.51%(1) Credit risk excludes Counterparty Credit Risk, Securitization, Equity Investment in Funds, Settlement risk and amounts below the thresholds for deduction subject to
250% risk weight.(2) Exposure amounts are net of stage 3 allowance for credit losses.(3) Non-defaulted exposures with risk weights equal to 150% (e.g. rated BB- or lower).
Q4 2018Exposures before CCF and CRM Exposures post CCF and CRM RWA and RWA density
Q2 2019Exposures before CCF and CRM Exposures post CCF and CRM RWA and RWA density
Q1 2019Exposures before CCF and CRM Exposures post CCF and CRM RWA and RWA density
April 30, 2019 Supplementary Regulatory Capital Disclosure Page 17
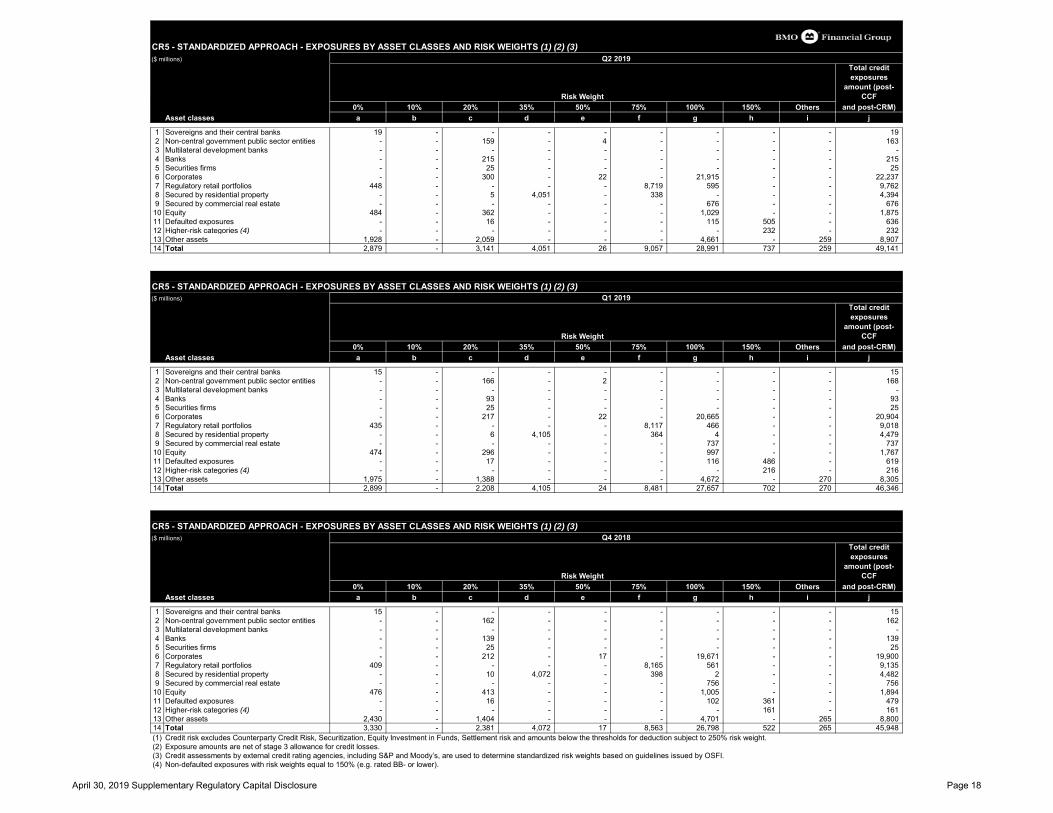
CR5 - STANDARDIZED APPROACH - EXPOSURES BY ASSET CLASSES AND RISK WEIGHTS (1) (2) (3)($ millions)
Total credit exposures
amount (post-CCF
0% 10% 20% 35% 50% 75% 100% 150% Others and post-CRM)Asset classes a b c d e f g h i j
1 Sovereigns and their central banks 19 - - - - - - - - 192 Non-central government public sector entities - - 159 - 4 - - - - 1633 Multilateral development banks - - - - - - - - - -4 Banks - - 215 - - - - - - 2155 Securities firms - - 25 - - - - - - 256 Corporates - - 300 - 22 - 21,915 - - 22,2377 Regulatory retail portfolios 448 - - - - 8,719 595 - - 9,7628 Secured by residential property - - 5 4,051 - 338 - - - 4,3949 Secured by commercial real estate - - - - - - 676 - - 67610 Equity 484 - 362 - - - 1,029 - - 1,87511 Defaulted exposures - - 16 - - - 115 505 - 63612 Higher-risk categories (4) - - - - - - - 232 - 23213 Other assets 1,928 - 2,059 - - - 4,661 - 259 8,90714 Total 2,879 - 3,141 4,051 26 9,057 28,991 737 259 49,141
CR5 - STANDARDIZED APPROACH - EXPOSURES BY ASSET CLASSES AND RISK WEIGHTS (1) (2) (3)($ millions)
Total credit exposures
amount (post-CCF
0% 10% 20% 35% 50% 75% 100% 150% Others and post-CRM)Asset classes a b c d e f g h i j
1 Sovereigns and their central banks 15 - - - - - - - - 152 Non-central government public sector entities - - 166 - 2 - - - - 1683 Multilateral development banks - - - - - - - - - -4 Banks - - 93 - - - - - - 935 Securities firms - - 25 - - - - - - 256 Corporates - - 217 - 22 - 20,665 - - 20,9047 Regulatory retail portfolios 435 - - - - 8,117 466 - - 9,0188 Secured by residential property - - 6 4,105 - 364 4 - - 4,4799 Secured by commercial real estate - - - - - - 737 - - 73710 Equity 474 - 296 - - - 997 - - 1,76711 Defaulted exposures - - 17 - - - 116 486 - 61912 Higher-risk categories (4) - - - - - - - 216 - 21613 Other assets 1,975 - 1,388 - - - 4,672 - 270 8,30514 Total 2,899 - 2,208 4,105 24 8,481 27,657 702 270 46,346
CR5 - STANDARDIZED APPROACH - EXPOSURES BY ASSET CLASSES AND RISK WEIGHTS (1) (2) (3)($ millions)
Total credit exposures
amount (post-CCF
0% 10% 20% 35% 50% 75% 100% 150% Others and post-CRM)Asset classes a b c d e f g h i j
1 Sovereigns and their central banks 15 - - - - - - - - 152 Non-central government public sector entities - - 162 - - - - - - 1623 Multilateral development banks - - - - - - - - - -4 Banks - - 139 - - - - - - 1395 Securities firms - - 25 - - - - - - 256 Corporates - - 212 - 17 - 19,671 - - 19,9007 Regulatory retail portfolios 409 - - - - 8,165 561 - - 9,1358 Secured by residential property - - 10 4,072 - 398 2 - - 4,4829 Secured by commercial real estate - - - - - - 756 - - 75610 Equity 476 - 413 - - - 1,005 - - 1,89411 Defaulted exposures - - 16 - - - 102 361 - 47912 Higher-risk categories (4) - - - - - - - 161 - 16113 Other assets 2,430 - 1,404 - - - 4,701 - 265 8,80014 Total 3,330 - 2,381 4,072 17 8,563 26,798 522 265 45,948(1) Credit risk excludes Counterparty Credit Risk, Securitization, Equity Investment in Funds, Settlement risk and amounts below the thresholds for deduction subject to 250% risk weight.(2) Exposure amounts are net of stage 3 allowance for credit losses.(3) Credit assessments by external credit rating agencies, including S&P and Moody’s, are used to determine standardized risk weights based on guidelines issued by OSFI.(4) Non-defaulted exposures with risk weights equal to 150% (e.g. rated BB- or lower).
Q4 2018
Risk Weight
Q2 2019
Risk Weight
Q1 2019
Risk Weight
April 30, 2019 Supplementary Regulatory Capital Disclosure Page 18

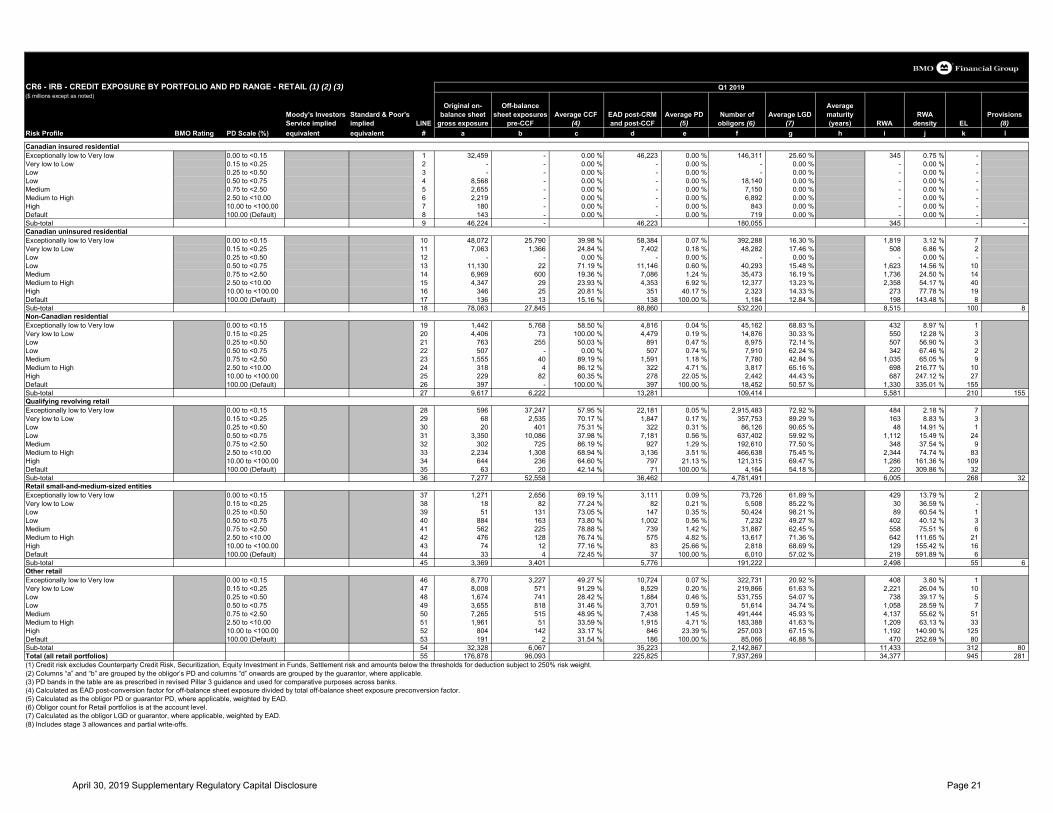
CR6 - IRB - CREDIT EXPOSURE BY PORTFOLIO AND PD RANGE - RETAIL (1) (2) (3)($ millions except as noted)
Moody's Investors Service implied
Standard & Poor's implied LINE
Original on-balance sheet
gross exposure
Off-balance sheet exposures
pre-CCFAverage CCF
(4)EAD post-CRM and post-CCF
Average PD (5)
Number of obligors (6)
Average LGD (7)
Average maturity (years) RWA
RWA density EL
Provisions (8)
Risk Profile BMO Rating PD Scale (%) equivalent equivalent # a b c d e f g h i j k l
Canadian insured residentialExceptionally low to Very low 0.00 to <0.15 1 32,654 - 0.00 % 46,532 0.00 % 145,215 26.02 % 355 0.76 % -Very low to Low 0.15 to <0.25 2 - - 0.00 % - 0.00 % - 0.00 % - 0.00 % -Low 0.25 to <0.50 3 - - 0.00 % - 0.00 % - 0.00 % - 0.00 % -Low 0.50 to <0.75 4 8,586 - 0.00 % - 0.00 % 18,318 0.00 % - 0.00 % -Medium 0.75 to <2.50 5 2,648 - 0.00 % - 0.00 % 7,153 0.00 % - 0.00 % -Medium to High 2.50 to <10.00 6 2,266 - 0.00 % - 0.00 % 7,112 0.00 % - 0.00 % -High 10.00 to <100.00 7 227 - 0.00 % - 0.00 % 1,124 0.00 % - 0.00 % -Default 100.00 (Default) 8 153 - 0.00 % - 0.00 % 763 0.00 % - 0.00 % -Sub-total 9 46,534 - 46,532 179,685 355 - -Canadian uninsured residentialExceptionally low to Very low 0.00 to <0.15 10 47,196 26,231 39.93 % 57,669 0.07 % 391,400 16.16 % 1,774 3.08 % 7Very low to Low 0.15 to <0.25 11 6,998 1,363 24.75 % 7,335 0.18 % 48,816 17.54 % 506 6.90 % 2Low 0.25 to <0.50 12 - - 0.00 % - 0.00 % - 0.00 % - 0.00 % -Low 0.50 to <0.75 13 11,336 21 70.84 % 11,351 0.61 % 40,526 15.27 % 1,633 14.39 % 10Medium 0.75 to <2.50 14 7,140 537 19.92 % 7,247 1.24 % 36,096 16.15 % 1,762 24.31 % 14Medium to High 2.50 to <10.00 15 4,473 31 21.76 % 4,480 6.92 % 12,652 13.24 % 2,427 54.17 % 41High 10.00 to <100.00 16 454 46 22.58 % 464 40.63 % 3,037 14.56 % 366 78.88 % 27Default 100.00 (Default) 17 170 13 16.93 % 172 100.00 % 1,313 12.51 % 239 138.95 % 11Sub-total 18 77,767 28,242 88,718 533,840 8,707 112 11Non-Canadian residentialExceptionally low to Very low 0.00 to <0.15 19 1,460 5,958 58.67 % 4,956 0.04 % 45,447 68.99 % 445 8.98 % 1Very low to Low 0.15 to <0.25 20 4,524 65 100.00 % 4,590 0.19 % 14,710 30.53 % 567 12.35 % 3Low 0.25 to <0.50 21 797 237 48.80 % 913 0.47 % 8,940 72.61 % 523 57.28 % 3Low 0.50 to <0.75 22 491 - 0.00 % 491 0.74 % 7,615 61.81 % 329 67.01 % 2Medium 0.75 to <2.50 23 1,463 38 87.83 % 1,496 1.20 % 7,504 43.25 % 991 66.24 % 8Medium to High 2.50 to <10.00 24 327 3 83.51 % 330 4.62 % 3,932 65.84 % 715 216.67 % 10High 10.00 to <100.00 25 192 56 60.59 % 225 21.97 % 2,123 47.86 % 593 263.56 % 24Default 100.00 (Default) 26 383 - 100.00 % 383 100.00 % 17,326 50.71 % 1,341 350.13 % 147Sub-total 27 9,637 6,357 13,384 107,597 5,504 198 147Qualifying revolving retailExceptionally low to Very low 0.00 to <0.15 28 713 37,471 57.46 % 22,245 0.05 % 2,947,607 73.13 % 487 2.19 % 7Very low to Low 0.15 to <0.25 29 96 2,548 70.22 % 1,885 0.17 % 358,884 89.53 % 167 8.86 % 3Low 0.25 to <0.50 30 30 403 75.57 % 334 0.31 % 86,021 90.74 % 50 14.97 % 1Low 0.50 to <0.75 31 3,411 10,295 37.99 % 7,322 0.56 % 644,059 60.32 % 1,142 15.60 % 25Medium 0.75 to <2.50 32 330 737 86.64 % 968 1.28 % 193,772 78.71 % 368 38.02 % 10Medium to High 2.50 to <10.00 33 2,349 1,371 68.78 % 3,292 3.51 % 474,332 76.39 % 2,496 75.82 % 89High 10.00 to <100.00 34 697 253 63.55 % 858 23.15 % 126,471 70.10 % 1,400 163.17 % 130Default 100.00 (Default) 35 73 26 41.30 % 84 100.00 % 4,842 54.76 % 305 363.10 % 32Sub-total 36 7,699 53,104 36,988 4,835,988 6,415 297 32Retail small-and-medium-sized entitiesExceptionally low to Very low 0.00 to <0.15 37 1,324 2,666 69.28 % 3,174 0.09 % 72,286 61.45 % 431 13.58 % 2Very low to Low 0.15 to <0.25 38 24 96 76.40 % 98 0.21 % 5,508 85.75 % 37 37.76 % -Low 0.25 to <0.50 39 55 120 73.20 % 142 0.34 % 49,821 98.00 % 84 59.15 % -Low 0.50 to <0.75 40 918 182 74.03 % 1,051 0.56 % 7,443 49.01 % 420 39.96 % 3Medium 0.75 to <2.50 41 584 231 78.68 % 766 1.42 % 31,623 61.95 % 575 75.07 % 7Medium to High 2.50 to <10.00 42 515 141 73.99 % 619 4.86 % 13,428 72.23 % 700 113.09 % 23High 10.00 to <100.00 43 85 15 79.58 % 96 27.82 % 3,230 69.91 % 151 157.29 % 21Default 100.00 (Default) 44 44 5 73.56 % 47 100.00 % 6,113 59.88 % 305 648.94 % 7Sub-total 45 3,549 3,456 5,993 189,452 2,703 63 7Other retailExceptionally low to Very low 0.00 to <0.15 46 8,833 3,295 49.11 % 10,810 0.07 % 317,059 21.26 % 415 3.84 % 1Very low to Low 0.15 to <0.25 47 7,891 613 92.33 % 8,457 0.20 % 221,257 61.58 % 2,193 25.93 % 10Low 0.25 to <0.50 48 1,358 776 27.99 % 1,575 0.46 % 537,075 54.72 % 622 39.49 % 4Low 0.50 to <0.75 49 3,842 844 31.37 % 3,900 0.59 % 51,820 34.70 % 1,114 28.56 % 8Medium 0.75 to <2.50 50 6,945 470 46.73 % 7,085 1.44 % 504,032 45.35 % 3,881 54.78 % 48Medium to High 2.50 to <10.00 51 1,941 47 37.01 % 1,897 4.74 % 183,478 40.94 % 1,179 62.15 % 32High 10.00 to <100.00 52 837 164 32.12 % 885 24.03 % 273,191 64.98 % 1,205 136.16 % 128Default 100.00 (Default) 53 195 2 31.71 % 189 100.00 % 81,583 46.63 % 504 266.67 % 78Sub-total 54 31,842 6,211 34,798 2,169,495 11,113 309 78Total (all retail portfolios) 55 177,028 97,370 226,413 8,016,057 34,797 979 275(1) Credit risk excludes Counterparty Credit Risk, Securitization, Equity Investment in Funds, Settlement risk and amounts below the thresholds for deduction subject to 250% risk weight.(2) Columns “a” and “b” are grouped by the obligor’s PD and columns “d” onwards are grouped by the guarantor, where applicable.(3) PD bands in the table are as prescribed in revised Pillar 3 guidance and used for comparative purposes across banks. (4) Calculated as EAD post-conversion factor for off-balance sheet exposure divided by total off-balance sheet exposure preconversion factor.(5) Calculated as the obligor PD or guarantor PD, where applicable, weighted by EAD.(6) Obligor count for Retail portfolios is at the account level. (7) Calculated as the obligor LGD or guarantor, where applicable, weighted by EAD.(8) Includes stage 3 allowances and partial write-offs.
Q2 2019
April 30, 2019 Supplementary Regulatory Capital Disclosure Page 19

CR6 - IRB - CREDIT EXPOSURE BY PORTFOLIO AND PD RANGE - WHOLESALE (1) (2) (3)($ millions except as noted)
Moody's Investors Service implied Standard & Poor's LINE
Original on-balance sheet
gross exposure
Off-balance sheet
exposures pre-CCF
Average CCF (4)
EAD post-CRM and post-CCF
Average PD (5)
Number of obligors (6)
Average LGD (7)
Average maturity
(years) (8) RWARWA
density ELProvisions
(9)Risk Profile BMO Rating PD Scale (%) equivalent implied equivalent # a b c d e f g h i j k l
CorporateInvestment grade I-1, I-2, I-3, I-4, I-5 0.00 to <0.15 Aaa to Baa1 AAA to BBB+ 56 38,065 78,260 51.32 % 85,658 0.08 % 5,615 34.85 % 2.31 18,269 21.33 % 25Investment grade I-5, I-6 0.15 to <0.25 Baa1 to Baa2 BBB+ to BBB 57 29,084 38,923 48.64 % 46,093 0.20 % 5,034 37.75 % 2.40 17,281 37.49 % 35Investment grade I-6, I-7 0.25 to <0.50 Baa2 to Baa3 BBB to BBB- 58 40,677 36,490 48.59 % 57,149 0.32 % 9,034 37.11 % 2.47 26,785 46.87 % 68Investment grade to Non-investment grade I-7, S-1 0.50 to <0.75 Baa3 to Ba1 BBB- to BB+ 59 41,085 28,669 45.10 % 52,550 0.62 % 8,475 34.80 % 2.48 30,708 58.44 % 114Non-investment grade S-1, S-2, S-3 0.75 to <2.50 Ba1 to Ba3 BB+ to BB- 60 41,232 27,994 46.47 % 52,235 1.22 % 12,389 36.32 % 2.47 40,011 76.60 % 232Non-investment grade to Watchlist S-3, S-4, P-1, P-2 2.50 to <10.00 Ba3 to Caa1 BB- to B- 61 5,714 5,795 46.26 % 7,886 3.58 % 3,009 32.28 % 2.10 7,153 90.71 % 92Watchlist P-2, P-3 10.00 to <100.00 Caa1 to Ca B- to CC 62 1,715 1,398 52.46 % 2,187 14.19 % 811 29.31 % 2.26 2,984 136.44 % 92Default Default 100.00 (Default) C C to D 63 1,034 301 100.00 % 1,321 100.00 % 393 36.13 % 2.35 3,918 296.59 % 256Sub-total 64 198,606 217,830 305,079 44,760 147,109 914 256SovereignInvestment grade I-1, I-2, I-3, I-4, I-5 0.00 to <0.15 Aaa to Baa1 AAA to BBB+ 65 104,347 8,015 60.89 % 109,548 0.02 % 3,149 6.31 % 2.71 3,471 3.17 % 3Investment grade I-5, I-6 0.15 to <0.25 Baa1 to Baa2 BBB+ to BBB 66 661 375 71.94 % 711 0.20 % 325 20.22 % 1.33 114 16.03 % -Investment grade I-6, I-7 0.25 to <0.50 Baa2 to Baa3 BBB to BBB- 67 113 293 50.88 % 207 0.32 % 118 33.65 % 1.72 78 37.68 % -Investment grade to Non-investment grade I-7, S-1 0.50 to <0.75 Baa3 to Ba1 BBB- to BB+ 68 17 66 45.19 % 31 0.63 % 78 164.14 % 1.15 72 232.26 % -Non-investment grade S-1, S-2, S-3 0.75 to <2.50 Ba1 to Ba3 BB+ to BB- 69 995 51 43.30 % 994 1.77 % 134 27.98 % 3.08 770 77.46 % 5Non-investment grade to Watchlist S-3, S-4, P-1, P-2 2.50 to <10.00 Ba3 to Caa1 BB- to B- 70 35 27 37.34 % 41 3.38 % 44 47.78 % 1.24 55 134.15 % 1Watchlist P-2, P-3 10.00 to <100.00 Caa1 to Ca B- to CC 71 1 - 0.00 % - 0.00 % 3 0.00 % - - 0.00 % -Default Default 100.00 (Default) C C to D 72 - - 0.00 % - 0.00 % - 0.00 % - - 0.00 % -Sub-total 73 106,169 8,827 111,532 3,851 4,560 9 -BankInvestment grade I-1, I-2, I-3, I-4, I-5 0.00 to <0.15 Aaa to Baa1 AAA to BBB+ 74 11,862 4,452 77.76 % 16,583 0.07 % 176 17.25 % 1.24 1,335 8.05 % 2Investment grade I-5, I-6 0.15 to <0.25 Baa1 to Baa2 BBB+ to BBB 75 4,747 3,679 59.47 % 6,642 0.19 % 81 13.63 % 1.53 718 10.81 % 2Investment grade I-6, I-7 0.25 to <0.50 Baa2 to Baa3 BBB to BBB- 76 2,328 1,901 61.73 % 3,257 0.32 % 78 14.00 % 0.97 454 13.94 % 1Investment grade to Non-investment grade I-7, S-1 0.50 to <0.75 Baa3 to Ba1 BBB- to BB+ 77 1,105 769 61.62 % 1,345 0.55 % 50 15.36 % 0.72 283 21.04 % 1Non-investment grade S-1, S-2, S-3 0.75 to <2.50 Ba1 to Ba3 BB+ to BB- 78 1,781 190 99.65 % 1,488 1.09 % 47 15.37 % 0.40 418 28.09 % 3Non-investment grade to Watchlist S-3, S-4, P-1, P-2 2.50 to <10.00 Ba3 to Caa1 BB- to B- 79 37 2 50.76 % 34 2.85 % 12 14.74 % 0.19 11 32.35 % -Watchlist P-2, P-3 10.00 to <100.00 Caa1 to Ca B- to CC 80 - - 0.00 % - 0.00 % - 0.00 % - - 0.00 % -Default Default 100.00 (Default) C C to D 81 - - 0.00 % - 0.00 % - 0.00 % - - 0.00 % -Sub-total 82 21,860 10,993 29,349 444 3,219 9 -Total (all wholesale portfolios) 83 326,635 237,650 445,960 49,055 154,888 932 256(1) Credit risk excludes Counterparty Credit Risk, Securitization, Equity Investment in Funds, Settlement risk and amounts below the thresholds for deduction subject to 250% risk weight.(2) Columns “a” and “b” are grouped by the obligor’s PD and columns “d” onwards are grouped by the guarantor, where applicable.(3) PD bands in the table are as prescribed in revised Pillar 3 guidance and used for comparative purposes across banks. (4) Calculated as EAD post-conversion factor for off-balance sheet exposure divided by total off-balance sheet exposure preconversion factor.(5) Calculated as the obligor PD or guarantor PD, where applicable, weighted by EAD.(6) Obligor count for Wholesale portfolios is at the borrower level. (7) Calculated as the obligor LGD or guarantor, where applicable, weighted by EAD.(8) Calculated as the effective maturity in years weighted by EAD.(9) Includes stage 3 allowances and partial write-offs.
Q2 2019
April 30, 2019 Supplementary Regulatory Capital Disclosure Page 20
CR6 - IRB - CREDIT EXPOSURE BY PORTFOLIO AND PD RANGE - RETAIL (1) (2) (3)($ millions except as noted)
Moody's Investors Service implied
Standard & Poor's implied LINE
Original on-balance sheet
gross exposure
Off-balance sheet exposures
pre-CCFAverage CCF
(4)EAD post-CRM and post-CCF
Average PD (5)
Number of obligors (6)
Average LGD (7)
Average maturity (years) RWA
RWA density EL
Provisions (8)
Risk Profile BMO Rating PD Scale (%) equivalent equivalent # a b c d e f g h i j k l
Canadian insured residentialExceptionally low to Very low 0.00 to <0.15 1 32,459 - 0.00 % 46,223 0.00 % 146,311 25.60 % 345 0.75 % -Very low to Low 0.15 to <0.25 2 - - 0.00 % - 0.00 % - 0.00 % - 0.00 % -Low 0.25 to <0.50 3 - - 0.00 % - 0.00 % - 0.00 % - 0.00 % -Low 0.50 to <0.75 4 8,568 - 0.00 % - 0.00 % 18,140 0.00 % - 0.00 % -Medium 0.75 to <2.50 5 2,655 - 0.00 % - 0.00 % 7,150 0.00 % - 0.00 % -Medium to High 2.50 to <10.00 6 2,219 - 0.00 % - 0.00 % 6,892 0.00 % - 0.00 % -High 10.00 to <100.00 7 180 - 0.00 % - 0.00 % 843 0.00 % - 0.00 % -Default 100.00 (Default) 8 143 - 0.00 % - 0.00 % 719 0.00 % - 0.00 % -Sub-total 9 46,224 - 46,223 180,055 345 - -Canadian uninsured residentialExceptionally low to Very low 0.00 to <0.15 10 48,072 25,790 39.98 % 58,384 0.07 % 392,288 16.30 % 1,819 3.12 % 7Very low to Low 0.15 to <0.25 11 7,063 1,366 24.84 % 7,402 0.18 % 48,282 17.46 % 508 6.86 % 2Low 0.25 to <0.50 12 - - 0.00 % - 0.00 % - 0.00 % - 0.00 % -Low 0.50 to <0.75 13 11,130 22 71.19 % 11,146 0.60 % 40,293 15.48 % 1,623 14.56 % 10Medium 0.75 to <2.50 14 6,969 600 19.36 % 7,086 1.24 % 35,473 16.19 % 1,736 24.50 % 14Medium to High 2.50 to <10.00 15 4,347 29 23.93 % 4,353 6.92 % 12,377 13.23 % 2,358 54.17 % 40High 10.00 to <100.00 16 346 25 20.81 % 351 40.17 % 2,323 14.33 % 273 77.78 % 19Default 100.00 (Default) 17 136 13 15.16 % 138 100.00 % 1,184 12.84 % 198 143.48 % 8Sub-total 18 78,063 27,845 88,860 532,220 8,515 100 8Non-Canadian residentialExceptionally low to Very low 0.00 to <0.15 19 1,442 5,768 58.50 % 4,816 0.04 % 45,162 68.83 % 432 8.97 % 1Very low to Low 0.15 to <0.25 20 4,406 73 100.00 % 4,479 0.19 % 14,876 30.33 % 550 12.28 % 3Low 0.25 to <0.50 21 763 255 50.03 % 891 0.47 % 8,975 72.14 % 507 56.90 % 3Low 0.50 to <0.75 22 507 - 0.00 % 507 0.74 % 7,910 62.24 % 342 67.46 % 2Medium 0.75 to <2.50 23 1,555 40 89.19 % 1,591 1.18 % 7,780 42.84 % 1,035 65.05 % 9Medium to High 2.50 to <10.00 24 318 4 86.12 % 322 4.71 % 3,817 65.16 % 698 216.77 % 10High 10.00 to <100.00 25 229 82 60.35 % 278 22.05 % 2,442 44.43 % 687 247.12 % 27Default 100.00 (Default) 26 397 - 100.00 % 397 100.00 % 18,452 50.57 % 1,330 335.01 % 155Sub-total 27 9,617 6,222 13,281 109,414 5,581 210 155Qualifying revolving retailExceptionally low to Very low 0.00 to <0.15 28 596 37,247 57.95 % 22,181 0.05 % 2,915,483 72.92 % 484 2.18 % 7Very low to Low 0.15 to <0.25 29 68 2,535 70.17 % 1,847 0.17 % 357,753 89.29 % 163 8.83 % 3Low 0.25 to <0.50 30 20 401 75.31 % 322 0.31 % 86,126 90.65 % 48 14.91 % 1Low 0.50 to <0.75 31 3,350 10,086 37.98 % 7,181 0.56 % 637,402 59.92 % 1,112 15.49 % 24Medium 0.75 to <2.50 32 302 725 86.19 % 927 1.29 % 192,610 77.50 % 348 37.54 % 9Medium to High 2.50 to <10.00 33 2,234 1,308 68.94 % 3,136 3.51 % 466,638 75.45 % 2,344 74.74 % 83High 10.00 to <100.00 34 644 236 64.60 % 797 21.13 % 121,315 69.47 % 1,286 161.36 % 109Default 100.00 (Default) 35 63 20 42.14 % 71 100.00 % 4,164 54.18 % 220 309.86 % 32Sub-total 36 7,277 52,558 36,462 4,781,491 6,005 268 32Retail small-and-medium-sized entitiesExceptionally low to Very low 0.00 to <0.15 37 1,271 2,656 69.19 % 3,111 0.09 % 73,726 61.89 % 429 13.79 % 2Very low to Low 0.15 to <0.25 38 18 82 77.24 % 82 0.21 % 5,508 85.22 % 30 36.59 % -Low 0.25 to <0.50 39 51 131 73.05 % 147 0.35 % 50,424 98.21 % 89 60.54 % 1Low 0.50 to <0.75 40 884 163 73.80 % 1,002 0.56 % 7,232 49.27 % 402 40.12 % 3Medium 0.75 to <2.50 41 562 225 78.88 % 739 1.42 % 31,887 62.45 % 558 75.51 % 6Medium to High 2.50 to <10.00 42 476 128 76.74 % 575 4.82 % 13,617 71.36 % 642 111.65 % 21High 10.00 to <100.00 43 74 12 77.16 % 83 25.66 % 2,818 68.69 % 129 155.42 % 16Default 100.00 (Default) 44 33 4 72.45 % 37 100.00 % 6,010 57.02 % 219 591.89 % 6Sub-total 45 3,369 3,401 5,776 191,222 2,498 55 6Other retailExceptionally low to Very low 0.00 to <0.15 46 8,770 3,227 49.27 % 10,724 0.07 % 322,731 20.92 % 408 3.80 % 1Very low to Low 0.15 to <0.25 47 8,008 571 91.29 % 8,529 0.20 % 219,866 61.63 % 2,221 26.04 % 10Low 0.25 to <0.50 48 1,674 741 28.42 % 1,884 0.46 % 531,755 54.07 % 738 39.17 % 5Low 0.50 to <0.75 49 3,655 818 31.46 % 3,701 0.59 % 51,614 34.74 % 1,058 28.59 % 7Medium 0.75 to <2.50 50 7,265 515 48.95 % 7,438 1.45 % 491,444 45.93 % 4,137 55.62 % 51Medium to High 2.50 to <10.00 51 1,961 51 33.59 % 1,915 4.71 % 183,388 41.63 % 1,209 63.13 % 33High 10.00 to <100.00 52 804 142 33.17 % 846 23.39 % 257,003 67.15 % 1,192 140.90 % 125Default 100.00 (Default) 53 191 2 31.54 % 186 100.00 % 85,066 46.88 % 470 252.69 % 80Sub-total 54 32,328 6,067 35,223 2,142,867 11,433 312 80Total (all retail portfolios) 55 176,878 96,093 225,825 7,937,269 34,377 945 281(1) Credit risk excludes Counterparty Credit Risk, Securitization, Equity Investment in Funds, Settlement risk and amounts below the thresholds for deduction subject to 250% risk weight.(2) Columns “a” and “b” are grouped by the obligor’s PD and columns “d” onwards are grouped by the guarantor, where applicable.(3) PD bands in the table are as prescribed in revised Pillar 3 guidance and used for comparative purposes across banks. (4) Calculated as EAD post-conversion factor for off-balance sheet exposure divided by total off-balance sheet exposure preconversion factor.(5) Calculated as the obligor PD or guarantor PD, where applicable, weighted by EAD.(6) Obligor count for Retail portfolios is at the account level. (7) Calculated as the obligor LGD or guarantor, where applicable, weighted by EAD.(8) Includes stage 3 allowances and partial write-offs.
Q1 2019
April 30, 2019 Supplementary Regulatory Capital Disclosure Page 21

CR6 - IRB - CREDIT EXPOSURE BY PORTFOLIO AND PD RANGE - WHOLESALE (1) (2) (3)($ millions except as noted)
Moody's Investors Service implied Standard & Poor's LINE
Original on-balance sheet
gross exposure
Off-balance sheet
exposures pre-CCF
Average CCF (4)
EAD post-CRM and post-CCF
Average PD (5)
Number of obligors (6)
Average LGD (7)
Average maturity
(years) (8) RWARWA
density ELProvisions
(9)Risk Profile BMO Rating PD Scale (%) equivalent implied equivalent # a b c d e f g h i j k l
CorporateInvestment grade I-1, I-2, I-3, I-4, I-5 0.00 to <0.15 Aaa to Baa1 AAA to BBB+ 56 36,061 74,145 50.44 % 80,903 0.08 % 5,598 35.32 % 2.27 16,691 20.63 % 24Investment grade I-5, I-6 0.15 to <0.25 Baa1 to Baa2 BBB+ to BBB 57 26,946 37,972 49.03 % 43,478 0.20 % 5,003 37.79 % 2.42 16,434 37.80 % 33Investment grade I-6, I-7 0.25 to <0.50 Baa2 to Baa3 BBB to BBB- 58 38,532 35,645 49.21 % 54,979 0.32 % 8,941 36.66 % 2.53 25,676 46.70 % 65Investment grade to Non-investment grade I-7, S-1 0.50 to <0.75 Baa3 to Ba1 BBB- to BB+ 59 36,895 28,190 46.16 % 48,477 0.62 % 8,240 35.64 % 2.48 28,988 59.80 % 107Non-investment grade S-1, S-2, S-3 0.75 to <2.50 Ba1 to Ba3 BB+ to BB- 60 38,253 29,077 46.84 % 49,743 1.22 % 12,328 36.24 % 2.48 37,931 76.25 % 220Non-investment grade to Watchlist S-3, S-4, P-1, P-2 2.50 to <10.00 Ba3 to Caa1 BB- to B- 61 5,563 5,157 43.67 % 7,302 3.64 % 3,071 31.49 % 1.95 6,342 86.85 % 83Watchlist P-2, P-3 10.00 to <100.00 Caa1 to Ca B- to CC 62 1,279 679 58.96 % 1,507 14.02 % 800 32.28 % 1.71 2,166 143.73 % 69Default Default 100.00 (Default) C C to D 63 826 325 99.99 % 1,134 100.00 % 396 35.82 % 2.57 3,099 273.28 % 240Sub-total 64 184,355 211,190 287,523 44,377 137,327 841 240SovereignInvestment grade I-1, I-2, I-3, I-4, I-5 0.00 to <0.15 Aaa to Baa1 AAA to BBB+ 65 107,760 8,112 61.53 % 112,952 0.02 % 3,104 4.24 % 2.58 3,092 2.74 % 2Investment grade I-5, I-6 0.15 to <0.25 Baa1 to Baa2 BBB+ to BBB 66 740 406 74.16 % 898 0.20 % 321 19.92 % 1.20 137 15.26 % -Investment grade I-6, I-7 0.25 to <0.50 Baa2 to Baa3 BBB to BBB- 67 217 279 50.52 % 345 0.32 % 125 20.49 % 1.75 82 23.77 % -Investment grade to Non-investment grade I-7, S-1 0.50 to <0.75 Baa3 to Ba1 BBB- to BB+ 68 194 50 49.33 % 202 0.59 % 75 24.14 % 1.55 73 36.14 % -Non-investment grade S-1, S-2, S-3 0.75 to <2.50 Ba1 to Ba3 BB+ to BB- 69 914 56 42.32 % 914 0.97 % 99 33.36 % 3.00 696 76.15 % 3Non-investment grade to Watchlist S-3, S-4, P-1, P-2 2.50 to <10.00 Ba3 to Caa1 BB- to B- 70 34 14 48.90 % 37 3.44 % 35 45.08 % 1.30 47 127.03 % 1Watchlist P-2, P-3 10.00 to <100.00 Caa1 to Ca B- to CC 71 1 - 0.00 % - 0.00 % 2 0.00 % - - 0.00 % -Default Default 100.00 (Default) C C to D 72 - - 0.00 % - 0.00 % - 0.00 % - - 0.00 % -Sub-total 73 109,860 8,917 115,348 3,761 4,127 6 -BankInvestment grade I-1, I-2, I-3, I-4, I-5 0.00 to <0.15 Aaa to Baa1 AAA to BBB+ 74 11,287 4,444 77.80 % 16,109 0.07 % 178 16.67 % 1.20 1,188 7.37 % 2Investment grade I-5, I-6 0.15 to <0.25 Baa1 to Baa2 BBB+ to BBB 75 5,045 3,438 59.95 % 6,676 0.19 % 87 12.99 % 1.50 697 10.44 % 2Investment grade I-6, I-7 0.25 to <0.50 Baa2 to Baa3 BBB to BBB- 76 2,267 2,063 63.07 % 3,287 0.32 % 77 14.72 % 0.75 459 13.96 % 2Investment grade to Non-investment grade I-7, S-1 0.50 to <0.75 Baa3 to Ba1 BBB- to BB+ 77 1,298 878 60.58 % 1,610 0.55 % 53 13.86 % 0.70 292 18.14 % 1Non-investment grade S-1, S-2, S-3 0.75 to <2.50 Ba1 to Ba3 BB+ to BB- 78 1,967 168 86.66 % 1,686 1.07 % 50 15.23 % 0.39 479 28.41 % 3Non-investment grade to Watchlist S-3, S-4, P-1, P-2 2.50 to <10.00 Ba3 to Caa1 BB- to B- 79 57 1 51.60 % 53 3.02 % 15 14.82 % 0.14 18 33.96 % -Watchlist P-2, P-3 10.00 to <100.00 Caa1 to Ca B- to CC 80 - - 100.00 % - 14.66 % 1 30.00 % 1.00 - 0.00 % -Default Default 100.00 (Default) C C to D 81 - - 0.00 % - 0.00 % - 0.00 % - - 0.00 % -Sub-total 82 21,921 10,992 29,421 461 3,133 10 -Total (all wholesale portfolios) 83 316,136 231,099 432,292 48,599 144,587 857 240(1) Credit risk excludes Counterparty Credit Risk, Securitization, Equity Investment in Funds, Settlement risk and amounts below the thresholds for deduction subject to 250% risk weight.(2) Columns “a” and “b” are grouped by the obligor’s PD and columns “d” onwards are grouped by the guarantor, where applicable.(3) PD bands in the table are as prescribed in revised Pillar 3 guidance and used for comparative purposes across banks. (4) Calculated as EAD post-conversion factor for off-balance sheet exposure divided by total off-balance sheet exposure preconversion factor.(5) Calculated as the obligor PD or guarantor PD, where applicable, weighted by EAD.(6) Obligor count for Wholesale portfolios is at the borrower level. (7) Calculated as the obligor LGD or guarantor, where applicable, weighted by EAD.(8) Calculated as the effective maturity in years weighted by EAD.(9) Includes stage 3 allowances and partial write-offs.
Q1 2019
April 30, 2019 Supplementary Regulatory Capital Disclosure Page 22

CR6 - IRB - CREDIT EXPOSURE BY PORTFOLIO AND PD RANGE - RETAIL (1) (2) (3)($ millions except as noted)
Moody's Investors Service implied
Standard & Poor's implied LINE
Original on-balance sheet
gross exposure
Off-balance sheet
exposures pre-CCF
Average CCF (4)
EAD post-CRM and post-CCF Average PD (5)
Number of obligors (6)
Average LGD (7)
Average maturity (years) RWA
RWA density EL
Provisions (8)
Risk Profile BMO Rating PD Scale (%) equivalent equivalent # a b c d e f g h i j k l
Canadian insured residentialExceptionally low to Very low 0.00 to <0.15 1 33,381 - 0.00 % 47,203 0.00 % 150,223 25.24 % 339 0.72 % -Very low to Low 0.15 to <0.25 2 - - 0.00 % - 0.00 % - 0.00 % - 0.00 % -Low 0.25 to <0.50 3 - - 0.00 % - 0.00 % - 0.00 % - 0.00 % -Low 0.50 to <0.75 4 8,616 - 0.00 % - 0.00 % 18,313 0.00 % - 0.00 % -Medium 0.75 to <2.50 5 2,660 - 0.00 % - 0.00 % 7,200 0.00 % - 0.00 % -Medium to High 2.50 to <10.00 6 2,218 - 0.00 % - 0.00 % 6,803 0.00 % - 0.00 % -High 10.00 to <100.00 7 186 - 0.00 % - 0.00 % 894 0.00 % - 0.00 % -Default 100.00 (Default) 8 142 - 0.00 % - 0.00 % 729 0.00 % - 0.00 % -Sub-total 9 47,203 - 47,203 184,162 339 - -Canadian uninsured residentialExceptionally low to Very low 0.00 to <0.15 10 46,826 25,187 39.75 % 56,839 0.07 % 385,333 16.20 % 1,758 3.09 % 7Very low to Low 0.15 to <0.25 11 7,407 1,461 25.23 % 7,776 0.18 % 50,398 17.31 % 529 6.81 % 2Low 0.25 to <0.50 12 - - 0.00 % - 0.00 % - 0.00 % - 0.00 % -Low 0.50 to <0.75 13 10,309 23 71.83 % 10,326 0.60 % 40,602 14.75 % 1,419 13.74 % 9Medium 0.75 to <2.50 14 6,848 576 20.29 % 6,965 1.24 % 34,761 15.71 % 1,654 23.75 % 13Medium to High 2.50 to <10.00 15 4,198 29 23.31 % 4,205 6.92 % 12,105 13.06 % 2,247 53.43 % 38High 10.00 to <100.00 16 379 32 21.21 % 386 38.20 % 2,510 14.18 % 302 78.20 % 20Default 100.00 (Default) 17 149 10 13.44 % 150 100.00 % 1,098 14.11 % 246 163.71 % 8Sub-total 18 76,116 27,318 86,647 526,807 8,155 97 8Non-Canadian residentialExceptionally low to Very low 0.00 to <0.15 19 1,481 5,764 58.41 % 4,847 0.03 % 45,447 68.48 % 324 6.69 % 1Very low to Low 0.15 to <0.25 20 4,526 80 100.00 % 4,606 0.18 % 15,256 30.18 % 547 11.87 % 3Low 0.25 to <0.50 21 791 253 49.64 % 917 0.28 % 9,093 71.67 % 361 39.37 % 2Low 0.50 to <0.75 22 511 - 0.00 % 511 0.74 % 7,910 62.40 % 346 67.67 % 2Medium 0.75 to <2.50 23 1,713 44 87.38 % 1,751 1.13 % 10,025 44.62 % 1,125 64.25 % 9Medium to High 2.50 to <10.00 24 172 1 93.62 % 173 4.66 % 1,657 54.50 % 321 186.24 % 5High 10.00 to <100.00 25 226 116 61.20 % 297 23.25 % 2,521 43.62 % 719 241.95 % 29Default 100.00 (Default) 26 415 - 0.00 % 415 100.00 % 18,630 50.01 % 1,369 330.13 % 160Sub-total 27 9,835 6,258 13,517 110,539 5,112 211 160Qualifying revolving retailExceptionally low to Very low 0.00 to <0.15 28 1,032 36,428 56.28 % 21,533 0.05 % 2,841,494 72.52 % 488 2.27 % 7Very low to Low 0.15 to <0.25 29 179 2,558 68.02 % 1,919 0.17 % 353,928 89.17 % 166 8.65 % 3Low 0.25 to <0.50 30 3,342 9,451 36.17 % 6,761 0.35 % 545,514 58.01 % 691 10.22 % 14Low 0.50 to <0.75 31 194 926 76.16 % 900 0.55 % 195,495 90.00 % 205 22.80 % 4Medium 0.75 to <2.50 32 1,976 1,504 64.73 % 2,949 1.58 % 315,003 74.25 % 1,238 41.98 % 34Medium to High 2.50 to <10.00 33 1,177 709 92.65 % 1,833 5.08 % 379,920 79.95 % 1,807 98.56 % 72High 10.00 to <100.00 34 396 207 64.94 % 531 26.36 % 106,424 71.43 % 962 181.26 % 96Default 100.00 (Default) 35 65 19 41.50 % 73 100.00 % 4,202 53.93 % 222 303.14 % 33Sub-total 36 8,361 51,802 36,499 4,741,980 5,779 263 33Retail small-and-medium-sized entitiesExceptionally low to Very low 0.00 to <0.15 37 1,281 2,586 73.87 % 3,194 0.09 % 74,336 60.97 % 437 13.69 % 2Very low to Low 0.15 to <0.25 38 17 76 77.05 % 75 0.21 % 5,508 85.86 % 28 37.60 % -Low 0.25 to <0.50 39 56 132 75.04 % 155 0.35 % 51,076 98.00 % 93 59.93 % 1Low 0.50 to <0.75 40 851 270 80.39 % 1,065 0.56 % 27,945 52.10 % 454 42.60 % 3Medium 0.75 to <2.50 41 537 98 79.11 % 614 1.49 % 11,941 58.89 % 449 73.13 % 5Medium to High 2.50 to <10.00 42 440 118 78.50 % 532 4.80 % 13,808 72.26 % 601 112.95 % 19High 10.00 to <100.00 43 64 10 78.50 % 73 26.47 % 2,692 68.80 % 113 156.30 % 14Default 100.00 (Default) 44 30 4 82.90 % 33 100.00 % 5,939 57.21 % 196 595.53 % 5Sub-total 45 3,276 3,294 5,741 193,245 2,371 49 5Other retailExceptionally low to Very low 0.00 to <0.15 46 9,742 3,188 49.26 % 11,685 0.07 % 367,834 22.07 % 471 4.03 % 2Very low to Low 0.15 to <0.25 47 6,944 561 91.53 % 7,458 0.18 % 173,682 65.16 % 2,034 27.28 % 9Low 0.25 to <0.50 48 3,275 1,460 30.04 % 3,713 0.38 % 558,953 53.94 % 1,297 34.93 % 8Low 0.50 to <0.75 49 3,331 40 47.52 % 3,138 0.61 % 108,859 30.02 % 799 25.45 % 6Medium 0.75 to <2.50 50 6,544 271 37.67 % 6,561 1.44 % 421,025 45.34 % 3,624 55.23 % 44Medium to High 2.50 to <10.00 51 1,545 10 41.01 % 1,484 6.13 % 192,380 38.40 % 911 61.35 % 34High 10.00 to <100.00 52 474 330 50.33 % 635 28.52 % 247,542 79.71 % 1,154 181.72 % 126Default 100.00 (Default) 53 199 2 35.02 % 193 100.00 % 83,821 47.43 % 501 259.21 % 83Sub-total 54 32,054 5,862 34,867 2,154,096 10,791 312 83Total (all retail portfolios) 55 176,845 94,534 224,474 7,910,829 32,547 932 289(1) Credit risk excludes Counterparty Credit Risk, Securitization, Equity Investment in Funds, Settlement risk and amounts below the thresholds for deduction subject to 250% risk weight.(2) Columns “a” and “b” are grouped by the obligor’s PD and columns “d” onwards are grouped by the guarantor, where applicable.(3) PD bands in the table are as prescribed in revised Pillar 3 guidance and used for comparative purposes across banks. (4) Calculated as EAD post-conversion factor for off-balance sheet exposure divided by total off-balance sheet exposure preconversion factor.(5) Calculated as the obligor PD or guarantor PD, where applicable, weighted by EAD.(6) Obligor count for Retail portfolios is at the account level. (7) Calculated as the obligor LGD or guarantor, where applicable, weighted by EAD.(8) Includes stage 3 allowances and partial write-offs.
Q4 2018
April 30, 2019 Supplementary Regulatory Capital Disclosure Page 23

CR6 - IRB - CREDIT EXPOSURE BY PORTFOLIO AND PD RANGE - WHOLESALE (1) (2) (3)($ millions except as noted)
Moody's Investors Service implied Standard & Poor's LINE
Original on-balance sheet
gross exposure
Off-balance sheet
exposures pre-CCF
Average CCF (4)
EAD post-CRM and post-CCF
Average PD (5)
Number of obligors (6)
Average LGD (7)
Average maturity
(years) (8) RWARWA
density ELProvisions
(9)Risk Profile BMO Rating PD Scale (%) equivalent implied equivalent # a b c d e f g h i j k l
CorporateInvestment grade I-1, I-2, I-3, I-4, I-5 0.00 to <0.15 Aaa to Baa1 AAA to BBB+ 56 33,904 71,858 49.85 % 76,384 0.08 % 5,499 35.28 % 2.21 16,097 21.07 % 22Investment grade I-5, I-6 0.15 to <0.25 Baa1 to Baa2 BBB+ to BBB 57 24,088 35,589 49.47 % 40,204 0.20 % 4,902 37.73 % 2.48 15,836 39.39 % 31Investment grade I-6, I-7 0.25 to <0.50 Baa2 to Baa3 BBB to BBB- 58 35,523 33,948 49.16 % 50,999 0.32 % 8,852 36.39 % 2.47 23,659 46.39 % 60Investment grade to Non-investment grade I-7, S-1 0.50 to <0.75 Baa3 to Ba1 BBB- to BB+ 59 35,093 27,744 46.75 % 46,631 0.66 % 8,034 36.10 % 2.46 29,290 62.81 % 112Non-investment grade S-1, S-2, S-3 0.75 to <2.50 Ba1 to Ba3 BB+ to BB- 60 37,629 27,247 46.83 % 49,010 1.25 % 12,227 36.83 % 2.54 39,077 79.73 % 225Non-investment grade to Watchlist S-3, S-4, P-1, P-2 2.50 to <10.00 Ba3 to Caa1 BB- to B- 61 5,533 5,501 48.42 % 7,203 3.65 % 3,119 32.66 % 2.07 6,583 91.39 % 87Watchlist P-2, P-3 10.00 to <100.00 Caa1 to Ca B- to CC 62 1,462 793 51.95 % 1,736 14.29 % 825 32.06 % 1.62 2,483 143.06 % 81Default Default 100.00 (Default) C C to D 63 907 266 99.99 % 1,161 100.00 % 451 39.21 % 2.64 3,459 298.05 % 270Sub-total 64 174,139 202,946 273,328 43,909 136,484 888 270SovereignInvestment grade I-1, I-2, I-3, I-4, I-5 0.00 to <0.15 Aaa to Baa1 AAA to BBB+ 65 105,767 7,799 59.56 % 110,569 0.02 % 2,956 3.99 % 2.49 2,980 2.70 % 2Investment grade I-5, I-6 0.15 to <0.25 Baa1 to Baa2 BBB+ to BBB 66 672 389 73.83 % 926 0.20 % 307 21.15 % 1.18 149 16.07 % -Investment grade I-6, I-7 0.25 to <0.50 Baa2 to Baa3 BBB to BBB- 67 218 367 53.86 % 335 0.34 % 126 21.81 % 1.78 88 26.39 % -Investment grade to Non-investment grade I-7, S-1 0.50 to <0.75 Baa3 to Ba1 BBB- to BB+ 68 1,520 30 32.85 % 1,514 0.63 % 83 2.19 % 1.31 44 2.92 % -Non-investment grade S-1, S-2, S-3 0.75 to <2.50 Ba1 to Ba3 BB+ to BB- 69 124 35 42.93 % 117 1.09 % 93 39.28 % 1.80 93 79.92 % 1Non-investment grade to Watchlist S-3, S-4, P-1, P-2 2.50 to <10.00 Ba3 to Caa1 BB- to B- 70 41 4 42.71 % 39 4.33 % 42 31.03 % 1.58 39 99.26 % 1Watchlist P-2, P-3 10.00 to <100.00 Caa1 to Ca B- to CC 71 - - 0.00 % - 0.00 % 1 0.00 % - - 0.00 % -Default Default 100.00 (Default) C C to D 72 - - 0.00 % - 0.00 % - 0.00 % - - 0.00 % -Sub-total 73 108,342 8,624 113,500 3,608 3,393 4 -BankInvestment grade I-1, I-2, I-3, I-4, I-5 0.00 to <0.15 Aaa to Baa1 AAA to BBB+ 74 12,226 3,918 77.60 % 15,705 0.07 % 189 24.64 % 1.11 1,833 11.67 % 2Investment grade I-5, I-6 0.15 to <0.25 Baa1 to Baa2 BBB+ to BBB 75 2,813 2,692 62.46 % 4,494 0.19 % 82 16.42 % 0.73 519 11.55 % 1Investment grade I-6, I-7 0.25 to <0.50 Baa2 to Baa3 BBB to BBB- 76 1,151 2,131 61.37 % 2,429 0.32 % 72 16.23 % 0.61 394 16.24 % 1Investment grade to Non-investment grade I-7, S-1 0.50 to <0.75 Baa3 to Ba1 BBB- to BB+ 77 1,390 634 62.17 % 1,765 0.55 % 56 13.73 % 0.53 292 16.52 % 1Non-investment grade S-1, S-2, S-3 0.75 to <2.50 Ba1 to Ba3 BB+ to BB- 78 1,832 32 98.38 % 1,479 1.16 % 47 15.20 % 0.34 421 28.49 % 3Non-investment grade to Watchlist S-3, S-4, P-1, P-2 2.50 to <10.00 Ba3 to Caa1 BB- to B- 79 63 3 91.03 % 61 3.31 % 13 14.91 % 0.17 22 35.91 % -Watchlist P-2, P-3 10.00 to <100.00 Caa1 to Ca B- to CC 80 - - 0.00 % - 0.00 % - 0.00 % - - 0.00 % -Default Default 100.00 (Default) C C to D 81 - - 0.00 % - 0.00 % - 0.00 % - - 0.00 % -Sub-total 82 19,475 9,410 25,933 459 3,481 8 -Total (all wholesale portfolios) 83 301,956 220,980 412,761 47,976 143,358 900 270(1) Credit risk excludes Counterparty Credit Risk, Securitization, Equity Investment in Funds, Settlement risk and amounts below the thresholds for deduction subject to 250% risk weight.(2) Columns “a” and “b” are grouped by the obligor’s PD and columns “d” onwards are grouped by the guarantor, where applicable.(3) PD bands in the table are as prescribed in revised Pillar 3 guidance and used for comparative purposes across banks. (4) Calculated as EAD post-conversion factor for off-balance sheet exposure divided by total off-balance sheet exposure preconversion factor.(5) Calculated as the obligor PD or guarantor PD, where applicable, weighted by EAD.(6) Obligor count for Wholesale portfolios is at the borrower level. (7) Calculated as the obligor LGD or guarantor, where applicable, weighted by EAD.(8) Calculated as the effective maturity in years weighted by EAD.(9) Includes stage 3 allowances and partial write-offs.
Q4 2018
April 30, 2019 Supplementary Regulatory Capital Disclosure Page 24

CR7 - IRB - EFFECT ON RWA OF CREDIT Q2 2019DERIVATIVES USED AS CRM TECHNIQUES Pre-credit
Derivatives RWA Actual RWA($ millions) a b
Portfolio 1 Corporate - AIRB 13 82 Sovereign - AIRB - -3 Bank - AIRB - -4 Total 13 8
CR7 - IRB - EFFECT ON RWA OF CREDIT Q1 2019DERIVATIVES USED AS CRM TECHNIQUES Pre-credit
Derivatives RWA Actual RWA($ millions) a b
Portfolio 1 Corporate - AIRB 25 162 Sovereign - AIRB - -3 Bank - AIRB - -4 Total 25 16
CR7 - IRB - EFFECT ON RWA OF CREDIT Q4 2018DERIVATIVES USED AS CRM TECHNIQUES Pre-credit
Derivatives RWA Actual RWA($ millions) a b
Portfolio 1 Corporate - AIRB 43 262 Sovereign - AIRB - -3 Bank - AIRB - -4 Total 43 26
April 30, 2019 Supplementary Regulatory Capital Disclosure Page 25

CR8 - RWA FLOW STATEMENTS OF CREDIT RISKAND COUNTERPARTY CREDIT RISK EXPOSURES Credit risk, of which Counterparty
AIRB Standardized credit risk (6)($ millions) a b c
1 RWA as at beginning of reporting period (1) 178,964 40,403 15,2782 Asset size (2) 8,588 1,273 9633 Asset quality (3) (81) 33 (209)4 Model updates (4) - - -5 Methodology and policy (5) 253 - (86)6 Acquisitions and disposals - - -7 Foreign exchange movements 1,961 572 (85)8 Other - - -9 RWA as at end of reporting period 189,685 42,281 15,861
CR8 - RWA FLOW STATEMENTS OF CREDIT RISKAND COUNTERPARTY CREDIT RISK EXPOSURES Credit risk, of which Counterparty
AIRB Standardized credit risk (6)($ millions) a b c
1 RWA as at beginning of reporting period (1) 175,905 39,288 13,4812 Asset size (2) 9,195 1,126 (1,727)3 Asset quality (3) (2,443) 62 (74)4 Model updates (4) - - -5 Methodology and policy (5) (3,438) - 3,5586 Acquisitions and disposals - - -7 Foreign exchange movements (255) (73) 408 Other - - -9 RWA as at end of reporting period 178,964 40,403 15,278
CR8 - RWA FLOW STATEMENTS OF CREDIT RISKAND COUNTERPARTY CREDIT RISK EXPOSURES Credit risk, of which Counterparty
AIRB Standardized credit risk (6)($ millions) a b c
1 RWA as at beginning of reporting period (1) 169,612 38,071 12,9782 Asset size (2) 6,497 911 283 Asset quality (3) (2,206) (96) (301)4 Model updates (4) (29) - -5 Methodology and policy (5) 866 - 1356 Acquisitions and disposals - 49 5727 Foreign exchange movements 1,165 353 698 Other - - -9 RWA as at end of reporting period 175,905 39,288 13,481
(1) Credit risk excludes Securitization, Equity Investment in Funds, Settlement risk and amounts below the thresholds for deduction subject to 250% risk weight.(2) Asset size includes organic changes in book size and composition (including new business and maturing loans).(3) Asset quality captures the quality of book changes caused by experience such as underlying customer behaviour or demographics, including changes
through model calibrations/realignments.(4) Model updates includes model implementation, change in model scope or any change to address model malfunctions.(5) Methodology and policy includes methodology changes to the calculations driven by regulatory policy changes, such as new or revised regulation.(6) Counterparty credit risk includes RWA for derivatives, SFTs, trades cleared through central counterparties and CVA adjustment.
Q2 2019
Q4 2018
Q1 2019
April 30, 2019 Supplementary Regulatory Capital Disclosure Page 26

EXPOSURE COVERED BY CREDIT RISK MITIGATION (1) Standardized AIRB Standardized AIRB Standardized AIRB
($ millions)LINE
#EAD post-CRM and post-CCF
Of which exposure amount covered by
guarantees or credit derivatives
EAD post-CRM and post-CCF
Of which exposure amount covered by guarantees or credit
derivatives EAD post-CRM and post-CCF
Of which exposure amount covered by
guarantees or credit derivatives
EAD post-CRM and post-CCF
Of which exposure amount covered by guarantees or credit
derivatives EAD post-CRM and post-CCF
Of which exposure amount covered by
guarantees or credit derivatives
EAD post-CRM and post-CCF
Of which exposure amount covered by guarantees or credit
derivatives
Corporate (incl specialized lending and SMEs treated as corporate) 1 23,505 262 305,079 10,225 22,182 183 287,523 10,037 21,002 178 273,328 9,592 Sovereign 2 182 - 111,532 462 183 - 115,348 395 178 - 113,500 330 Bank 3 239 - 29,349 1,565 119 - 29,421 1,791 164 - 25,933 660 Total Wholesale 4 23,926 262 445,960 12,252 22,484 183 432,292 12,223 21,344 178 412,761 10,582 Residential mortgages excluding home equity line of credits (HELOCs) 5 4,354 16 103,242 45,584 4,450 18 102,980 45,233 4,376 10 102,209 46,233 HELOCs 6 217 - 45,392 - 228 - 45,384 - 225 - 45,158 - Other retail 7 3,033 450 34,798 1,815 2,478 437 35,223 1,882 2,724 422 34,867 1,952 Qualifying revolving retail 8 - - 36,988 - - - 36,462 - - - 36,499 - Retail SMEs 9 6,829 - 5,993 4 6,634 - 5,776 4 6,585 - 5,741 6 Total Retail 10 14,433 466 226,413 47,403 13,790 455 225,825 47,119 13,910 432 224,474 48,191 Other assets 11 8,907 - - - 8,305 - - - 8,800 - - - Equity 12 1,875 - - - 1,767 - - - 1,894 - - - Total Bank 13 49,141 728 672,373 59,655 46,346 638 658,117 59,342 45,948 610 637,235 58,773
CREDIT RISK EXPOSURE BY GEOGRAPHIC REGION ($ millions) Canada U.S. Other Total Canada U.S. Other Total Canada U.S. Other Total
Corporate (incl specialized lending and SMEs treated as corporate) 14 137,554 181,744 9,286 328,584 133,840 168,723 7,142 309,705 128,517 158,498 7,315 294,330 Sovereign 15 32,433 62,160 17,121 111,714 31,595 68,202 15,734 115,531 31,795 71,150 10,733 113,678 Bank 16 4,292 6,864 18,432 29,588 4,853 6,626 18,061 29,540 1,613 9,106 15,378 26,097 Total Wholesale 17 174,279 250,768 44,839 469,886 170,288 243,551 40,937 454,776 161,925 238,754 33,426 434,105 Residential mortgages excluding home equity line of credits (HELOCs) 18 96,519 11,077 - 107,596 96,241 11,189 - 107,430 95,338 11,247 - 106,585 HELOCs 19 38,732 6,877 - 45,609 38,842 6,770 - 45,612 38,533 6,850 - 45,383 Other retail 20 27,775 9,491 565 37,831 28,693 8,553 455 37,701 29,098 8,035 458 37,591 Qualifying revolving retail 21 36,931 57 - 36,988 36,404 58 - 36,462 36,443 56 - 36,499 Retail SMEs 22 6,098 6,724 - 12,822 5,912 6,498 - 12,410 5,882 6,444 - 12,326 Total Retail 23 206,055 34,226 565 240,846 206,092 33,068 455 239,615 205,294 32,632 458 238,384 Other assets 24 5,340 3,285 282 8,907 4,631 3,415 259 8,305 4,537 4,001 262 8,800 Equity 25 51 1,611 213 1,875 43 1,524 200 1,767 68 1,582 244 1,894 Total Bank 26 385,725 289,890 45,899 721,514 381,054 281,558 41,851 704,463 371,824 276,969 34,390 683,183
CREDIT RISK EXPOSURE BY MAJOR ASSET CLASS Q2 2019 Q1 2019 Q4 2018Other off- Other off-
Commitments balance Commitments balance($ millions) Drawn (undrawn) (2) sheet items (3) Total Drawn (undrawn) (2) sheet items (3) Total Total
Corporate (incl specialized lending and SMEs treated as corporate) 27 218,356 92,873 17,355 328,584 202,977 89,748 16,980 309,705 294,330 Sovereign 28 106,344 3,747 1,623 111,714 110,035 3,884 1,612 115,531 113,678 Bank 29 21,945 5,147 2,496 29,588 21,936 5,074 2,530 29,540 26,097 Total Wholesale 30 346,645 101,767 21,474 469,886 334,948 98,706 21,122 454,776 434,105 Residential mortgages excluding home equity line of credits (HELOCs) 31 107,447 98 51 107,596 107,244 109 77 107,430 106,585 HELOCs 32 31,009 14,600 - 45,609 31,261 14,351 - 45,612 45,383 Other retail 33 34,874 2,956 1 37,831 34,804 2,896 1 37,701 37,591 Qualifying revolving retail 34 7,697 29,291 - 36,988 7,278 29,184 - 36,462 36,499 Retail SMEs 35 10,378 2,399 45 12,822 10,004 2,359 47 12,410 12,326 Total Retail 36 191,405 49,344 97 240,846 190,591 48,899 125 239,615 238,384 Other assets 37 8,907 - - 8,907 8,305 - - 8,305 8,800 Equity 38 1,715 160 - 1,875 1,603 164 - 1,767 1,894 Total Bank 39 548,672 151,271 21,571 721,514 535,447 147,769 21,247 704,463 683,183 (1) Credit risk mitigants herein include only credit derivatives and guarantees. Collateral is reflected in the risk parameters (PDs, LGDs) for AIRB exposures and risk weights for exposures under the Standardized approach.(2) The EAD on the difference between the authorized and drawn amounts (e.g. the unused portion of a line of credit). (3) All other off-balance sheet arrangements, other than derivatives and undrawn commitments, such as Standby Letters of Credit and Documentary Credits.
Q2 2019 Q1 2019 Q4 2018
Q2 2019 Q1 2019 Q4 2018
April 30, 2019 Supplementary Regulatory Capital Disclosure Page 27

CREDIT RISK BY RESIDUAL CONTRACT MATURITY BREAKDOWN Q2 2019 Q1 2019 Q4 2018
Other off- Other off-LINE Commitments balance Commitments balance
($ millions) # Drawn (undrawn) (1) sheet items (2) Total Drawn (undrawn) (1) sheet items (2) Total Total
Up to 1 year 1 173,296 85,304 16,432 275,032 177,798 86,341 15,745 279,884 277,128 1 to 5 years 2 304,890 60,132 5,009 370,031 292,379 56,361 5,367 354,107 338,523 Greater than 5 years 3 70,486 5,835 130 76,451 65,270 5,067 135 70,472 67,532 Total Bank 4 548,672 151,271 21,571 721,514 535,447 147,769 21,247 704,463 683,183
CREDIT RISK EXPOSURE BY INDUSTRY Q2 2019 Q1 2019 Q4 2018Other off- Other off-
Commitments balance Commitments balance($ millions) Drawn (undrawn) (1) sheet items (2) Total Drawn (undrawn) (1) sheet items (2) Total Total
Agriculture 5 12,224 2,016 38 14,278 11,523 2,108 31 13,662 13,398 Communications 6 928 1,174 309 2,411 800 1,046 516 2,362 1,982 Construction 7 4,125 3,023 1,229 8,377 3,622 2,941 1,107 7,670 7,533 Financial 8 102,407 23,410 6,156 131,973 105,034 22,753 5,899 133,686 129,218 Forest products 9 1,057 420 82 1,559 823 428 71 1,322 1,241 Government 10 47,409 2,093 688 50,190 46,792 2,143 677 49,612 47,337 Individual 11 191,405 49,344 97 240,846 190,589 48,898 124 239,611 238,384 Manufacturing 12 27,325 14,805 1,494 43,624 25,038 14,635 1,529 41,202 37,615 Mining 13 2,576 3,957 1,300 7,833 2,058 3,608 1,319 6,985 6,754 Oil and Gas 14 11,296 11,934 1,799 25,029 10,101 12,351 1,944 24,396 21,359 Other 15 16,636 494 345 17,475 15,906 513 313 16,732 18,877 Real estate 16 35,918 8,668 858 45,444 34,240 8,390 810 43,440 40,527 Retail trade 17 22,593 3,765 573 26,931 20,878 3,968 546 25,392 24,156 Service industries 18 43,984 13,307 2,653 59,944 40,709 12,696 2,546 55,951 54,163 Transportation 19 7,618 2,668 708 10,994 7,288 2,376 707 10,371 9,894 Utilities 20 4,767 5,627 2,687 13,081 4,321 4,505 2,545 11,371 11,073 Wholesale trade 21 16,404 4,566 555 21,525 15,725 4,410 563 20,698 19,672 Total Bank 22 548,672 151,271 21,571 721,514 535,447 147,769 21,247 704,463 683,183 (1) The EAD on the difference between the authorized and drawn amounts (e.g. the unused portion of a line of credit). (2) All other off-balance sheet arrangements, other than derivatives and undrawn commitments, such as Standby Letters of Credit and Documentary Credits.
April 30, 2019 Supplementary Regulatory Capital Disclosure Page 28

CCR1 - ANALYSIS OF COUNTERPARTY CREDIT RISK (CCR) EXPOSURE BY APPROACH (1)
Replacement cost
Potential future
exposure
Effective Expected Positive Exposure
(EEPE)
Alpha used for computing
regulatory EAD EAD post-CRM RWA($ millions except as noted) a b c d e f
1 SA-CCR (for derivatives) (2) 6,286 14,472 1.4 28,940 6,827 2 Internal Model Method (for derivatives and SFTs) - - - - 3 Simple Approach for credit risk mitigation (for SFTs) - - 4 Comprehensive Approach for credit risk mitigation (for SFTs) 19,519 2,877 5 VaR for SFTs - - 6 Total 9,704
CCR1 - ANALYSIS OF COUNTERPARTY CREDIT RISK (CCR) EXPOSURE BY APPROACH (1)
Replacement cost
Potential future
exposure
Effective Expected Positive Exposure
(EEPE)
Alpha used for computing
regulatory EAD EAD post-CRM RWA($ millions except as noted) a b c d e f
1 SA-CCR (for derivatives) (2) 5,747 13,679 1.4 27,061 6,227 2 Internal Model Method (for derivatives and SFTs) - - - - 3 Simple Approach for credit risk mitigation (for SFTs) - - 4 Comprehensive Approach for credit risk mitigation (for SFTs) 24,709 2,594 5 VaR for SFTs - - 6 Total 8,821
CCR1 - ANALYSIS OF COUNTERPARTY CREDIT RISK (CCR) EXPOSURE BY APPROACH (1)
Replacement cost
Potential future
exposure
Effective Expected Positive Exposure
(EEPE)
Alpha used for computing
regulatory EAD EAD post-CRM RWA($ millions except as noted) a b c d e f
1 Current exposure method (CEM) (for derivatives) 9,112 17,855 26,370 4,746 2 Internal Model Method (for derivatives and SFTs) - - - - 3 Simple Approach for credit risk mitigation (for SFTs) - - 4 Comprehensive Approach for credit risk mitigation (for SFTs) 22,212 3,171 5 VaR for SFTs - - 6 Total 7,917
(1) Excludes credit valuation adjustment charges and exposures cleared through a central counterparty.(2) Effective Q1 2019, CCR for derivatives is calculated using the SA-CCR in accordance with the CAR Guideline issued by OSFI on October 30, 2018.
Q4 2018
Q2 2019
Q1 2019
April 30, 2019 Supplementary Regulatory Capital Disclosure Page 29

CCR2 - CREDIT VALUATION ADJUSTMENT (CVA)CAPITAL CHARGE EAD post-CRM RWA($ millions) a b
Total portfolios subject to the Advanced CVA capital charge - -1 (i) VaR component (including the 3×multiplier) -2 (ii) Stressed VaR component (including the 3×multiplier) -3 All portfolios subject to the Standardized CVA capital charge (1) 20,343 5,6224 Total subject to the CVA capital charge 20,343 5,622
CCR2 - CREDIT VALUATION ADJUSTMENT (CVA)CAPITAL CHARGE EAD post-CRM RWA($ millions) a b
Total portfolios subject to the Advanced CVA capital charge - -1 (i) VaR component (including the 3×multiplier) -2 (ii) Stressed VaR component (including the 3×multiplier) -3 All portfolios subject to the Standardized CVA capital charge (1) 18,855 5,8894 Total subject to the CVA capital charge 18,855 5,889
CCR2 - CREDIT VALUATION ADJUSTMENT (CVA)CAPITAL CHARGE EAD post-CRM RWA($ millions) a b
Total portfolios subject to the Advanced CVA capital charge - -1 (i) VaR component (including the 3×multiplier) -2 (ii) Stressed VaR component (including the 3×multiplier) -3 All portfolios subject to the Standardized CVA capital charge (1) 22,272 4,9004 Total subject to the CVA capital charge 22,272 4,900
(1) Effective Q1 2019 RWA for CVA is no longer scaled while Q4 2018 RWA reflects CET1 scalar of 80% adjustment for CVA phase-in.
Q2 2019
Q4 2018
Q1 2019
April 30, 2019 Supplementary Regulatory Capital Disclosure Page 30
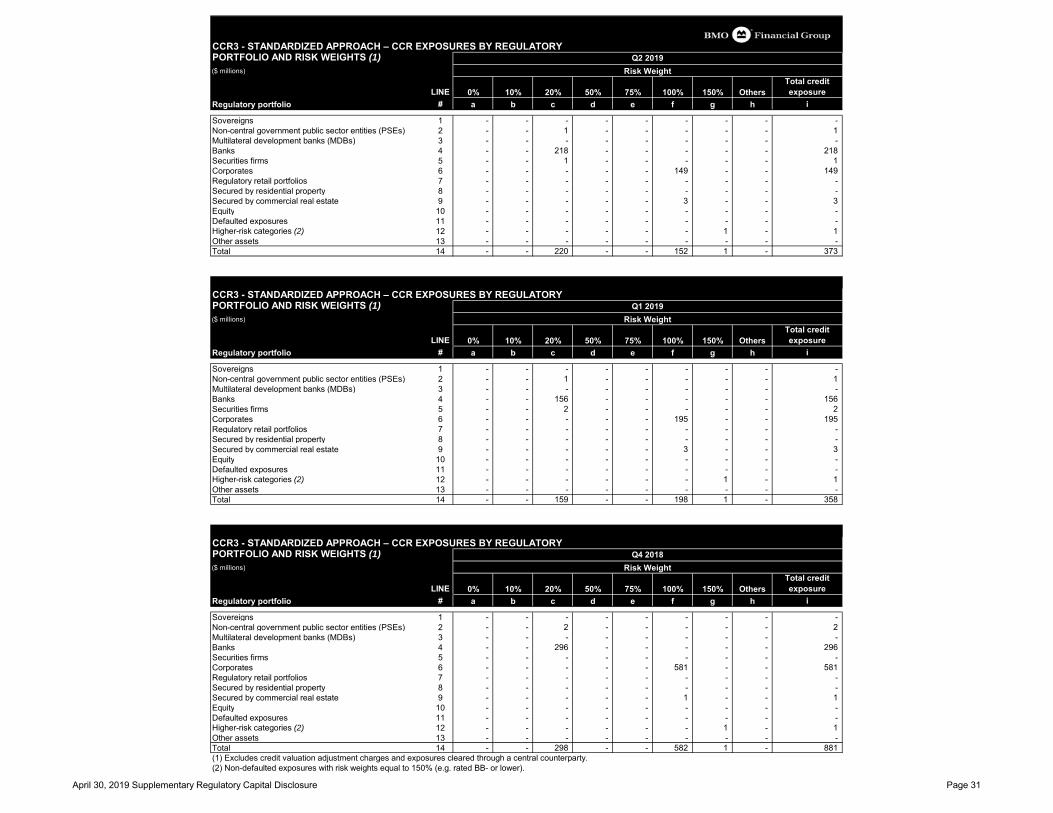
CCR3 - STANDARDIZED APPROACH – CCR EXPOSURES BY REGULATORY PORTFOLIO AND RISK WEIGHTS (1)($ millions)
LINE 0% 10% 20% 50% 75% 100% 150% OthersTotal credit exposure
Regulatory portfolio # a b c d e f g h i
Sovereigns 1 - - - - - - - - -Non-central government public sector entities (PSEs) 2 - - 1 - - - - - 1Multilateral development banks (MDBs) 3 - - - - - - - - -Banks 4 - - 218 - - - - - 218Securities firms 5 - - 1 - - - - - 1Corporates 6 - - - - - 149 - - 149Regulatory retail portfolios 7 - - - - - - - - -Secured by residential property 8 - - - - - - - - -Secured by commercial real estate 9 - - - - - 3 - - 3Equity 10 - - - - - - - - -Defaulted exposures 11 - - - - - - - - -Higher-risk categories (2) 12 - - - - - - 1 - 1Other assets 13 - - - - - - - - -Total 14 - - 220 - - 152 1 - 373
CCR3 - STANDARDIZED APPROACH – CCR EXPOSURES BY REGULATORY PORTFOLIO AND RISK WEIGHTS (1)($ millions)
LINE 0% 10% 20% 50% 75% 100% 150% OthersTotal credit exposure
Regulatory portfolio # a b c d e f g h i
Sovereigns 1 - - - - - - - - -Non-central government public sector entities (PSEs) 2 - - 1 - - - - - 1Multilateral development banks (MDBs) 3 - - - - - - - - -Banks 4 - - 156 - - - - - 156Securities firms 5 - - 2 - - - - - 2Corporates 6 - - - - - 195 - - 195Regulatory retail portfolios 7 - - - - - - - - -Secured by residential property 8 - - - - - - - - -Secured by commercial real estate 9 - - - - - 3 - - 3Equity 10 - - - - - - - - -Defaulted exposures 11 - - - - - - - - -Higher-risk categories (2) 12 - - - - - - 1 - 1Other assets 13 - - - - - - - - -Total 14 - - 159 - - 198 1 - 358
CCR3 - STANDARDIZED APPROACH – CCR EXPOSURES BY REGULATORY PORTFOLIO AND RISK WEIGHTS (1)($ millions)
LINE 0% 10% 20% 50% 75% 100% 150% OthersTotal credit exposure
Regulatory portfolio # a b c d e f g h i
Sovereigns 1 - - - - - - - - -Non-central government public sector entities (PSEs) 2 - - 2 - - - - - 2Multilateral development banks (MDBs) 3 - - - - - - - - -Banks 4 - - 296 - - - - - 296Securities firms 5 - - - - - - - - -Corporates 6 - - - - - 581 - - 581Regulatory retail portfolios 7 - - - - - - - - -Secured by residential property 8 - - - - - - - - -Secured by commercial real estate 9 - - - - - 1 - - 1Equity 10 - - - - - - - - -Defaulted exposures 11 - - - - - - - - -Higher-risk categories (2) 12 - - - - - - 1 - 1Other assets 13 - - - - - - - - -Total 14 - - 298 - - 582 1 - 881(1) Excludes credit valuation adjustment charges and exposures cleared through a central counterparty.(2) Non-defaulted exposures with risk weights equal to 150% (e.g. rated BB- or lower).
Q4 2018Risk Weight
Q2 2019Risk Weight
Q1 2019Risk Weight
April 30, 2019 Supplementary Regulatory Capital Disclosure Page 31

CCR4 - IRB - CCR EXPOSURES BY PORTFOLIO AND PD SCALE($ millions except as noted)
Moody's Investors Service Standard & Poor's LINE EAD post-
CRM Average PD
(1)Number of
obligors (2)Average LGD (3)
Average maturity
(years) (4) RWA RWA densityRisk Profile BMO Rating PD scale (%) implied equivalent implied equivalent # a b c d e f g
CorporateInvestment grade I-1, I-2, I-3, I-4, I-5 0.00 to <0.15 Aaa to Baa1 AAA to BBB+ 1 12,818 0.05% 2,974 26.76% 1.10 1,233 9.62%Investment grade I-5, I-6 0.15 to <0.25 Baa1 to Baa2 BBB+ to BBB 2 1,590 0.19% 508 40.53% 2.15 609 38.30%Investment grade I-6, I-7 0.25 to <0.50 Baa2 to Baa3 BBB to BBB- 3 1,557 0.32% 481 52.00% 2.53 980 62.94%Investment grade to Non-investment grade I-7, S-1 0.50 to <0.75 Baa3 to Ba1 BBB- to BB+ 4 2,186 0.62% 507 33.19% 1.49 1,141 52.20%Non-investment grade S-1, S-2, S-3 0.75 to <2.50 Ba1 to Ba3 BB+ to BB- 5 1,849 1.35% 672 33.95% 1.50 1,414 76.47%Non-investment grade to Watchlist S-3, S-4, P-1, P-2 2.50 to <10.00 Ba3 to Caa1 BB- to B- 6 553 3.12% 293 35.23% 1.63 546 98.73%Watchlist P-2, P-3 10.00 to <100.00 Caa1 to Ca B- to CC 7 67 13.05% 17 16.05% 1.35 50 74.63%Default Default 100.00 (Default) C C to D 8 - 100.00% 4 45.00% 1.63 - 0.00%Sub-total 9 20,620 5,456 5,973SovereignInvestment grade I-1, I-2, I-3, I-4, I-5 0.00 to <0.15 Aaa to Baa1 AAA to BBB+ 10 8,586 0.04% 222 11.62% 2.37 340 3.96%Investment grade I-5, I-6 0.15 to <0.25 Baa1 to Baa2 BBB+ to BBB 11 19 0.19% 4 38.74% 0.96 5 26.32%Investment grade I-6, I-7 0.25 to <0.50 Baa2 to Baa3 BBB to BBB- 12 97 0.32% 7 27.22% 0.41 23 23.71%Investment grade to Non-investment grade I-7, S-1 0.50 to <0.75 Baa3 to Ba1 BBB- to BB+ 13 - 0.00% - 0.00% 0.00 - 0.00%Non-investment grade S-1, S-2, S-3 0.75 to <2.50 Ba1 to Ba3 BB+ to BB- 14 7 0.92% 2 39.74% 1.01 5 71.43%Non-investment grade to Watchlist S-3, S-4, P-1, P-2 2.50 to <10.00 Ba3 to Caa1 BB- to B- 15 1 5.16% 1 40.00% 1.00 1 100.00%Watchlist P-2, P-3 10.00 to <100.00 Caa1 to Ca B- to CC 16 - 0.00% - 0.00% 0.00 - 0.00%Default Default 100.00 (Default) C C to D 17 - 0.00% - 0.00% 0.00 - 0.00%Sub-total 18 8,710 236 374BankInvestment grade I-1, I-2, I-3, I-4, I-5 0.00 to <0.15 Aaa to Baa1 AAA to BBB+ 19 17,136 0.07% 256 34.33% 1.13 2,628 15.34%Investment grade I-5, I-6 0.15 to <0.25 Baa1 to Baa2 BBB+ to BBB 20 821 0.19% 99 39.08% 0.60 246 29.96%Investment grade I-6, I-7 0.25 to <0.50 Baa2 to Baa3 BBB to BBB- 21 353 0.32% 53 34.97% 0.59 112 31.73%Investment grade to Non-investment grade I-7, S-1 0.50 to <0.75 Baa3 to Ba1 BBB- to BB+ 22 438 0.54% 27 36.26% 0.10 167 38.13%Non-investment grade S-1, S-2, S-3 0.75 to <2.50 Ba1 to Ba3 BB+ to BB- 23 4 1.32% 11 48.03% 1.00 4 100.00%Non-investment grade to Watchlist S-3, S-4, P-1, P-2 2.50 to <10.00 Ba3 to Caa1 BB- to B- 24 4 2.74% 7 35.00% 1.00 4 100.00%Watchlist P-2, P-3 10.00 to <100.00 Caa1 to Ca B- to CC 25 - 0.00% - 0.00% 0.00 - 0.00%Default Default 100.00 (Default) C C to D 26 - 0.00% - 0.00% 0.00 - 0.00%Sub-total 27 18,756 453 3,161Total (all wholesale portfolios) 28 48,086 6,145 9,508(1) Calculated as obligor PD weighted by EAD.(2) Obligor count for Wholesale portfolios is at the borrower level. (3) Calculated as the obligor LGD net of CRM weighted by EAD.(4) Calculated as the obligor effective maturity in years weighted by EAD.
Q2 2019
April 30, 2019 Supplementary Regulatory Capital Disclosure Page 32
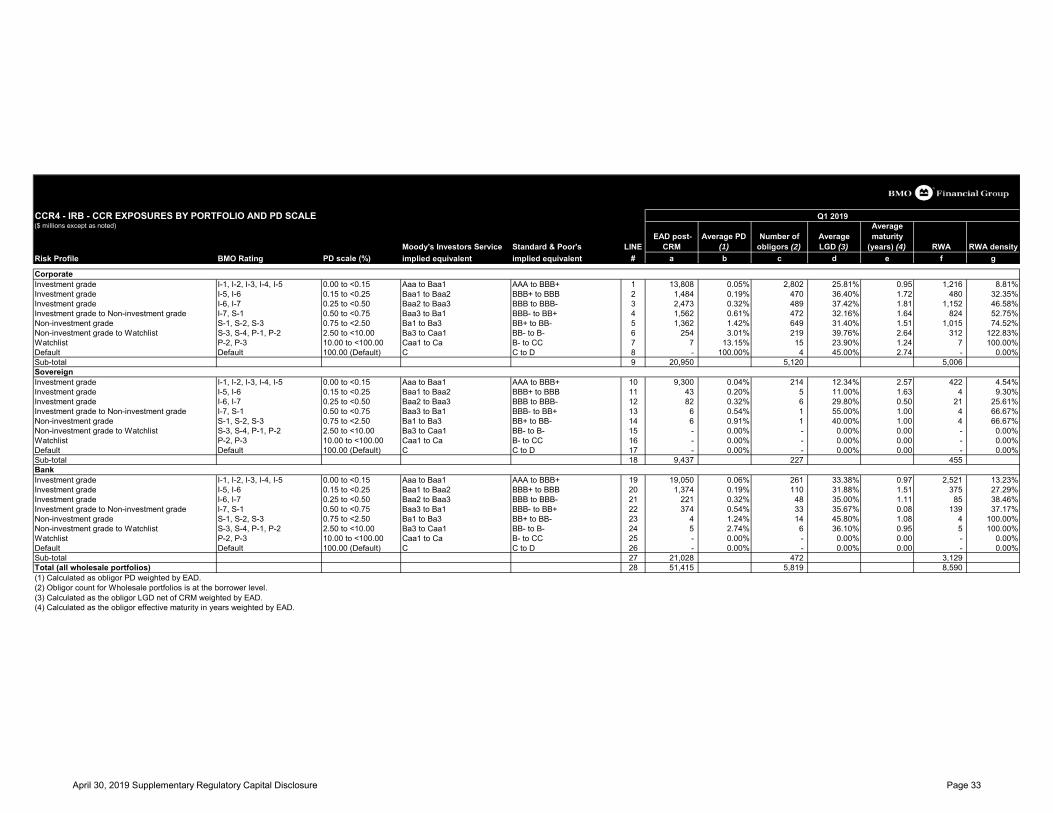
CCR4 - IRB - CCR EXPOSURES BY PORTFOLIO AND PD SCALE($ millions except as noted)
Moody's Investors Service Standard & Poor's LINE EAD post-
CRM Average PD
(1)Number of
obligors (2)Average LGD (3)
Average maturity
(years) (4) RWA RWA densityRisk Profile BMO Rating PD scale (%) implied equivalent implied equivalent # a b c d e f g
CorporateInvestment grade I-1, I-2, I-3, I-4, I-5 0.00 to <0.15 Aaa to Baa1 AAA to BBB+ 1 13,808 0.05% 2,802 25.81% 0.95 1,216 8.81%Investment grade I-5, I-6 0.15 to <0.25 Baa1 to Baa2 BBB+ to BBB 2 1,484 0.19% 470 36.40% 1.72 480 32.35%Investment grade I-6, I-7 0.25 to <0.50 Baa2 to Baa3 BBB to BBB- 3 2,473 0.32% 489 37.42% 1.81 1,152 46.58%Investment grade to Non-investment grade I-7, S-1 0.50 to <0.75 Baa3 to Ba1 BBB- to BB+ 4 1,562 0.61% 472 32.16% 1.64 824 52.75%Non-investment grade S-1, S-2, S-3 0.75 to <2.50 Ba1 to Ba3 BB+ to BB- 5 1,362 1.42% 649 31.40% 1.51 1,015 74.52%Non-investment grade to Watchlist S-3, S-4, P-1, P-2 2.50 to <10.00 Ba3 to Caa1 BB- to B- 6 254 3.01% 219 39.76% 2.64 312 122.83%Watchlist P-2, P-3 10.00 to <100.00 Caa1 to Ca B- to CC 7 7 13.15% 15 23.90% 1.24 7 100.00%Default Default 100.00 (Default) C C to D 8 - 100.00% 4 45.00% 2.74 - 0.00%Sub-total 9 20,950 5,120 5,006SovereignInvestment grade I-1, I-2, I-3, I-4, I-5 0.00 to <0.15 Aaa to Baa1 AAA to BBB+ 10 9,300 0.04% 214 12.34% 2.57 422 4.54%Investment grade I-5, I-6 0.15 to <0.25 Baa1 to Baa2 BBB+ to BBB 11 43 0.20% 5 11.00% 1.63 4 9.30%Investment grade I-6, I-7 0.25 to <0.50 Baa2 to Baa3 BBB to BBB- 12 82 0.32% 6 29.80% 0.50 21 25.61%Investment grade to Non-investment grade I-7, S-1 0.50 to <0.75 Baa3 to Ba1 BBB- to BB+ 13 6 0.54% 1 55.00% 1.00 4 66.67%Non-investment grade S-1, S-2, S-3 0.75 to <2.50 Ba1 to Ba3 BB+ to BB- 14 6 0.91% 1 40.00% 1.00 4 66.67%Non-investment grade to Watchlist S-3, S-4, P-1, P-2 2.50 to <10.00 Ba3 to Caa1 BB- to B- 15 - 0.00% - 0.00% 0.00 - 0.00%Watchlist P-2, P-3 10.00 to <100.00 Caa1 to Ca B- to CC 16 - 0.00% - 0.00% 0.00 - 0.00%Default Default 100.00 (Default) C C to D 17 - 0.00% - 0.00% 0.00 - 0.00%Sub-total 18 9,437 227 455BankInvestment grade I-1, I-2, I-3, I-4, I-5 0.00 to <0.15 Aaa to Baa1 AAA to BBB+ 19 19,050 0.06% 261 33.38% 0.97 2,521 13.23%Investment grade I-5, I-6 0.15 to <0.25 Baa1 to Baa2 BBB+ to BBB 20 1,374 0.19% 110 31.88% 1.51 375 27.29%Investment grade I-6, I-7 0.25 to <0.50 Baa2 to Baa3 BBB to BBB- 21 221 0.32% 48 35.00% 1.11 85 38.46%Investment grade to Non-investment grade I-7, S-1 0.50 to <0.75 Baa3 to Ba1 BBB- to BB+ 22 374 0.54% 33 35.67% 0.08 139 37.17%Non-investment grade S-1, S-2, S-3 0.75 to <2.50 Ba1 to Ba3 BB+ to BB- 23 4 1.24% 14 45.80% 1.08 4 100.00%Non-investment grade to Watchlist S-3, S-4, P-1, P-2 2.50 to <10.00 Ba3 to Caa1 BB- to B- 24 5 2.74% 6 36.10% 0.95 5 100.00%Watchlist P-2, P-3 10.00 to <100.00 Caa1 to Ca B- to CC 25 - 0.00% - 0.00% 0.00 - 0.00%Default Default 100.00 (Default) C C to D 26 - 0.00% - 0.00% 0.00 - 0.00%Sub-total 27 21,028 472 3,129Total (all wholesale portfolios) 28 51,415 5,819 8,590(1) Calculated as obligor PD weighted by EAD.(2) Obligor count for Wholesale portfolios is at the borrower level. (3) Calculated as the obligor LGD net of CRM weighted by EAD.(4) Calculated as the obligor effective maturity in years weighted by EAD.
Q1 2019
April 30, 2019 Supplementary Regulatory Capital Disclosure Page 33

CCR4 - IRB - CCR EXPOSURES BY PORTFOLIO AND PD SCALE($ millions except as noted)
Moody's Investors Service Standard & Poor's LINE EAD post-
CRM Average PD
(1)Number of
obligors (2)Average LGD (3)
Average maturity
(years) (4) RWA RWA densityRisk Profile BMO Rating PD scale (%) implied equivalent implied equivalent # a b c d e f g
CorporateInvestment grade I-1, I-2, I-3, I-4, I-5 0.00 to <0.15 Aaa to Baa1 AAA to BBB+ 1 9,747 0.05% 2,790 29.58% 0.99 854 8.76%Investment grade I-5, I-6 0.15 to <0.25 Baa1 to Baa2 BBB+ to BBB 2 2,074 0.19% 375 19.77% 1.16 339 16.32%Investment grade I-6, I-7 0.25 to <0.50 Baa2 to Baa3 BBB to BBB- 3 1,169 0.32% 526 30.64% 2.05 723 61.86%Investment grade to Non-investment grade I-7, S-1 0.50 to <0.75 Baa3 to Ba1 BBB- to BB+ 4 1,103 0.66% 475 28.16% 1.33 764 69.27%Non-investment grade S-1, S-2, S-3 0.75 to <2.50 Ba1 to Ba3 BB+ to BB- 5 1,328 1.43% 606 18.93% 0.94 912 68.71%Non-investment grade to Watchlist S-3, S-4, P-1, P-2 2.50 to <10.00 Ba3 to Caa1 BB- to B- 6 321 2.81% 212 42.25% 0.79 356 110.99%Watchlist P-2, P-3 10.00 to <100.00 Caa1 to Ca B- to CC 7 23 12.96% 9 19.14% 1.00 20 87.70%Default Default 100.00 (Default) C C to D 8 0 100.00% 1 45.00% 2.99 0 533.33%Sub-total 9 15,765 4,994 3,968SovereignInvestment grade I-1, I-2, I-3, I-4, I-5 0.00 to <0.15 Aaa to Baa1 AAA to BBB+ 10 9,904 0.04% 219 6.67% 2.38 268 2.71%Investment grade I-5, I-6 0.15 to <0.25 Baa1 to Baa2 BBB+ to BBB 11 15 0.20% 5 11.57% 1.97 2 12.21%Investment grade I-6, I-7 0.25 to <0.50 Baa2 to Baa3 BBB to BBB- 12 104 0.33% 6 39.96% 0.51 28 26.81%Investment grade to Non-investment grade I-7, S-1 0.50 to <0.75 Baa3 to Ba1 BBB- to BB+ 13 3 0.63% 1 55.00% 1.00 2 76.38%Non-investment grade S-1, S-2, S-3 0.75 to <2.50 Ba1 to Ba3 BB+ to BB- 14 7 1.21% 2 40.00% 0.90 4 67.37%Non-investment grade to Watchlist S-3, S-4, P-1, P-2 2.50 to <10.00 Ba3 to Caa1 BB- to B- 15 1 2.74% 2 65.00% 4.29 2 225.33%Watchlist P-2, P-3 10.00 to <100.00 Caa1 to Ca B- to CC 16 - 0.00% - 0.00% 0.00 - 0.00%Default Default 100.00 (Default) C C to D 17 - 0.00% - 0.00% 0.00 - 0.00%Sub-total 18 10,034 235 306BankInvestment grade I-1, I-2, I-3, I-4, I-5 0.00 to <0.15 Aaa to Baa1 AAA to BBB+ 19 20,382 0.07% 253 29.25% 1.16 2,614 12.82%Investment grade I-5, I-6 0.15 to <0.25 Baa1 to Baa2 BBB+ to BBB 20 983 0.19% 85 28.33% 0.98 201 20.44%Investment grade I-6, I-7 0.25 to <0.50 Baa2 to Baa3 BBB to BBB- 21 101 0.32% 59 22.28% 1.86 14 13.86%Investment grade to Non-investment grade I-7, S-1 0.50 to <0.75 Baa3 to Ba1 BBB- to BB+ 22 415 0.54% 28 29.17% 0.13 150 36.20%Non-investment grade S-1, S-2, S-3 0.75 to <2.50 Ba1 to Ba3 BB+ to BB- 23 16 0.91% 10 54.12% 0.67 15 96.06%Non-investment grade to Watchlist S-3, S-4, P-1, P-2 2.50 to <10.00 Ba3 to Caa1 BB- to B- 24 6 2.74% 7 35.00% 0.98 5 88.58%Watchlist P-2, P-3 10.00 to <100.00 Caa1 to Ca B- to CC 25 - 0.00% - 0.00% 0.00 - 0.00%Default Default 100.00 (Default) C C to D 26 - 0.00% - 0.00% 0.00 - 0.00%Sub-total 27 21,903 442 2,999Total (all wholesale portfolios) 28 47,702 5,671 7,273(1) Calculated as obligor PD weighted by EAD.(2) Obligor count for Wholesale portfolios is at the borrower level. (3) Calculated as the obligor LGD net of CRM weighted by EAD.(4) Calculated as the obligor effective maturity in years weighted by EAD.
Q4 2018
April 30, 2019 Supplementary Regulatory Capital Disclosure Page 34

CCR5 - COMPOSITION OF COLLATERAL FOR CCR EXPOSURE (1)
Fair value of Fair value of LINE Segregated Unsegregated Segregated Unsegregated collateral received posted collateral
($ millions) # a b c d e f
Cash – domestic currency 1 - 1,556 - 1,970 18,029 36,767Cash – other currencies 2 - 1,798 - 1,424 74,394 75,012Domestic sovereign debt 3 - 261 - 1,307 49,366 28,351Other sovereign debt 4 - 35 - 298 50,976 49,369Government agency debt 5 - 698 - 696 5,276 15,873Corporate bonds 6 - 49 - 196 4,209 11,284Equity securities 7 - 4 - 1,469 33,461 46,143Other collateral 8 - - - - - -Total 9 - 4,401 - 7,360 235,711 262,799
CCR5 - COMPOSITION OF COLLATERAL FOR CCR EXPOSURE (1)
Fair value of Fair value of LINE Segregated Unsegregated Segregated Unsegregated collateral received posted collateral
($ millions) # a b c d e f
Cash – domestic currency 1 - 1,921 - 1,510 20,198 36,045Cash – other currencies 2 - 1,842 - 1,530 75,429 66,573Domestic sovereign debt 3 - 305 - 786 53,207 30,672Other sovereign debt 4 - 42 - 324 48,048 50,649Government agency debt 5 - 619 - 423 4,003 11,685Corporate bonds 6 - 35 - 37 7,916 19,249Equity securities 7 - - - 931 29,748 45,156Other collateral 8 - - - - 1,068 -Total 9 - 4,764 - 5,541 239,617 260,029
CCR5 - COMPOSITION OF COLLATERAL FOR CCR EXPOSURE (1)
Fair value of Fair value of LINE Segregated Unsegregated Segregated Unsegregated collateral received posted collateral
($ millions) # a b c d e f
Cash – domestic currency 1 - 1,487 - 908 20,636 40,936Cash – other currencies 2 - 3,276 - 1,261 54,761 48,215Domestic sovereign debt 3 - 164 - 636 54,622 28,312Other sovereign debt 4 - 108 - 345 33,739 34,079Government agency debt 5 - 640 - 350 1,909 8,921Corporate bonds 6 - 33 - - 7,735 16,459Equity securities 7 - - - - 23,106 39,832Other collateral 8 - - - - 1,074 -Total 9 - 5,708 - 3,500 197,582 216,754(1) Segregated refers to collateral which is held in a bankruptcy-remote manner whereas unsegregated refers to collateral that is not held in bankruptcy-remote manner.
Fair value of collateral received
Q2 2019Collateral used in derivative transactions Collateral used in SFTs
Fair value of collateral received Fair value of posted collateral
Fair value of posted collateral
Q4 2018Collateral used in derivative transactions Collateral used in SFTs
Q1 2019Collateral used in derivative transactions Collateral used in SFTs
Fair value of collateral received Fair value of posted collateral
April 30, 2019 Supplementary Regulatory Capital Disclosure Page 35

CCR6 - CREDIT DERIVATIVES EXPOSURES (1)
LINEProtection
bought Protection sold Protection bought Protection sold Protection
bought Protection sold
($ millions) # a b c d e f
NotionalsSingle-name credit default swaps 1 1,084 1 1,879 - 1,858 24Index credit default swaps 2 7,703 5,328 4,358 1,877 1,977 797Total return swaps 3 1,416 - 1,136 4 1,318 379Credit options 4 - - - - - -Other credit derivatives 5 - - - - - -
Total notionals 6 10,203 5,329 7,373 1,881 5,153 1,200Fair values
Positive fair value (asset) 7 23 121 30 34 33 15Negative fair value (liability) 8 197 - 111 - 53 1
(1) Long and short positions are reported separately and are not consolidated.
Q2 2019 Q1 2019 Q4 2018
April 30, 2019 Supplementary Regulatory Capital Disclosure Page 36

CCR8 - EXPOSURES TO CENTRAL COUNTERPARTIES (1)EAD (post-CRM) RWA EAD (post-CRM) RWA EAD (post-CRM) RWA
($ millions) a b c d e f
1 Exposures to QCCPs (total) 535 568 664
2Exposures for trades at QCCPs (excluding initial margin and default fund contributions); of which 8,907 182 8,540 174 11,327 230
3 (i) OTC derivatives 3,010 64 3,572 74 5,547 1144 (ii) Exchange-traded derivatives 4,532 91 3,783 76 4,534 915 (iii) Securities financing transactions 1,365 27 1,185 24 1,246 256 (iv) Netting sets where cross-product netting has been approved - - - - - -7 Segregated initial margin - - -8 Non-segregated initial margin 2,821 2,751 2,832 579 Pre-funded default fund contributions 640 353 702 394 695 37710 Unfunded default fund contributions - - - - - -11 Exposures to non-QCCPs (total) - - -
12Exposures for trades at non-QCCPs (excluding initial margin and default fund contributions); of which - - - - - -
13 (i) OTC derivatives - - - - - -14 (ii) Exchange-traded derivatives - - - - - -15 (iii) Securities financing transactions - - - - - -16 (iv) Netting sets where cross-product netting has been approved - - - - - -17 Segregated initial margin - - -18 Non-segregated initial margin - - - - - -19 Pre-funded default fund contributions - - - - - -20 Unfunded default fund contributions - - - - - -(1) Effective Q1 2019, results reflect the new capital requirements for bank exposures to central counterparties as outlined in OSFI’s
CAR Guideline issued October 30, 2018.
Q2 2019 Q1 2019 Q4 2018
April 30, 2019 Supplementary Regulatory Capital Disclosure Page 37
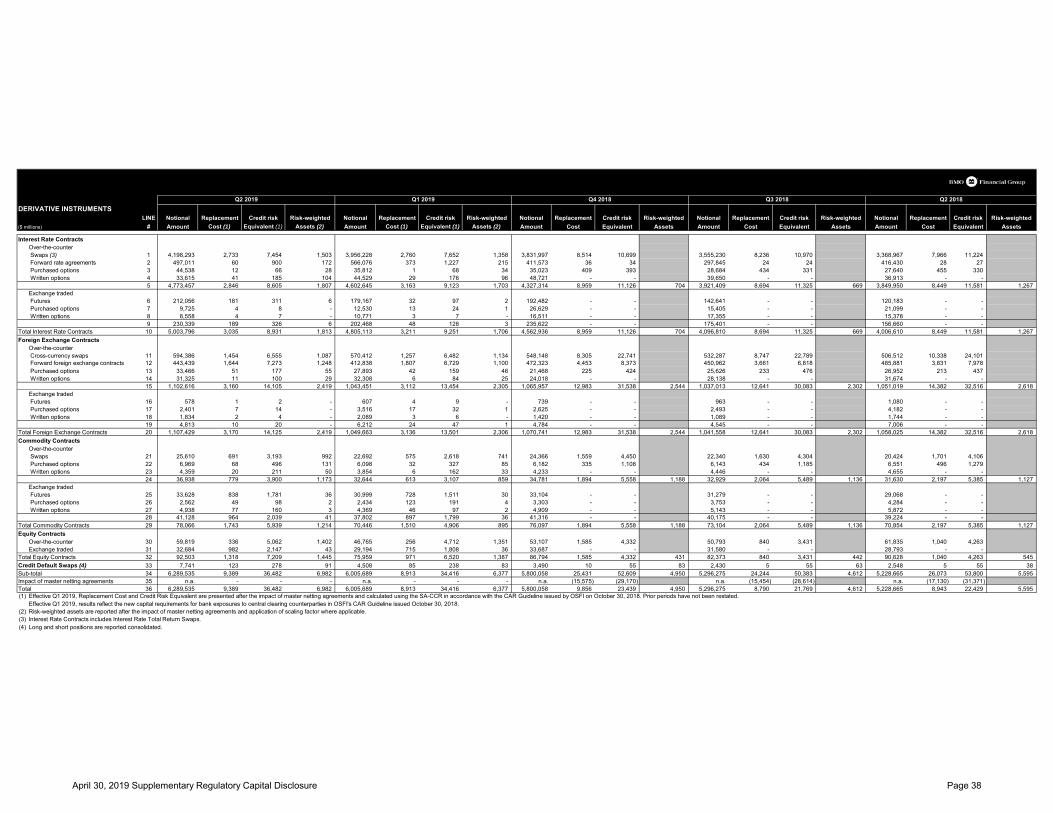
DERIVATIVE INSTRUMENTSLINE Notional Replacement Credit risk Risk-weighted Notional Replacement Credit risk Risk-weighted Notional Replacement Credit risk Risk-weighted Notional Replacement Credit risk Risk-weighted Notional Replacement Credit risk Risk-weighted
($ millions) # Amount Cost (1) Equivalent (1) Assets (2) Amount Cost (1) Equivalent (1) Assets (2) Amount Cost Equivalent Assets Amount Cost Equivalent Assets Amount Cost Equivalent Assets
Interest Rate ContractsOver-the-counter Swaps (3) 1 4,198,293 2,733 7,454 1,503 3,956,228 2,760 7,652 1,358 3,831,997 8,514 10,699 3,555,230 8,236 10,970 3,368,967 7,966 11,224 Forward rate agreements 2 497,011 60 900 172 566,076 373 1,227 215 411,573 36 34 297,845 24 24 416,430 28 27 Purchased options 3 44,538 12 66 28 35,812 1 68 34 35,023 409 393 28,684 434 331 27,640 455 330 Written options 4 33,615 41 185 104 44,529 29 176 96 48,721 - - 39,650 - - 36,913 - -
5 4,773,457 2,846 8,605 1,807 4,602,645 3,163 9,123 1,703 4,327,314 8,959 11,126 704 3,921,409 8,694 11,325 669 3,849,950 8,449 11,581 1,267 Exchange traded Futures 6 212,056 181 311 6 179,167 32 97 2 192,482 - - 142,641 - - 120,183 - - Purchased options 7 9,725 4 8 - 12,530 13 24 1 26,629 - - 15,405 - - 21,099 - - Written options 8 8,558 4 7 - 10,771 3 7 - 16,511 - - 17,355 - - 15,378 - -
9 230,339 189 326 6 202,468 48 128 3 235,622 - - 175,401 - - 156,660 - - Total Interest Rate Contracts 10 5,003,796 3,035 8,931 1,813 4,805,113 3,211 9,251 1,706 4,562,936 8,959 11,126 704 4,096,810 8,694 11,325 669 4,006,610 8,449 11,581 1,267 Foreign Exchange Contracts
Over-the-counter Cross-currency swaps 11 594,386 1,454 6,555 1,087 570,412 1,257 6,482 1,134 548,148 8,305 22,741 532,287 8,747 22,789 506,512 10,338 24,101
Forward foreign exchange contracts 12 443,439 1,644 7,273 1,248 412,838 1,807 6,729 1,100 472,323 4,453 8,373 450,962 3,661 6,818 485,881 3,831 7,978 Purchased options 13 33,466 51 177 55 27,893 42 159 46 21,468 225 424 25,626 233 476 26,952 213 437 Written options 14 31,325 11 100 29 32,308 6 84 25 24,018 - - 28,138 - - 31,674 - -
15 1,102,616 3,160 14,105 2,419 1,043,451 3,112 13,454 2,305 1,065,957 12,983 31,538 2,544 1,037,013 12,641 30,083 2,302 1,051,019 14,382 32,516 2,618 Exchange traded Futures 16 578 1 2 - 607 4 9 - 739 - - 963 - - 1,080 - - Purchased options 17 2,401 7 14 - 3,516 17 32 1 2,625 - - 2,493 - - 4,182 - - Written options 18 1,834 2 4 - 2,089 3 6 - 1,420 - - 1,089 - - 1,744 - -
19 4,813 10 20 - 6,212 24 47 1 4,784 - - 4,545 - - 7,006 - - Total Foreign Exchange Contracts 20 1,107,429 3,170 14,125 2,419 1,049,663 3,136 13,501 2,306 1,070,741 12,983 31,538 2,544 1,041,558 12,641 30,083 2,302 1,058,025 14,382 32,516 2,618 Commodity Contracts
Over-the-counter Swaps 21 25,610 691 3,193 992 22,692 575 2,618 741 24,366 1,559 4,450 22,340 1,630 4,304 20,424 1,701 4,106 Purchased options 22 6,969 68 496 131 6,098 32 327 85 6,182 335 1,108 6,143 434 1,185 6,551 496 1,279 Written options 23 4,359 20 211 50 3,854 6 162 33 4,233 - - 4,446 - - 4,655 - -
24 36,938 779 3,900 1,173 32,644 613 3,107 859 34,781 1,894 5,558 1,188 32,929 2,064 5,489 1,136 31,630 2,197 5,385 1,127 Exchange traded Futures 25 33,628 838 1,781 36 30,999 728 1,511 30 33,104 - - 31,279 - - 29,068 - - Purchased options 26 2,562 49 98 2 2,434 123 191 4 3,303 - - 3,753 - - 4,284 - - Written options 27 4,938 77 160 3 4,369 46 97 2 4,909 - - 5,143 - - 5,872 - -
28 41,128 964 2,039 41 37,802 897 1,799 36 41,316 - - 40,175 - - 39,224 - - Total Commodity Contracts 29 78,066 1,743 5,939 1,214 70,446 1,510 4,906 895 76,097 1,894 5,558 1,188 73,104 2,064 5,489 1,136 70,854 2,197 5,385 1,127 Equity Contracts
Over-the-counter 30 59,819 336 5,062 1,402 46,765 256 4,712 1,351 53,107 1,585 4,332 50,793 840 3,431 61,835 1,040 4,263 Exchange traded 31 32,684 982 2,147 43 29,194 715 1,808 36 33,687 - - 31,580 - - 28,793 - -
Total Equity Contracts 32 92,503 1,318 7,209 1,445 75,959 971 6,520 1,387 86,794 1,585 4,332 431 82,373 840 3,431 442 90,628 1,040 4,263 545 Credit Default Swaps (4) 33 7,741 123 278 91 4,508 85 238 83 3,490 10 55 83 2,430 5 55 63 2,548 5 55 38 Sub-total 34 6,289,535 9,389 36,482 6,982 6,005,689 8,913 34,416 6,377 5,800,058 25,431 52,609 4,950 5,296,275 24,244 50,383 4,612 5,228,665 26,073 53,800 5,595 Impact of master netting agreements 35 n.a. - - - n.a. - - - n.a. (15,575) (29,170) n.a. (15,454) (28,614) n.a. (17,130) (31,371) Total 36 6,289,535 9,389 36,482 6,982 6,005,689 8,913 34,416 6,377 5,800,058 9,856 23,439 4,950 5,296,275 8,790 21,769 4,612 5,228,665 8,943 22,429 5,595 (1) Effective Q1 2019, Replacement Cost and Credit Risk Equivalent are presented after the impact of master netting agreements and calculated using the SA-CCR in accordance with the CAR Guideline issued by OSFI on October 30, 2018. Prior periods have not been restated.
Effective Q1 2019, results reflect the new capital requirements for bank exposures to central clearing counterparties in OSFI's CAR Guideline issued October 30, 2018.(2) Risk-weighted assets are reported after the impact of master netting agreements and application of scaling factor where applicable.(3) Interest Rate Contracts includes Interest Rate Total Return Swaps.(4) Long and short positions are reported consolidated.
Q2 2019 Q1 2019 Q4 2018 Q3 2018 Q2 2018
April 30, 2019 Supplementary Regulatory Capital Disclosure Page 38

SEC1 - SECURITIZATION EXPOSURES IN THE BANKING BOOK (1)
Traditional Synthetic Sub-total Traditional Synthetic Sub-total Traditional Synthetic Sub-total($ millions) a b c e f g i j k
1 Total retail, of which: 3,602 - 3,602 10,555 - 10,555 - - -2 Residential mortgage (2) 975 - 975 2,791 - 2,791 - - -3 Credit card 2,153 - 2,153 965 - 965 - - -4 Other retail exposures 474 - 474 6,799 - 6,799 - - -5 Re-securitization - - - - - - - - -6 Total wholesale, of which: 50 5,579 5,629 6,170 - 6,170 8 - 87 Loans to corporates 50 5,579 5,629 211 - 211 - - -8 Commercial mortgage - - - - - - - - -9 Lease and receivables - - - 5,468 - 5,468 - - -
10 Other wholesale - - - 491 - 491 8 - 811 Re-securitization - - - - - - - - -
SEC1 - SECURITIZATION EXPOSURES IN THE BANKING BOOK (1)
Traditional Synthetic Sub-total Traditional Synthetic Sub-total Traditional Synthetic Sub-total($ millions) a b c e f g i j k
1 Total retail, of which: 4,225 - 4,225 10,239 - 10,239 - - -2 Residential mortgage (2) 1,024 - 1,024 2,324 - 2,324 - - -3 Credit card 2,204 - 2,204 729 - 729 - - -4 Other retail exposures 997 - 997 7,186 - 7,186 - - -5 Re-securitization - - - - - - - - -6 Total wholesale, of which: 49 5,786 5,835 6,127 - 6,127 8 - 87 Loans to corporates 49 5,786 5,835 207 - 207 - - -8 Commercial mortgage - - - - - - - - -9 Lease and receivables - - - 5,432 - 5,432 - - -
10 Other wholesale - - - 488 - 488 8 - 811 Re-securitization - - - - - - - - -
SEC1 - SECURITIZATION EXPOSURES IN THE BANKING BOOK (1)
Traditional Synthetic Sub-total Traditional Synthetic Sub-total Traditional Synthetic Sub-total($ millions) a b c e f g i j k
1 Total retail, of which: 4,110 - 4,110 10,298 - 10,298 - - -2 Residential mortgage (2) 1,079 - 1,079 2,803 - 2,803 - - -3 Credit card 1,873 - 1,873 731 - 731 - - -4 Other retail exposures 1,158 - 1,158 6,764 - 6,764 - - -5 Re-securitization - - - - - - - - -6 Total wholesale, of which: 49 4,417 4,466 6,273 - 6,273 8 - 87 Loans to corporates 49 4,417 4,466 207 - 207 - - -8 Commercial mortgage - - - - - - - - -9 Lease and receivables - - - 5,578 - 5,578 - - -
10 Other wholesale - - - 488 - 488 8 - 811 Re-securitization - - - - - - - - -(1) The amounts disclosed represent the carrying value of securitization exposures in the banking book, including securitization exposures where the criteria for recognition of risk transference are not met.
As at April 30, 2019, $379 million ($978 million at January 31, 2019 and $1,106 million at October 31, 2018) of securitization exposures did not qualify for risk transference. The table excludes securitization-related assets of $8,384 million at April 30, 2019 ($6,542 million at January 31, 2019 and $5,977 million at October 31, 2018) that are not subject to capital requirements but consolidated on the balance sheet for accounting purposes.
(2) Excludes mortgage-backed securities that do not involve the tranching of credit risk (e.g. NHA MBS) which are not considered securitizations as per OSFI's CAR Guideline, Chapter 7, Structured Credit Products.
Q1 2019Bank acts as originator Bank acts as sponsor Bank acts as investor
Q4 2018Bank acts as originator Bank acts as sponsor Bank acts as investor
Q2 2019Bank acts as originator Bank acts as sponsor Bank acts as investor
April 30, 2019 Supplementary Regulatory Capital Disclosure Page 39

SEC2 - SECURITIZATION EXPOSURES IN THE TRADING BOOK
Traditional Synthetic Sub-total Traditional Synthetic Sub-total Traditional Synthetic Sub-total($ millions) a b c e f g i j k
1 Total retail, of which: - - - - - - 252 - 2522 Residential mortgage - - - - - - 80 - 803 Credit card - - - - - - 51 - 514 Auto loans/leases - - - - - - 105 - 1055 Student loans - - - - - - 14 - 146 Other retail exposures - - - - - - 2 - 27 Re-securitization - - - - - - - - -8 Total wholesale, of which: - - - - - - 140 - 1409 Loans to corporates - - - - - - - - -10 Commercial mortgage - - - - - - 47 - 4711 Lease and receivables - - - - - - 59 - 5912 Auto floorplan - - - - - - 6 - 613 Insurance premium - - - - - - - - -14 Other wholesale - - - - - - 28 - 2815 Re-securitization - - - - - - - - -
SEC2 - SECURITIZATION EXPOSURES IN THE TRADING BOOK
Traditional Synthetic Sub-total Traditional Synthetic Sub-total Traditional Synthetic Sub-total($ millions) a b c e f g i j k
1 Total retail, of which: - - - - - - 371 - 3712 Residential mortgage - - - - - - 61 - 613 Credit card - - - - - - 83 - 834 Auto loans/leases - - - - - - 210 - 2105 Student loans - - - - - - 7 - 76 Other retail exposures - - - - - - 10 - 107 Re-securitization - - - - - - - - -8 Total wholesale, of which: - - - - - - 128 - 1289 Loans to corporates - - - - - - 12 - 1210 Commercial mortgage - - - - - - 19 - 1911 Lease and receivables - - - - - - 46 - 4612 Auto floorplan - - - - - - 4 - 413 Insurance premium - - - - - - - - -14 Other wholesale - - - - - - 47 - 4715 Re-securitization - - - - - - - - -
SEC2 - SECURITIZATION EXPOSURES IN THE TRADING BOOK
Traditional Synthetic Sub-total Traditional Synthetic Sub-total Traditional Synthetic Sub-total($ millions) a b c e f g i j k
1 Total retail, of which: - - - - - - 282 - 2822 Residential mortgage - - - - - - 32 - 323 Credit card - - - - - - 126 - 1264 Auto loans/leases - - - - - - 113 - 1135 Student loans - - - - - - 10 - 106 Other retail exposures - - - - - - 1 - 17 Re-securitization - - - - - - - - -8 Total wholesale, of which: - - - - - - 87 - 879 Loans to corporates - - - - - - 15 - 1510 Commercial mortgage - - - - - - - - -11 Lease and receivables - - - - - - 35 - 3512 Auto floorplan - - - - - - 24 - 2413 Insurance premium - - - - - - 7 - 714 Other wholesale - - - - - - 6 - 615 Re-securitization - - - - - - - - -
Q1 2019Bank acts as originator Bank acts as sponsor Bank acts as investor
Q2 2019Bank acts as originator Bank acts as sponsor Bank acts as investor
Q4 2018Bank acts as originator Bank acts as sponsor Bank acts as investor
April 30, 2019 Supplementary Regulatory Capital Disclosure Page 40

SEC3 - SECURITIZATION EXPOSURES IN THE BANKING BOOK AND ASSOCIATED CAPITAL REQUIREMENTS (BANK ACTING AS ORIGINATOR OR AS SPONSOR) (1) (2)
≤20% >20% to 50% >50% to 100% >100% to <1250% 1250% RW SEC-IRBA
SEC-ERBA, including IAA SEC-SA 1250% SEC-IRBA
SEC-ERBA, including IAA SEC-SA 1250% SEC-IRBA
SEC-ERBA, including IAA SEC-SA 1250%
($ millions) a b c d e f g h i j k l m n o p q
1 Total exposures 22,802 2,043 1 28 58 22,006 2,156 770 - 3,197 216 719 - 251 18 57 -2 Traditional securitization 17,875 2,043 1 28 51 17,072 2,156 770 - 2,365 216 719 - 184 18 57 -3 Of which securitization 17,875 2,043 1 28 51 17,072 2,156 770 - 2,365 216 719 - 184 18 57 -4 Of which retail underlying 11,873 1,835 1 18 51 11,572 2,156 50 - 1,624 216 626 - 127 18 50 -5 Of which wholesale 6,002 208 - 10 - 5,500 - 720 - 741 - 93 - 57 - 7 -6 Of which re-securitization - - - - - - - - - - - - - - - - -7 Of which senior - - - - - - - - - - - - - - - - -8 Of which non-senior - - - - - - - - - - - - - - - - -9 Synthetic securitization 4,927 - - - 7 4,934 - - - 832 - - - 67 - - -10 Of which securitization 4,927 - - - 7 4,934 - - - 832 - - - 67 - - -11 Of which retail underlying - - - - - - - - - - - - - - - - -12 Of which wholesale 4,927 - - - 7 4,934 - - - 832 - - - 67 - - -13 Of which re-securitization - - - - - - - - - - - - - - - - -14 Of which senior - - - - - - - - - - - - - - - - -15 Of which non-senior - - - - - - - - - - - - - - - - -
SEC3 - SECURITIZATION EXPOSURES IN THE BANKING BOOK AND ASSOCIATED CAPITAL REQUIREMENTS (BANK ACTING AS ORIGINATOR OR AS SPONSOR) (1) (2)
≤20% >20% to 50% >50% to 100% >100% to <1250% 1250% RW SEC-IRBA
SEC-ERBA, including IAA SEC-SA 1250% SEC-IRBA
SEC-ERBA, including IAA SEC-SA 1250% SEC-IRBA
SEC-ERBA, including IAA SEC-SA 1250%
($ millions) a b c d e f g h i j k l m n o p q
1 Total exposures 22,770 1,971 19 62 6 21,888 2,207 733 - 3,696 221 336 - 255 18 27 -2 Traditional securitization 17,644 1,971 19 58 - 16,752 2,207 733 - 2,798 221 336 - 183 18 27 -3 Of which securitization 17,644 1,971 19 58 - 16,752 2,207 733 - 2,798 221 336 - 183 18 27 -4 Of which retail underlying 11,900 1,592 1 23 - 11,289 2,207 20 - 1,947 221 244 - 118 18 20 -5 Of which wholesale 5,744 379 18 35 - 5,463 - 713 - 851 - 92 - 65 - 7 -6 Of which re-securitization - - - - - - - - - - - - - - - - -7 Of which senior - - - - - - - - - - - - - - - - -8 Of which non-senior - - - - - - - - - - - - - - - - -9 Synthetic securitization 5,126 - - 4 6 5,136 - - - 898 - - - 72 - - -10 Of which securitization 5,126 - - 4 6 5,136 - - - 898 - - - 72 - - -11 Of which retail underlying - - - - - - - - - - - - - - - - -12 Of which wholesale 5,126 - - 4 6 5,136 - - - 898 - - - 72 - - -13 Of which re-securitization - - - - - - - - - - - - - - - - -14 Of which senior - - - - - - - - - - - - - - - - -15 Of which non-senior - - - - - - - - - - - - - - - - -
SEC3 - SECURITIZATION EXPOSURES IN THE BANKING BOOK AND ASSOCIATED CAPITAL REQUIREMENTS (BANK ACTING AS ORIGINATOR OR AS SPONSOR) (1)
≤20% >20% to 50% >50% to 100% >100% to <1250% 1250% RW
IRB RBA (including
IAA) IRB SFA SA/SSFA 1250%
IRB RBA (including
IAA) IRB SFA SA/SSFA 1250%
IRB RBA (including
IAA) IRB SFA SA/SSFA 1250% ($ millions) a b c d e f g h i j k l m n o p q
1 Total exposures 23,487 55 2 3 39 3,004 20,582 - - 529 1,775 - - 43 148 - -2 Traditional securitization 19,571 20 2 3 29 3,004 16,621 - - 529 1,364 - - 43 115 - -3 Of which securitization 19,571 20 2 3 29 3,004 16,621 - - 529 1,364 - - 43 115 - -4 Of which retail underlying 13,254 20 2 2 24 3,004 10,298 - - 529 803 - - 43 68 - -5 Of which wholesale 6,317 - - 1 5 - 6,323 - - - 561 - - - 47 - -6 Of which re-securitization - - - - - - - - - - - - - - - - -7 Of which senior - - - - - - - - - - - - - - - - -8 Of which non-senior - - - - - - - - - - - - - - - - -9 Synthetic securitization 3,916 35 - - 10 - 3,961 - - - 411 - - - 33 - -10 Of which securitization 3,916 35 - - 10 - 3,961 - - - 411 - - - 33 - -11 Of which retail underlying - - - - - - - - - - - - - - - - -12 Of which wholesale 3,916 35 - - 10 - 3,961 - - - 411 - - - 33 - -13 Of which re-securitization - - - - - - - - - - - - - - - - -14 Of which senior - - - - - - - - - - - - - - - - -15 Of which non-senior - - - - - - - - - - - - - - - - -(1) Only includes securitization exposures where the risk transference recognition criteria are met in accordance with OSFI’s CAR Guidelines, Chapter 7, Structured Credit Products. (2) Effective Q1 2019, securitization capital requirements are calculated in accordance with new securitization framework in OSFI’s CAR Guideline issued October 30, 2018.(3) Exposure amounts are net of collateral. (4) RWA before application of the KIRB cap.
Exposure values by RW bands (3) Exposure values by regulatory approach (3) RWA by regulatory approach (4) Capital charge after cap
Exposure values by RW bands (3) Exposure values by regulatory approach (3) RWA by regulatory approach (4) Capital charge after cap
Q2 2019Exposure values by RW bands (3) Exposure values by regulatory approach (3) RWA by regulatory approach (4) Capital charge after cap
Q4 2018
Q1 2019
April 30, 2019 Supplementary Regulatory Capital Disclosure Page 41

SEC4 - SECURITIZATION EXPOSURES IN THE BANKING BOOK AND ASSOCIATED CAPITAL REQUIREMENTS (BANK ACTING AS INVESTOR) (1) (2)
≤20% >20% to 50% >50% to 100% >100% to <1250% 1250% RW SEC-IRBA
SEC-ERBA, including IAA SEC-SA 1250% SEC-IRBA
SEC-ERBA, including IAA SEC-SA 1250% SEC-IRBA
SEC-ERBA, including IAA SEC-SA 1250%
($ millions) a b c d e f g h i j k l m n o p q
1 Total exposures - - 8 - - - 8 - - - 5 - - - - - -2 Traditional securitization - - 8 - - - 8 - - - 5 - - - - - -3 Of which securitization - - 8 - - - 8 - - - 5 - - - - - -4 Of which retail underlying - - - - - - - - - - - - - - - - -5 Of which wholesale - - 8 - - - 8 - - - 5 - - - - - -6 Of which re-securitization - - - - - - - - - - - - - - - - -7 Of which senior - - - - - - - - - - - - - - - - -8 Of which non-senior - - - - - - - - - - - - - - - - -9 Synthetic securitization - - - - - - - - - - - - - - - - -10 Of which securitization - - - - - - - - - - - - - - - - -11 Of which retail underlying - - - - - - - - - - - - - - - - -12 Of which wholesale - - - - - - - - - - - - - - - - -13 Of which re-securitization - - - - - - - - - - - - - - - - -14 Of which senior - - - - - - - - - - - - - - - - -15 Of which non-senior - - - - - - - - - - - - - - - - -
SEC4 - SECURITIZATION EXPOSURES IN THE BANKING BOOK AND ASSOCIATED CAPITAL REQUIREMENTS (BANK ACTING AS INVESTOR) (1)
≤20% >20% to 50% >50% to 100% >100% to <1250% 1250% RW
IRB RBA (including
IAA) IRB SFA SA/SSFA 1250%
IRB RBA (including
IAA) IRB SFA SA/SSFA 1250%
IRB RBA (including
IAA) IRB SFA SA/SSFA 1250% ($ millions) a b c d e f g h i j k l m n o p q
1 Total exposures 8 - - - - 8 - - - 1 - - - 1 - - -2 Traditional securitization 8 - - - - 8 - - - 1 - - - 1 - - -3 Of which securitization 8 - - - - 8 - - - 1 - - - 1 - - -4 Of which retail underlying - - - - - - - - - - - - - - - - -5 Of which wholesale 8 - - - - 8 - - - 1 - - - 1 - - -6 Of which re-securitization - - - - - - - - - - - - - - - - -7 Of which senior - - - - - - - - - - - - - - - - -8 Of which non-senior - - - - - - - - - - - - - - - - -9 Synthetic securitization - - - - - - - - - - - - - - - - -10 Of which securitization - - - - - - - - - - - - - - - - -11 Of which retail underlying - - - - - - - - - - - - - - - - -12 Of which wholesale - - - - - - - - - - - - - - - - -13 Of which re-securitization - - - - - - - - - - - - - - - - -14 Of which senior - - - - - - - - - - - - - - - - -15 Of which non-senior - - - - - - - - - - - - - - - - -(1) Only includes securitization exposures where the risk transference recognition criteria are met in accordance with OSFI’s CAR Guidelines, Chapter 7, Structured Credit Products. (2) Effective Q1 2019, securitization capital requirements are calculated in accordance with new securitization framework in OSFI’s CAR Guideline issued October 30, 2018.(3) Exposure amounts are net of collateral. (4) RWA before application of the KIRB cap.
Q1 2019Exposure values by RW bands (3) Exposure values by regulatory approach (3) RWA by regulatory approach (4) Capital charge after cap
Q4 2018Exposure values by RW bands (3) Exposure values by regulatory approach (3) RWA by regulatory approach (4) Capital charge after cap
Q2 2019Exposure values by RW bands (3) Exposure values by regulatory approach (3) RWA by regulatory approach (4) Capital charge after cap
April 30, 2019 Supplementary Regulatory Capital Disclosure Page 42

MARKET RISK RISK-WEIGHTED ASSETS (RWA) MOVEMENT BY KEY DRIVERS LINE 2019 2019 2018 2018 2018
($ millions) # Q2 Q1 Q4 Q3 Q2
Market Risk RWA, beginning of quarter 1 14,820 13,532 11,097 10,415 9,816 Movement in risk levels (1) 2 (1,993) 1,615 (980) 1,643 569 Model updates (2) 3 - - 399 44 - Methodology and policy (3) 4 (495) (327) (178) (1,005) 30 Acquisition and disposals 5 - - 3,194 - - Foreign exchange movement and others 6 - - - - - Market Risk RWA, end of quarter 7 12,332 14,820 13,532 11,097 10,415 (1) Movement in risk levels includes changes in exposures and market movements.(2) Model updates includes updates to risk models to reflect recent experience and changes in model scope.(3) Methodology and policy includes methodology changes to the calculations driven by regulatory policy changes, such as new or revised regulation.
April 30, 2019 Supplementary Regulatory Capital Disclosure Page 43
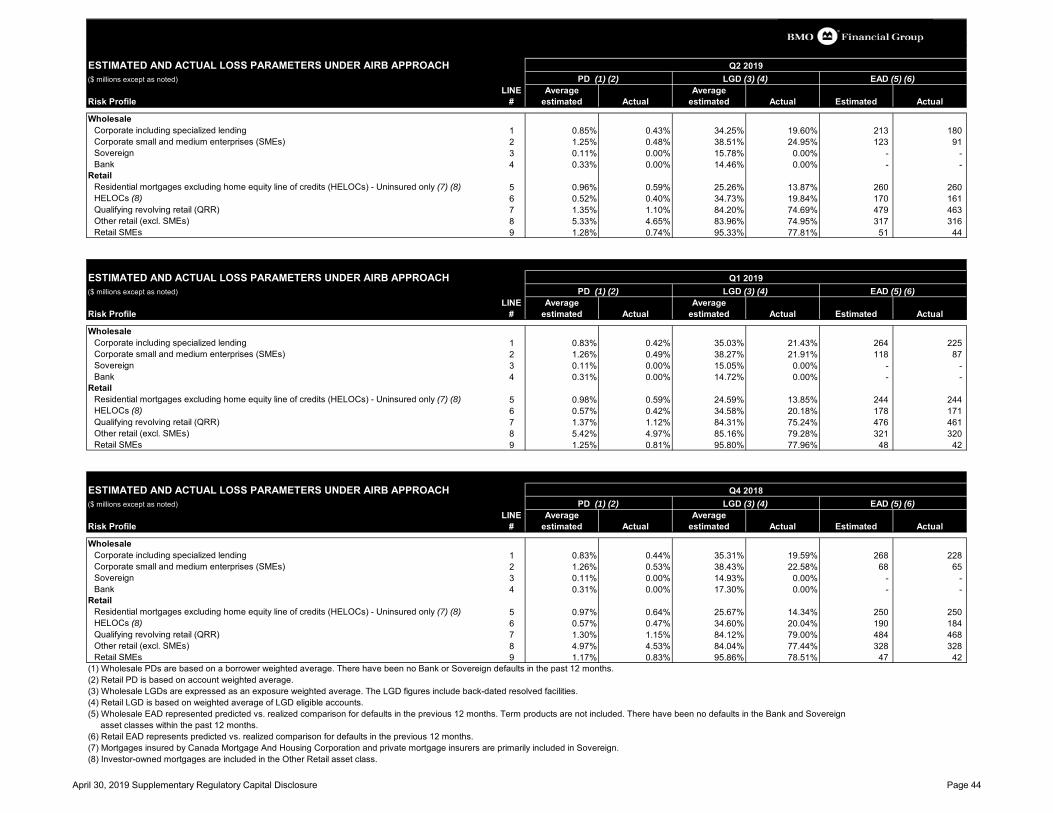
ESTIMATED AND ACTUAL LOSS PARAMETERS UNDER AIRB APPROACH($ millions except as noted)
Risk ProfileLINE
#Average
estimated ActualAverage
estimated Actual Estimated Actual
WholesaleCorporate including specialized lending 1 0.85% 0.43% 34.25% 19.60% 213 180 Corporate small and medium enterprises (SMEs) 2 1.25% 0.48% 38.51% 24.95% 123 91 Sovereign 3 0.11% 0.00% 15.78% 0.00% - - Bank 4 0.33% 0.00% 14.46% 0.00% - -
Retail Residential mortgages excluding home equity line of credits (HELOCs) - Uninsured only (7) (8) 5 0.96% 0.59% 25.26% 13.87% 260 260 HELOCs (8) 6 0.52% 0.40% 34.73% 19.84% 170 161 Qualifying revolving retail (QRR) 7 1.35% 1.10% 84.20% 74.69% 479 463 Other retail (excl. SMEs) 8 5.33% 4.65% 83.96% 74.95% 317 316 Retail SMEs 9 1.28% 0.74% 95.33% 77.81% 51 44
ESTIMATED AND ACTUAL LOSS PARAMETERS UNDER AIRB APPROACH($ millions except as noted)
Risk ProfileLINE
#Average
estimated ActualAverage
estimated Actual Estimated Actual
WholesaleCorporate including specialized lending 1 0.83% 0.42% 35.03% 21.43% 264 225 Corporate small and medium enterprises (SMEs) 2 1.26% 0.49% 38.27% 21.91% 118 87 Sovereign 3 0.11% 0.00% 15.05% 0.00% - - Bank 4 0.31% 0.00% 14.72% 0.00% - -
Retail Residential mortgages excluding home equity line of credits (HELOCs) - Uninsured only (7) (8) 5 0.98% 0.59% 24.59% 13.85% 244 244 HELOCs (8) 6 0.57% 0.42% 34.58% 20.18% 178 171 Qualifying revolving retail (QRR) 7 1.37% 1.12% 84.31% 75.24% 476 461 Other retail (excl. SMEs) 8 5.42% 4.97% 85.16% 79.28% 321 320 Retail SMEs 9 1.25% 0.81% 95.80% 77.96% 48 42
ESTIMATED AND ACTUAL LOSS PARAMETERS UNDER AIRB APPROACH($ millions except as noted)
Risk ProfileLINE
#Average
estimated ActualAverage
estimated Actual Estimated Actual
WholesaleCorporate including specialized lending 1 0.83% 0.44% 35.31% 19.59% 268 228 Corporate small and medium enterprises (SMEs) 2 1.26% 0.53% 38.43% 22.58% 68 65 Sovereign 3 0.11% 0.00% 14.93% 0.00% - - Bank 4 0.31% 0.00% 17.30% 0.00% - -
Retail Residential mortgages excluding home equity line of credits (HELOCs) - Uninsured only (7) (8) 5 0.97% 0.64% 25.67% 14.34% 250 250 HELOCs (8) 6 0.57% 0.47% 34.60% 20.04% 190 184 Qualifying revolving retail (QRR) 7 1.30% 1.15% 84.12% 79.00% 484 468 Other retail (excl. SMEs) 8 4.97% 4.53% 84.04% 77.44% 328 328 Retail SMEs 9 1.17% 0.83% 95.86% 78.51% 47 42
(1) Wholesale PDs are based on a borrower weighted average. There have been no Bank or Sovereign defaults in the past 12 months.(2) Retail PD is based on account weighted average.(3) Wholesale LGDs are expressed as an exposure weighted average. The LGD figures include back-dated resolved facilities.(4) Retail LGD is based on weighted average of LGD eligible accounts.(5) Wholesale EAD represented predicted vs. realized comparison for defaults in the previous 12 months. Term products are not included. There have been no defaults in the Bank and Sovereign
asset classes within the past 12 months.(6) Retail EAD represents predicted vs. realized comparison for defaults in the previous 12 months.(7) Mortgages insured by Canada Mortgage And Housing Corporation and private mortgage insurers are primarily included in Sovereign.(8) Investor-owned mortgages are included in the Other Retail asset class.
Q4 2018PD (1) (2) LGD (3) (4) EAD (5) (6)
Q2 2019PD (1) (2) LGD (3) (4) EAD (5) (6)
Q1 2019PD (1) (2) LGD (3) (4) EAD (5) (6)
April 30, 2019 Supplementary Regulatory Capital Disclosure Page 44
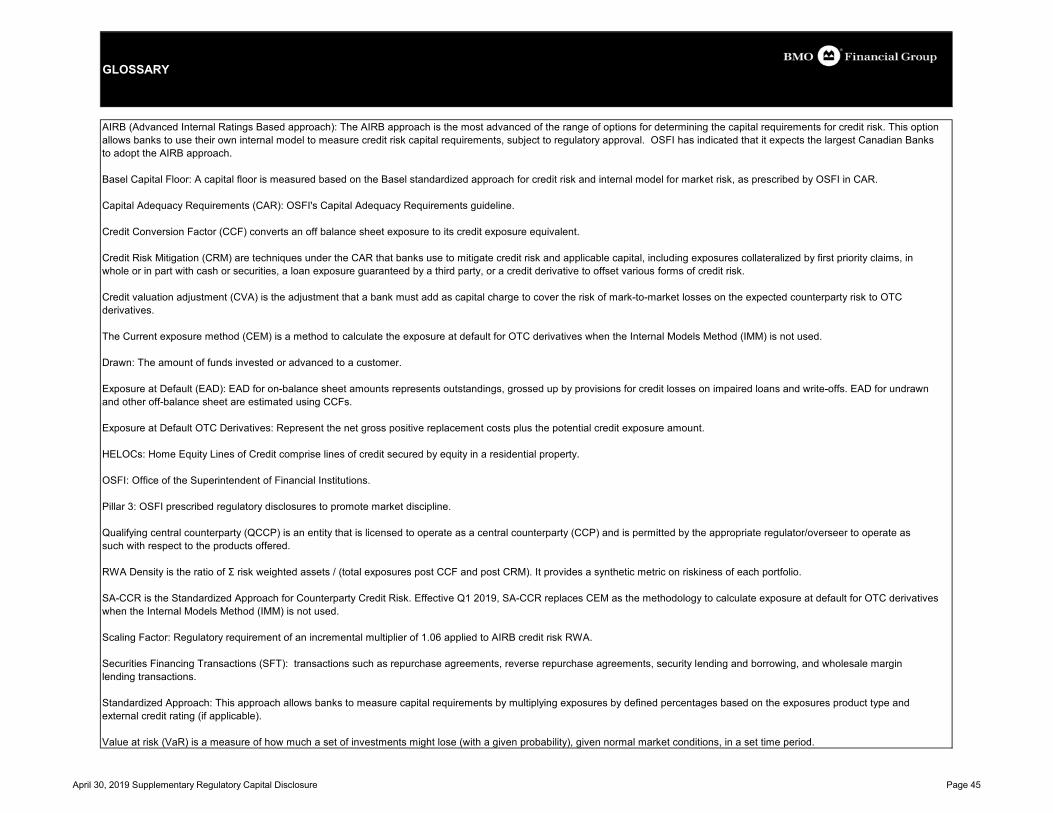
2
GLOSSARY
AIRB (Advanced Internal Ratings Based approach): The AIRB approach is the most advanced of the range of options for determining the capital requirements for credit risk. This option allows banks to use their own internal model to measure credit risk capital requirements, subject to regulatory approval. OSFI has indicated that it expects the largest Canadian Banksto adopt the AIRB approach.
Basel Capital Floor: A capital floor is measured based on the Basel standardized approach for credit risk and internal model for market risk, as prescribed by OSFI in CAR.
Capital Adequacy Requirements (CAR): OSFI's Capital Adequacy Requirements guideline.
Credit Conversion Factor (CCF) converts an off balance sheet exposure to its credit exposure equivalent.
Credit Risk Mitigation (CRM) are techniques under the CAR that banks use to mitigate credit risk and applicable capital, including exposures collateralized by first priority claims, in whole or in part with cash or securities, a loan exposure guaranteed by a third party, or a credit derivative to offset various forms of credit risk.
Credit valuation adjustment (CVA) is the adjustment that a bank must add as capital charge to cover the risk of mark-to-market losses on the expected counterparty risk to OTCderivatives.
The Current exposure method (CEM) is a method to calculate the exposure at default for OTC derivatives when the Internal Models Method (IMM) is not used.
Drawn: The amount of funds invested or advanced to a customer.
Exposure at Default (EAD): EAD for on-balance sheet amounts represents outstandings, grossed up by provisions for credit losses on impaired loans and write-offs. EAD for undrawn and other off-balance sheet are estimated using CCFs.
Exposure at Default OTC Derivatives: Represent the net gross positive replacement costs plus the potential credit exposure amount.
HELOCs: Home Equity Lines of Credit comprise lines of credit secured by equity in a residential property.
OSFI: Office of the Superintendent of Financial Institutions.
Pillar 3: OSFI prescribed regulatory disclosures to promote market discipline.
Qualifying central counterparty (QCCP) is an entity that is licensed to operate as a central counterparty (CCP) and is permitted by the appropriate regulator/overseer to operate as such with respect to the products offered.
RWA Density is the ratio of Σ risk weighted assets / (total exposures post CCF and post CRM). It provides a synthetic metric on riskiness of each portfolio.
SA-CCR is the Standardized Approach for Counterparty Credit Risk. Effective Q1 2019, SA-CCR replaces CEM as the methodology to calculate exposure at default for OTC derivatives when the Internal Models Method (IMM) is not used.
Scaling Factor: Regulatory requirement of an incremental multiplier of 1.06 applied to AIRB credit risk RWA.
Securities Financing Transactions (SFT): transactions such as repurchase agreements, reverse repurchase agreements, security lending and borrowing, and wholesale margin lending transactions.
Standardized Approach: This approach allows banks to measure capital requirements by multiplying exposures by defined percentages based on the exposures product type and external credit rating (if applicable).
Value at risk (VaR) is a measure of how much a set of investments might lose (with a given probability), given normal market conditions, in a set time period.
April 30, 2019 Supplementary Regulatory Capital Disclosure Page 45