supplementary material precise tuning of the ...10.1038/s41598-017... · 1 supplementary material...
TRANSCRIPT

1
Supplementary Material
Precise Tuning of the Nanostructured Surface leading to the
Luminescence Enhancement in SrAl2O4 Based Core/Shell Structure
Rocío Estefanía Rojas-Hernandeza* , Fernando Rubio-Marcosa, Aida Serrano,b, Adolfo del Campoa,
José Francisco Fernandez a
a Electroceramic Department, Instituto de Cerámica y Vidrio, CSIC, Kelsen 5, 28049, Madrid, Spain.
b SpLine, Spanish CRG Beamline at the ESRF,F-38043 Grenoble, Cedex 09 France and Instituto de Ciencia de Materiales de Madrid, CSIC,
Cantoblanco, 28049, Madrid, Spain
* Corresponding author: Tlf: +34 91 735 58 40; Ext 1074. Fax: +34 91 735 58 43. E-mail address: [email protected] (R.E. Rojas-
Hernandez)

2
Supplementary Information 1: The chemical composition of the commercial powder was determined by X-ray Fluorescence (XRF). X-ray
fluorescence analyses were carried out using a Spectrometer (Model MagiX PW 2424, Philips, Eindhoven,
Netherlands) with rhodium X-ray tube, 2.4 kW generator, and five-position crystal charger. The spectrometer is
also equipped with the IQ analytical software for analysis, which includes fundamental parameters for
interelemental correction calculations. The operating conditions were LIF200 and PE analyzing crystals, no
primary beam filter, 150 µm sample collimator, vacuum atmosphere, and flow-proportional and scintillation
detector. The content of all oxides was determined using the melting method with Li2B4O7. For that, 0.3 g of dry
samples and 5.5 g of Li2B4O7 were homogeneously mixed and placed inside a pellet box and were compacted
using a hydraulic press for 1 min at a pressure of 5.1 × 10³ kg. Pellets were stored inside desiccators to avoid
hydration from air humidity.
Analyzed Composition of commercial powder based on SrAl2O4:Eu,Dy (content of all oxides in wt. %) is
summarized in Table 1. This table collects composition of the powder, which was estimated by X-Ray
Fluorescence (XRF). ”
Table S1. Analyzed Composition of commercial powder based on SrAl2O4:Eu,Dy
Oxides Composition (wt%)
SrO 48.05
Al2O3 49.6
Eu2O3 1.47
Dy2O3 0.88
Supplementary Information 2:
The SrO-Al2O3 system is complex due to the larger number of polymorphic transformations that occur during the heat treatment. The optimization of the conditions of the synthesis is still a technological problem because of a lack of a synthesis procedure to provide a monophasic compound. Moreover, the stability domain is not restricted to a specific temperature range and the crystalline phases present during the synthesis change as
function of the kind of precursors and the synthesis route. Employing an α-alumina with an average particle size, d50 ≈ 6 µm using Al2O3 /SrO molar ratio of 1, it can be seen from XRD graph that the main phase formed is SrAl2O4 joined with strontium rich phase such Sr12Al14O33 as secondary phase. By SEM characterization it could be observed the growth of nanocrystals on the surface of the platelets. The morphology of the synthesized phase
retains the shape of the less soluble reactant, the alumina, so the reaction mechanism is related to the template mechanism formation, where the formation strontium aluminate phase initiates on the Al2O3 platelet surface. This type of mechanism is determined by the dissolution rate of the reactants in the molten salt, eutectic mixture (NaCl-KCl)e in this case the mobility of Sr2+ and Al3+ cations. The movement of Al3+ cations is insignificant regarding Sr2+ in the molten flux. The less diffusion of Sr2+ cations implies the formation of a nanostructured
SrAl2O4 coating on the Al2O3 platelet surface. This effect has been mainly described in metals to generate core–shell structure by coating a desired material or its precursor on the surface of the template and its well-known as Kirkendall-effect. This SrAl2O4 coating formation is associated with remains of Al2O3 that have not reacted. Therefore, initial SrCO3 has not been consumed during the reaction. This issue can be correlated to the formation
of the strontium rich phase, Sr12Al14O33. Therefore, in order to obtain mainly SrAl2O4, the optimization of Al2O3 /SrO ratio was evaluated.

3
Figure S1 shows the XRD difractograms of the synthesized powders using Al2O3/SrO molar ratio of 1, 1.25, 1.43, 1.66 and 2. The molar unit of strontium aluminate phase depends on the different sources of alumina and Al2O3 /SrO molar ratio. Here it is essential to note that the stoichiometric relation promotes the formation of the
strontium rich phase of SrO-Al2O3 system. However, the secondary phase, Sr12Al14O33, decreases when the content of SrO decreases. Therefore, the reduction of the SrO content in the nominal stoichiometric composition leads to promote SrAl2O4 phase formation, decreasing the quantity of raw materials, SrO and rare earths, in the synthesis.
Figure S1. XRD pattern of synthesized SrAl2O4:Eu, Dy phosphor heated at 1000ºC for 2 h in 90N2-10H2 atmosphere,
employing a salt/SrAl2O4 molar ratio of 3:1, as precursor alumina platelets with an average particle size, d50 ≈ 6 µm) and
using Al2O3 /SrO molar ratio of 1, 1.25, 1.43, 1.66 and 2.

4
Supplementary Information 3:
Figure S2. Raman-intensity depth profiles (blue line for 418 cm-1 Raman mode of Al2O3 and black line for the 467 cm-1
Raman mode of SrAl2O4:Eu, Dy) and Rayleigh light scattering (green line) along the laser incident direction for different samples (a) 6 µm Al2O3 ,particles. (b) Core-shell of SrAl2O4: Eu, Dy platelets by the molten salt method using Al2O3 /SrO molar ratio of 2 . (c) Agglomerates of SrAl2O4:Eu, Dy nanoparticles obtained from the molten salt method1 (d) As received Reference microparticle SrAl2O4:Eu, Dy from Jinan Chenghao Technology Co., Ltd SAO particles.
In order to understand the role of the morphology on the photoluminescence efficiency, a complementary Raman study was carried out. A correlation of Raman intensity signal with optical and emission properties has been observed. This information is valuable for discussion on light-emission mechanism of this material. To perform this study, four different type of particles were studied: alumina hexagonal platelets (mean particle
size: 6 µm); reference micro particle of SrAl2O4:Eu, Dy material which is formed by particles above 20 µm, core-shell of SrAl2O4:Eu, Dy platelets (mean particle size: 10 µm) and an agglomerate of SrAl2O4:Eu, Dy nanoparticles obtained by the molten salt method 1. Raman study was carried out by means depth Raman spectra to show how varying the Raman intensity of each peak inside the particles. The particles were dispersed and settled into a glass slide; Figure S2(a) shows the depth profile alumina platelets based on the intensity of the 418 cm-1 (blue line) and the laser peak (green line). The intensity of the Rayleigh
light scattering of the laser increases at the surface of the particle and decreases when the focal plane enters into the middle of the particle. After that a similar behaviour takes place when the laser goes through the half of the particle. Al2O3 absorbs the laser energy. Therefore, the intensity of the Rayleigh light scattering of the laser is reduced in the core of the particle. Afterwards, two maximums are observed corresponding to the backside
surface of Al2O3 platelet because it is supported on the glass slide where the Al2O3 platelet has been dispersed. On the contrary the intensity of the 418 cm-1 peak increases until achieves the half of the platelet and decreases when crosses the backside of the particle. The depth profile of Core-shell of SrAl2O4:Eu, Dy platelets is illustrated in Figure S2(b) based on the intensity of the 418 cm-1 (A1g) Raman Mode, 467 cm-1 attributed to the bending of O-Al-O bonds of SrAl2O4 phase and the Rayleigh light scattering of the laser. Once again, the intensity of the Rayleigh light scattering of the laser

5
increases at the surface ≈ 0.2 µm before particle surface and decreases going through the particle due to the attenuation by SrAl2O4. Concerning the intensity of 467 cm-1 peak, the depth profile shows two maximum corresponding to the outer layer of SrAl2O4:Eu, Dy. The intensity of the 418 cm-1 achieves the maximum in the
inner part of the platelet in which Al2O3 is confined. The depth profiles corresponding to the peaks located at 467 cm-1 and 418 cm-1 corroborate effectively the shell-like formation of SrAl2O4 and the core-like presence of Al2O3. Regarding the agglomerates of SrAl2O4:Eu, Dy nanoparticles (Fig. S2(c)), the depth profiles related to the peak
located at 467 cm-1 of SrAl2O4 phase and the Rayleigh light scattering of the laser have a symmetric shape, the up and down slope is almost equal. Furthermore, bulk SrAl2O4:Eu, Dy particles were analysed; It is important to remark that these particles are formed completely by SrAl2O4, the 418 cm-1 (A1g) Raman Mode was not observed. Figure S2(d) illustrates the depth profile of the 467 cm-1 (black line) and the Rayleigh light scattering of the laser (green line). The intensity of the Rayleigh light scattering of the laser increases until ≈ 0.2 µm before particle surface and decreases due to the mitigation by SrAl2O4. The variation of the intensity of 467 cm-1 peak has similar behavior with the 418 cm-1 peak; achieving the maximum in the particle surface and decreasing slowly going through the particle, because of the size of the particles, the intensity attenuation goes over > 9 µm. In spite of the larger dimension the laser light could not reach the center of the particle (particle diameter is ca.20 µm and after 6 µm the green light did not reach the surface, so there is a part of the particle that does not contributed to the optical response in the visible region). Rayleigh light scattering of the laser is measured in term of net counts by using the same laser powder. The differences in counts indicates that the more homogenous surface of reference SrAl2O4:Eu, Dy microparticles reflect more efficiently the coherent light than the nanostructured ones. Both the core-shell and the agglomerate of nanoparticles have a maximum of light reflection that is less than 50% of the correspondent to the reference particles. The roughness of nanostructured material produces a higher diffuse scattering of the light. Raman intensities are measured in terms of counts; the varying in intensity of 467 cm-1 Raman Mode can be
related to the material volume. For this reason the counts acquired in the depth profile of SrAl2O4:Eu, Dy platelets are lower than in bulk SrAl2O4:Eu, Dy particles and agglomerates; being most intense in bulk sample. These findings suggest that the outer SrAl2O4:Eu, Dy layer in core-shell structure is ≤ 500 nm.

6
Supplementary Information 4: There is not a standardized way of measuring the life time, called phosphorescence decay time or afterglow time. Different regulations have been employed to evaluate the photoluminescence of commercial products employing as source Xe Arc Lamp (1000 lux). However, the majority of decay curves are taken when the sample is irradiated with monochromatic light at 350, 365, 375 nm and 380 for 5 and 10 min 2–9 and by a solar simulator in a lesser extent10. For this reason, the powders obtained have been irradiated by different sources. Also, the decay curves have been obtained for all the powders synthesized at 1000ºC compared with the commercial
powder as received.
Figure S3 shows the afterglow decay curve of SrAl2O4:Eu, Dy powder synthesized at 1000ºC during 2 hour in 90N2-10H2 atmosphere, employing a salt/SrAl2O4 molar ratio of 3:1, as precursor alumina platelets with an average particle size, d50 ≈ 6 µm, (magenta decay curve) and using Al2O3 /SrO molar ratio of 2 compared to the commercial powder (green decay curve) after the light source was cut off, irradiated for 10 min by (a)
monochromatic light at 380 nm, (b) artificial indoor illumination and (c) solar simulator.

7
Supplementary Information 5: When irradiated with X-rays, the SrAl2O4: Eu,Dy powder scintillates emitting visible light.11 To get some evaluation of the radioluminescence response of SrAl2O4: Eu,Dy powder, radioluminescence spectra for the powder synthesized at 1000ºC for 2 h in 90N2-10H2 atmosphere, employing a salt/SrAl2O4 molar ratio of 3:1 employing as precursor alumina platelets with an average particle size, d50 ≈ 6 µm) and using Al2O3 /SrO molar ratio of 2 (magenta spectrum) are shown in Figure S4. The intense of broad peak at 525 nm is associated with Eu2+ 5d4f→4f transitions and indicates the presence of reduced europium in the sample. A less intense peak at 616 nm is associated to Eu3+ 5D0 →7F2 transition.12 These results indicate that there are divalent and trivalent charged states inside the matrix. With the further increasing alumina average particle size, its intensity smoothly increases, being the SrAl2O4: Eu, Dy platelets which show the better response. The same behavior has been observed when the powders are excited by monochromatic light at 380 nm.
Figure S4. Radioluminescence spectra of the powder synthesized at 1000ºC for 2 hour in 90N2-10H2 atmosphere, employing a salt/SrAl2O4 molar ratio of 3:1, as precursor alumina platelets with an average particle size, d50 ≈ 6 µm) and using Al2O3
/SrO molar ratio of 2.

8
Supplementary Information 6: X-ray absorption spectroscopy (XAS) measurements at the Eu L3 edge were performed in order to quantify the
relative amounts of the two oxidation states of Europium. Reference spectra of Eu2+ (EuI) and Eu3+ (Eu2O3) are shown in Figure S5a (bottom panel). A significant difference in the energy can serve as a signature of the two oxidation states (6971.78 for Eu 2+ and 6979.47 for Eu 3+). The spectra of the powder synthesized at 1000 (magenta spectrum), 1200 (blue spectrum), 1400 ºC (purple spectrum) for 2 hour in 90N2-10H2 atmosphere, employing a
salt/SrAl2O4 molar ratio of 3:1, as alumina platelets with an average particle size, d50 ≈ 6 µm) and Al2O3 /SrO molar ratio of 2 and initial reference material: microparticle SrAl2O4:Eu, Dy from Jinan Chenghao Technology Co., Ltd (green spectrum) are shown in Figure S5a (top panel). These spectra consist of two peaks coinciding with the reference spectra of Eu2+ and Eu3+, definitively confirming the coexistence of both oxidation states in samples. High-temperature annealing results in a notable reduction in the Eu3+ and an increase in Eu2+ peak intensity. The relative amounts of Eu2+ for different temperature annealing in synthesized SrAl2O4: Eu, Dy powders were determined from the deconvoluted peak fitting using a pseudo-Voigt and arctangent step functions 13,14. The fitted curve (red dotted curve) and the individual fitted components (green, blue and orange dotted curves) are shown in the same graph (Fig. S5b) and the fitting results of the characteristic white lines of Eu2+ and Eu3+ are listed in Table S2.
Quantification of relatively abundance of the different ions in Eu compounds usually is usually done without taking into account transition probabilities of the two states15. However, we take the greatest reported transition probability difference between L3-edge absorption intensity for adjusting the Eu2+ and Eu3+ peak intensity. A factor R=1.5 has employed becasuse in our sample the Eu content is 0.14 mol% (the system is considered dilute as the Eu content is less than 3 mol %) 13,15. Moreover, it is known that the area ratio AEu between the Eu2+ and Eu3+ WLs is related to the mole ratio MEu through MEu=RAEu.
13,16. Therefore in our study, we use an R value of 1.5
to determine MEu, which is used to calculate the mole fraction of Eu ions, the result is listed in the final column of Table S2.
A fitting of the experimental XANES spectra was also performed by means of a linear combination of the reference ones (Eu2O3 and EuI) (Table S3). The relative amounts of Eu2+ determined by two fitting methods, for different SrAl2O4: Eu,Dy powders processed here, are shown in Figure S5c. Eu fraction results are qualitatively similar, showing the same trend: Eu2+ fraction increases as synthesis annealing temperature increases. Although
the trend is similar in both XANES fitting, we obtained best R-factor (goodness of fit parameter) values for the results given from deconvoluted peak fitting. Thus, those results are presented together % of the photoluminescence in order to analyze the linked relationship with Eu2`+ fraction in Figure 3(d) in the main document.

9
Figure S5. (a) Top panel: XANES spectra of the powder synthesized at 1000 (magenta spectrum), 1200 (blue spectrum), 1400 ºC (purple spectrum) during 2 hour in 90N2-10H2 atmosphere, employing a salt/SrAl2O4 molar ratio of 3:1 employing as alumina platelets with an average particle size, d50 ≈ 6 µm) and using Al2O3 /SrO molar ratio of 2 and initial reference material: microparticle SrAl2O4:Eu, Dy from Jinan Chenghao Technology Co., Ltd (green spectrum). Bottom panel: XANES reference spectra of Eu2+ (EuCl) and Eu3+ (Eu2O3). (b) In order to quantify the white-line intensity (WL) in these spectra, curve fitting is accomplished by modeling the experimental data using pseudo-Voigt for the white-line resonances and arctan for the edge steps functions. (c) Eu2+ fraction obtained from two fitting routes (deconvoluted peak and linear combination linear) for sample
synthesized at 1000, 1200, and 1400 ºC. Table S2. Fitting results of Eu2+ and Eu 3+ L3 WLs from the powder synthesized at 1000, 1200 ,1400 ºC during 2 hour in 90N2-10H2 atmosphere, employing a salt/SrAl2O4 molar ratio of 3:1 employing as alumina platelets with an average particle size, d50 ≈ 6 µm and using Al2O3 /SrO molar ratio of 2 and initial reference material: microparticle SrAl2O4:Eu, Dy from Jinan Chenghao Technology Co., Ltd by deconvoluted peak fitting.
Edge Resonance Edge step
Sample Species Height a.u. Position eV FWHM Area Height
a.u.
Position
eV
Fraction R-factor
1000ºC Eu2+ 7.45 6971.78 5.87 7.45 0.418 6971.78 0.528
0.00019 Eu3+ 9.97 6979.47 5.71 9.97 0.589 6979.47 0.472
1200ºC Eu2+ 11.66 6971.78 5.87 11.66 0.581 6971.78 0.765
0.00015 Eu3+ 5.38 6979.47 5.68 5.38 0.352 6979.47 0.235
1400ºC Eu2+ 15.57 6971.78 5.84 15.57 0.228 6971.78 0.829 0.00060
Eu3+ 4.81 6979.47 5.79 4.81 0.673 6979.47 0.171
Reference
material Eu2+ 15.57 6971.78 5.85 15.57 0.581 6971.78 0.8160
0.00012 Eu3+ 5.38 6979.47 5.78 5.38 0.352 6979.47 0.1840
Table S3. Fitting results of Eu2+ and Eu 3+ L3 WLs from the powder synthesized at 1000, 1200, 1400 ºC during 2 hour in 90N2-10H2 atmosphere, employing a salt/SrAl2O4 molar ratio of 3:1 employing as alumina platelets with an average particle size, d50 ≈ 6 µm and using Al2O3 /SrO molar ratio of 2 and initial reference material:
microparticle SrAl2O4:Eu, Dy from Jinan Chenghao Technology Co., Ltd by linear combination fitting.
Sample Species Fraction R-factor
1000ºC Eu2+ 0.378
0.0938 Eu3+ 0.622
1200ºC Eu2+ 0.553
0.0674 Eu3+ 0.447
1400ºC Eu2+ 0.851
0.0405 Eu3+ 0.149
Reference
material Eu2+ 0.831
0.0589 Eu3+ 0.169

10
Supplementary Information 7: Figure S6 (a). shows the XRD patterns of synthesized SrAl2O4:Eu, Dy phosphor heated at 1000, 1200, and 1400 ºC for 2 h in 90N2-10H2 atmosphere, employing a salt/SrAl2O4 molar ratio of 3:1 employing as precursor alumina platelets with an average particle size, d50 ≈ 6 µm) and using Al2O3 /SrO molar ratio of 2. Figure S6 (b). shows
the Raman Shift image of the Raman mode attributed to the bending of O-Al-O bonds of SrAl2O4 phase. The Raman imaging allows us evaluating the homogeneity on the sample because each pixel on the image comprises a full Raman spectrum. The statistical analysis of the O-Al-O mode Raman shift of all spectra in the image is shown in Fig. S5(b). The maximum Raman shift (468 cm-1, marked in red) and the minimum Raman shift (465cm-
1, marked in purple).
Figure S6. (a) XRD patterns of synthesized SrAl2O4:Eu, Dy phosphor heated at 1000, 1200, and 1400 ºC for 2 h in 90N2-10H2
atmosphere, employing a salt/SrAl2O4 molar ratio of 3:1 employing as precursor alumina platelets with an average particle size, d50 ≈ 6 µm) and using Al2O3 /SrO molar ratio of 2. (b) Raman Shift image of the Raman mode attributed to the bending of O-Al-O bonds of SrAl2O4 phase of synthesized SrAl2O4:Eu, Dy phosphor heated at 1000, 1200, and 1400 ºC.
11
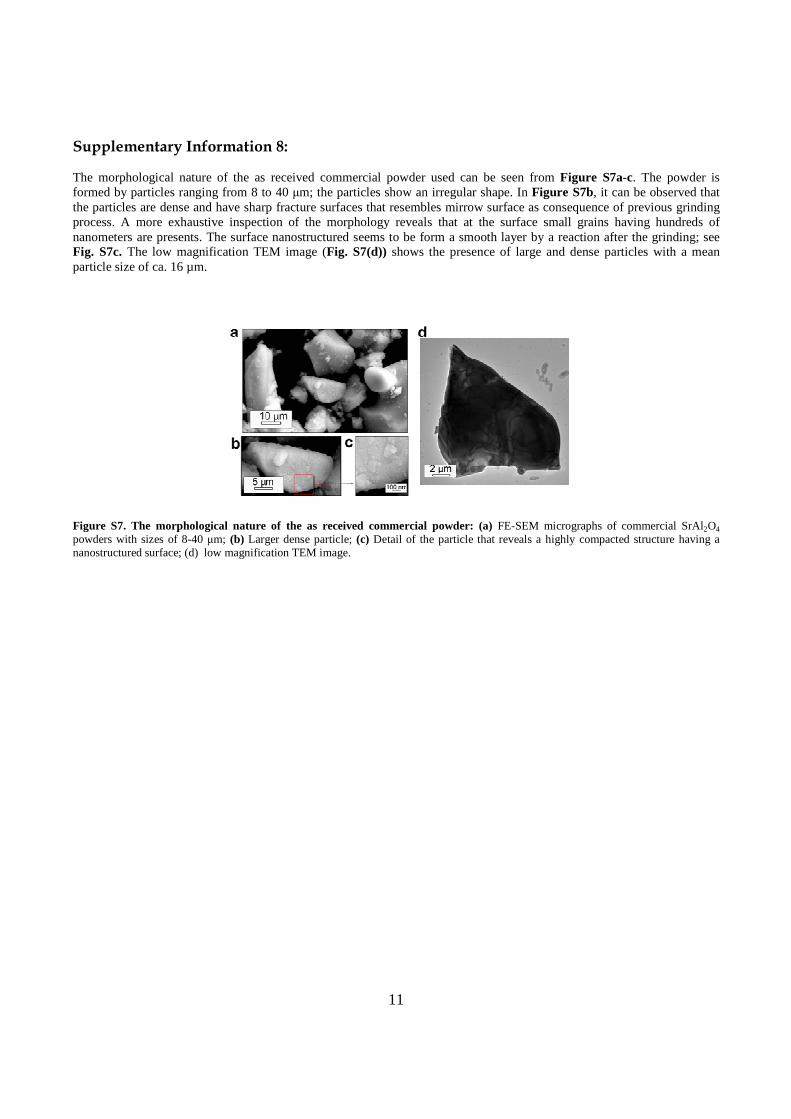
Supplementary Information 8:
The morphological nature of the as received commercial powder used can be seen from Figure S7a-c. The powder is formed by particles ranging from 8 to 40 μm; the particles show an irregular shape. In Figure S7b, it can be observed that the particles are dense and have sharp fracture surfaces that resembles mirrow surface as consequence of previous grinding process. A more exhaustive inspection of the morphology reveals that at the surface small grains having hundreds of nanometers are presents. The surface nanostructured seems to be form a smooth layer by a reaction after the grinding; see Fig. S7c. The low magnification TEM image (Fig. S7(d)) shows the presence of large and dense particles with a mean particle size of ca. 16 µm.
Figure S7. The morphological nature of the as received commercial powder: (a) FE-SEM micrographs of commercial SrAl2O4 powders with sizes of 8-40 μm; (b) Larger dense particle; (c) Detail of the particle that reveals a highly compacted structure having a nanostructured surface; (d) low magnification TEM image.

12
Supplementary References
1. Rojas-Hernandez, R. E. et al. Original Synthetic Route To Obtain a SrAl2O4 Phosphor by the Molten Salt Method: Insights into the Reaction Mechanism and Enhancement of the Persistent Luminescence. Inorg. Chem. 54, 9896–9907 (2015).
2. Chen, I.-C. et al. Investigations into thermoluminescence and afterglow characterization of strontium aluminates with boron-modification and reductions via sol-gel route. J. Rare Earths 30, 972–978 (2012).
3. Son, N. M., Vien, L. T. T., Ngoc, L. V. K. B., Trac, N. N. & Trac. Synthesis of SrAl2O4:Eu2+ , Dy 3+ phosphorescence nanosized powder by combustion method and its optical properties.
Mater. Sci. 187, (2009).
4. Xiao, Q., Xiao, L., Liu, Y., Chen, X. & Li, Y. Synthesis and luminescence properties of needle-like SrAl2O4:Eu, Dy phosphor via a hydrothermal co-precipitation method. J. Phys. Chem. Solids 71, 1026–1030 (2010).
5. Nag, A. & Kutty, T. R. N. Role of B2O3 on the phase stability and long phosphorescence of SrAl2O4 :Eu, Dy. J. Alloys Compd. 354, 221–231 (2003).
6. Haranath, D., Shanker, V., Chander, H. & Sharma, P. Studies on the decay characteristics of strontium aluminate phosphor on thermal treatment. Mater. Chem. Phys. 78, 6–10 (2002).
7. Zhu, Y., Zheng, M., Zeng, J., Xiao, Y. & Liu, Y. Luminescence enhancing encapsulation for strontium aluminate phosphors with phosphate. Mater. Chem. Phys. 113, 721–726 (2009).
8. Kshatri, D. S. & Khare, A. Comparative study of optical and structural properties of micro- and nanocrystalline SrAl2O4:Eu2+, Dy3+ phosphors. J. Lumin. 155, 257–268 (2014).
9. Dejene, F. B., Kebede, M. a., Redi-Abshiro, M. & Kgarebe, B. V. Structural and photoluminescence properties of Dy3+ co-doped and Eu2+ activated MAl2O4 (M=Ba,Ca,Sr) nanophosphors. Opt. Mater. (Amst). 35, 1927–1931 (2013).
10. Kaya, Y., Karacaoglu, E. & Bekir, Lk. Effect of Al/Sr ratio on the luminescence properties of SrAl2O4:Eu2+, Dy3+ phosphors. Ceram. Int. 38, 3701–3706 (2012).
11. Montes, P. J. R., Valerio, M. E. G. & Rezende, M. V. do. S. Mechanisms of radioluminescence of rare earths doped SrAl2O4 and Ca12Al14O33 excited by X-ray. J. Electron Spectros. Relat.
Phenomena 189, 39–44 (2013).
12. Ayvacikli, M., Ege, A. & Can, N. Radioluminescence of SrAl2O4 :Ln3+ (Ln = Eu, Sm, Dy) phosphor ceramic. Opt. Mater. (Amst). 34, 138–142 (2011).
13. Henke, B., Palick, C., Keil, P., Johnson, J. A. & Schweizer, S. Eu oxidation state in

13
fluorozirconate-based glass ceramics. J. Appl. Phys. 106, (2009).
14. Brugger, J. et al. The oxidation state of europium in hydrothermal scheelite: In situ measurement
by XANES spectroscopy. Can. Mineral. 44, 1079–1087 (2006).
15. Rakovan, J., Newville, M. & Sutton, S. Evidence of heterovalent europium in zoned llallgua
apatite using wavelength dispersive XANES. Am. Mineral. 86, 697–700 (2001).
16. Antonio, M. R., Soderholm, L. & Song, I. Design of spectroelectrochemical cell for in situ X-ray absorption fine structure measurements of bulk solution species. J. Appl. Electrochem. 27, 784–792 (1997).