supplementary information - nature · supplementary information 1 © 2017 macmillan publishers...
TRANSCRIPT
S U P P L E M E N TA RY I N F O R M AT I O N
WWW.NATURE.COM/NATURECELLBIOLOGY 1
© 2017 Macmillan Publishers Limited, part of Springer Nature. All rights reserved.
In the format provided by the authors and unedited.DOI: 10.1038/ncb3643
siLuc siDicer0.0
0.2
0.4
0.6
0.8
1.0
Dic
er m
RN
A re
lativ
e am
ount
siLuc siDrosha0.0
0.2
0.4
0.6
0.8
1.0
Dro
sha
mR
NA
rela
tive
amou
nt
vehicle AM DRB ACTD low
ACTDhigh
0
1
2
3
4
Fol
d ch
ange
re
lativ
e to
veh
icle
RPP0 (RNAPII)c-fos (RNAPII)47S (RNAPI)7SK (RNAPIII)
siLuc siH2AX0
20
40
60
80
100
% D
DR
NA-
TetR
co-
loca
lizat
ion
E.V. RNase H10
20
40
60
80
100
% D
DR
NA-
TetR
co-
loca
lizat
ion
Lac sequences Tet sequences I-SceI 5’
3’
3’
5’ Uni
5’ 3’
5’ 3’
5’ 3’
5’ 3’
5’ 3’
5’ 3’
5’ 3’
5’ 3’ L2
L1
T2
T1
U2
U1
U4
U3
0
5
10
15
20
25
Num
ber
of D
DR
NA
m
olec
ules
at L
acR
locu
s
UNCUTCUT
U1:U2 U3:U4 T1:T2DDRNA: L1:L2
** **** ** **
A
B D C
F G
1 STEP 2 STEPS >2 STEPS
Num
ber o
f DD
RN
A m
olec
ules
at L
acR
spo
t
E
H ns I
K ns
L
RNase H1 TetR DDRNA
RN
ase
H1
E.V
.
J
siLuc siH2AX0
20
40
60
80
100
% D
DR
-Tet
R c
o-lo
caliz
atio
n
53BP1!H2AX
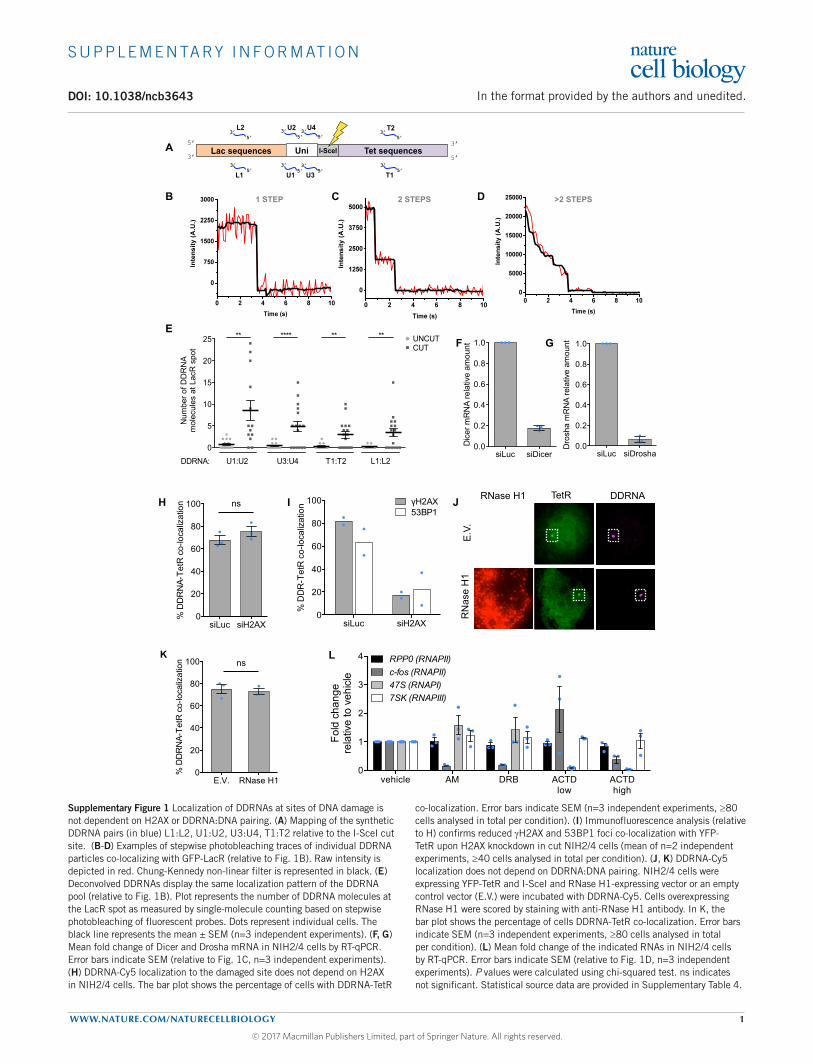
Supplementary Figure 1 Localization of DDRNAs at sites of DNA damage is not dependent on H2AX or DDRNA:DNA pairing. (A) Mapping of the synthetic DDRNA pairs (in blue) L1:L2, U1:U2, U3:U4, T1:T2 relative to the I-SceI cut site. (B-D) Examples of stepwise photobleaching traces of individual DDRNA particles co-localizing with GFP-LacR (relative to Fig. 1B). Raw intensity is depicted in red. Chung-Kennedy non-linear filter is represented in black. (E) Deconvolved DDRNAs display the same localization pattern of the DDRNA pool (relative to Fig. 1B). Plot represents the number of DDRNA molecules at the LacR spot as measured by single-molecule counting based on stepwise photobleaching of fluorescent probes. Dots represent individual cells. The black line represents the mean ± SEM (n=3 independent experiments). (F, G) Mean fold change of Dicer and Drosha mRNA in NIH2/4 cells by RT-qPCR. Error bars indicate SEM (relative to Fig. 1C, n=3 independent experiments). (H) DDRNA-Cy5 localization to the damaged site does not depend on H2AX in NIH2/4 cells. The bar plot shows the percentage of cells with DDRNA-TetR
co-localization. Error bars indicate SEM (n=3 independent experiments, ≥80 cells analysed in total per condition). (I) Immunofluorescence analysis (relative to H) confirms reduced γH2AX and 53BP1 foci co-localization with YFP-TetR upon H2AX knockdown in cut NIH2/4 cells (mean of n=2 independent experiments, ≥40 cells analysed in total per condition). (J, K) DDRNA-Cy5 localization does not depend on DDRNA:DNA pairing. NIH2/4 cells were expressing YFP-TetR and I-SceI and RNase H1-expressing vector or an empty control vector (E.V.) were incubated with DDRNA-Cy5. Cells overexpressing RNase H1 were scored by staining with anti-RNase H1 antibody. In K, the bar plot shows the percentage of cells DDRNA-TetR co-localization. Error bars indicate SEM (n=3 independent experiments, ≥80 cells analysed in total per condition). (L) Mean fold change of the indicated RNAs in NIH2/4 cells by RT-qPCR. Error bars indicate SEM (relative to Fig. 1D, n=3 independent experiments). P values were calculated using chi-squared test. ns indicates not significant. Statistical source data are provided in Supplementary Table 4.
S U P P L E M E N TA RY I N F O R M AT I O N
WWW.NATURE.COM/NATURECELLBIOLOGY 2
© 2017 Macmillan Publishers Limited, part of Springer Nature. All rights reserved.
siLuc
siDicsiD
rosiT
sn
siDic+
TsnsiL
ucsiD
icsiD
rosiT
sn
siDic+
TsnsiL
ucsiD
icsiD
rosiT
sn
siDic+
Tsn0.0
0.2
0.4
0.6
0.8
1.0
mR
NA
rela
tive
amou
nt DicerDroshaTranslin
siLuc
siLuc
siDicsiD
rosiL
ucsiL
ucsiD
icsiD
ro0123456789
Fol
d ch
ange
re
lativ
e to
siL
uc u
ncut pre-let7a
pre-DDRNA****
****ns
******
I-SceI: - + + + - + + +
dilncRNA-from
dilncRNA-to
0.00.51.01.52.02.53.03.5
Fol
d ch
ange
re
lativ
e to
unc
ut
*dilncRNA-from
dlincRNA-to
0
1
2
3
4
5
Fol
d ch
ange
re
lativ
e to
unc
ut
**
dilncRNA-from
dlincRNA-to
0
1
2
3
4
5
Fol
d ch
ange
re
lativ
e to
unc
ut
**dilncRNA-from
dilncRNA-to
0
1
2
3
4
5
Fol
d ch
ange
re
lativ
e to
unc
ut
* **
dilncRNA-from
dilncRNA-to
01234567
Fol
d ch
ange
re
lativ
e to
unc
ut
**
BSA RNase A + tRNA0.0
0.5
1.0
Rel
ativ
e am
ount
Rplp0TERRA
**
BSA RNase A + tRNA0.0
0.5
1.0
Rel
ativ
e am
ount
Rplp0dilncRNA-from
**
vehic
leATMi
vehic
leATMi0
1
2
3
4
Fol
d ch
ange
re
lativ
e to
unc
ut
Tet-fromLac-from
vehic
le AMDRB
ACTD low
ACTD high
vehic
le AMDRB
ACTD low
ACTD high
0.00.51.01.52.02.53.03.5
Fol
d ch
ange
re
lativ
e to
unc
ut
Lac-fromTet-from
0
10
20
30
40
50
Rel
ativ
e In
tens
ity (A
.U.)
Uni Lac-fromFISH target:
DRB: - +
****
0
100
200
300
400
500
600
Num
ber o
f diln
cRN
As
at L
acR
locu
s**** ****
Uni Lac-from Uni Lac-toFISH target:
UNCUTCUT
0
10
20
30
40
Rel
ativ
e In
tens
ity (A
.U.)
Uni Lac-fromFISH target:A HRNase: -
**** CUTC
F
A
D U
NC
UT
CU
T
LacR 53BP1 FISH MERGE B
Uni Lac-from probe (nM) N
umbe
r of d
ilncR
NA
mol
ecul
es a
t Lac
R s
pot
E!
G! H!
AsiSI intergenic
I-PpoI HeLa intergenic
CRISPR/Cas9
AsiSI genic
I-SceI NIH3T3duo
I J K
L M
N
O P Q
dilncRNA GAPDH0.0
0.5
1.0
1.5
Fol
d ch
ange
rela
tive
to
sequ
ence
-spe
cific
cD
NA Sequence-specific
PolyA
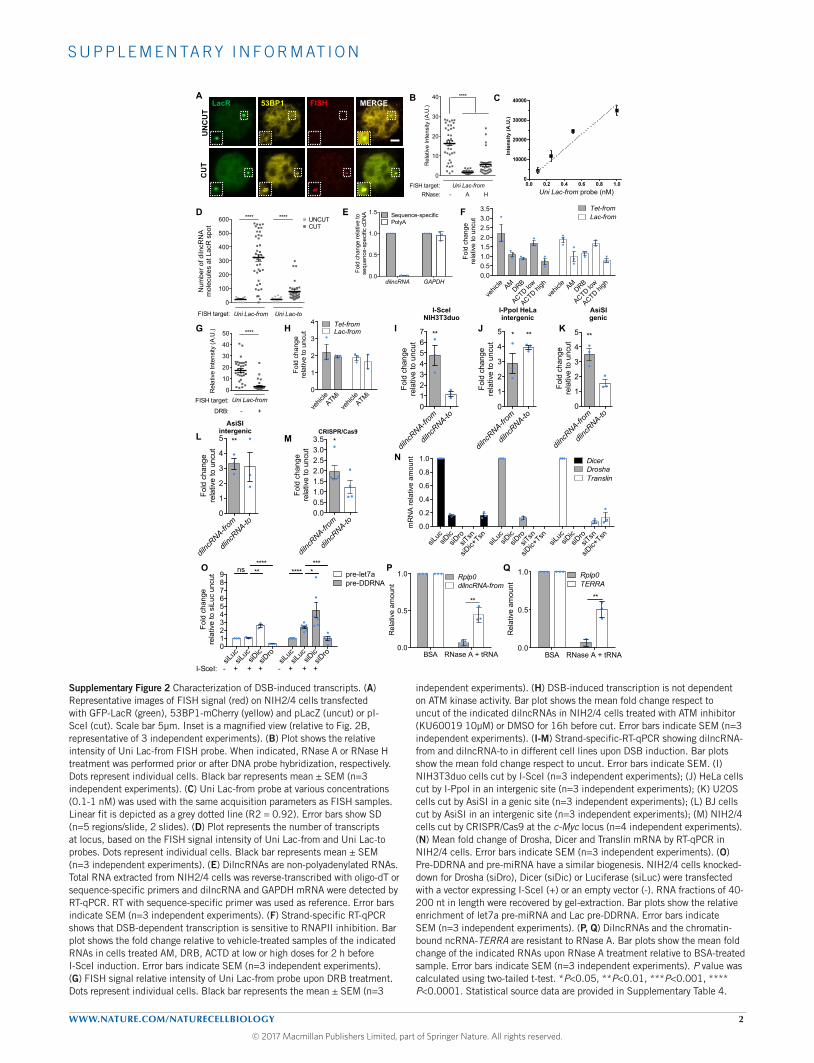
Supplementary Figure 2 Characterization of DSB-induced transcripts. (A) Representative images of FISH signal (red) on NIH2/4 cells transfected with GFP-LacR (green), 53BP1-mCherry (yellow) and pLacZ (uncut) or pI-SceI (cut). Scale bar 5μm. Inset is a magnified view (relative to Fig. 2B, representative of 3 independent experiments). (B) Plot shows the relative intensity of Uni Lac-from FISH probe. When indicated, RNase A or RNase H treatment was performed prior or after DNA probe hybridization, respectively. Dots represent individual cells. Black bar represents mean ± SEM (n=3 independent experiments). (C) Uni Lac-from probe at various concentrations (0.1-1 nM) was used with the same acquisition parameters as FISH samples. Linear fit is depicted as a grey dotted line (R2 = 0.92). Error bars show SD (n=5 regions/slide, 2 slides). (D) Plot represents the number of transcripts at locus, based on the FISH signal intensity of Uni Lac-from and Uni Lac-to probes. Dots represent individual cells. Black bar represents mean ± SEM (n=3 independent experiments). (E) DilncRNAs are non-polyadenylated RNAs. Total RNA extracted from NIH2/4 cells was reverse-transcribed with oligo-dT or sequence-specific primers and dilncRNA and GAPDH mRNA were detected by RT-qPCR. RT with sequence-specific primer was used as reference. Error bars indicate SEM (n=3 independent experiments). (F) Strand-specific RT-qPCR shows that DSB-dependent transcription is sensitive to RNAPII inhibition. Bar plot shows the fold change relative to vehicle-treated samples of the indicated RNAs in cells treated AM, DRB, ACTD at low or high doses for 2 h before I-SceI induction. Error bars indicate SEM (n=3 independent experiments). (G) FISH signal relative intensity of Uni Lac-from probe upon DRB treatment. Dots represent individual cells. Black bar represents the mean ± SEM (n=3
independent experiments). (H) DSB-induced transcription is not dependent on ATM kinase activity. Bar plot shows the mean fold change respect to uncut of the indicated dilncRNAs in NIH2/4 cells treated with ATM inhibitor (KU60019 10μM) or DMSO for 16h before cut. Error bars indicate SEM (n=3 independent experiments). (I-M) Strand-specific-RT-qPCR showing dilncRNA-from and dilncRNA-to in different cell lines upon DSB induction. Bar plots show the mean fold change respect to uncut. Error bars indicate SEM. (I) NIH3T3duo cells cut by I-SceI (n=3 independent experiments); (J) HeLa cells cut by I-PpoI in an intergenic site (n=3 independent experiments); (K) U2OS cells cut by AsiSI in a genic site (n=3 independent experiments); (L) BJ cells cut by AsiSI in an intergenic site (n=3 independent experiments); (M) NIH2/4 cells cut by CRISPR/Cas9 at the c-Myc locus (n=4 independent experiments). (N) Mean fold change of Drosha, Dicer and Translin mRNA by RT-qPCR in NIH2/4 cells. Error bars indicate SEM (n=3 independent experiments). (O) Pre-DDRNA and pre-miRNA have a similar biogenesis. NIH2/4 cells knocked-down for Drosha (siDro), Dicer (siDic) or Luciferase (siLuc) were transfected with a vector expressing I-SceI (+) or an empty vector (-). RNA fractions of 40-200 nt in length were recovered by gel-extraction. Bar plots show the relative enrichment of let7a pre-miRNA and Lac pre-DDRNA. Error bars indicate SEM (n=3 independent experiments). (P, Q) DilncRNAs and the chromatin-bound ncRNA-TERRA are resistant to RNase A. Bar plots show the mean fold change of the indicated RNAs upon RNase A treatment relative to BSA-treated sample. Error bars indicate SEM (n=3 independent experiments). P value was calculated using two-tailed t-test. *P<0.05, **P<0.01, ***P<0.001, **** P<0.0001. Statistical source data are provided in Supplementary Table 4.

S U P P L E M E N TA RY I N F O R M AT I O N
WWW.NATURE.COM/NATURECELLBIOLOGY 3
© 2017 Macmillan Publishers Limited, part of Springer Nature. All rights reserved.
Mock U
ncut
Uncut
Mock C
utCut
Mock U
ncut
Uncut
Mock C
utCut
Mock U
ncut
Uncut
Mock C
utCut0.0
0.5
1.0
1.5
% In
put
IntergenicAct-CodingAct-Prom
RNAPII pSer5
Mock U
ncut
Uncut
Mock C
utCut
Mock U
ncut
Uncut
Mock C
utCut
Mock U
ncut
Uncut
Mock C
utCut0.0
1.0
2.0
3.0
4.0
5.0
% In
put
IntergenicAct-CodingAct-Prom
RNAPII pSer2
Mock U
ncut
Uncut
Mock C
utCut
Mock U
ncut
Uncut
Mock C
utCut
Mock U
ncut
Uncut
Mock C
utCut0.0
1.0
2.0
3.0
4.0
% In
put
IntergenicAct-CodingAct-Prom
Total RNAPII
UNCUT inter
genic
CUT inter
genic
UNCUT Acti
n Prom
CUT Acti
n Prom
UNCUT inter
genic
CUT inter
genic
UNCUT Acti
n Prom
CUT Acti
n Prom
UNCUT inter
genic
CUT inter
genic
UNCUT Acti
n Prom
CUT Acti
n Prom
0.0
0.2
0.4
0.6
0.8
1.0
% In
put
Mock!H2AXRNAP II
RNAP II
RNAP II pS
er5
RNAP II pS
er2
0.0
1.0
2.0
3.0
4.0
5.0
Fol
d ch
ange
rela
tive
to u
ncut
* * **
0 1 2 3 4 5 6 7 80.5
1.0
1.5
2.0
2.5
3.0
5S p
ol2_
enric
hmen
t ind
ex
H2A.X_enrichment index
Pearson's r = 0.6
!H2AX Enrichment Index
RN
AP
II pS
er5
E
nric
hmen
t Ind
ex
E
UN
CU
T
LacR !H2AX RNAPII pSer5 MERGE
CU
T
L H
R M
L H
R M
LacR !H2AX RNAPII pSer5 MERGE
A
B
0 20 40 60 80 100 120 1400
10000
20000
30000
40000
Intensity
position (pixel)
RNA pol II Ser5 LAC γH2AX
0 20 40 60 80 1001201401601800
10000
20000
30000
40000
Intensity
position (pixel)
RNA pol II Ser5 LAC γH2AX
UNCUT CUT
C D
RNAPII pSer5 LacR !H2AX
RNAPII pSer5 LacR !H2AX
F
G H I
MRE11
Input Beads o
nly
No DNA ends
DNA ends
RNAP II pSer2
RNAP II
RNAP II pSer5
J K
250 kDa
250 kDa
250 kDa
0
1
2
3
Enr
ichm
ent I
ndex
(A.U
.) UNCUTCUT
RNAPII pSer5
0
2
4
6
8
10
12
Enric
hmen
t Ind
ex (A
.U.)
γH2AX
UNCUTCUT
Supplementary Figure 3 RNAPII localizes to DSBs in mammalian cells. (A) Confocal microscopy reveals the enrichment of γH2AX and active RNAPII at the damaged locus. The panel shows representative confocal images of LacR loci (red, inset L), γH2AX (green, inset H), RNAPII pSer5 (purple, inset R) and merge (inset M) in uncut and cut NIH2/4 cells. The yellow-boxed inset images correspond to the yellow-boxed regions. White outline defines nuclear contour. Scale bar 10 μm. (B, C) Quantification of (A). Plots show the enrichment of RNAPII pSer5 and γH2AX in uncut and cut cells, calculated on confocal image stacks. Dots represent individual cells. Black bar represents mean (data are shown as pool of 2 independent experiments, ≥25 cells per sample). (D) RNAPII pSer5 enrichment index was plotted as a function of γH2AX enrichment index at the Cherry-LacR signal. Linear fit is depicted as a red line (Pearson’s r = 0.6). Individual data points correspond to individual nuclei (data are shown as pool of 2 independent experiments, ≥50 nuclei). (E) Intensity profiles along the chromatin fibers in the yellow-boxed images in Fig. 3A. (F) Bar plot shows the mean fold change relative
to uncut cells of RNAPII pSer5 and pSer2 and total RNAPII enrichment at the Lac sequences in NIH2/4. Error bars indicate SEM (n=3 independent experiments). (G-I) ChIP controls in NIH2/4 cells. RNAPII pSer5 and pSer2 and total RNAPII are enriched in the coding and promoter regions of the beta-actin (Act) gene, but not in an intergenic region. Data are shown as percentage of input. Data are shown as one representative of 2 independent experiments. (J) ChIP controls in HeLa cells. Total RNAPII is enriched in the coding and promoter regions of the beta-actin (Act) gene, but not in an intergenic region. Data are shown as percentage of input. Data are shown as one representative of 3 independent experiments. (K) Biotinylated DNA on streptavidin beads was cut or not by recombinant I-SceI and incubated with nuclear cell extract. Input and pull-down samples were probed for total RNAPII pSer5 and pSer2 and total RNAPII. P value was calculated using two-tailed t-test. *P<0.05, **P<0.01, ****P<0.0001. Statistical source data are provided in Supplementary Table 4. Unprocessed original blots are shown in Supplementary Figure 9.

S U P P L E M E N TA RY I N F O R M AT I O N
WWW.NATURE.COM/NATURECELLBIOLOGY 4
© 2017 Macmillan Publishers Limited, part of Springer Nature. All rights reserved.
D
M
50
100
300nt
Linear plasmid Active CFE
Circular plasmid
- +
+ - - +
+ + + + + + + + + + + + + + - - - - - - - - - - - - - -
- + - + - + - + - + - + - +
pLacTet pBluescript
GATC GTAC AATT GAT CCC AGCT ATAA
5’ blunt 3’
200 F
Circl 5’-AATT
5’-CTA
G 5’-
AGCT
TGCA-3’
GTA
C-3’
AGCT-3’
CCC Circl
200 nt
500 nt
1000 nt 2000 nt
blunt Circular Linear - + + + M
- + - - - + + + M
- + - - + -
pUC19 pUC19
3 Kb
pLacTet pBluescript
M E
200 nt
Circular Linear
CFE + +
+ + + - - -
-
M A B C
Linear plasmid - + CFE +
50
100
+ M +
+ Linear plasmid
CFE + + +
-
200
500
1000 nt
M
200
500nt
- + M - KU60019 (µM)
+ + + + + 1 10
50
100
250 nt
10-2 10-3 0
50
100
250 nt
- + - ATM +/+ - - + ATM -/-
M + M - VE-821 (µM)
+ + + + - 102 103 10 1 0 10-1
50
100
250 nt
Active CFE Active CFE G H I
+ M - NU7026 (µM)
+ + + + - 102 103 10 1 0
M + -
+ + + - 102 103 10 0 NU7441 (nM)
- + M 0 Wortmannin (µM)
+ + + + 1 10 20 50 0
+ 5
50
100
250 nt
50
100
250 nt
50
100
nt 250
Active CFE Active CFE Active CFE
J K L
CFE + + + + + + + + +
Supplementary Figure 4 In vitro DSB-induced transcription is not dependent on DDR kinases. (A-C) Denaturing PAGE showing the products of in vitro transcription reactions in the presence of [α32P]UTP with pLacTet plasmid (A) or pUC19 plasmid (B,C) and appropriate controls. CFE indicates cell free extract. M indicates radiolabeled DNA ladder, nt indicates nucleotides. (D) Denaturing PAGE showing the products of in vitro transcription reactions in the presence of [α32P]UTP with pBluescript plasmid in its circular form or digested with different restriction enzymes generating one DSB with 5’-protruding, blunt or 3’-protruding DNA ends. pLacTet plasmid is used as control. CFE indicates cell free extract. M indicates radiolabeled DNA ladder, nt indicates nucleotides. (E) Agarose gel shows equal amounts of DNA used in (D). (F) Denaturing PAGE showing the products of in vitro transcription reactions in the presence of [α32P]UTP with pUC19 plasmid
in its circular form or digested with different restriction enzymes, as in (D). (G-L) Analysis of the role of DDR upstream kinases in the control of transcription from DSBs. Denaturing PAGE showing in vitro transcription assays performed by incubating cell-free extract (CFE) with linear pLacTet plasmid and increasing concentrations (0, 1, 10, 100 nM, 1, 10 μM) of the ATM inhibitor KU60019 (G); with cell-free extract (CFE) prepared from ATM wild-type or knockout embryonic stem (ES) cells (H); with increasing concentrations (0, 1, 10, 100, 1000 μM) of the ATR inhibitor VE-821 (I); with increasing concentrations (0,1, 5, 10, 20, 50 μM) of the PI3K-like kinases inhibitor Wortmannin (J); with increasing concentrations of the following DNA-PKcs inhibitors: (K) NU7441 (0, 10, 100, 1000 nM) and (L) NU7026 (0, 1, 10, 100, 1000 μM). M indicates radiolabeled DNA ladder, nt indicates nucleotides.
S U P P L E M E N TA RY I N F O R M AT I O N
WWW.NATURE.COM/NATURECELLBIOLOGY 5
© 2017 Macmillan Publishers Limited, part of Springer Nature. All rights reserved.
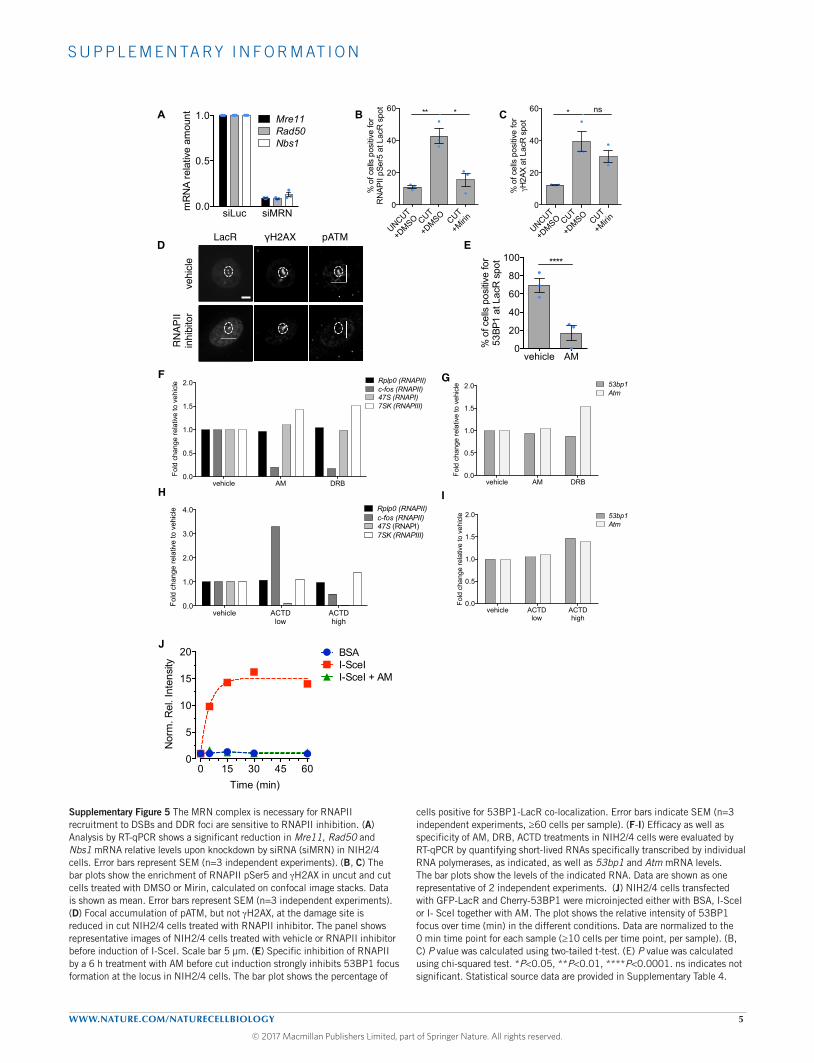
Supplementary Figure 5 The MRN complex is necessary for RNAPII recruitment to DSBs and DDR foci are sensitive to RNAPII inhibition. (A) Analysis by RT-qPCR shows a significant reduction in Mre11, Rad50 and Nbs1 mRNA relative levels upon knockdown by siRNA (siMRN) in NIH2/4 cells. Error bars represent SEM (n=3 independent experiments). (B, C) The bar plots show the enrichment of RNAPII pSer5 and γH2AX in uncut and cut cells treated with DMSO or Mirin, calculated on confocal image stacks. Data is shown as mean. Error bars represent SEM (n=3 independent experiments). (D) Focal accumulation of pATM, but not γH2AX, at the damage site is reduced in cut NIH2/4 cells treated with RNAPII inhibitor. The panel shows representative images of NIH2/4 cells treated with vehicle or RNAPII inhibitor before induction of I-SceI. Scale bar 5 μm. (E) Specific inhibition of RNAPII by a 6 h treatment with AM before cut induction strongly inhibits 53BP1 focus formation at the locus in NIH2/4 cells. The bar plot shows the percentage of
cells positive for 53BP1-LacR co-localization. Error bars indicate SEM (n=3 independent experiments, ≥60 cells per sample). (F-I) Efficacy as well as specificity of AM, DRB, ACTD treatments in NIH2/4 cells were evaluated by RT-qPCR by quantifying short-lived RNAs specifically transcribed by individual RNA polymerases, as indicated, as well as 53bp1 and Atm mRNA levels. The bar plots show the levels of the indicated RNA. Data are shown as one representative of 2 independent experiments. (J) NIH2/4 cells transfected with GFP-LacR and Cherry-53BP1 were microinjected either with BSA, I-SceI or I- SceI together with AM. The plot shows the relative intensity of 53BP1 focus over time (min) in the different conditions. Data are normalized to the 0 min time point for each sample (≥10 cells per time point, per sample). (B, C) P value was calculated using two-tailed t-test. (E) P value was calculated using chi-squared test. *P<0.05, **P<0.01, ****P<0.0001. ns indicates not significant. Statistical source data are provided in Supplementary Table 4.
vehicle AM DRB0.0
0.5
1.0
1.5
2.0
Fold
cha
nge
rela
tive
to v
ehic
le 53bp1Atm
0 15 30 45 600
5
10
15
20
Time (min)
Nor
m. R
el. I
nten
sity
BSAI-SceII-SceI + AM
UNCUT
+DMSO CUT
+DMSO CUT
+Mirin
0
20
40
60
% o
f cel
ls p
ositi
ve fo
r R
NAP
II pS
er5
at L
acR
spo
t
** *
UNCUT
+DMSO CUT
+DMSO CUT
+Mirin
0
20
40
60
% o
f cel
ls p
ositi
ve fo
r H
2AX
at L
acR
spo
t
ns*
D E
vehi
cle
LacR H2AX
RN
APII
inhi
bito
r
pATM
F G
IH
J
A B C
siLuc siMRN0.0
0.5
1.0
mR
NA
rela
tive
amou
nt Mre11Rad50Nbs1
vehicle AM0
20
40
60
80
100
% o
f cel
ls p
ositi
ve fo
r 53
BP1
at L
acR
spo
t ****
vehicle AM DRB0.0
0.5
1.0
1.5
2.0
Fold
cha
nge
rela
tive
to v
ehic
le Rplp0 (RNAPII)c-fos (RNAPII)47S (RNAPI)7SK (RNAPIII)
vehicle ACTD low
ACTDhigh
0.0
1.0
2.0
3.0
4.0
Fold
cha
nge
rela
tive
to v
ehic
le Rplp0 (RNAPII)c-fos (RNAPII)47S (RNAPI)7SK (RNAPIII)
vehicle ACTD low
ACTDhigh
0.0
0.5
1.0
1.5
2.0
Fold
cha
nge
rela
tive
to v
ehic
le 53bp1Atm

S U P P L E M E N TA RY I N F O R M AT I O N
WWW.NATURE.COM/NATURECELLBIOLOGY 6
© 2017 Macmillan Publishers Limited, part of Springer Nature. All rights reserved.
vehic
le AMDRB
vehic
le AMDRB
vehic
le AMDRB
0
50
100
% o
f DD
R-p
ositi
ve c
ells
!H2AX 53BP1 pATM
**** ****
vehicle ACTD low
ACTDhigh
0.0
0.5
1.0
1.5
2.0
Fol
d ch
ange
rela
tive
to v
ehic
le
RPLP0 (RNAPII)c-fos (RNAPII)47S (RNAPI)7SK (RNAPIII)
vehicle AM DRB0.0
0.5
1.0
1.5
2.0
Fol
d ch
ange
rela
tive
to v
ehic
le 53BP1ATM
vehicle AM DRB0.0
0.5
1.0
1.5
2.0
Fol
d ch
ange
rela
tive
to v
ehic
le
RPLP0 (RNAPII)c-fos (RNAPII)47S (RNAPI)7SK (RNAPIII)
vehicle AM 2h AM 6h AM 8h0.0
0.5
1.0
1.5
2.0
Fol
d ch
ange
rela
tive
to v
ehic
le 53BP1ATM
8 h 6 h 8 hTreatment before IR: 2 h
vehicle AM
vehicle AM 2h AM 6h AM 8h0.0
0.5
1.0
1.5
2.0
Fol
d ch
ange
rela
tive
to v
ehic
le
RPLP0 (RNAPII)c-fos (RNAPII)47S (RNAPI)7SK (RNAPIII)
8 h 6 h 8 hTreatment before IR: 2 h
vehicle AM
DAPI pATM
vehi
cle!
RN
APII
inhi
bito
r!
L K
H! I!
J!
D!
F!
E!
G!
A B C DAPI 53BP1 DAPI pATM
vehi
cle
RN
AP
II in
hibi
tor
DAPI γH2AX
vehi
cle
RN
AP
II in
hibi
tor
vehi
cle
RN
AP
II in
hibi
tor
vehicle AM vehicle AM vehicle AM 0
20
40
60
80
100
% o
f DD
R-p
ositi
ve c
ells
!H2AX53BP1pATM
2 h 6 h 8 hTreatment before IR:
vehicle ACTD low
ACTDhigh
0.0
0.5
1.0
1.5
2.0
Fol
d ch
ange
rela
tive
to v
ehic
le 53BP1ATM
Supplementary Figure 6 IR-induced DDR foci are sensitive to RNAPII inhibition. (A-C) Focal accumulation of 53BP1 and pATM, but not γH2AX, upon IR is reduced in HeLa cells treated with RNAPII inhibitors (relative to Fig. 6E, F). Representative images of HeLa treated with vehicle or RNAPII inhibitors (AM in these images) before IR and probed for γH2AX, 53BP1 and pATM. Scale bar 10μm. (D-G) HeLa cells were treated with AM for 6h, DRB, ACTD at low or high doses for 2 h before IR and RNA was extracted 1h post IR. Efficacy of the treatments were evaluated by RT-qPCR by quantifying short-lived RNAs specifically transcribed by individual RNA polymerases, as indicated, as well as 53BP1 and ATM mRNA levels. The bar plots show the levels of the indicated RNA. Data are shown as one representative of 4 (D, F) or 2 (E, G) independent experiments. (H) Bar plot shows the percentage of irradiated HeLa cells positive for γH2AX, 53BP1 and pATM upon different treatments with AM (cells with >10 foci were scored positive, >100 cells per sample). (I, J) Efficacy as well
as specificity of the treatments with AM for 2, 6 and 8h were evaluated by RT-qPCR by quantifying short-lived RNAs specifically transcribed by individual RNA polymerases, as indicated, as well as 53BP1 and ATM mRNA levels. The bar plots show the levels of the indicated RNA. Data are shown as one representative of 2 independent experiments. (K) pATM foci are reduced in irradiated normal human fibroblasts (BJ) treated with RNAPII inhibitors. The panel shows representative images of cells treated with vehicle or RNAPII inhibitor (DRB in these images) 2h before IR. Scale bar 5μm. (L) BJ cells were treated with AM, DRB or vehicle 2h before IR. Bar plot (quantification of Fig. 6D and Supplementary Fig. 6K) shows the percentage of cells positive for γH2AX, 53BP1 and pATM (cells with >10 foci were scored positive). Error bars indicate SEM (n=3, n>100 cells per sample). P value was calculated using two-tailed t-test. **P<0.01, ***P<0.001, ****P<0.0001. Statistical source data are provided in Supplementary Table 4.

S U P P L E M E N TA RY I N F O R M AT I O N
WWW.NATURE.COM/NATURECELLBIOLOGY 7
© 2017 Macmillan Publishers Limited, part of Springer Nature. All rights reserved.
DMSO DRB0
20
40
60
80
100
% o
f FK2
-pos
itive
cel
ls
****
DMSO DRB0
20
40
60
80
100
% o
f RIF
1-po
sitiv
e ce
lls
****
DMSO DRB0
20
40
60
80
100
% o
f RN
F168
-pos
itive
cel
ls
****
DMSO DRB0
20
40
60
80
100
% o
f pKA
P1-p
ositi
ve c
ells
****
Unindu
ced +
DMSO
Induc
ed + D
MSO
Induc
ed +
DRB
Unindu
ced +
DMSO
Induc
ed + D
MSO
Induc
ed +
DRB0.00
0.05
0.10
0.15
0.20
% o
f Inp
ut
53BP1 ChIP at intergenic AsiSI
Mock53BP1
Unindu
ced +
DMSO
Induc
ed + D
MSO
Induc
ed +
DRB
Unindu
ced +
DMSO
Induc
ed + D
MSO
Induc
ed +
DRB0.0
0.2
0.4
0.6
0.8
1.0
% o
f Inp
ut
!H2AX ChIP at intergenic AsiSI
Mock!H2AX
Unindu
ced +
DMSO
Induc
ed + D
MSO
Induc
ed +
DRB
Unindu
ced +
DMSO
Induc
ed + D
MSO
Induc
ed +
DRB0.00
0.05
0.10
0.1553BP1 ChIP at genic AsiSI
% o
f Inp
ut
Mock53BP1
Unindu
ced +
DMSO
Induc
ed + D
MSO
Induc
ed +
DRB
Unindu
ced +
DMSO
Induc
ed + D
MSO
Induc
ed +
DRB0.0
0.2
0.4
0.6
0.8
1.0!H2AX ChIP at genic AsiSI
% o
f Inp
ut
Mock!H2AX
DMSODRB
DMSODRB
01234567
Fold
cha
nge
rela
tive
to u
nind
uced
Intergenic AsiSI
!H2AX53BP1
*ns
DMSODRB
DMSODRB
0
1
2
3
4
Fold
cha
nge
rela
tive
to u
nind
uced
Genic AsiSI
!H2AX53BP1
**nsA
D
B C
E F
G H
I J
RIF1 DAPI
DM
SO
D
RB
pKAP1 DAPI
DM
SO
D
RB
RNF168 DAPI
DM
SO
D
RB
FK2 DAPI
DM
SO
D
RB
Supplementary Figure 7 IR-induced DDR foci are sensitive to RNAPII inhibition in normal human fibroblasts. (A, B) Accumulation of 53BP1, but not γH2AX, to an AsiSI-induced DSB is impaired in AsiSI-ER BJ-5Ta cells treated with DRB at a genic site. The bar plots show the percentage of ChIP enrichment relative to the input of γH2AX (A) and 53BP1 (B) associated with genomic DNA. Data are shown as one representative of 3 independent experiments. (C) Fold change relative to uninduced cells of γH2AX and 53BP1 enrichment at a genic site (relative to A, B). Values are shown as mean. Error bars indicate SEM (n=3 independent experiments). (D, E) Same analyses as in (A, B) at an AsiSI-ER intergenic site. Data are shown as one representative of 3 independent experiments. (F) Fold change relative to uninduced cells of
γH2AX and 53BP1 enrichment at an intergenic site (relative to D, E). Values are shown as mean. Error bars indicate SEM (n=3 independent experiments). (G-J) Foci of RIF1 (G), pKAP1 (H), RNF168 (I) and ubiquitinylated proteins detected by FK2 antibody (J) are reduced in irradiated normal human fibroblasts (BJ) treated with DRB for 2h at RT before IR. The panel shows representative images. Scale bar 5μm. The bar plot shows the percentage of positive cells (cells with >10 foci for RIF1, RNF168 and FK2 and >3 foci for pKAP1 were considered positive). Error bars indicate SEM (n=3 independent experiments, >150 cells per sample). P value was calculated using two-tailed t-test. *P<0.05, **P<0.01, ****P<0.0001. ns indicates not significant. Statistical source data are provided in Supplementary Table 4.

S U P P L E M E N TA RY I N F O R M AT I O N
WWW.NATURE.COM/NATURECELLBIOLOGY 8
© 2017 Macmillan Publishers Limited, part of Springer Nature. All rights reserved.
Supplementary Figure 8 RNAPII inhibition impairs DNA repair and sequence-specific ASOs reduce DDR foci formation at individual DSBs. (A) Representative images of BJ cells pre-treated with DMSO or DRB for 2 h, irradiated (2Gy) and fixed at the indicated time points (relative to Fig. 6G). Scale bar 5μm (B) Representative images of neutral comet assay. HeLa cells were pre-treated with DMSO or DRB for 2 h, irradiated (5Gy) and collected at the indicated time points (relative to Fig. 7H, I). Scale bar 20μm (C) Quantitative analysis of 53BP1 focus intensity, normalized on Mock sample, of the experiments shown in Fig. 7D. Dots represent individual cells. Black bar represents mean. Error bars indicate SEM (data are shown as pool of n=3 independent experiments, ≥100 cells analysed for each sample). (D) NIH2/4 cells were transfected with the indicated ASOs, irradiated (2Gy) and fixed 1 h post IR. Bar plot shows the percentage of DDR-positive cells (mean of n=2 independent experiments, >50 cells per sample). (E) Schematic representation of ASOs (A and B in red) preventing the interaction between dilncRNAs (light blue) and DDRNAs (dark blue) originating from Tet
sequences in NIH3T3duo cell line. The black arrows indicate the head-to-head configuration of Tet sequences flanking the I-SceI site. (F) Bar plot shows mean fold change normalized to uncut CTL ASO of enrichment relative to input of γH2AX at DAB1 locus at 50, 1000 bp from DSB. Error bars indicate SEM (n=3 independent experiments). (G) Bar plot shows the percentage of enrichment relative to the input of Mock sample at DAB1 locus at 50, 1000 bp from DSB. Data are shown as one representative of 3 independent experiments. (H) Bar plot shows the percentage of enrichment relative to the input of 53BP1 or Mock at RYR2 locus cut by I-PpoI in HeLa cells. Data are shown as one representative of 2 independent experiments. (I) Bar plot shows the percentage of enrichment relative to the input of 53BP1 or Mock at an unrelated region on chromosome 22 not cut by I-PpoI in HeLa cells. Data are shown as one representative of 2 independent experiments. P value was calculated using two-tailed t-test. ****P<0.0001. ns indicates not significant. Statistical source data are provided in Supplementary Table 4.
CTL ASO
CTL ASO
A+D ASOs
B+C ASOs
0.000
0.001
0.002
0.003
0.004
0.005
% o
f Inp
ut
Mock53BP1 ChIP
chr22 (negative control)
CTL ASO
CTL ASO
A+D ASOs
B+C ASOs
0.000
0.001
0.002
0.003
0.004
0.005
% o
f Inp
ut
Mock53BP1 ChIP
RYR2 (positive control)
CTL ASO
CTL ASO
A+D ASOs
B+C ASOs
0.000
0.001
0.002
0.003
0.004
0.005
% o
f Inp
ut
50bp1000bp
Mock
CTL ASO A+D ASOs0
20
40
60
80
100
% o
f DD
R-p
ositi
ve c
ells H2AX
53BP1
Tet repeats Tet repeats I-SceI
ASO A
ASO B ASO A
ASO B
DDRNA dilncRNA
ASO
CTL ASO
A+D ASOs
B+C ASOs
0
1
2
3
4
5
Fold
cha
nge
rela
tive
to u
ncut
CTL
ASO
50 bp1000 bp
H2AX ChIP CTL ASO
A+C A
SOs
B+D A
SOs
A+D A
SOs
B+C A
SOs
INACTIV
E ASOs
0
1
2
3
4
5
53B
P1
focu
s in
tens
ity (A
.U.)
********
********
ns
D
E
H I
I-PpoI induced I-PpoI induced I-PpoI induced
G
NIH2/4 irradiated C
DM
SO
D
RB
1 h post IR 5 h post IR NOT IR
DAPI H2AX
DM
SO
D
RB
DAPI H2AX
1 h post IR 5 h post IR
A B
F

S U P P L E M E N TA RY I N F O R M AT I O N
WWW.NATURE.COM/NATURECELLBIOLOGY 9
© 2017 Macmillan Publishers Limited, part of Springer Nature. All rights reserved.
Unprocessed blots relative to Figure 5A
Unprocessed blot relative to Figure 3E
Unprocessed blots relative to Supplementary Figure 3K
Supplementary Figure 9 Unprocessed blots. Unprocessed blots relative to Figures 3E, 5A and Supplementary Figure 3K.

S U P P L E M E N TA RY I N F O R M AT I O N
WWW.NATURE.COM/NATURECELLBIOLOGY 10
© 2017 Macmillan Publishers Limited, part of Springer Nature. All rights reserved.
Supplementary Table Legends
Supplementary Table 1 Sequences of primers and probes.
Supplementary Table 2 Sequences of RNA oligonucleotides and siRNA.
Supplementary Table 3 Sequences of antisense oligonucleotides.
Supplementary Table 4 Statistical source data.

1
nature research | life sciences reporting summ
aryJune 2017
Corresponding author(s): Fabrizio d'Adda di Fagagna
Initial submission Revised version Final submission
Life Sciences Reporting SummaryNature Research wishes to improve the reproducibility of the work that we publish. This form is intended for publication with all accepted life science papers and provides structure for consistency and transparency in reporting. Every life science submission will use this form; some list items might not apply to an individual manuscript, but all fields must be completed for clarity.
For further information on the points included in this form, see Reporting Life Sciences Research. For further information on Nature Research policies, including our data availability policy, see Authors & Referees and the Editorial Policy Checklist.
Experimental design1. Sample size
Describe how sample size was determined. Sample size was not pre-determined. For imaging analyses of irradiation-induced DDR foci, on average 100 cells per sample were analyzed in each experiment unless stated differently in figure legends. For single-cell high-resolution or confocal imaging analyses, on average 30 cells per sample were analyzed in each experiment unless stated differently in figure legends. Sample size and number of independent experiments are always clearly stated in the figure legend or in the Methods section.
2. Data exclusions
Describe any data exclusions. Throughout the manuscript no data was excluded, only in the case of high resolution DDRNA-Cy5 and smFISH analyses, cells with more than one Lac-GFP spot were excluded because indicative of spurious recombination events.
3. Replication
Describe whether the experimental findings were reliably reproduced.
All experiments were repeated at least 3 times, unless stated differently in figure legends. The main observations of the work were reproduced in different cell lines (human and mouse), in different experimental settings (in cells or cell extracts) and by different technologies (IF, smFISH, ChIP, qRT-PCR). Sample size and number of independent experiments are clearly stated in the figure legend or in the Methods section.
4. Randomization
Describe how samples/organisms/participants were allocated into experimental groups.
No randomization method was used.
5. Blinding
Describe whether the investigators were blinded to group allocation during data collection and/or analysis.
Investigators were not blinded to group allocation during data collection and analysis. However, whenever applicable, quantification of the intensity or the number of foci per nucleus was performed in an unbiased way with the automated image-analysis software CellProfiler 2.1.1 or ImageJ as stated in the Methods section.
Note: all studies involving animals and/or human research participants must disclose whether blinding and randomization were used.

2
nature research | life sciences reporting summ
aryJune 2017
6. Statistical parameters For all figures and tables that use statistical methods, confirm that the following items are present in relevant figure legends (or in the Methods section if additional space is needed).
n/a Confirmed
The exact sample size (n) for each experimental group/condition, given as a discrete number and unit of measurement (animals, litters, cultures, etc.)
A description of how samples were collected, noting whether measurements were taken from distinct samples or whether the same sample was measured repeatedly
A statement indicating how many times each experiment was replicated
The statistical test(s) used and whether they are one- or two-sided (note: only common tests should be described solely by name; more complex techniques should be described in the Methods section)
A description of any assumptions or corrections, such as an adjustment for multiple comparisons
The test results (e.g. P values) given as exact values whenever possible and with confidence intervals noted
A clear description of statistics including central tendency (e.g. median, mean) and variation (e.g. standard deviation, interquartile range)
Clearly defined error bars
See the web collection on statistics for biologists for further resources and guidance.
SoftwarePolicy information about availability of computer code
7. Software
Describe the software used to analyze the data in this study.
MetaMorph software was used to acquire widefield images. Quantification of the number of nuclear foci per nucleus was performed with the automated image analysis software CellProfiler 2.1.1. DeltaVision images were automatically subjected to deconvolution by softWoRx software. For super-resolution data analysis, raw data were processed using Zeiss Zen software to detect single-molecule events above background noise. ImageJ and Fiji softwares were used to analyze and pseudocolor images. Comet tail moment was calculated using OpenComet software. Deep sequencing reads were mapped using Bowtie2 software.
For manuscripts utilizing custom algorithms or software that are central to the paper but not yet described in the published literature, software must be made available to editors and reviewers upon request. We strongly encourage code deposition in a community repository (e.g. GitHub). Nature Methods guidance for providing algorithms and software for publication provides further information on this topic.
Materials and reagentsPolicy information about availability of materials
8. Materials availability
Indicate whether there are restrictions on availability of unique materials or if these materials are only available for distribution by a for-profit company.
Unique materials are available upon request.

3
nature research | life sciences reporting summ
aryJune 2017
9. Antibodies
Describe the antibodies used and how they were validated for use in the system under study (i.e. assay and species).
Primary antibodies for immunofluorescence: γH2AX pS139 (mouse, Millipore 05-636, 1:1000); ATM pS1981 (mouse, Rockland 200-301-400, 1:400); 53BP1 (rabbit, Novus Biologicals NB100-304, 1:1000); RNAPII pSer5 (rabbit, Abcam ab5131, 1:500); RNaseH1 (rabbit, Proteintech 15606-1-AP, 1:200); RIF1 (rabbit, Bethyl A300-569A, 1:1000), pKAP1 (rabbit, Bethyl A300-767A, 1:1000), RNF168 (rabbit, Millipore Abe367, 1:500), mono- and polyubiquitinylated conjugates monoclonal antibody (FK2, Enzo life sciences BML-PW8810-0100, 1:1000). Secondary antibodies for immunofluorescence: donkey anti-mouse or anti-rabbit Alexa 405 (1:200), Alexa 488 (1:500) or Alexa 647 (1:500) IgG (Life Technologies) or goat anti-mouse or anti-rabbit Cy5 (Jackson Immunoresearch). The following antibodies were used for ChIP: RNAPII N-20 (rabbit, SantaCruz, sc899x, 2μg) four mouse cells; total RNAPII (mouse, Abcam, ab817, 5μg); RNAPII pSer2 (rabbit, Abcam ab5095, 2μg) for human cells; RNAPII pSer5 (rabbit, Abcam ab5131, 2μg); γH2AX pS139 (rabbit, Abcam ab2893, 2μg); 53BP1 (rabbit, Novus Biologicals NB100-305, 3μg). Primary antibodies for immunoprecipitation and western blot: RNAPII (POLR2A) (mouse, Santa Cruz 8WG16, IP: 5 μg/1mg of total proteins, WB: 1:50); MRE11 (rabbit polyclonal raised against recombinant human MRE11, gift from S. P. Jackson. Validation data using MRE11-deficient cells or purified recombinant MRN are available upon request. IP: 1 μg/1mg of total proteins, WB: 1:000); NBS1 (rabbit, Novus Biologicals NB100-143 IP: 1 μg/1mg of total proteins, WB: 1:000); RAD50 (Millipore (13B3/2C6) 05-525 IP: 1 μg/1mg of total proteins, WB: 1:000); RNAPII pSer2 (rabbit, Abcam ab5095 WB: 1:1000); RNAPII pSer5 (rabbit, Abcam ab5131 WB: 1:1000).
10. Eukaryotic cell linesa. State the source of each eukaryotic cell line used. NIH2/4 cells (Soutoglou et al., 2007)
NIH3T3duo cells (Roukos et al., 2013) U2OS19ptight (Lemaitre et al., 2012) AsiSI-ER-U20S cells (Iacovoni et al. 2010) To generate AsiSI-ER BJ-5Ta cell line, BJ hTERT Hygro (ATCC, BJ-5Ta) were infected with pBABE HA–AsiSI–ER plasmid (from G. Legube) HeLa cells (ATCC) HeLa111 cells (Lemaitre et al., 2014) Human normal foreskin fibroblast (BJ, ATCC)
b. Describe the method of cell line authentication used. Cell lines are authenticated at each batch freezing by STR profiling (StemElite ID System, Promega).
c. Report whether the cell lines were tested for mycoplasma contamination.
All cell lines are are tested for mycoplasma at each batch freezing with both PCR (C C Uphoff, H G Drexler "Detecting mycoplasma contamination in cell cultures by polymerase chain reaction" , Methods in Molecular medicine 88: Cancer cell culture: methods and protocols, 319-326.) and a biochemical test (MycoAlert, Lonza)
d. If any of the cell lines used are listed in the database of commonly misidentified cell lines maintained by ICLAC, provide a scientific rationale for their use.
No commonly misidentified cell lines were used.
Animals and human research participantsPolicy information about studies involving animals; when reporting animal research, follow the ARRIVE guidelines
11. Description of research animalsProvide details on animals and/or animal-derived materials used in the study.
No animals were used.
Policy information about studies involving human research participants
12. Description of human research participantsDescribe the covariate-relevant population characteristics of the human research participants.
The study did not involve human research participants.