substrate inhibition
TRANSCRIPT
8/12/2019 Substrate Inhibition
http://slidepdf.com/reader/full/substrate-inhibition 1/8
Prospects & Overviews
The biological significance of
substrate inhibition: A mechanism
with diverse functions
Michael C. Reed 1) , Anna Lieb 2) and H. Frederik Nijhout 3)
Many enzymes are inhibited by their own substrates, lead-
ing to velocity curves that rise to a maximum and then
descend as the substrate concentration increases.
Substrate inhibition is often regarded as a biochemical
oddity and experimental annoyance. We show, using sev-
eral case studies, that substrate inhibition often has
important biological functions. In each case we discuss,
the biological significance is different. Substrate inhibition
of tyrosine hydroxylase results in a steady synthesis of
dopamine despite large fluctuations in tyrosine due to
meals. Substrate inhibition of acetylcholinesterase enhan-
ces the neural signal and allows rapid signal termination.
Substrate inhibition of phosphofructokinase ensures that
resources are not devoted to manufacturing ATP when it is
plentiful. In folate metabolism, substrate inhibition main-
tains reactions rates in the face of substantial folate depri-
vation. Substrate inhibition of DNA methyltransferase
serves to faithfully copy DNA methylation patterns when
cells divide while preventing de novo methylation of
methyl-free promoter regions.
Keywords:.biological function; enzyme kinetics; substrate inhibition
The kinetics of an enzymatic reaction are typically studied byvarying the concentration of substrate and plotting the rate oproduct formation as a function of substrate concentration. Inthe conventional case this yields a typical hyperbolicMichaelis-Menten curve, and a linear reciprocal LineweaverBurk plot, from which the kinetic constants of the enzyme canbe calculated. A surprisingly large number of enzymes do notbehave in this conventional way. Instead, their velocity curvesrise to a maximum and then decline as the substrate concen-tration goes up. This phenomenon is referred to as substrateinhibition, and it is estimated that it occurs in some 20% ofenzymes [1]. A partial list of enzymes that show substrateinhibition appears in Box 1.
Substrate inhibition is often interpreted as an abnormality
that comes from using artificially high substrate concentrationin a laboratory setting. In a review article on the mechanismsof substrate inhibition in 1994, Kuehl [2] commented tha‘‘although recognized early on as an almost universaphenomenon, it has nevertheless met an almost universadisinterest. Probably the main reason for this neglect is thatthe majority of enzymologists and many authorities in thefieldregard substrate inhibition as being almost always a nonphysiological phenomenon.’’
There are several reasons for suspecting that substrateinhibition is not a pathological phenomenon, but a biologically relevant regulatory mechanism. First, in many casesnormal substrate concentrations are to the right of the velocitymaximum, which indicates that these enzymes typically oper
ate under substrate inhibition. Second, many enzymes havespecialized sites where a second substrate molecule can bindand act as an allosteric inhibitor. For those enzymes, substrateinhibition is clearly a specially evolved property. Third, evi-dence is accumulating that substrate inhibition plays criticaregulatory roles in a number of metabolic pathways.
Substrate inhibition means that the velocity curve of areaction rises to a maximum as substrate concentrationincreases and then descends either to zero or to a non-zeroasymptote. Many mechanisms are known that can result insuch substrate-velocity curves [3, 4]. Here we discuss twosimple mechanisms. Suppose that an enzyme, E, has two
DOI 10.1002/bies.200900167
1) Department of Mathematics, Duke University, Durham, NC 27708, USA 2) Department of Mathematics, University of Colorado, Boulder, CO 80303,
USA 3) Department of Biology, Duke University, Durham, NC 27708, USA
*Corresponding author:
Michael C. Reed
E-mail: [email protected]
422 www.bioessays-journal.com Bioessays 32: 422–429, 2010 WILEY Periodicals, Inc
P r o b l e m s & P a r a d i g m s
8/12/2019 Substrate Inhibition
http://slidepdf.com/reader/full/substrate-inhibition 2/8
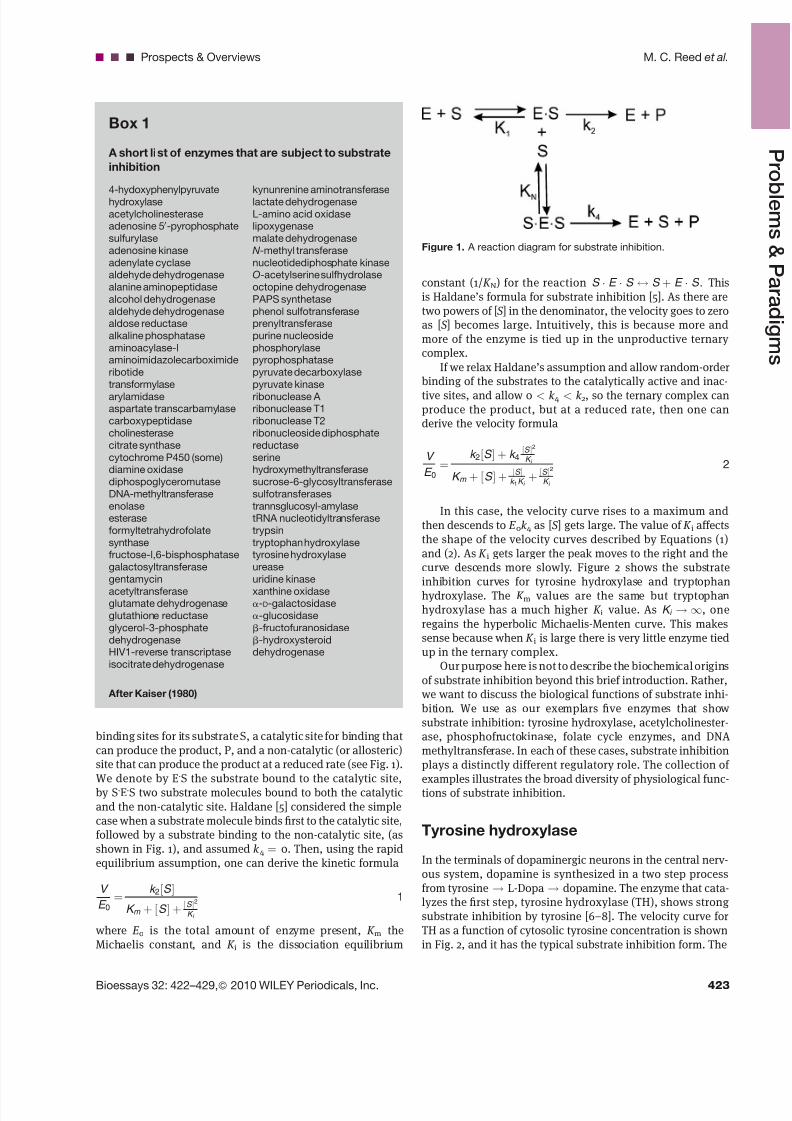
binding sites for its substrate S, a catalytic site for binding thatcan produce the product, P, and a non-catalytic (or allosteric)site that can produce the product at a reduced rate (see Fig. 1).We denote by E.S the substrate bound to the catalytic site,by S.E.S two substrate molecules bound to both the catalyticand the non-catalytic site. Haldane [5] considered the simplecase when a substrate molecule binds first to the catalytic site,followed by a substrate binding to the non-catalytic site, (asshown in Fig. 1), and assumed k 4 ¼ 0. Then, using the rapidequilibrium assumption, one can derive the kinetic formula
V
E 0¼
k 2½S
K m þ ½S þ ½S 2
K i
1
where E 0 is the total amount of enzyme present, K m theMichaelis constant, and K i is the dissociation equilibrium
constant (1/ K N) for the reaction S E S $ S þ E S . Thisis Haldane’s formula for substrate inhibition [5]. As there aretwo powers of [S ] in the denominator, the velocity goes to zeroas [S ] becomes large. Intuitively, this is because more andmore of the enzyme is tied up in the unproductive ternary complex.
If we relax Haldane’s assumption and allow random-orderbinding of the substrates to the catalytically active and inac-
tive sites, and allow 0 < k 4 < k 2, so the ternary complex canproduce the product, but at a reduced rate, then one canderive the velocity formula
V
E 0¼
k 2½S þ k 4½S 2
K i
K m þ ½S þ ½S k 1K i
þ ½S 2
K i
2
In this case, the velocity curve rises to a maximum andthen descends to E 0k 4 as [S ] gets large. The value of K i affectsthe shape of the velocity curves described by Equations (1)and (2). As K i gets larger the peak moves to the right and thecurve descends more slowly. Figure 2 shows the substrateinhibition curves for tyrosine hydroxylase and tryptophanhydroxylase. The K m values are the same but tryptophanhydroxylase has a much higher K i value. As K i ! 1, oneregains the hyperbolic Michaelis-Menten curve. This makessense because when K i is large there is very little enzyme tiedup in the ternary complex.
Our purpose here is not to describe the biochemical originsof substrate inhibition beyond this brief introduction. Rather,we want to discuss the biological functions of substrate inhi-bition. We use as our exemplars five enzymes that showsubstrate inhibition: tyrosine hydroxylase, acetylcholinester-ase, phosphofructokinase, folate cycle enzymes, and DNAmethyltransferase. In each of these cases, substrate inhibitionplays a distinctly different regulatory role. The collection of examples illustrates the broad diversity of physiological func-tions of substrate inhibition.
Tyrosine hydroxylase
In the terminals of dopaminergic neurons in the central nerv-ous system, dopamine is synthesized in a two step processfrom tyrosine ! L-Dopa ! dopamine. The enzyme that cata-lyzes the first step, tyrosine hydroxylase (TH), shows strongsubstrate inhibition by tyrosine [6–8]. The velocity curve forTH as a function of cytosolic tyrosine concentration is shownin Fig. 2, and it has the typical substrate inhibition form. The
Figure 1. A reaction diagram for substrate inhibition.
Box 1
A short list of enzymes that are subject to substrate
inhibition
4-hydoxyphenylpyruvate
hydroxylase
acetylcholinesteraseadenosine 50-pyrophosphate
sulfurylase
adenosine kinase
adenylate cyclasealdehyde dehydrogenase
alanine aminopeptidase
alcohol dehydrogenase
aldehyde dehydrogenasealdose reductase
alkaline phosphatase
aminoacylase-Iaminoimidazolecarboximide
ribotide
transformylase
arylamidaseaspartate transcarbamylase
carboxypeptidase
cholinesterase
citrate synthase
cytochrome P450 (some)diamine oxidase
diphospoglyceromutase
DNA-methyltransferase
enolaseesterase
formyltetrahydrofolate
synthasefructose-l,6-bisphosphatase
galactosyltransferase
gentamycin
acetyltransferaseglutamate dehydrogenase
glutathione reductase
glycerol-3-phosphate
dehydrogenaseHIV1-reverse transcriptase
isocitrate dehydrogenase
kynunrenine aminotransferase
lactate dehydrogenase
L-amino acid oxidaselipoxygenase
malate dehydrogenase
N -methyl transferase
nucleotidediphosphate kinaseO-acetylserine sulfhydrolase
octopine dehydrogenase
PAPS synthetase
phenol sulfotransferaseprenyltransferase
purine nucleoside
phosphorylasepyrophosphatase
pyruvate decarboxylase
pyruvate kinase
ribonuclease A ribonuclease T1
ribonuclease T2
ribonucleoside diphosphate
reductase
serinehydroxymethyltransferase
sucrose-6-glycosyltransferase
sulfotransferases
trannsglucosyl-amylasetRNA nucleotidyltransferase
trypsin
tryptophan hydroxylasetyrosine hydroxylase
urease
uridine kinase
xanthine oxidasea-D-galactosidasea-glucosidaseb-fructofuranosidaseb-hydroxysteroiddehydrogenase
After Kaiser (1980)
...Prospects & Overviews M. C. Reed et al.
Bioessays 32: 422–429, 2010 WILEY Periodicals, Inc. 423
8/12/2019 Substrate Inhibition
http://slidepdf.com/reader/full/substrate-inhibition 3/8
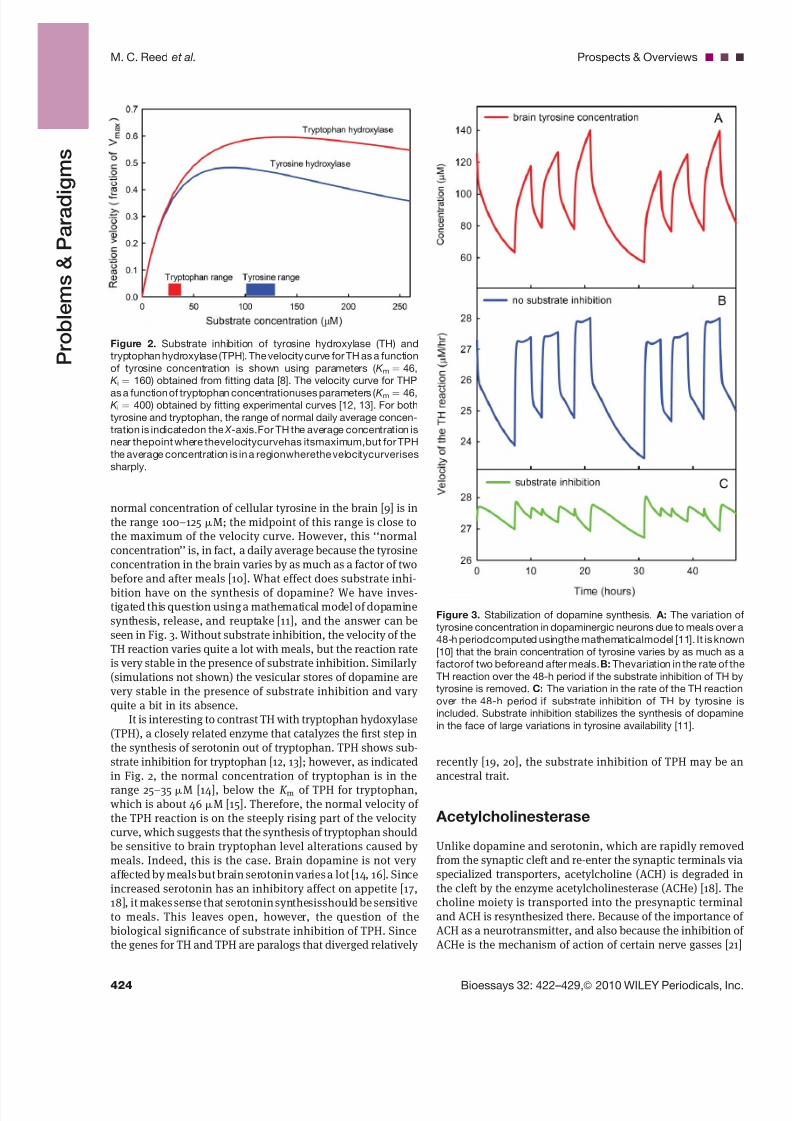
normal concentration of cellular tyrosine in the brain [9] is inthe range 100–125 mM; the midpoint of this range is close tothe maximum of the velocity curve. However, this ‘‘normalconcentration’’ is, in fact, a daily average because the tyrosineconcentration in the brain varies by as much as a factor of twobefore and after meals [10]. What effect does substrate inhi-
bition have on the synthesis of dopamine? We have inves-tigated this question using a mathematical model of dopaminesynthesis, release, and reuptake [11], and the answer can beseen in Fig. 3. Without substrate inhibition, the velocity of theTH reaction varies quite a lot with meals, but the reaction rateis very stable in the presence of substrate inhibition. Similarly (simulations not shown) the vesicular stores of dopamine arevery stable in the presence of substrate inhibition and vary quite a bit in its absence.
It is interesting to contrast TH with tryptophan hydoxylase(TPH), a closely related enzyme that catalyzes the first step inthe synthesis of serotonin out of tryptophan. TPH shows sub-strate inhibition for tryptophan [12, 13]; however, as indicatedin Fig. 2, the normal concentration of tryptophan is in the
range 25–35 mM [14], below the K m of TPH for tryptophan,which is about 46 mM [15]. Therefore, the normal velocity of the TPH reaction is on the steeply rising part of the velocity curve, which suggests that the synthesis of tryptophan shouldbe sensitive to brain tryptophan level alterations caused by meals. Indeed, this is the case. Brain dopamine is not very affected by meals but brain serotonin varies a lot [14, 16]. Sinceincreased serotonin has an inhibitory affect on appetite [17,18], it makes sense that serotonin synthesisshould be sensitiveto meals. This leaves open, however, the question of thebiological significance of substrate inhibition of TPH. Sincethe genes for TH and TPH are paralogs that diverged relatively
recently [19, 20], the substrate inhibition of TPH may be anancestral trait.
Acetylcholinesterase
Unlike dopamine and serotonin, which are rapidly removedfrom the synaptic cleft and re-enter the synaptic terminals viaspecialized transporters, acetylcholine (ACH) is degraded inthe cleft by the enzyme acetylcholinesterase (ACHe) [18]. Thecholine moiety is transported into the presynaptic terminaland ACH is resynthesized there. Because of the importance ofACH as a neurotransmitter, and also because the inhibition oACHe is the mechanism of action of certain nerve gasses [21]
Figure 3. Stabilization of dopamine synthesis. A: The variation o
tyrosine concentration in dopaminergic neurons due to meals over a
48-h periodcomputed usingthe mathematicalmodel [11]. It is known
[10] that the brain concentration of tyrosine varies by as much as a
factorof two beforeand after meals. B: Thevariation in the rate of the
TH reaction over the 48-h period if the substrate inhibition of TH by
tyrosine is removed. C: The variation in the rate of the TH reaction
over the 48-h period if substrate inhibition of TH by tyrosine is
included. Substrate inhibition stabilizes the synthesis of dopamine
in the face of large variations in tyrosine availability [11].
Figure 2. Substrate inhibition of tyrosine hydroxylase (TH) and
tryptophan hydroxylase (TPH). The velocity curve for TH as a function
of tyrosine concentration is shown using parameters ( K m ¼ 46,
K i ¼ 160) obtained from fitting data [8]. The velocity curve for THP
as a function of tryptophan concentrationuses parameters ( K m ¼ 46,K i ¼ 400) obtained by fitting experimental curves [12, 13]. For both
tyrosine and tryptophan, the range of normal daily average concen-
tration is indicatedon the X -axis.For TH the average concentration is
near thepoint where thevelocitycurvehas itsmaximum,but for TPH
the average concentration is in a regionwherethe velocitycurverises
sharply.
M. C. Reed et al. Prospects & Overviews...
424 Bioessays 32: 422–429, 2010 WILEY Periodicals, Inc
P r o b l e m s & P a r a d i g m s
8/12/2019 Substrate Inhibition
http://slidepdf.com/reader/full/substrate-inhibition 4/8
and insecticides [22], the synthesis and structural properties of ACHe have received considerable attention [23–25]. Salpeterand coworkers [26, 27] and Rosenberry and coworkers [28, 29]have carried out detailed studies of the kinetics of ACHrelease, binding to post-synaptic receptors, and degradationby ACHe.
Degradation as a method for clearing the synaptic cleftposes some obvious problems. In order to terminate the signalbefore the next action potential arrives, ACHe should be a very efficient enzyme or have a very high concentration. Indeed, itis known that ACHe is exceptionally efficient [30]. But thenmuch of the released ACH might be degraded before reachingreceptors at the post-synaptic membrane. A solution for thisproblem would be to have ACHe be inhibited by its substrateACH so that when ACH is at high concentrations the degra-dation proceeds relatively slowly and then accelerates as theconcentration drops. Substrate inhibition of ACHe by ACH wasnoticed as long ago as 1969 [31], but its functional importancehasbeen emphasized only recently [28, 32]. For this scenario towork, ACH should be released very rapidly into thecleft so that
the concentration of ACH rises quickly into the inhibitory range. This is exactly what occurs. The peak of the ACHevelocity curve occurs at about 1 mM [28]. The rise time of ACH release is less than 100 ms [26, 33], and the concentrationof ACH is quickly driven past 1 mM and rises to 10 mM andperhaps higher [32]. This is possible because of the very highconcentration of ACH in presynaptic vesicles, approximately 1 M [34].
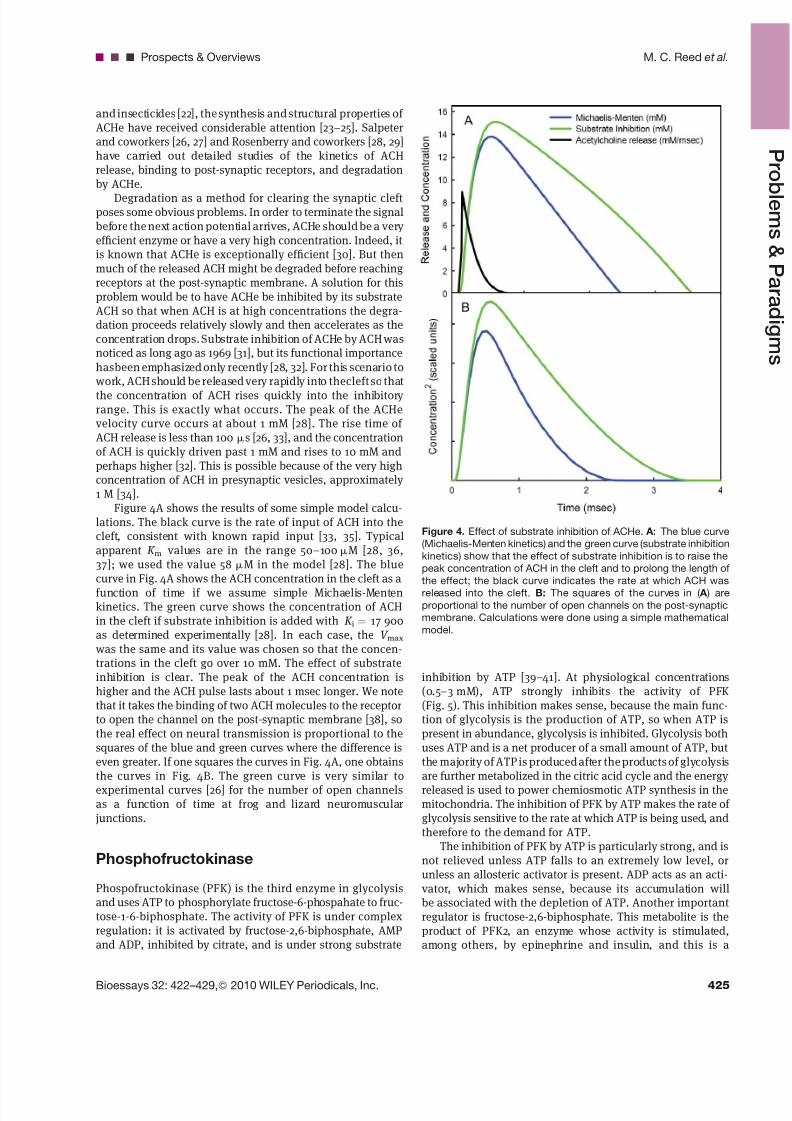
Figure 4A shows the results of some simple model calcu-lations. The black curve is the rate of input of ACH into thecleft, consistent with known rapid input [33, 35]. Typicalapparent K m values are in the range 50–100 mM [28, 36,37]; we used the value 58 mM in the model [28]. The bluecurve in Fig. 4A shows the ACH concentration in the cleft as a
function of time if we assume simple Michaelis-Mentenkinetics. The green curve shows the concentration of ACHin the cleft if substrate inhibition is added with K i ¼ 17 900as determined experimentally [28]. In each case, the V max
was the same and its value was chosen so that the concen-trations in the cleft go over 10 mM. The effect of substrateinhibition is clear. The peak of the ACH concentration ishigher and the ACH pulse lasts about 1 msec longer. We notethat it takes the binding of two ACH molecules to the receptorto open the channel on the post-synaptic membrane [38], sothe real effect on neural transmission is proportional to thesquares of the blue and green curves where the difference iseven greater. If one squares the curves in Fig. 4A, one obtainsthe curves in Fig. 4B. The green curve is very similar to
experimental curves [26] for the number of open channelsas a function of time at frog and lizard neuromuscularjunctions.
Phosphofructokinase
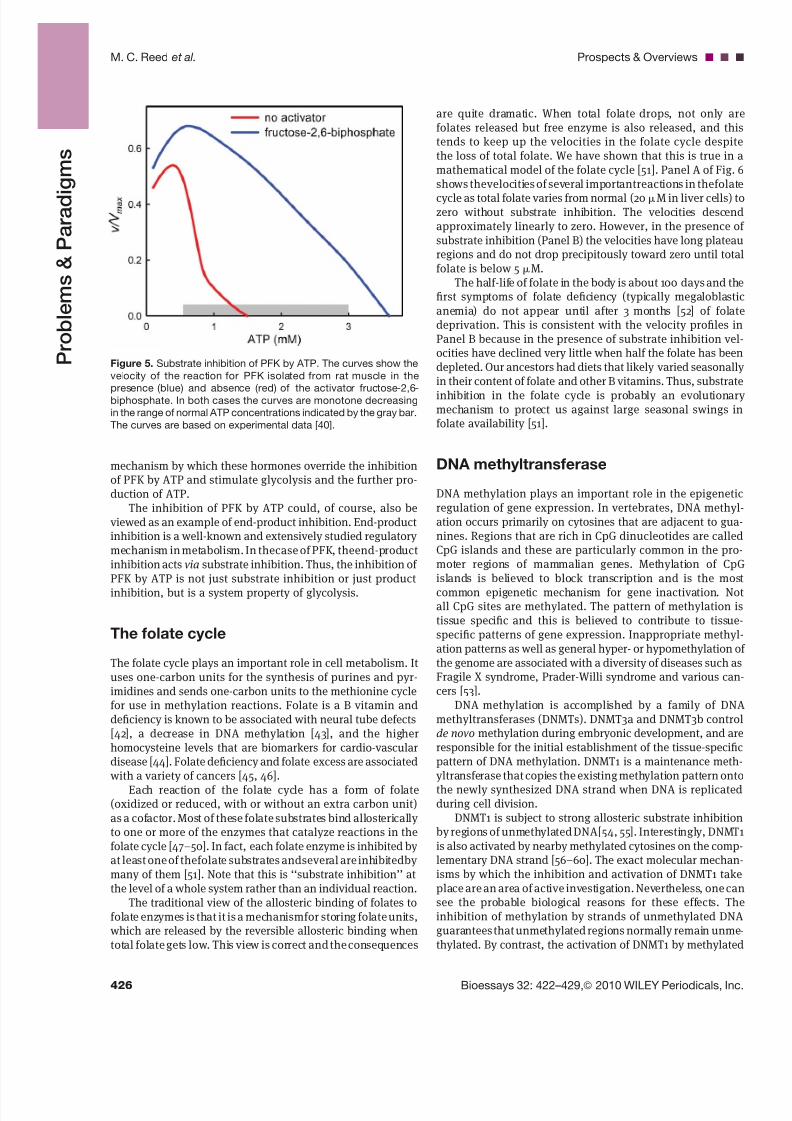
Phospofructokinase (PFK) is the third enzyme in glycolysisand uses ATP to phosphorylate fructose-6-phospahate to fruc-tose-1-6-biphosphate. The activity of PFK is under complexregulation: it is activated by fructose-2,6-biphosphate, AMPand ADP, inhibited by citrate, and is under strong substrate
inhibition by ATP [39–41]. At physiological concentrations(0.5–3 mM), ATP strongly inhibits the activity of PFK(Fig. 5). This inhibition makes sense, because the main func-tion of glycolysis is the production of ATP, so when ATP ispresent in abundance, glycolysis is inhibited. Glycolysis bothuses ATP and is a net producer of a small amount of ATP, butthe majority of ATP is produced after the products of glycolysisare further metabolized in the citric acid cycle and the energy
released is used to power chemiosmotic ATP synthesis in themitochondria. The inhibition of PFK by ATP makes the rate of glycolysis sensitive to the rate at which ATP is being used, andtherefore to the demand for ATP.
The inhibition of PFK by ATP is particularly strong, and isnot relieved unless ATP falls to an extremely low level, orunless an allosteric activator is present. ADP acts as an acti-vator, which makes sense, because its accumulation willbe associated with the depletion of ATP. Another importantregulator is fructose-2,6-biphosphate. This metabolite is theproduct of PFK2, an enzyme whose activity is stimulated,among others, by epinephrine and insulin, and this is a
Figure 4. Effect of substrate inhibition of ACHe. A: The blue curve
(Michaelis-Menten kinetics) and the green curve (substrate inhibition
kinetics) show that the effect of substrate inhibition is to raise the
peak concentration of ACH in the cleft and to prolong the length of
the effect; the black curve indicates the rate at which ACH was
released into the cleft. B: The squares of the curves in ( A ) areproportional to the number of open channels on the post-synaptic
membrane. Calculations were done using a simple mathematical
model.
...Prospects & Overviews M. C. Reed et al.
Bioessays 32: 422–429, 2010 WILEY Periodicals, Inc. 425
8/12/2019 Substrate Inhibition
http://slidepdf.com/reader/full/substrate-inhibition 5/8
mechanism by which these hormones override the inhibitionof PFK by ATP and stimulate glycolysis and the further pro-duction of ATP.
The inhibition of PFK by ATP could, of course, also beviewed as an example of end-product inhibition. End-productinhibition is a well-known and extensively studied regulatory mechanism in metabolism. In thecase of PFK, theend-productinhibition acts via substrate inhibition. Thus, the inhibition of PFK by ATP is not just substrate inhibition or just product
inhibition, but is a system property of glycolysis.
The folate cycle
The folate cycle plays an important role in cell metabolism. Ituses one-carbon units for the synthesis of purines and pyr-imidines and sends one-carbon units to the methionine cyclefor use in methylation reactions. Folate is a B vitamin anddeficiency is known to be associated with neural tube defects[42], a decrease in DNA methylation [43], and the higherhomocysteine levels that are biomarkers for cardio-vasculardisease [44]. Folate deficiency and folate excess are associatedwith a variety of cancers [45, 46].
Each reaction of the folate cycle has a form of folate(oxidized or reduced, with or without an extra carbon unit)as a cofactor. Most of these folate substrates bind allosterically to one or more of the enzymes that catalyze reactions in thefolate cycle [47–50]. In fact, each folate enzyme is inhibited by at least one of thefolate substrates andseveral are inhibitedby many of them [51]. Note that this is ‘‘substrate inhibition’’ atthe level of a whole system rather than an individual reaction.
The traditional view of the allosteric binding of folates tofolate enzymes is that it is a mechanismfor storing folate units,which are released by the reversible allosteric binding whentotal folate gets low. This view is correct and the consequences
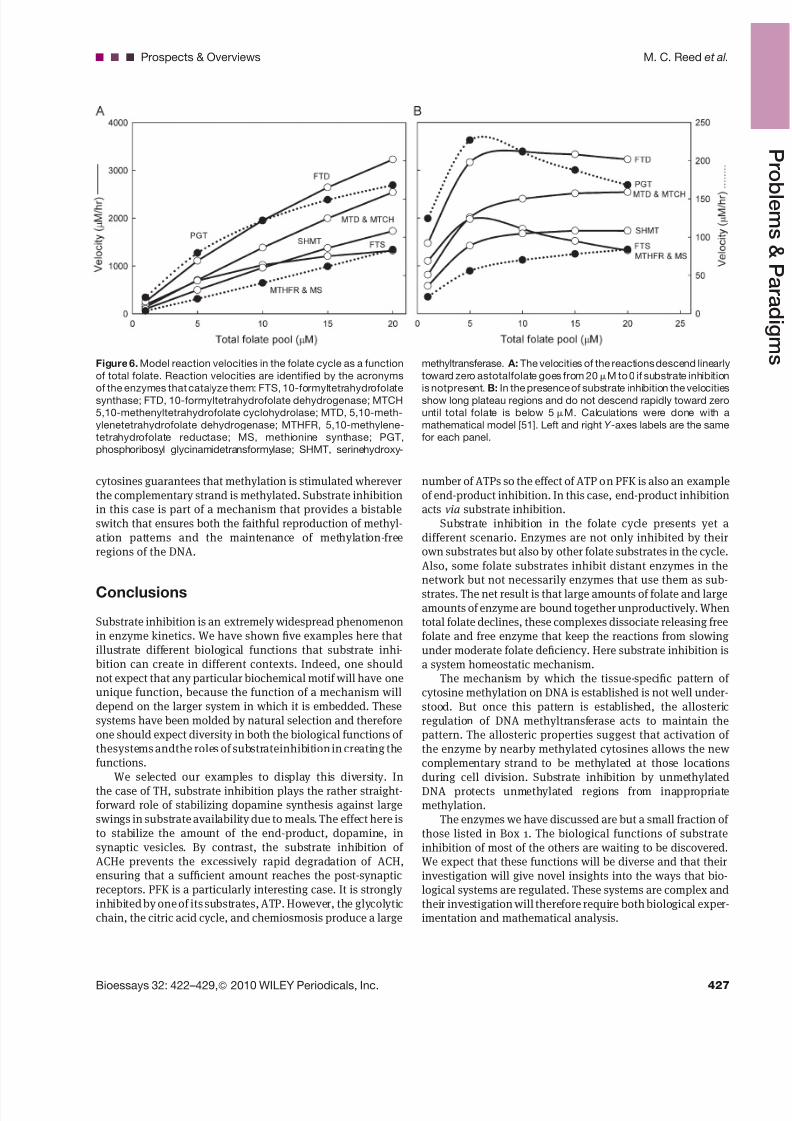
are quite dramatic. When total folate drops, not only arefolates released but free enzyme is also released, and thistends to keep up the velocities in the folate cycle despitethe loss of total folate. We have shown that this is true in amathematical model of the folate cycle [51]. Panel A of Fig. 6shows thevelocities of several importantreactions in thefolate
cycle as total folate varies from normal (20 mM in liver cells) tozero without substrate inhibition. The velocities descendapproximately linearly to zero. However, in the presence ofsubstrate inhibition (Panel B) the velocities have long plateauregions and do not drop precipitously toward zero until totafolate is below 5 mM.
The half-life of folate in the body is about 100 days and thefirst symptoms of folate deficiency (typically megaloblasticanemia) do not appear until after 3 months [52] of folatedeprivation. This is consistent with the velocity profiles inPanel B because in the presence of substrate inhibition velocities have declined very little when half the folate has beendepleted. Our ancestors had diets that likely varied seasonallyin their content of folate and other B vitamins. Thus, substrate
inhibition in the folate cycle is probably an evolutionarymechanism to protect us against large seasonal swings infolate availability [51].
DNA methyltransferase
DNA methylation plays an important role in the epigeneticregulation of gene expression. In vertebrates, DNA methylation occurs primarily on cytosines that are adjacent to guanines. Regions that are rich in CpG dinucleotides are calledCpG islands and these are particularly common in the pro-moter regions of mammalian genes. Methylation of CpGislands is believed to block transcription and is the mos
common epigenetic mechanism for gene inactivation. Noall CpG sites are methylated. The pattern of methylation istissue specific and this is believed to contribute to tissuespecific patterns of gene expression. Inappropriate methylation patterns as well as general hyper- or hypomethylation othe genome are associated with a diversity of diseases such asFragile X syndrome, Prader-Willi syndrome and various cancers [53].
DNA methylation is accomplished by a family of DNAmethyltransferases (DNMTs). DNMT3a and DNMT3b controde novo methylation during embryonic development, and areresponsible for the initial establishment of the tissue-specificpattern of DNA methylation. DNMT1 is a maintenance meth-yltransferase that copies the existing methylation pattern onto
the newly synthesized DNA strand when DNA is replicatedduring cell division.
DNMT1 is subject to strong allosteric substrate inhibitionby regions of unmethylated DNA[54, 55]. Interestingly, DNMTis also activated by nearby methylated cytosines on the complementary DNA strand [56–60]. The exact molecular mechanisms by which the inhibition and activation of DNMT1 takeplace are an area of active investigation. Nevertheless, one cansee the probable biological reasons for these effects. Theinhibition of methylation by strands of unmethylated DNAguarantees that unmethylated regions normally remain unmethylated. By contrast, the activation of DNMT1 by methylated
Figure 5. Substrate inhibition of PFK by ATP. The curves show the
velocity of the reaction for PFK isolated from rat muscle in the
presence (blue) and absence (red) of the activator fructose-2,6-biphosphate. In both cases the curves are monotone decreasing
in the range of normal ATP concentrations indicated by the gray bar.
The curves are based on experimental data [40].
M. C. Reed et al. Prospects & Overviews...
426 Bioessays 32: 422–429, 2010 WILEY Periodicals, Inc
P r o b l e m s & P a r a d i g m s
8/12/2019 Substrate Inhibition
http://slidepdf.com/reader/full/substrate-inhibition 6/8
cytosines guarantees that methylation is stimulated whereverthe complementary strand is methylated. Substrate inhibitionin this case is part of a mechanism that provides a bistableswitch that ensures both the faithful reproduction of methyl-ation patterns and the maintenance of methylation-freeregions of the DNA.
Conclusions
Substrate inhibition is an extremely widespread phenomenonin enzyme kinetics. We have shown five examples here thatillustrate different biological functions that substrate inhi-bition can create in different contexts. Indeed, one shouldnot expect that any particular biochemical motif will have oneunique function, because the function of a mechanism willdepend on the larger system in which it is embedded. Thesesystems have been molded by natural selection and thereforeone should expect diversity in both the biological functions of thesystems andthe roles of substrateinhibition in creating thefunctions.
We selected our examples to display this diversity. Inthe case of TH, substrate inhibition plays the rather straight-forward role of stabilizing dopamine synthesis against largeswings in substrate availability due to meals. The effect here isto stabilize the amount of the end-product, dopamine, insynaptic vesicles. By contrast, the substrate inhibition of ACHe prevents the excessively rapid degradation of ACH,ensuring that a sufficient amount reaches the post-synapticreceptors. PFK is a particularly interesting case. It is strongly inhibited by one of its substrates, ATP. However, the glycolyticchain, the citric acid cycle, and chemiosmosis produce a large
number of ATPs so the effect of ATP on PFK is also an exampleof end-product inhibition. In this case, end-product inhibitionacts via substrate inhibition.
Substrate inhibition in the folate cycle presents yet adifferent scenario. Enzymes are not only inhibited by theirown substrates but also by other folate substrates in the cycle.Also, some folate substrates inhibit distant enzymes in thenetwork but not necessarily enzymes that use them as sub-
strates. The net result is that large amounts of folate and largeamounts of enzyme are bound together unproductively. Whentotal folate declines, these complexes dissociate releasing freefolate and free enzyme that keep the reactions from slowingunder moderate folate deficiency. Here substrate inhibition isa system homeostatic mechanism.
The mechanism by which the tissue-specific pattern of cytosine methylation on DNA is established is not well under-stood. But once this pattern is established, the allostericregulation of DNA methyltransferase acts to maintain thepattern. The allosteric properties suggest that activation of the enzyme by nearby methylated cytosines allows the newcomplementary strand to be methylated at those locationsduring cell division. Substrate inhibition by unmethylatedDNA protects unmethylated regions from inappropriatemethylation.
The enzymes we have discussed are but a small fraction of those listed in Box 1. The biological functions of substrateinhibition of most of the others are waiting to be discovered.We expect that these functions will be diverse and that theirinvestigation will give novel insights into the ways that bio-logical systems are regulated. These systems are complex andtheir investigation will therefore require both biological exper-imentation and mathematical analysis.
Figure 6. Model reaction velocities in the folate cycle as a function
of total folate. Reaction velocities are identified by the acronyms
of the enzymes that catalyze them: FTS, 10-formyltetrahydrofolatesynthase; FTD, 10-formyltetrahydrofolate dehydrogenase; MTCH
5,10-methenyltetrahydrofolate cyclohydrolase; MTD, 5,10-meth-
ylenetetrahydrofolate dehydrogenase; MTHFR, 5,10-methylene-
tetrahydrofolate reductase; MS, methionine synthase; PGT,
phosphoribosyl glycinamidetransformylase; SHMT, serinehydroxy-
methyltransferase. A: The velocities of the reactions descend linearly
toward zero astotalfolate goes from 20 mM to 0 if substrate inhibition
is notpresent. B: In the presence of substrate inhibition the velocitiesshow long plateau regions and do not descend rapidly toward zero
until total folate is below 5 mM. Calculations were done with a
mathematical model [51]. Left and right Y -axes labels are the same
for each panel.
...Prospects & Overviews M. C. Reed et al.
Bioessays 32: 422–429, 2010 WILEY Periodicals, Inc. 427
8/12/2019 Substrate Inhibition
http://slidepdf.com/reader/full/substrate-inhibition 7/8
Acknowledgments
The authors thank Professor Richard Rotundo for helpfulconversations about acetylcholinesterase. This research waspartially supported by NSF grant DMS-061670 and by a grantto Duke University from the Howard Hughes Medical Institute.
References
1. Chaplin M, Bucke C. 1990. Enzyme Technology . Cambridge: Cambridge
University Press.
2. Kuehl PW. 1994. Excess-substrate inhibition in enzymology and
high-dose in pharmacology: a re-interpretation. Biochem J 298: 171–
80.
3. Kaiser PM. 1980. Substrate inhibition as a problem of non-linear steady
state kinetics with monomeric enzymes. J Mol Catal Enzym 8: 431–
42.
4. Bindslev N. 2008. Drug-Acceptor Interactions - Modeling Theoretical
Tools to Test and Evaluate Experimental Equilibrium Effects. Sweden:
Co-Action Publishing.
5. Haldane J. 1930. Enzymes. New York: Longmans, Green and Co.
6. Kumer SC, Vrana KE. 1996. Intricate regulation of tyrosine hydroxylase
activity and gene expression. J Neurochem 67: 443–62.
7. Quinsey NS, Luong AQ, Dickson PW. 1998. Mutational analysis of substrate inhibition in tyrosine hydroxylase. J Neurochem 71: 2132–8.
8. Nakashima A , Mori K , Suzuki T, et al . 1999. Dopamine inhibition of
human tyrosine hydroxylase type I is controlled by the specific portion in
the N-terminus of the enzyme. J Neurochem 72: 2145–53.
9. Bongiovanni R, Young D, Newbould E, et al . 2006. Increased striatal
dopamine synthesis is associated with decreased tissue levels of tyro-
sine. Brain Res 1115: 26–36.
10. Fernstrom J, Fernstrom M. 1994. Dietary effects on tyrosine
availability and catecholamine synthesis in the central nervous system:
possible relevanceto thecontrol of proteinintake. Proc Nutr Soc 53: 419–
29.
11. Best J, Nijhout HF, Reed MC. 2009. Homeostatic mechanisms in dopa-
minesynthesisand release: a mathematical model. TheorBiol MedModel
6: 21.
12. Friedman PA , Kappelman AH, Kaufman S. 1974. Partial purificationand
characterization of tryptophan hydroxylase from rabbit hindbrain. J Biol
Chem 247: 4165–73.
13. McKinney J, Knappskog PM, Haavik J. 2005. Different properties of thecentral and peripheral forms of human tryptophan hydroxylase.
J Neurochem 92: 311–20.
14. Fernstrom J, Fernstrom M. 1995. Brain tryptophan concentrations and
serotonin synthesis remain responsive to food consumption after the
ingestion of sequential meals. Am J Clin Nutr 61: 312–9.
15. Winge I, McKinney JA , Ying M, etal . 2008. Activationand stabilization of
human tryptophan hydroxylase 2 by phosphorylation and 14-3-3 binding.
Biochem J 410: 195–204.
16. Knott PJ, Kurzon G. 1972. Free tryptophan in plasma and brain trypto-
phan metabolism. Nature 239: 452–3.
17. Lucki I. 1998. The spectrum of behaviors influenced by serotonin. Biol
Psychiatry 44: 151–62.
18. Feldman R, M eyer J, Quenzer L. 1997. Principles of
Neuropharmacology . Sunderland, MA: Sinauer Associates, Inc.
19. Craig SP, Buckle VJ, Lamouroux A , et al . 1986. Localization of the
human tyrosine hydroxylase gene to 11p15: gene duplication and evol-
ution of metabolic pathways. Cytogenet Cell Genet 42: 29–32.
20. Ledley FD, Grenett HE, Bartos DP, et al . 1986. Assignment of humantryptophan hydroxylase locus to chromosome 11: gene duplication and
translocation in evolution of aromatic amino acid hydroxylases. Somat
Cell Mol Genet 13: 575–80.
21. Lee EC. 2003. Clinical manifestations of sarin nerve gas exposure. JAMA
290: 659–2.
22. Smissaert HR. 1964. Cholinesterase inhibitionin spider mitessusceptible
and resistant to organophosphate. Science 143: 129–31.
23. Quinn DM. 1987. Acetylcholinesterase: enzyme structure, reaction
dynamics, and virtual transition states. Chem Rev 87: 955–79.
24. Massoulie J, Pezzemente L, Bon S, et al . 1993. Molecular and cellular
biology of cholinesterases. Prog Neurobiol 41: 31–91.
25. Rotundo RL. 2003. Expressionand localization of acetylcholinesterase at
the neuromuscular junction. J Neurocytol 32: 743–66.
26. Anglister L, Stiles JR, Salpeter MM. 1994. Acetylcholinesterase density
and turnover number at frog neuromuscular junctions, with modeling o
their role in synaptic function. Neuron 12: 783–94.
27. Salpeter MM. 1999. The constant junction. Science 286: 424–5.
28. Rosenberry T, MallenderWD, Thomas PJ, etal . 1999.A stericblockade
model for inhibition of acetylcholinesterase by peripheral site ligands and
substrate. Chem Biol Interact 119–120: 85–97.
29. Johnson JJ, Cusack B, Davis MP, et al . 2003. Unmasking tandem site
interaction in human acetylcholinesterase. Substrate activation with acationic acetanilide substrate. Biochemistry 42: 5438–52.
30. Voet D, Voet JG. 1990. Biochemistry . New York: Wiley.
31. Aldridge WN, Reiner E. 1969. Acetylcholinesterase: two types of inhi
bition by an organophosphorus compound: one the formation of phos
phorylated enzyme and the other analogous to inhibition by substrate
Biochem J 115: 147–62.
32. Colletier JP, Fournier D, Greenblatt HM, et al . 2006. Structural insights
into substrate traffic and inhibition in acetylcholinesterase. EMBO J 25
2746–56.
33. Ostroumov K , Shaikhutdinova A , Skorinkin A. 2008. Modeling study o
mecamylamine block of muscle type acetylcholine receptors. Eu
Biophys J 37: 393–402.
34. Whittaker VP. 1987. Cholinergic synaptic vesicles from the electromoto
nerve terminals of Torpedo: composition and life cycle. Ann NY Acad Sc
493: 77–91.
35. Stiles JR, Van Helden D, Bartol TM Jr., et al . 1996. Miniature endplate
current rise timesless than100 microseconds fromimproveddual record
ings can be modeled with passive acetylcholine diffusion from a synapticvesicle. Proc Natl Acad Sci USA 93: 5747–52.
36. Morel N, Massoulie J. 2001. Expression and processing of vertebrate
acetylcholine esterase in the yeast Pichia pastoris. Biochem J 328
121–9.
37. Rosenfield C, Kousba A , Sultanos LG. 2001. Interactions of rat brain
acetylcholinesterase with the detergent triton X-100 and the organophos
phate paraoxon. Tox Sci 63: 208–13.
38. Stiles JR, Kovyazina IV , Salpeter EE, et al . 1999. The temperature
sensitivity of miniature endplate currents is mostly governed by channe
gating: evidence fromoptimizedrecordings and Monte Carlosimulations
Biophys J 77: 1177–87.
39. Mansour TE. 1972. Phosphofructokinase activity in skeletal muscle
extracts following administration of epinepherine. J Biol Chem 19
6059–66.
40. Uyeda K , Furuya E, Lub LJ. 1981. The effect of natural and syntheticD-fructose 2,6-bisphosphate on the regulatory kinetic properties of live
and muscle phosphofructokinases. J Biol Chem 256: 8394–9.
41. Su JY , Storey KB. 1994. Regulation of rainbow trout white musclephosphofructokinase during exercise. Int J Biochem 26: 519–28.
42. Cabrera RM, Hill DS, Etheredge AJ, et al . 2004. Investigations into the
etiology of neural tube defects. Birth Defects Res C Embryo Today 72
330–44.
43. Jacob RA , Gretz DM, Taylor PC, et al . 1988. Moderate folate depletion
increases plasma homocysteine and decreases lymphocyte DNA meth
ylation in postmenopausal women. J Nutr 128: 1204–12.
44. Carmel R, Jacobsen DW. 2001. Homocysteine in Health and Disease
Cambridge: Cambridge University Press, UK.
45. Potter JD. 1999. Colorectal cancer: molecules and populations. J Nat
Cancer Inst 91: 916–32.
46. Ulrich CM, Potter JD. 2007. Folate and cancer: the timing is everything
JAMA 297: 2408–9.
47. Zamierowski MM, Wagner C. 1974. High molecular weight complexes
of folic acid in mammalian tissues. Biochem Biophys Res Commun 60
81–7.
48. Schirch L. 1978. Formyl-methenyl-methylenetetrahydrofolate synthetase
from rabbit liver. Arch Biochem Biophys 189: 283–90.49. Wagner C. 1996. Symposium on the subcellular compartmentation o
folate metabolism. J Nutr 126: 1228S–34S.
50. Cook RJ. 2000. Defining the steps of the folate one-carbon shuffle and
homocysteine metabolism. Am J Clin Nutr 72: 1419–20.
51. Nijhout H, Reed M, Buda P, et al . 2004. A mathematical model of the
folate cycle: new insights into folate homeostasis. J Biol Chem 279
55008–16.
52. Bailey LS. 1995. Folate in Health and Disease. New York: Marcel Decker
53. Robertson KD. 2005. DNA methylation and human disease. Nat Re
Genet 6: 597–610.
54. Flynn J, Fang JY , Maoist JA , et al . 2003. A potent cell-active allosteric
inhibitor of murine DNA cytosine C5 methyltransferase. J Biol Chem 278
8238–43.
M. C. Reed et al. Prospects & Overviews...
428 Bioessays 32: 422–429, 2010 WILEY Periodicals, Inc
P r o b l e m s & P a r a d i g m s
8/12/2019 Substrate Inhibition
http://slidepdf.com/reader/full/substrate-inhibition 8/8
55. Svedruzic ZM, Reich NO. 2005. DNA cytosine C5 methyltransferase
Dnmt1: catalysis-dependent release of allosteric inhibition.
Biochemistry 44: 9472–85.
56. Pradhan P, Bacolla A , Wells RD, et al . 1999. Recombinant human DNA
(cytosine-5) methyltransferase. I. Expression, purification, and compari-
son of de novoand maintenance methylation. J Biol Chem 274: 33002–10.
57. Jones PA , Takai D. 2001. The role of DNA methylation in mammalian
epigenetics. Science 293: 1068–70.
58. Fatemi M, Hermann A , Pradhan S, et al . 2001. The activity of the murineDNA methyltransferase Dnmt1 is controlled by interaction of the catalytic
domain with the N-terminal part of the enzyme leading to an allosteric
activation of the enzyme after binding to methylated DNA. J Mol Biol 309:
1189–99.
59. Lorincz MC, Schuebeler D, Hutchinson SR, et a l . 2002. DNA
methylation density influences the stability of an epigenetic imprint
and Dnmt3a/b-independent de novo methylation. Mol Cell Biol 22:
7572–80.
60. Woo HR, Richards EJ. 2008. Signaling silence – Breaking ground and
spreading out. Genes Dev 22: 1719–23.
...Prospects & Overviews M. C. Reed et al.
Bioessays 32: 422–429, 2010 WILEY Periodicals, Inc. 429