why substrate characterization? anatomic substrate of
TRANSCRIPT
9/8/2012
1
Utility of cardiac MRI for identifying the Arrhythmia Substrate during VT ablation
Timm Dickfeld, MD, PhDDirector of Electrophysiology, VA Baltimore
Associate Professor of Medicine, University of MarylandMACIG (Maryland Arrhythmia and Cardiac Imaging Group)
www.umm.edu/heart/macig
Disclosure-of-Relationship
- Research Grants, Consulting –Biosense-Webster
Unlabeled Indications
- Use of Gadolinium for MRI Scar Imaging
Why Substrate Characterization?
4.3g myocardium = 1.4% LV mass
• In 193 patients LGE of 1.4% resulted in HR >7 for MACE Kwong R. et al. Circulation. 2006;113:2733
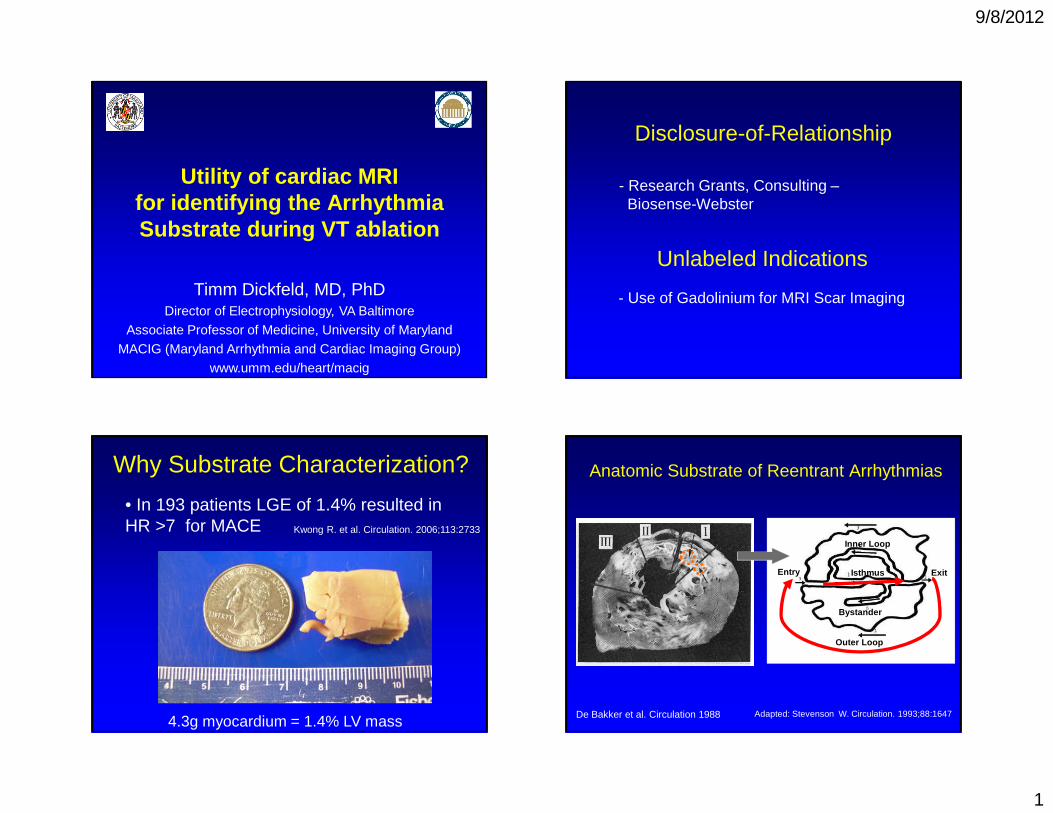
Anatomic Substrate of Reentrant Arrhythmias
De Bakker et al. Circulation 1988 Adapted: Stevenson W. Circulation. 1993;88:1647
Inner Loop
Outer Loop
Bystander
ExitIsthmusEntry

9/8/2012
2
Anatomic Substrate of Reentrant Arrhythmias
De Bakker et al. Circulation 1988
LV Scar
Imaging for Scar Characterization
Clinical Armentarium 2012
Hussein. AHA 2012.
Dickfeld. JACC CV IM;1:73:2008Tian. Circ AE 2010;3:496
Tian. JNM. 2012;53:894Dickfeld .Circ AE. 2011;4:172
ICE
SPECT
PETCT
MRI
Current Routing Use of Scar Imaging
N on e I C E C T MR I P ET
S PE C
T S e
v e ra l M
o da l i .
. .
38%
17%
7%
14%
3%
0%
21%
1. None
2. ICE
3. CT4. MRI
5. PET
6. SPECT7. Several Modalities
Magnetic Resonance Imaging

9/8/2012
3
MRI: Near-Cellular SubstrateResolution
• LAD ligation Rat-infarct model
• LGE ex-vivo 7T MRI
• Voxel: 50x50x50µm
• MRI/histoloy correlation (R2=0.96)
• Ability to detect clefts 2-4 myocytes thick
Schelbert et al. Circ Cardiovasc Imaging 2010;3;743
Results- MRI: 3D Imaging Extraction -
RV MyocardiumLV Endocardium
LV Epicardium
LV Scar
SA MRI Slices
Registration Accuracy: 3.8±1.0mm
3D MRI Integration Correlation: MRI and Voltage
DE MRI Voltage Map

9/8/2012
4
01234567
0 50 100
Scar Transmurality [%]
Bip
olar
Vol
tage
[mV
] r = 0.72
Correlation of Scar Transmurality and Voltage
Dickfeld et al. Circ Arrhythm Electrophysiol. 2011;4:172
MRI Scar and Voltage Mapping
• Best voltage cut-off for MRI scar:- Bipolar voltage: 1.0-1.54mV- Unipolar voltage: 4.46-6.52mV
Desjardins. Heart Rhythm 2009;6:644Codreanu . JACC. 2008;52:839
Dickfeld . Circ Arrhythm Electrophysiol. 2011;4:172
• Comparison MRI and Voltage Scar Area:- MRI scar ~ <0.5mV scar area- MRI scar ~ <1.5mV scar+border zone area
- MRI scar slightly larger than 1.5mV area
• Significant Mismatch: 1/3 of patients
Nakahara . Heart Rhythm 2011;8:1060
Wijnmaalen . Eur Heart J. 2011;32:104
Desjardins. Heart Rhythm 2009;6:644; Dickfeld . Circ Arrhythm Electrophysiol. 2011;4:172
Codreanu . JACC. 2008;52:839Wijnmaalen et al . Eur Heart J. 2011;32:104
A
B
A
B
Mismatch: MRI Scar > Voltage Scar
• Endocardial scar <50% with bipolar voltage ≥ 1.5mVTian J et al. Heart Rhythm 2009; 6:825
Wijnmaalen et al. Eur Heart J. 2011;32:104Dickfeld et al. Circ Arrhythm Electrophysiol. 2011;4:172;
Endocardial layer of ~2mm normal myocardium masks intramural scar (predominantly in septal location)
Mismatch: MRI Scar > Voltage Scar
Dickfeld et al. Circ Arrhythm Electrophysiol. 2011;4:172; Wijnmaalen et al.. Eur Heart J. 2011;32:104

9/8/2012
5
• Suboptimal Catheter Contact:- Frequently basal “pseudoscar”
- Early registration algorithm (e.g. CartoSOUND) corrected 4.1±1.9% falsely low voltage points
• Decreased MRI Sensitivity to detect patchy scar
• Limited Mapping Density: incorrect low voltage extrapolation
Mismatch: Voltage Scar > MRI Scar
Dickfeld et al. Circ Arrhythm Electrophysiol. 2011;4:172
Nakahara et al. Heart Rhythm 2011;8:1060
Desjardins et al. Heart Rhythm 2009;6:644
Codreanu A et al. JACC. 2008;52:839Nakahara et al. Heart Rhythm 2011;8:1060 Image-Guided VT Ablation
MRI-Guided Ablation: Border Zone
Pacemapping Guided by MRI Scar Pacemap Match
Dickfeld et al. Circ Arrhythm Electrophysiol. 2011;4:172
PM 2
- Pacemapping/Fractionation -
Reprojection of PM Site
80-Sector Segmentation
MRI-Guided Ablation: Border Zone
PM 2
Transmurality Display

9/8/2012
6
Surviving Pap. Muscle
Substrate-Guided Mapping
1
2
12
MRI-Guided Ablation: Abnormal Substrate
PM Match
Dickfeld et al. Circ Arrhythm Electrophysiol. 2011;4:172VTLV Voltage Map
MRI-Guided Ablation: Substrate Identification
Mid- and Epicardial Scar with Preserved Endocardial Voltage
MRI-Guided Ablation: Midmyocardial Scar
Dickfeld et al. Circ Arrhythm Electrophysiol. 2011;4:172
Successful RF Site Characteristics
• Bipolar Voltage: 0.60-0.72mV (SD≤0.9)Unipolar Voltage: 1.9-2.20mV (SD≤2.1)
• Fractionated Signals: 32-62%Diastolic Potentials: 23-66%
• Transmurality: 60-68% (SD≤38%)
• Infarct core 17-71%Grey zone/periphery 29-83%
• MRI LGE: 100%
Wijnmaalen et al. . Eur Heart J. 2011;32:104Desjardins et al. Heart Rhythm 2009;6:644
Dickfeld et al. Circ Arrhythm Electrophysiol. 2011;4:172
Perez-David E et al. J Am Coll Cardiol 2011;57:184Gupta et al. JACC CV Imaging. 2012;5:207

9/8/2012
7
VT Case #1• 76 yo pt with PHM of HTN, DM, new recurrent
VT on Amio, CC in OSH: no CAD, EF 35%
LBRI axisCL 420ms
Transition V4, no notching V1/2, QRS onset-nadir V1 <90msWinjmaalen et al. Circ Arrhythm Electrophysiol. 2011;4:486
VT Case #1
12/12 PM
NS VT inducible with burst pacing and PES (2ES)
VT Case #1
What is the VT mechanism?
R ee n t
r a nt V T
A ut o m
a t i c/ t r i
g . . .
D on ’ t
k n ow
27%30%
43%
1. Reentrant VT
2. Automatic/triggered VT
3. Don’t know
Ablation Lesion extending into Scar Substrate
MRI-Guided Ablation: Scar + Ablation
Pre-RFA
PostRFA
Tian et al. Circ Arrhythm Electrophysiol. 2012.1;5(2):epub31

9/8/2012
8
• Further refinement of binary concept (DE+/-)• Introduction of MRI scar core and periphery• Analogous to voltage-defined border zone
De Bakker JM. Circ Arrhythm Electrophysiol 2010; 3:204
‘Grey Zone’- Mixture of Scar and Normal Myocardium -
Schmidt A et al. Circulation. 2007;115:2006
• Grey zone correlated in ischemic patients with all-cause mortality, inducibility of MMVT and appropriate ICD shocks
• Three different definitions:- Scar (>3SD), Grey Zone (2-3 SD), - Scar (>50% max SI), Grey Zone(>peak remote/<50%max SI)- Scar (>50% max SI), Grey Zone (35-50% max SI)
‘Grey Zone’- Mixture of Scar and Normal Myocardium -
Yan A. et al. Circulation 2006;114;32
Roes S. Circ Cardiovasc Imaging. 2009;2:183
• Ischemic swine model (n=17)
• Inducible VT correlated with larger grey zone (25±10% vs. 13±5%)
• Successful RFA of 22 VT, at least one lesion in grey zone
• Residual inducibility found with preserved grey zone
‘Grey Zone’- Mixture of Scar and Normal Myocardium -
Esthner H. Heart Rhythm 2011, doi: 10.1016
Grey Zone – Human Studies
• 18 patients with ischemic CMP and MMVT compared with 18 matched patients
• Scar core (>3SD) and Grey zone (2-3SD)• Continuous grey zone corridors (88% vs. 33%,
p<0.001)• Voltage-map channels corresponded to Grey
zone channels
Perez-David E et al. J Am Coll Cardiol 2011;57:184

9/8/2012
9
Grey Zone – Human Studies
• 10 patients with ischemic CMP and VT RFA• Voltage as gold standard• Best MRI match with FWHM 60% and
subendocardial half-wall thickness (scar r2=0.808; p<0.001 and BZ: r2=0.485; p=0.025)
• Identified 81% of voltage-defined channels
Andreu D. et al. Circ Arrhythm Electrophysiol. 2011;4:674
Scar=redBZ=green
Comparison of Three Grey Zone Algorithms
FWHM NSD Mod. FWHM
Grey Zone Mass (n=41)
Mesubi AHA 2012
Comparison of Three Grey Zone Algorithms
Modified from DeHaan et al. Heart 2011;97:1951
FWHM NSD Mod. FWHM
- 55 ischemic ICD patients; Follow-up of 2.0 years- 26% ventricular arrhythmias
Resolution-Dependency of Grey Zone (partial volume effect)
• LAD-occlusion model in rats (n=8)• 7T MRI with voxel size of 50x50x50 µm• Grey zone increase from 7 to 14% (p<0.01)
Schelbert et al. Circ Cardiovasc Imaging 2010;3;743

9/8/2012
10
Diffusion Spectrum MRI Tractography
• Excised paraffin-embedded rabbit hearts
• LAD occlusion
• 4.6T MRI
• 515 diffusion-encoding gradient vectors
Sosnovik D. Circ Cardiovasc Imaging. 2009;2: 206
Virtual EP Study8 Week Swine LAD/LCX Occlusion Model (n=8)
Ng J et al. JACC 2012;60:423
Simulation Non-contact Mapping
-3T MRI based scar/grey zone reconstruction- GZ Model: +20% ADP, -50% conduction velocity- Predicted inducibility in 6/7 swine; 4 correct/2 opposite channel propagation
Take-Home Points• MRI limitations in clinical practice (ICD, resolution etc)
• Good correlation, some mismatch:- <25% endocardial scar- ≥ 2mm viable endocardial myocardium- catheter contact?
• Facilitate substrate-guided ablation:- Epi/endo approach- Pacemap sites- Ablation sites?
• Grey zone/DTI: Heterogenicity as Possible RF Target
• Possible Future Application: Ablation Lesions Arrhythmic Modelling
Thanks
• Jean Jeudi
• Charlie White
• Jing Tian• Ghada Ahmad
• Steve Shorofsky
• Alejandro Jimenez• Rich Kuk
• Alan McMillan
• Carrol Fitzpatrick
• Kathy Lynch• Debbie Nolan-Reily
• Erma White
• Correy Deans• Rao Gallupalli
www.umm.edu/heart/macig