substance name: pentadecafluorooctanoic acid (pfoa) ec
TRANSCRIPT

Substance Name: Pentadecafluorooctanoic Acid (PFOA)
EC Number: 206-397-9
CAS Number: 335-67-1
MEMBER STATE COMMITTEE SUPPORT DOCUMENT FOR IDENTIFICATION OF
PENTADECAFLUOROOCTANOIC ACID (PFOA)
AS A SUBSTANCE OF VERY HIGH CONCERN BECAUSE OF ITS
CMR1 AND PBT2 PROPERTIES
Adopted on 14 June 2013
1 CMR means carcinogenic, mutagenic or toxic for reproduction 2 PBT means persistent, bioaccumulative and toxic

SVHC SUPPORT DOCUMENT – PFOA
2
CONTENTS Justification .......................................................................................................................... 7 1 Identity of the substance and physical and chemical properties ............................................. 7
1.1 Name and other identifiers of the substance ................................................................ 8 1.2 Composition of the substance .................................................................................... 9 1.3 Physico-chemical properties .................................................................................... 10
2 Harmonised classification and labelling ............................................................................. 10 3 Environmental fate properties ......................................................................................... 11
3.1 Degradation .......................................................................................................... 11 3.1.1 Abiotic degradation .................................................................................... 11 3.1.2 Biodegradation .......................................................................................... 14 3.1.3 Summary and discussion on degradation ...................................................... 19
3.2 Environmental distribution ...................................................................................... 20 3.2.1 Adsorption/desorption ................................................................................ 20 3.2.2 Volatilisation ............................................................................................. 20 3.2.3 Distribution modelling ................................................................................ 20
3.3 Bioaccumulation .................................................................................................... 21 3.3.1 General remarks ........................................................................................ 21 3.3.2 Bioaccumulation in aquatic organisms .......................................................... 22 3.3.3 Terrestrial bioaccumulation ......................................................................... 35 3.3.4 Summary and discussion of bioaccumulation ................................................. 38
4 Human health hazard assessment ................................................................................... 42 4.1 Toxicokinetics (absorption, metabolism, distribution and elimination) ........................... 42
4.1.1 Non-human information .............................................................................. 42 4.1.2 Human information .................................................................................... 44 4.1.3 Bioaccumulation in humans ......................................................................... 48 4.1.4 Conclusion on toxicokinetics and bioaccumulation in humans........................... 51
5 Environmental hazard assessment ................................................................................... 51 6 Conclusions on the SVHC Properties ................................................................................. 51
6.1 PBT, vPvB assessment ............................................................................................ 52 6.1.1 Assessment of PBT/vPvB properties – comparison with the criteria of Annex
XIII .......................................................................................................... 52 6.1.2 Summary and overall conclusions on the PBT, vPvB properties ........................ 56
6.2 CMR assessment.................................................................................................... 56 6.3 Substances of equivalent level of concern assessment. ............................................... 56
7 References.................................................................................................................... 57

SVHC SUPPORT DOCUMENT – PFOA
3
TABLES Table 1: Substance identity ............................................................................................................................... 8 Table 2: Overview of physicochemical properties ..................................................................................... 10
Table 3: Harmonized classification according to the RAC opinion, in accordance with the CLP Regulation (Regulation (EC) 1272/2008) ..................................................................................................... 11
Table 4: Harmonized classification according to the RAC opinion2, in accordance with the criteria of Directive 67/548/EEC ...................................................................................................................... 11 Table 5: Summary of photodegradation studies for APFO and PFOA ................................................ 13 Table 6: Summary of screening tests for PFOA/APFO ............................................................................. 15 Table 7: Summary of simulations tests of PFOA/APFO ........................................................................... 16 Table 8: Examples of measured bioconcentration factors (BCF) of PFOA ....................................... 23 Table 9: Examples of measured bioaccumulation factors (BAF) of PFOA ........................................ 25 Table 10: Biota-sediment accumulation factors (BSAF) analyzed with Lumbriculus variegatus 26 Table 11: Biomagnification factors (BMF) for PFOA ................................................................................. 31 Table 12: Trophic Magnification Factors (TMF) of PFOA ......................................................................... 35 Table 13: BMFs for PFOA in a remote terrestrial food chain (from two different locations) ..... 38 Table 14: TMFs for PFOA in a remote terrestrial food chain (from two different locations) ..... 38
SVHC SUPPORT DOCUMENT – PFOA
4
Substance Name: Pentadecafluorooctanoic Acid (PFOA)
EC Number: 206-397-9
CAS Number: 335-67-1
• The substance is identified as a substance meeting the criteria of Article 57 (c) of Regulation (EC) 1907/2006 (REACH) owing to the recent RAC opinion which concludes that PFOA should be classified as toxic for reproduction category 1B in accordance with the CLP Regulation (Regulation (EC) 1272/2008)3. This corresponds to classification as toxic to reproduction category 2 in accordance with Directive 67/548/EEC.
• The substance is identified as PBT according to Article 57 (d).
Summary of how the substance meets the criteria set out in Article 57(c) and
57(d) of REACH
The free perfluoroocanoic acid (PFOA) stays in equilibrium with perfluorooctanoate (PFO), the conjugate base, in aqueous media in the environment as well as in the laboratory. The ammonium salt (APFO), which is often used in animal experiments, is very soluble in water. In aqueous solution it is present as anion PFO and the ammonium cation. The dissolved anion PFO will stay in equilibrium with the corresponding acid in aqueous media. In the following PFOA refers to the acid (PFOA) as well as to its conjugate base PFO. Therefore conclusions on PFOA/APFO are considered to be valid for APFO/PFOA as well.
Toxic for reproduction:
In its opinion of 2 December 2011 on the proposal for harmonised classification and labelling at EU level of Perfluorooctanoic acid (PFOA) ECHA’s Risk Assessment Committee (RAC) concluded that the evidence is sufficiently convincing to classify PFOA for developmental effects as Repr. 1B (H360D - May damage the unborn child) and as STOT RE 1 (liver) (H372 – Causes damage to organs (liver) through prolonged or repeated exposure) according to CLP criteria (Regulation (EC) 1272/2008) and Repr. Cat. 2 (R61 - May cause harm to the unborn child) and as T; R48/23 (R:40-61-48/23) according to DSD (Council Directive 67/548/EEC).
Therefore, even though the substance is not yet listed in Annex VI of CLP (Regulation (EC) 1272/2008) there is evidence based on the RAC opinion on PFOA that the substance meets the criteria for classification as toxic for reproduction in accordance with Article 57 (c) of REACH. PBT:
A weight of evidence determination according to the provisions of Annex XIII of REACH is used to identify the substance as P and B. The available results are assembled together in a single weight of evidence determination. The individual results have been considered in the assessment with differing weights depending on their nature, adequacy and relevance.
Persistence:
All degradation results show that PFOA is persistent and does not undergo any abiotic or biotic degradation under relevant environmental conditions. According to Annex XIII section 1.1.1, PFOA meets the criteria for being persistent (P) and very persistent (vP).
3 http://echa.europa.eu/about/organisation/committees/rac/committee_opinions_en.asp

SVHC SUPPORT DOCUMENT – PFOA
5
Bioaccumulation:
The numeric criterion as suggested in REACH Annex XIII (sections 1.1.2 and 3.2.2(a)) for a bioaccumulative substance is not fulfilled for PFOA. Due to its notable water solubility, PFOA might quickly be excreted via gill permeation. Furthermore, PFOA occurs mainly in protein rich tissues like blood and liver (OECD, 2006; Kelly et al. 2009). Hence, bioconcentration in gill breathing organisms and the accumulation in lipids may not be the most relevant endpoint to consider. Field studies show, that air-breathing organisms are more likely to biomagnify PFOA compared to water breathing organisms. Therefore, the numerical bioaccumulation (B) criterion defined in the REACH regulation Annex XIII (sections 1.1.2 and 3.2.2(a)) is not suitable for PFOA to assess its bioaccumulation potential.
Annex XIII (section 3.2.2) defines information which should be taken into account when the numerical criterion is not applicable, for example data on the bioaccumulation potential in terrestrial species or in endangered species. PFOA was found in terrestrial species as well as in endangered species as shown for the polar bear and in animals which are likely to become endangered in the near future (narwhale and beluga whale). These findings are of high concern and indicate a bioaccumulation potential.
Furthermore Annex XIII (section 3.2.2 (b)) allows taking data from human body fluids or tissues and the toxicokinetic behavior of a substance into account. For PFOA a gestational and lactational exposure in humans was shown, which are of special concern as the foetus and newborn babies are highly vulnerable to exposure to toxic substances. On top of that data from human body fluids clearly provide quantitative proof of the bioaccumulation of PFOA: Half-lives in humans are around 2-4 years. In addition, recent studies, taking into account relevant confounding factors, show that PFOA blood concentrations in humans increase with increasing age.
Finally Annex XIII (section 3.2.2 (c)) foresees that the ability for biomagnifications in food chains of a substance is assessed. For PFOA field studies provide trophic magnification factors (TMFs) or biomagnification factors (BMFs) for PFOA for aquatic and terrestrial food chains. When air breathing organisms are top predators in these food chains biomagnification was quantitatively demonstrated by TMFs and BMFs > 1 for several food chains, for example TMFs 1.1 – 2.4 in the food chain on wolfs 6.3 – 13 in the food chain of dolphins and 1.4 – 2.6 (protein corrected) in the food chain of beluga whale.
Conclusion:
1. PFOA does not accumulate in water breathing animals
a. BCFs range from 1.8 to 8.0
b. BAFs range from 0.9 to 266
c. BMFs range from 0.02 to 7.2 whereas most of the data are below 1
d. TMFs range from 0.3 to 0.58 in aquatic piscovorous food webs
2. There is evidence that PFOA biomagnifies in air-breathing mammals
a. BMFs range from 1.3 – 125 for selected predator prey relationships
b. TMFs range from 1.1 to 13 for selected food chains
3. PFOA accumulates in humans
a. PFOA is present in human blood of the general population
b. Half-lives in blood range from 2 - 4 years in humans

SVHC SUPPORT DOCUMENT – PFOA
6
c. PFOA levels increase with age after adjusting for relevant confounding factors
d. Elevated levels in human body fluids in population exposed to PFOA contaminated drinking water and in workers in fluorochemical production sites (up to 114,100 ng/ml)
e. Mothers excret PFOA via breast milk and transfer PFOA to infants. After giving birth and at the end of breast feeding PFOA is reaccumulating in maternal blood.
Overall, taken all available information together in a weight of evidence approach the data from environmental species and humans indicates that PFOA bioaccumulates. Therefore it is considered that the B criterion of REACH Annex XIII is fulfilled.
Toxicity
There is evidence based on the RAC opinion on PFOA that the substance meets the criteria for classification as toxic for reproduction in accordance with Article 57 (c) of REACH and as specific target organ toxic after repeated dose cat.1 (STOT RE 1). As a consequence the toxicity criterion of REACH Annex XIII (sections 1.1.3 (b) and (c)) is fulfilled. Conclusion:
In conclusion PFOA meets the criteria for a PBT substance according to Article 57 (d)
PFOA has not been registered under REACH.

SVHC SUPPORT DOCUMENT – PFOA
7
JUSTIFICATION
1 Identity of the substance and physical and chemical
properties
The free perfluoroocanoic acid (PFOA) stays in equilibrium with perfluorooctanoate (PFO), the conjugate base, in aqueous media in the environment as well as in the laboratory. The physico-chemical properties of PFOA and PFO are different. Therefore, the expected environmental fate will depend on the environmental conditions, which influence the equilibrium between base and acid (pH and pKa).
The ammonium salt (APFO), which is often used in animal experiments, is very soluble in water. In aqueous solution it is present as anion PFO and the ammonium cation. The dissolved anion PFO will stay in equilibrium with the corresponding acid in aqueous media.
With currently available analytical methods it is not possible to distinguish between PFO and PFOA in samples. In the literature reporting human and environmental monitoring studies the concentrations are referred to as PFOA or APFO, but always both species (PFO and PFOA) are included in the given concentration.
In the following PFOA refers to the acid (PFOA) as well as to its conjugate base PFO. Only in cases where it is important to distinguish between both species and where species specific knowledge is available it is clearly indicated that either the acid PFOA or the conjugate base PFO is meant.
This Annex XV Report covers both PFOA and APFO. For simplicity, in the
discussions and conclusions in this document PFOA is usually referred to. Based
on the reasoning above, the conclusions are considered to be valid for APFO as
well.

SVHC SUPPORT DOCUMENT – PFOA
8
1.1 Name and other identifiers of the substance
Table 1: Substance identity
EC number: 206-397-9
EC name: Pentadecafluorooctanoic acid
CAS number (in the EC inventory): 335-67-1
CAS number: 335-67-1
CAS name: Octanoic acid, 2,2,3,3,4,4,5,5,6,6,7,7,8,8,8-pentadecafluoro-
IUPAC name: Pentadecafluorooctanoic acid
Index number in Annex VI of the CLP
Regulation
-
Molecular formula: C8HF15O2
Molecular weight range: 414.07 g/mol
Synonyms: Perfluorooctanoic Acid; PFOA; Pentadecafluoro-1-octanoic acid; Perfluorocaprylic acid; Perfluoroheptanecarboxylic acid; Perfluoro-n-octanoic acid; Pentadecafluoro-n-octanoic acid; Pentadecafluorooctanoic acid; n-Perfluorooctanoic acid 1-Octanoic acid, 2,2,3,3,4,4,5,5,6,6, 7,7,8,8,8-pentadecafluoro
Structural formula:
COOH
F F F F F F F
F F F F F F F
F COOH
F F F F F F F
F F F F F F F
F

SVHC SUPPORT DOCUMENT – PFOA
9
1.2 Composition of the substance
Name: Pentadecafluorooctanoic acid (PFOA)
Description: mono constituent substance
Degree of purity: > 99%
The detailed composition of the substance is confidential and provided in the technical dossier.
Pentadecafluorooctanoic acid is a mono constituent substance. The identification of Pentadecafluorooctanoic acid as SVHC is based on the properties of the main constituent only i.e. only the (hypothetical) ideal substance (i.e. purity of 100%) will be included in the Candidate List. However, by definition all mono constituent substances (real substances) with Pentadecafluorooctanoic acid as main constituent will be covered.
Therefore, in this case of a mono-constituent substance other constituents as well as the impurity profile are not relevant for the identification as SVHC.

SVHC SUPPORT DOCUMENT – PFOA
10
1.3 Physico-chemical properties
Table 2: Overview of physicochemical properties
Property Value Remarks
Physical state at 20°C and 101.3 kPa
solid (Kirk-Othmer, 1994)
Melting/freezing point 54.3 °C
44 - 56.5 °C
(Lide, 2003)
(Beilstein, 2005)
Boiling point 188 °C (1013.25 hPa)
189 °C (981 hPa)
(Lide, 2003)
(Kauck and Diesslin, 1951)
Vapour pressure 4.2 Pa (25 °C) for PFOA extrapolated from measured data 2.3Pa (20 °C) for PFOA extrapolated from measured data 128 Pa (59.3 °C) for PFOA measured
(Kaiser et al., 2005); (Washburn et al., 2005) (Washburn et al., 2005) (Washburn et al., 2005)
Water solubility 9.5 g/L (25° C)
4.14 g/L (22°C) (Kauck and Diesslin, 1951)
(Prokop et al., 1989)
PARTITION COEFFICIENT N-OCTANOL/WATER (LOG VALUE)
2.69 at pH7 and 25°C
6.3
Calculated using Advanced Chemistry Development (ACD/Labs) Software V11.02 (© 1994-2012 ACD/Labs). EPI suite [Syracuse_Research_Corporation, 2000-2008] See chapter 3.3.1 for discussion.
Dissociation constant pKa 2.5 2.8 in 50% aqueous ethanol 1.5 - 2.8
(Ylinen et al., 1990) (reliability not assignable) (Brace, 1962) (Kissa, 2001)
pH-value 2.6 (1 g / L at 20 °C)
(Merck, 2005) (reliability not assignable)
2 Harmonised classification and labelling
In March 2010 Norway submitted a CLH dossier for harmonized classification and labelling of PFOA. In December 2011 the Risk Assessment Committee (RAC) concluded that PFOA should be classified as Carc. 2 H351, Repr 1B H360D, Lact H362, STOT RE 1 (liver) H372, Acute tox 4H332, Acute tox 4 H302 and Eye dam 1 H318.
The conclusions included in the RAC opinion presented in Table 3 and Table 4. The RAC opinion has been forwarded to the European Commission for inclusion in Annex VI to the CLP Regulation. On 11 January 2013 the Commission notified the WTO Committee on technical Barriers to Trade of its intention to classify PFOA accordingly.

SVHC SUPPORT DOCUMENT – PFOA
11
Table 3: Harmonized classification according to the RAC opinion4, in accordance with the CLP Regulation (Regulation (EC) 1272/2008)
International
Chemical
Identification
EC No CAS No
Classification
Hazard Class and
Category Code(s) Hazard statement
Code(s)
Pentadecafluorooctanoic acid (PFOA)
206-379-9 335-67-1
Carc. 2, Repr. 1B
Lact STOT RE 1 (liver)
Acute Tox. 4 Acute Tox. 4 Eye dam. 1
H351 H360D H362 H372 H332 H3012 H318
Table 4: Harmonized classification according to the RAC opinion2, in accordance with the criteria of Directive 67/548/EEC
International Chemical
Identification
EC No
CAS No
Classification
Pentadecafluorooctanoic acid (PFOA)
206-379-9 335-67-1
Carc. Cat 3; R40 Repr. Cat. 2: R61:
R64 T; R48/23,
Xn; R48/21/22, R20/22 Xi; R41
Thirty-three notifications (5 aggregated notifications) have been submitted for PFOA to the C&L Inventory. This information is publicly available via the ECHA website at the following link:
http://echa.europa.eu/web/guest/information-on-chemicals/cl-inventory-database.
3 Environmental fate properties
3.1 Degradation
3.1.1 Abiotic degradation
3.1.1.1 Hydrolysis
PFOA is hydrolytically stable under relevant environmental conditions. One study has been discussed in the OECD SIDS Initial Assessment Report for PFOA, which has been copied here in italic letters (OECD, 2006):
4 The RAC opinion on PFOA is available at the following link: http://echa.europa.eu/documents/10162/13579/rac_pfoa_adopted_opinion_en.pdf

SVHC SUPPORT DOCUMENT – PFOA
12
The 3M Environmental Laboratory performed a study of the hydrolysis of APFO (3M Co.,
2001a). The study procedures were based on USEPA’s OPPTS Guideline Document
835.2110; although the procedures do not fulfil all the requirements of the guideline, they
were more than adequate for these studies. Results were based on the observed
concentrations of APFO in buffered aqueous solutions as a function of time. The chosen
analytical technique was high performance liquid chromatography with mass spectrometry
detection (HPLC/MS).
During the study, samples were prepared and examined at six different pH levels from 1.5
to 11.0 over a period of 109 days. Experiments were performed at 50 °C and the results
extrapolated to 25 °C. Data from two of the pH levels (3.0 and 11) failed to meet the data
quality objective and were rejected. Also rejected were the data obtained for pH 1.5
because ion pairing led to artificially low concentrations for all the incubation periods. The
results for the remaining pH levels (5.0, 7.0, and 9.0) indicated no clear dependence of the
degradation rate of PFOA on pH. From the data pooled over the three pH levels, it was
estimated that the hydrolytic half-life of PFOA at 25°C is greater than 92 years, with the
most likely value of 235 years. From the mean value and precision of PFOA concentrations,
it was estimated the hydrolytic half-life of PFOA to be greater than 97 years.
A newer study showed no decomposition of perfluorocarboxylic acids (PFCAs) in hot water in absence of S2O8
2-. After the addition of S2O82- to the reaction system efficient decomposition
of PFCAs has been observed at 80 °C. After a reaction time of 6 hours PFOA was decomposed completely. The reaction products were mainly F- and CO2 at a yield of 77.5 % and 70.2 %, respectively. Short chain PFCAs were a minor reaction product. However, at higher temperatures (150°C) 12.3% of the initial PFOA remained and the yields of F- and CO2 were 24.6 % and 37.0 %, respectively (Hori et al., 2008) (Reliabilty = 2).
In summary, PFOA is hydrolytically stable under environmental conditions.
3.1.1.2 Phototransformation/photolysis
Direct photolysis of a carbon fluorine chain is expected to be very slow, with stability expected to be sustained for more than 1000 years (Environment Canada, 2012).
3.1.1.2.1 Phototransformation in air
A slow indirect photodegradation in air with an atmospheric lifetime of 130 days has been reported (OECD, 2006). This value is predicted from shorter-chain perfluorinated acids (conclusion by analogy). The following information was copied from the OECD SIDS Initial Assessment Report for PFOA (OECD, 2006):
Hurley et al. determined the rate constants of the reactions of OH radicals with a
homologous series of perfluorinated acids (from trifluoroacetic acid to nonafluoropentanoic
acid) in 700 Torr of air at 296 K (Hurley et al., 2004). For C3 to C5 chain length had no
discernible impact on the reactivity of the molecule. The rate constant k(OH +
F(CF2)nCOOH) = (1.69±0.22)×10-13 cm3 molecule-1 s-1 for n = 2, 3, 4, respectively.
Atmospheric lifetimes of F(CF2)nCOOH with respect to reaction with OH radicals are
estimated to be approximately 230 days for n = 1 and 130 days for n > 1. (Calculation of
lifetime by comparison with CH3CCl3 (half-life 5.99 years, k = 1.0×10⁻¹⁴ cm3 molecule-1 s-
1).) The authors conclude, that the major atmospheric loss mechanism of perfluorinated
carboxylic acids is dry and wet (particle mediated) deposition which occur on a time scale
which is probably of the order of 10 days. Reaction with OH is a minor atmospheric loss
mechanism for perfluorinated carboxylic acids.
In summary half-lives of 130 days have been reported for phototransformation in air.

SVHC SUPPORT DOCUMENT – PFOA
13
3.1.1.2.2 Phototransformation in water
Studies on the phototransformation of PFOA in water are summarized in Table 5.
Table 5: Summary of photodegradation studies for APFO and PFOA
Test
Substance
Result Remarks Reliability Reference
APFO No photodegradation Direct photolysis 2 (OECD, 2006);(3M Co., 1979)
APFO No photodegradation Direct and indirect (H2O2; synthethic humic water, Fe2O3) photolysis
1 (OECD, 2006);(3M Co., 2001b)
Estimated half-life > 349 days
Indirect photolysis (Fe2O3)
PFOA Short wave length (<300 nm) used for irradiation → limited relevance for an aqueous environment
2 (Hori et al., 2004)
44.9% of the initial PFOA was decomposed after 24 hours
Direct photolysis;
0.48 MPa O2
35.5% of the initial PFOA was decomposed after 24 hours
Indirect photolysis (H2O2); 0.48 MPa O2
100% of the initial PFOA was decomposed after 24 hours
Indirect photolysis (tungstic heteropolyacid photocatalyst); 0.48 MPa O2
PFOA Short wave length (<300 nm) used for irradiation → limited relevance for an aqueous environment
2 (Hori et al., 2005)
16.8% of the initial PFOA was decomposed after 4 hours
Direct photolysis; 0.48 MPa O2
100% of the initial PFOA was decomposed after 4 hours
Indirect photolysis (S2O82-);
0.48 MPa O2
The following information was copied from the OECD SIDS Initial Assessment Report for PFOA (OECD, 2006):
Direct photolysis of APFO was examined in two separate studies (3M Co., 1979; 3M Co.,
2001b) and photodegradation was not observed in either study. In the 3M (1979) study, a
solution of 50 mg/l APFO in 2.8 litres of distilled water was exposed to simulated sunlight at
22±2 ºC. Spectral energy was characterized from 290-600 nm with a max output at ~360
nm. Direct photolysis of the test substance was not detected.
In the 3M (3M Co., 2001b) study, both direct and indirect photolysis were examined utilizing
techniques based on USEPA and OECD guidance documents. To determine the potential for
direct photolysis, APFO was dissolved in pH 7 buffered water and exposed to simulated

SVHC SUPPORT DOCUMENT – PFOA
14
sunlight. For indirect photolysis, APFO was dissolved in 3 separate matrices and exposed to
simulated sunlight for periods of time from 69.5 to 164 hours. These exposures tested how
each matrix would affect the photodegradation of APFO. One matrix was a pH 7 buffered
aqueous solution containing H2O2 as a well-characterized source of OH radicals. This tested
the propensity of APFO to undergo indirect photolysis. The second matrix contained Fe2O3 in
water that has been shown to generate hydroxyl radicals via a Fenton-type reaction in the
presence of natural and artificial sunlight. The third matrix contained a standard solution of
humic material. Neither direct nor indirect photolysis of APFO was observed based on loss of
starting material. Predicted degradation products were not detected above their limits of
quantitation. There was no conclusive evidence of direct or indirect photolysis whose rates
of degradation are highly dependent on the experimental conditions. Using the iron oxide
(Fe2O3) photoinitiator matrix model, the APFO half-life was estimated to be greater than 349
days.
According to Hori et al., aqueous solutions of PFOA absorb light strongly from the deep UV-
region to 220 nm (Hori et al., 2004). A weak, broad absorption band reaches from 220 to
270 nm (no absorption coefficient stated). The irradiation of a 1.35 mM PFOA solution (29.6
µmol) in water (under 0.48 MPa of oxygen) with light from a xenon-mercury lamp (no
radiant flux stated) for 24 hours resulted in a ca. 44.9 % reduction (13.3 µmol) of PFOA
concentration. Concentrations of CO2 and fluoride increased simultaneously. Small amounts
(0.1-5 µmol) of short chain perfluorinated hydrocarbon acids (C2-C7) were detected. The
addition of the photocatalyst tungsten heteropolyacid ([PW12O40]-) or persulfate (S2O8
2-)
(Hori et al., 2005) accelerates the reaction rate. Due to the short wave length used for
irradiation (< 300 nm) the photodegradation described may be of limited relevance for an
aqueous environment but may be used as a technical process.
In summary no phototransformation of PFOA has been observed under environmental relevant conditions.
3.1.1.2.3 Phototransformation in soil
No data available
3.1.1.3 Summary on abiotic degradation
On the basis of the available data, abiotic degradation of PFOA in the atmosphere is expected to be slow. The atmospheric lifetime of PFOA has been predicted to be 130 days (conclusion by analogy from short-chain perfluorinated acids). In the aqueous phase PFOA is hydrolytically stable (DT50 > 92 years) under environmentally relevant conditions and does not undergo direct photodegradation in natural waters. The estimated half-life for indirect photolysis (addition of Fe2O3) is > 349 days.
3.1.2 Biodegradation
3.1.2.1 Biodegradation in water
Estimated data 3.1.2.1.1 Screening tests
Screening tests for the biodegradation of PFOA are summarized in Table 6.
SVHC SUPPORT DOCUMENT – PFOA
15
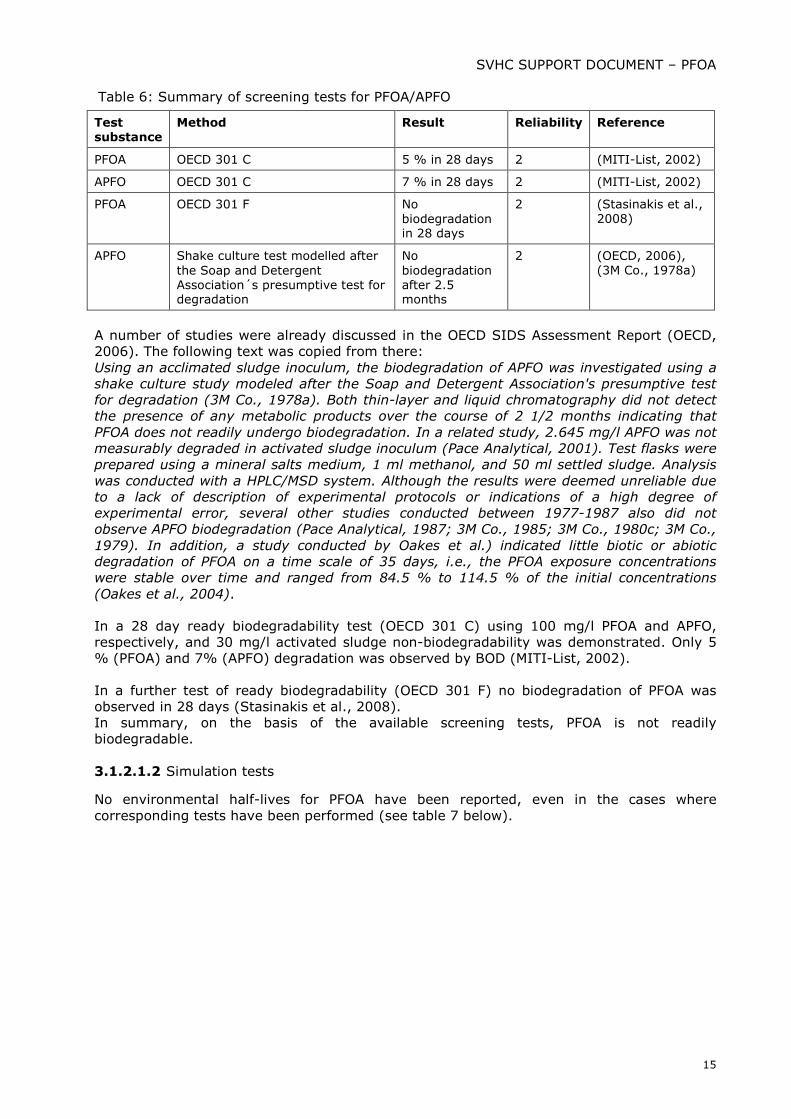
Table 6: Summary of screening tests for PFOA/APFO
Test
substance
Method Result Reliability Reference
PFOA OECD 301 C 5 % in 28 days 2 (MITI-List, 2002)
APFO OECD 301 C 7 % in 28 days 2 (MITI-List, 2002)
PFOA OECD 301 F No biodegradation in 28 days
2 (Stasinakis et al., 2008)
APFO Shake culture test modelled after the Soap and Detergent Association´s presumptive test for degradation
No biodegradation after 2.5 months
2 (OECD, 2006), (3M Co., 1978a)
A number of studies were already discussed in the OECD SIDS Assessment Report (OECD, 2006). The following text was copied from there: Using an acclimated sludge inoculum, the biodegradation of APFO was investigated using a
shake culture study modeled after the Soap and Detergent Association's presumptive test
for degradation (3M Co., 1978a). Both thin-layer and liquid chromatography did not detect
the presence of any metabolic products over the course of 2 1/2 months indicating that
PFOA does not readily undergo biodegradation. In a related study, 2.645 mg/l APFO was not
measurably degraded in activated sludge inoculum (Pace Analytical, 2001). Test flasks were
prepared using a mineral salts medium, 1 ml methanol, and 50 ml settled sludge. Analysis
was conducted with a HPLC/MSD system. Although the results were deemed unreliable due
to a lack of description of experimental protocols or indications of a high degree of
experimental error, several other studies conducted between 1977-1987 also did not
observe APFO biodegradation (Pace Analytical, 1987; 3M Co., 1985; 3M Co., 1980c; 3M Co.,
1979). In addition, a study conducted by Oakes et al.) indicated little biotic or abiotic
degradation of PFOA on a time scale of 35 days, i.e., the PFOA exposure concentrations
were stable over time and ranged from 84.5 % to 114.5 % of the initial concentrations
(Oakes et al., 2004).
In a 28 day ready biodegradability test (OECD 301 C) using 100 mg/l PFOA and APFO, respectively, and 30 mg/l activated sludge non-biodegradability was demonstrated. Only 5 % (PFOA) and 7% (APFO) degradation was observed by BOD (MITI-List, 2002).
In a further test of ready biodegradability (OECD 301 F) no biodegradation of PFOA was observed in 28 days (Stasinakis et al., 2008). In summary, on the basis of the available screening tests, PFOA is not readily biodegradable. 3.1.2.1.2 Simulation tests
No environmental half-lives for PFOA have been reported, even in the cases where corresponding tests have been performed (see table 7 below).

SVHC SUPPORT DOCUMENT – PFOA
16
Table 7: Summary of simulations tests of PFOA/APFO
Test
substance
Method Result Reliability Reference
PFOA Closed-loop systems in laboratory scale;
Aerobic and anaerobic conditions
No elimination 3 (Meesters and Schroeder, 2004; Schröder, 2003)
APFO Biodegradation in mixed bacterial culture and activated sludge
Aerobic conditions
< 0.6 % of 14CO2 was detected after 28 days
4 (Wang et al., 2005)
Sodium pentadeca-fluoro-octanoate
Microcosm study
Aerobic conditions
No significant dissipation from water column after 35 days (initial concentration 0.3 mg/L; 1mg/L; 30 mg/L)
32% dissipation in 35 days (initial concentration 100 mg/L)
3 (Hanson et al., 2005)
PFOA/APFO 1.Preliminary screening:
PFOA serves as an electron acceptor under anaerobic conditions (in combination with different inoculum)
2. Hypothesis refinement: 14C APFO serves as an electron acceptor under anaerobic conditions
No significant consumption of the initial PFOA during 110 – 259 days
No loss of APFO
No production of 14CO2
No detection of radiolabel transformation products
2 (Liou et al., 2010)
In the OECD SIDS Initial Assessment Report it was concluded that PFOA is not expected to undergo biodegradation (OECD, 2006). The following text in italic letters was copied from there:
Schroeder (2003), and Meesters and Schroeder (2004) investigated the biochemical
degradation of PFOA in sewage sludge in laboratory scale reactors. After 25 days under
aerobic conditions PFOA (initial concentration 5 mg/l) was not eliminated by metabolic
processes, mineralization processes or by adsorption (Meesters and Schroeder, 2004;
Schröder, 2003). This study is assessed with reliability 3 due to significant methodological deficiencies.
Wang et al. studied the biodegradation of fluorotelomer alcohols. However, 14C-labelled APFO was used as starting material in this study, too. The authors analyzed the headspace of sealed vessels containing mixed bacterial cultures and vessels containing activated sludge from a domestic sewage treatment plant under continuous air flow. The mixed bacterial culture from industrial wastewater treatment sludge was enriched using 8:2 telomere alcohol and 14C-labelled APFO, respectively. However, for using APFO as a starting material no detailed information are available from the report. The authors describe that potential biodegradation products were separated and quantified by LC/ARC (on-line liquid chromatography/accurate radioisotope counting). Transformation products were identified

SVHC SUPPORT DOCUMENT – PFOA
17
by quadrupole time of flight mass spectrometry. Only <0.6 % of 14CO2 was detected after 28 days. The report contains no graphs or further data to re-evaluate this statement. Although the study seems to be very well documented for 14C labelled 8:2 FTOH, we can only flag the study with a reliability of 4, since details on APFO are not available. The documentation for the results obtained with APFO is missing in the report. However the result indicates that APFO is not biodegradable within 28 days (Wang et al., 2005).
Hanson et al. performed a microcosm study. Microcosms were approximately 1.2 m deep with a water depth of 1 m, a diameter of 3.9 m, and a surface area of 11.95 m². Each microcosm had a capacity of approximately 12 m³ of water. Sediment consisted of a 1:1:1 mixture of sand, loam and organic matter (mainly composted manure). The total carbon content of the sediment was 16.3%. Microcosms were circulated for 2 weeks from a well-fed irrigation pond prior to the experiments. Nominal concentrations of 0.3, 1, 30, and 100 mg/l PFOA, as the sodium salt, plus controls were added to the microcosms. Each exposure was randomly assigned to three separate microcosms from a total of 15 microcosms. Immediately prior to treatment, water flow into each microcosm from the main irrigation pond ceased, creating a closed system relative to the other microcosms and the irrigation pond.
Water chemistry and PFOA analysis were taken at the same time on a regularly basis. Temperature and dissolved oxygen content were measured daily. Water samples were collected with a metal integrated water column sampler. Integrated subsamples from at least 4 randomly selected locations in each microcosm were collected to a total volume of 4 L. Samples were stored at 4 °C until analysis. Water samples were analyzed by ion chromatography. The mobile phase was 0.5 mM NaOH, 5 % methanol, and 5% acetonitrile with a flow rate of 0.4 mL/min. Injection volumes varied from 5,10,75, and 200 µl for the 100, 30, 1 and 0.3 mg/L microcosms, respectively. For each set of samples analyzed five standards and one quality control sample were included at the beginning of each run and again at the end. Radioactive labelling was not performed. Over a 35-day field study PFOA showed no significant dissipation from the water column. However, at the highest concentration (100 mg/L) a partitioning from the water column into other compartments is suspected (32% dissipation in 35 days) (Hanson et al., 2005). Since the documentation of the procedure was insufficient in our opinion the study is not reliable (reliability 3).
Liou et al. investigated the anaerobic biodegradability of PFOA respectively APFO. In a two-phase experiment (preliminary screening, hypothesis refinement) the use of PFOA as a physiological electron acceptor (electron donator: acetate, lactate, ethanol or hydrogen gas) was studied. Additionally, the possibility of co-metabolism of PFOA during reductive dechlorination of trichloroethene and during various physiological conditions (aerobic, nitrate-reducing, iron-reducing, sulfate reducing, and methanogenic) was analyzed. Five different inoculums were used (from a municipal waste-water treatment plant, industrial site sediment, an agricultural soil, and soils from two fire training areas). Environmental samples used as inoculum sources in the biodegradation experiments were aseptically gathered (sterile spatula) placed in 0.5 L sterilized canning jars (filled to the brim), stored on ice in the field, and maintained at 4 °C before being transferred to an anaerobic hood where samples were degassed and dispensed as slurries in biodegradation assays. Soils and sludges were gathered from: the Ithaca sewagetreatment plant; a water-saturated drainage ditch adjacent to the DuPont Chambers Works waste treatment facility in Salem County, New Jersey, previously shown to carry out reductive dechlorination (Fung et al., 2009); the Cornell agricultural field station (Collamer silt loam, Ithaca, NY), the Ithaca fire training facility, and the Rochester, NY fire training facility (the latter two sites were chosen due to potential contamination with fluorinated fire retardant chemicals) (Liou et al., 2010).
For the serum bottle-based biodegradation assays treatments occurred in triplicats (160 ml serum bottles with 100 mL of media; live ± PFOA and abiotic controls, autoclaved for 1 h). For the 14C-PFOA experiments, 15-mL serum bottles were utilized (50% O2-free N2 headspace, 50% inoculated anaerobic test medium) with non-radioactive PFOA and 14C- PFOA (4.5 lCi/mL test medium) to give a final concentration of 100 mg/L PFOA. For establishing the various terminal electron-accepting processes, a standard anaerobic

SVHC SUPPORT DOCUMENT – PFOA
18
procedure was used. The anaerobic mineral salts buffer (plus vitamins and trace minerals) was used as diluents for the various inoculums sources (5% wt/volume) with addition of electron donors (10 mM sodium acetate ± 40 mM sodium lactate or 0.6 mM ethanol or 2 atm H2) or electron acceptors [O2 as air headspace or O2- free N2 headspace in each serum bottle with additions of 30 mM nitrate or 4 mg mL_1 FeOOH or 10 mM sulfate or 0.4 mM trichloroethene (TCE) or no addition (for the methanogenic treatment)]. Samples (1.0 mL) were periodically removed from each serum bottle, placed in 4-mL glass vials sealed with Al-backed caps, immediately mixed with an equal volume of methanol and stored at _20 °C until analyzed. Accumulated batches of samples from serum vials were analyzed for concentrations of PFOA, 14C-PFOA, fluoride, nitrate, sulfate, and potential PFOA transformation products. Headspace gases were sampled with a gas-tight syringe (250 mL) and analyzed for TCE, vinyl chloride and methane. In the radiotracer study, dissolved 14C activity in the anaerobic medium and in the 0.4 N KOH solution retrieved from the internal reservoir to trap 14CO2 were determined by scintillation counting. To assay potential microbial inhibition by PFOA, triplicate serum- bottle assays inoculated with 5% Ithaca sewage were prepared, as above. Anaerobic preparations (±100 ppm PFOA) were assayed for methanogenesis. Aerobic preparations containing 15 ppm naphthalene were sampled as above and analyzed by high-performance liquid chromatography (HPLC). After filtration through nylon acrodisc filters, naphthalene was separated at room temperature. Methanol–water (1:1) was the mobile phase at a flow rate of 1.5 mL/ min. The eluent was monitored by UV VIS at 340 nm. Quantification was done by comparison to authentic standards (Liou et al., 2010). PFOA quantification was performed by LC/MS/MS following a standard procedure. Potential PFOA metabolites were screened by applying LC/MS (Liou et al., 2010).
In no combination of the inoculum source, electron donator or physiological conditions a significant percentage of the initial PFOA (100 ppm and 100 ppb) was consumed (110-259 days). In a test with 14C labelled APFO (inoculum = sewage), no loss of APFO was detected, no 14CO2 was produced and no radiolabelled APFO transformation product was indicated. Co-metabolism of PFOA during reductive dechlorination of trichlorethene was suggested by a drop in PFOA concentration in the 100 ppb treatment after a 65-d incubation. However, extensive analysis failed to determine corroborating transformation products (Liou et al., 2010).
In summary, under conditions which were examined in this study, PFOA is environmentally persistent (Liou et al., 2010).
Although for aerobic conditions no reliable study is available, it can be concluded that the above-mentioned studies support that PFOA respectively APFO is not biodegradable under aerobic conditions. In the environment aerobic as well as anaerobic conditions occur. Hence, simulations tests under both conditions are necessary for assessing the persistence. In conclusion, degradation simulation studies on PFOA demonstrate the high persistence of the compound in various media, like sludge, sediment and water.
3.1.2.2 Biodegradation in sediments
The anaerobic biodegradability of PFOA respectively APFO in industrial site sediment was investigated by Liou et al. (see above 3.1.2.1.3 Simulation tests). No significant amount of the initial PFOA was dissipated after 259 days.
3.1.2.3 Biodegradation in soil
A number of studies were already discussed in the OECD SIDS Initial Assessment Report. The following text was copied from there (OECD, 2006):
Moody and Field (1999) conducted sampling and analysis of samples taken from
groundwater 1 to 3 meters below the soil surface in close proximity to two fire-training

SVHC SUPPORT DOCUMENT – PFOA
19
areas with a history of aqueous film forming foam use. Perfluorooctanoate was detected at
maximum concentrations ranging from 116 to 6750 µg/l at the two sites many years after
its use at those sites had been discontinued. These results suggest that PFOA can leach to
groundwater (Moody and Field, 1999).
Extensive site specific monitoring of soil and ground water concentrations of PFOA and
related substances was conducted by 3M, DuPont Daikin and others. PFOA in soil has been
shown to persist for decades and to be a long term source of groundwater and surface
water contamination (see for example (DuPont Co., 2003; 3M Co., 2005)).
At the DuPont Washington Works site soil contaminated by perfluorochemical waste has
been shown to contain ppm levels of PFOA 3 decades after application ceased. The
underlying groundwater also contains ppm levels of PFOA (DuPont Co., 1999a).
Extensive field monitoring data generated by 3M at the Decatur, AL site have also shown
that PFOA is persistent in soils. Soil samples were collected from a former sludge application
area of the 3M Decatur, AL facility also show soil contamination and underlying groundwater
contamination up to ppm levels decades after application ceased.
Moody et al. investigated groundwater at a former fire-training area at Wurtsmith Air Force Base which was used between 1950s and 1993. Groundwater samples were collected from two types of monitoring wells. All samples were collected in high density polypropylene bottles. Samples were shipped on ice without preservation and stored at 4 °C prior to analysis. Perfluorocarboxylate concentrations were measured as described in the following: Strong anion exchange disks were used to extract perfluorocarboxylates (6 to 8 carbons) from groundwater. The perfluorocarboxylates were simultaneously eluted from the disks and derivatized to their methyl esters by treatment with iodomethane for direct analysis by electron impact gas chromatography-mass spectrometry (GC-MS). A single analysis was conducted for each groundwater sample. The detection limit (defined as a signal-to-noise ratio greater than 3) and quantification limit (defined as a signal-to-noise ratio greater than 10) for perfluorocarboxylates were 3 mg/L and 13 mg/L, respectively, using 2-chlorolepidine as the internal standard. Additionally, electron capture negative chemical ionization GC-MS was employed to confirm the identity of PFOA, in groundwater samples (Moody et al., 2003). Depending on the location of sampling, the concentrations of PFOA were between 8 µg/L and 105 µg/L in groundwater. The authors estimated that perfluorinated surfactants had been in the groundwater for at least five years and possibly for as long as 15 years. This showed that degradation of PFOA was negligible under the environmental conditions at this site (for both soil and groundwater) (Reliability = 2) (Moody et al., 2003).
The anaerobic biodegradability of PFOA and APFO, respectively, in soil from two fire training areas was investigated by Liou et al. (see above 3.1.2.1.3 Simulation tests). No significant amount of the initial PFOA was dissipated after 259 days.
3.1.2.4 Summary and discussion on biodegradation
PFOA is not ready biodegradable using standard test methods. The results of one non-standard aerobic biodegradation simulation test, one non-standard anaerobic biodegradation simulation test and field monitoring data on PFOA from contaminated sites provide evidence that no biodegradation in water, soil and sediment occurs. The monitoring data show that PFOA in soil leaches over time and can be a long term source to underlying groundwater.
3.1.3 Summary and discussion on degradation
Abiotic degradation

SVHC SUPPORT DOCUMENT – PFOA
20
Abiotic degradation of PFOA in the atmosphere is expected to be slow (atmospheric lifetime = 130 days; conclusion by analogy from short-chain perfluorinated acids). The hydrolytic half-life of PFOA at 25°C is greater than 92 years, with the most likely value of 235 years under relevant environmental conditions. No photodegradation of PFOA has been observed in studies conducted under relevant environmental conditions. The estimated DT50 for indirect photolysis is 349 days.
Biotic degradation
Standard screening studies indicate that PFOA is not ready biodegradable. The results of simulation tests and field monitoring data give additional support that no biodegradation in water, soil and sediment did occur.
Conclusion
The stability of organic fluorine compounds has been described in detail by Siegemund et al., 2000: When all valences of a carbon chain are satisfied by fluorine, the zig-zag-shaped carbon skeleton is twisted out of its plane in the form of a helix. This situation allows the electronegative fluorine substituents to envelope the carbon skeleton completely and shield it from chemical attack. Several other properties of the carbon-fluorine bond contribute to the fact that highly fluorinated alkanes are the most stable organic compounds. These include polarizability and high bond energies, which increase with increasing substitution by fluorine. The influence of fluorine is greatest in highly fluorinated and perfluorinated compounds. Properties that are exploited commercially include high thermal and chemical stability (Siegemund et al., 2000).
Based on their molecular properties it is, thus, not surprising, that researchers could not measure degradation of the intensively studied PFOA or its salts.
In summary, PFOA is very persistent and does not undergo any further abiotic or biotic degradation under relevant environmental conditions.
3.2 Environmental distribution
3.2.1 Adsorption/desorption
Not relevant for the SVHC identification of the substance in accordance with Articles 57 (c) and 57 (d).
3.2.2 Volatilisation
Not relevant for the SVHC identification of the substance in accordance with Articles 57 (c) and 57 (d).
3.2.3 Distribution modelling
Not relevant for the SVHC identification of the substance in accordance with Articles 57 (c) and 57 (d).

SVHC SUPPORT DOCUMENT – PFOA
21
3.3 Bioaccumulation
3.3.1 General remarks
A commonly agreed descriptor to estimate the bioaccumulation potential of a substance is its partition coefficient log KOW between water and n-octanol. When evaluating lipophilic substances this partition model sufficiently mimics the extent of uptake by aquatic organisms. For substances which tend to dissociate or are prone to form ionic structures the affinity to n-octanol is diminished resulting in low experimentally observed log KOW values. In contrast to this assumption, it has been demonstrated in field studies that ionic compounds can be efficiently taken up by aquatic organisms and exhibit bioconcentration potential (e.g. perfluorooctanesulfonate). Similar issues emerge when assessing KOW for surface active compounds. In biphasic test systems these surfactants will aggregate in multi-layers or micellar structures yielding colloidal dispersed solutions rather than a partition equilibrium. In such cases an experimental determination of log KOW is hardly feasible.
Nevertheless, in account of the notable water solubility of PFOA, the high degree of dissociation (low pKa value) as well as the inherent lipid repellence, caused by the perfluorinated alkyl chain, the coefficient KOW is hypothesized to be low.
With this approach no preliminary estimation of possible bioconcentration can be gained. The log KOWs given in Table 2 confirm high uncertainties due to their high variability.
This issue has been discussed in detail in the OECD SIDS Initial Assessment Report for PFOA. For consistency, the following text was copied here in italic letters (OECD, 2006):
PFOA does not behave like lipophilic compounds that accumulate in fat tissues. For lipophilic
substances, accumulation is expected preferentially in the fat tissues. Due to the
perfluorination, the hydrocarbon chains are oleophilic and hydrophobic and the
perfluorinated chains are both oleophobic and hydrophobic. In addition, functional groups
attached to the perfluorinated chain (e.g., a charged moiety such as a hydroxyl group or
sulfonic acid) can impart hydrophilicity to part of the molecule. Hydrophobicity is unlikely to
be the sole driving force for the partitioning of perfluorinated substances to tissues because
the oleophobic repellency opposes this partitioning process. Perfluorinated substances are
also intrinsically polar chemicals because fluorine, a highly electronegative element, imparts
polarity. Thus, perfluorinated substances have combined properties of oleophobicity,
hydrophobicity, and hydrophilicity over portions of a particular molecule. Due to these
properties, the assumption that the traditional hydrophobic and lipophilic interactions
between compound and substrate are the main mechanisms governing partitioning may not
be applicable for PFOA.
According to the revised Annex XIII not only the numerical bioaccumulation (B) criterion based on bioconcentration factors can be used to assess the bioaccumulation potential of a substance but also other information can be used in a weight of evidence approach. These information on the bioaccumulation potential are measured elevated levels in biota, information on the ability of the substance to biomagnify in the food chain, data from analysis of human body fluids or tissues and assessment of toxicokinetic behaviour of the substance should also be considered for the assessment using a weight-of-evidence approach.
Information on the bioaccumulation potential of PFOA in humans as well as data from analysis of human body fluids is described in section 4.1.
In general analytical determination of PFOA is challenging. Van Leuween et al. (2006) showed that for example missing standards, blank contaminations and matrix effects could influence the results. However, all studies cited in the following address these challenges by sufficient quality assessment measures, such as the use of mass-labeled standards.

SVHC SUPPORT DOCUMENT – PFOA
22
To the best of our knowledge we have assessed all available studies, whereby only a representative sample of these studies is discussed in detail in this document.
3.3.2 Bioaccumulation in aquatic organisms
3.3.2.1 Bioconcentration factor BCF
Bioconcentration is the process by which a chemical enters an organism and/or is adsorbed on to it as a result of exposure to the chemical in water – it often refers to a condition usually achieved under laboratory and steady state conditions. The BCF is typically measured as the ratio of the chemical concentrations in the organism and the water once a steady state has been achieved:
Water
Biota
c
cBCF =
or alternatively be determined kinetically by using the uptake rate k1 and the depuration rate k2:
2
1
k
kBCF =
The bioconcentration of PFOA has been discussed in detail in the OECD SIDS Initial Assessment Report for PFOA. For consistency, the following text was copied here in italic letters (OECD, 2006):
To determine bioconcentration of PFOA, rainbow trout were exposed in a flow-through
system for 12 days followed by a depuration time of 33 days in fresh water to determine
tissue distribution and bioconcentration (Martin et al., 2003a). For determination of
bioconcentration, juvenile fish (5-10 g) were exposed to a concentration of 1.5 µg/l in a
flow-through system. At 7 occasions during uptake period and 9 occasions during
depuration phase, fish were removed to determine the kinetics of uptake and depuration.
Additionally, for the tissue distribution study, four immature trout (30-48 g) were exposed
in separate tanks but under the same uptake conditions.
PFOA concentration was highest in blood, kidney, liver and gall bladder and low in the
gonads, adipose and muscle tissue. Within the blood, the plasma contained between 94 –
99% of PFOA, with only a minor fraction detectable in the cellular fraction. Recovery from
hearts and spleen was low (<10%).
A steady state was reached during uptake time. Visual observation of depuration data
indicated possible biphasic depuration in blood, liver and carcass. However, this could not
be verified statistically because of the small sample size. The following BCFs are calculated:
BCFcarcass = 4.0 (+- 0.6); depuration half-life: 5.2 d (± 0.67)
BCFblood = 27 (+- 9.7); depuration half-life: 4.5 d (± 1.6)
BCFliver = 8.0 (+- 0.59); depuration half-life: 3.9 d (± 0.28)
PFOA occurs mainly in muscle, blood and organs (liver, kidney) but not in lipid tissue and is
reported for other species such as birds and mammals by several authors.
Fathead minnows (Pimephales promelas) were exposed to PFOA in a static system to a
concentration of 25 mg/L for 13 days, followed by a depuration phase of 15 days. A BCF of

SVHC SUPPORT DOCUMENT – PFOA
23
1.8 was calculated (3M Co., 1995).
Daikin performed a bioaccumulation test according to OECD Guideline 305, with the carp
Cyprinus carpio (Daikin, 2000). The fish were exposed to PFOA concentrations of 5 and 50
µg/l for 28 days. For the higher concentration of 50 µg/l, the steady state was reached after
16 days and a BCF of 3.2 was calculated. For the lower concentration of 5 µg/l, a BCF of 9.4
was determined after 16 days; this level was reduced to ≤ 5.1 after 28 days. No steady
state was reached until end of exposition. Although experiments with fish and other aquatic
species provide evidence that PFOA is not highly bioaccumulative, these results should not
be extrapolated to other animals. Fish gills may provide an additional mode of elimination
and uptake which birds, terrestrial organisms, and marine mammals do not possess (Kelly
et al., 2004).
The BCFs reported from laboratory experiments are summarized in Table 8.
Table 8: Examples of measured bioconcentration factors (BCF) of PFOA
Location Species (tissue) BCF Reliability Reference
Laboratory Fathead minnow 1.8 2 (3M Co.,
1995)
Laboratory Rainbow trout (Carcass) 4.0 ± 0.6 2 (Martin et al., 2003a)
Laboratory Rainbow trout (Blood) 27 ± 9.7
Laboratory Rainbow trout (Liver) 8.0 ± 0.59
Laboratory Carp 3.2-9.4 4 (Daikin, 2000)
Conclusion: BCFs for PFOA are below 2000, indicating no bioconcentration in aquatic organisms due to uptake from the aqueous phase by diffusion via the gills. The high water solubility of PFOA enables fish to quickly excrete this substance via gill permeation, facilitated by the high water throughput (Kelly et al., 2004; Martin et al., 2003a; Martin et al., 2003b). However, bioconcentration values in fish may not be the most relevant endpoint to consider, because other mechanisms of accumulation might be of relevance.
3.3.2.2 Bioaccumulation factors (BAFs)
In field studies on bioaccumulation of chemicals bioaccumulation factors (BAF) are measured. The BAF is typically measured in the field as the ratio of the chemical concentrations in the organism and the surrounding medium (e.g. water in natural ecosystems). In contrast to the BCF, the uptake is not only limited to exposure via water but all routes including diet contributes to the concentration in organisms:
Water
Biota
c
cBAF =
where chemicals concentration in the organism (cbiota) is usually expressed in units of gram of chemical per kilogram of organism. The weight of the organism can be expressed on a wet weight basis or appropriately normalized, if needed, (e.g. lipid- or protein-normalized) (Conder et al., 2011). BCFs are measured under controlled laboratory conditions, whereas the BAF is a field measurement and therefore different from BCF. Once taken up into the body, perfluorinated substances tend to partition to liver and blood. Most field measurements for these substances have been performed on those individual organs and tissues. This is especially true for organisms at the higher trophic levels (e.g., polar bear), where whole-body analysis is not feasible for ethical reasons and due to the challenging logistics with respect to sampling and laboratory constraints. While it is feasible to measure

SVHC SUPPORT DOCUMENT – PFOA
24
whole-body BAFs on smaller species at lower trophic levels, the lower trophic status of the organism means that the estimated overall BAFs for perfluorinated substances may be underestimated. Thus, from a toxicological perspective, BCFs, BAFs and BMFs based on concentrations in individual organs, such as the liver, may be more relevant when the potential for direct organ-specific toxicity (i.e. liver toxicity) is being predicted. As shown by Kudo et al. (2000) PFCAs cause hepatomegaly in rodents which is an indicator for hepatotoxicity. This study investigated PFCAs with 7–10 carbon chain lengths. Upham et al. (1998) showed in their study that PFOA can inhibit gap junctional intercellulular communication in a dose dependent manner. This mode of action has been linked to the tumor-promoting properties of many carcinogens. Furthermore there is evidence based on the RAC opinion that indicates that PFOA meets the criteria as STOT RE 1 for liver. Thus PFOA is inherently toxic. Retention in protein-rich compartments may be toxicologically significant (Kelly etal 2009). Thus, from a toxicological perspective, BCFs based on concentrations in individual organs, such as the liver, may be more relevant when the potential for direct organ-specific toxicity (i.e., liver toxicity) is being predicted. On the other hand BCFs and particularly BMFs based on concentrations in whole organisms may provide a useful measure of overall potential for transfer up the food chain.
Although some authors describe BCF values in their field studies, it would be more appropriate to consider them as BAFs, because it cannot be excluded that the tested organisms did not take up PFOA via the diet. BAFs are given in Table 9. The following text in italic letters was copied from the OECD SIDS Initial Assessment Report for PFOA (OECD, 2006).
The bioaccumulation of PFOA in the wild turtles Trachemys scripta elegans and Cinemy
reevesii was reported by Morikawa et al. 2005. Serum concentrations of PFOA from 94
turtles were compared to surface water samples from the site of the turtle capture for
several rivers in Japan. In Ai River water concentrations up to 87,100 ng/l were reported.
Serum concentrations in turtles collected in Ai River ranged from 47.1 to 115.6 ng/l, the
corresponding BCFserum values ranged from 0.9 to 2.9. In Taisyo River water concentrations
of 42.3 and 63.4 ng/l (two samples) and 9800 ng/l (one sample) were detected. Serum
concentrations of 0.4 and 1.0 ng/l were reported for the turtles collected in low water
concentration sides, and 7.6 ng/l were reported for turtles collected in high water
concentration sides; corresponding BCFserum of 10-15.8 and 0.8 to 15.8 were reported with
surface water concentrations ranging from 21.8 to 87,100 ng/l. However, as the wild turtles’
exposure to PFOA was probably not limited to surface water only, the BCFs reported by
Morikawa et al (Morikawa et al., 2005) may actually be BAFs.
Quinete et al. investigated the accumulation of PFOA in mussels (n=3-4), fish (n=7-15), and dolphins (n=10) at different sampling sites in south eastern Brazil. BCFs (BAFs) were calculated based on PFOA concentrations measured in water and fish collected from the sample area. Up to 3.3 ng L-1 PFOA were found in water. BCFs (BAFs) for different species ranged from 0.9 (croaker) to 266 (mussel) (Quinete et al., 2009).
Loi et al. investigated a subtropical pelagic food web in a nature reserve including phytoplankton (n=1), zooplankton (n=2), gastropod (n=3), worm (n=2-3), shrimp (n=2-3), fish (n=2-6), and water bird (n=3). Samples were collected between 2008 and 2010. Surface water (n=12) and sediment samples (n=6) were collected concurrently with the biota samples. Livers samples from water birds were all collected in 2003. A BAF for the phytoplankton for PFOA of 292 was derived (Loi et al., 2011).
SVHC SUPPORT DOCUMENT – PFOA
25
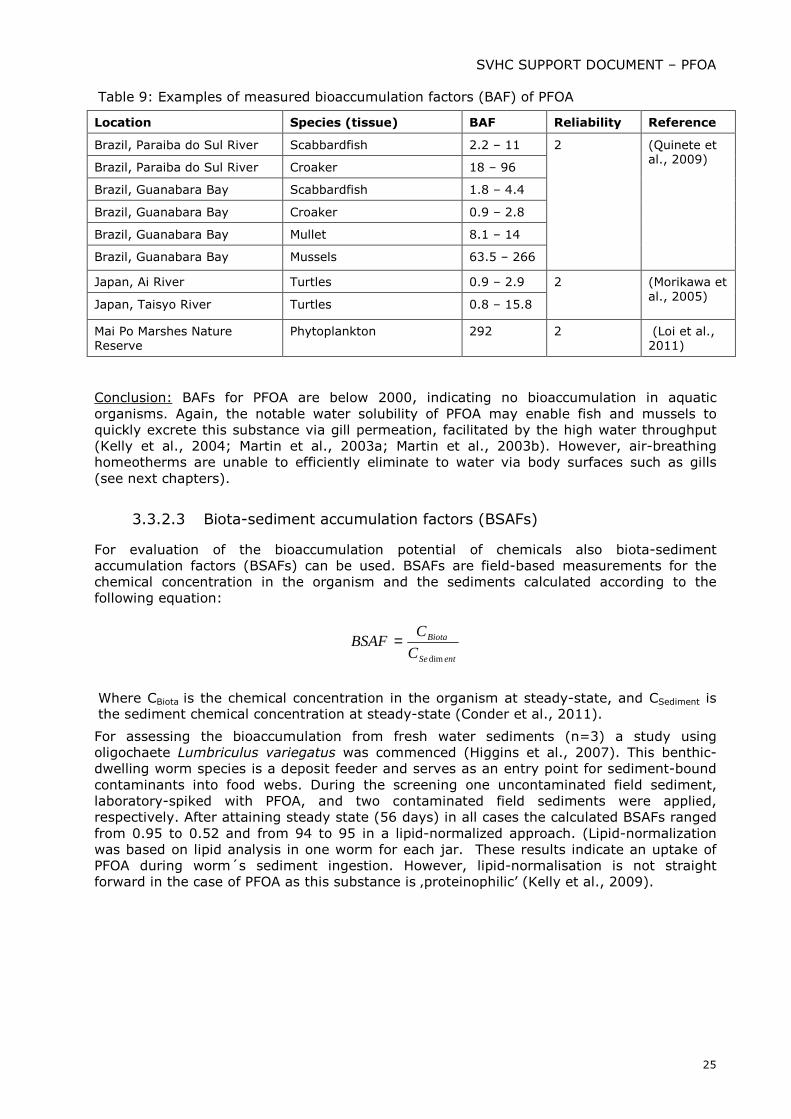
Table 9: Examples of measured bioaccumulation factors (BAF) of PFOA
Location Species (tissue) BAF Reliability Reference
Brazil, Paraiba do Sul River Scabbardfish 2.2 – 11 2 (Quinete et al., 2009)
Brazil, Paraiba do Sul River Croaker 18 – 96
Brazil, Guanabara Bay Scabbardfish 1.8 – 4.4
Brazil, Guanabara Bay Croaker 0.9 – 2.8
Brazil, Guanabara Bay Mullet 8.1 – 14
Brazil, Guanabara Bay Mussels 63.5 – 266
Japan, Ai River Turtles 0.9 – 2.9 2 (Morikawa et al., 2005)
Japan, Taisyo River Turtles 0.8 – 15.8
Mai Po Marshes Nature Reserve
Phytoplankton 292 2 (Loi et al., 2011)
Conclusion: BAFs for PFOA are below 2000, indicating no bioaccumulation in aquatic organisms. Again, the notable water solubility of PFOA may enable fish and mussels to quickly excrete this substance via gill permeation, facilitated by the high water throughput (Kelly et al., 2004; Martin et al., 2003a; Martin et al., 2003b). However, air-breathing homeotherms are unable to efficiently eliminate to water via body surfaces such as gills (see next chapters).
3.3.2.3 Biota-sediment accumulation factors (BSAFs)
For evaluation of the bioaccumulation potential of chemicals also biota-sediment accumulation factors (BSAFs) can be used. BSAFs are field-based measurements for the chemical concentration in the organism and the sediments calculated according to the following equation:
entSe
Biota
C
CBSAF
dim
=
Where CBiota is the chemical concentration in the organism at steady-state, and CSediment is the sediment chemical concentration at steady-state (Conder et al., 2011).
For assessing the bioaccumulation from fresh water sediments (n=3) a study using oligochaete Lumbriculus variegatus was commenced (Higgins et al., 2007). This benthic-dwelling worm species is a deposit feeder and serves as an entry point for sediment-bound contaminants into food webs. During the screening one uncontaminated field sediment, laboratory-spiked with PFOA, and two contaminated field sediments were applied, respectively. After attaining steady state (56 days) in all cases the calculated BSAFs ranged from 0.95 to 0.52 and from 94 to 95 in a lipid-normalized approach. (Lipid-normalization was based on lipid analysis in one worm for each jar. These results indicate an uptake of PFOA during worm´s sediment ingestion. However, lipid-normalisation is not straight forward in the case of PFOA as this substance is ‚proteinophilic’ (Kelly et al., 2009).

SVHC SUPPORT DOCUMENT – PFOA
26
Table 10: Biota-sediment accumulation factors (BSAF) analyzed with Lumbriculus
variegatus
Location Sediment BSAF Reliability Reference
Lipid normalized
non lipid-normalized
2
Downstream from two WWTP, California
Sediment 1 (CA1
(56 days 95 ± 20 0.74 ± 0.12 (Higgins et
al., 2007)
Sediment 2 (CA2
(56 days
94 ± 14 0.52 ± 0.07
Laboratory estimated steady-state values
33 ± 12 0.95 ± 0.13
Conclusion: One study is available for BSAFs for PFOA. The results of this study indicate a higher concentration in the benthic-dwelling worm than in the sourrounding environment if data are lipid-normalised. However, this approach is not straight-forward because PFOA does not enrich in lipids. Non-normalised BSAF do not show an increased concentration in the worms.
3.3.2.4 Biomagnification factors (BMFs)
Besides bioconcentration also biomagnification describes the potential of a chemical to bioaccumulate. Biomagnification factors (BMFs) can be measured in the laboratory in a fashion similar to that used in the OECD and US-EPA bioconcentration test protocols. Organisms are exposed to a chemical preliminary via diet. The BMF test typically includes an uptake phase, where levels of chemicals are followed over time, ideally until the chemical concentration in the organism no longer changes with time (i.e., reaching the steady-state). If a steady-state cannot be reached in the experiment, the uptake phase is followed by a depuration phase where organisms are exposed to uncontaminated food. The rate of decline in chemical concentration over time measured in the depuration phase can then be used to derive the chemical uptake rate from which a hypothetical steady-state concentration can be estimated (Conder et al., 2011).
The laboratory-derived BMF is calculated using the ratio of the chemical concentrations in the test animals at steady-state and their diet:
diet
biota
C
CBMF =
where chemical concentration in the organism (Cbiota) and its diet (Cdiet) are appropriately normalized, if needed, (e.g., lipid- or protein-normalized) (Conder et al., 2011).

SVHC SUPPORT DOCUMENT – PFOA
27
BMF values based on field studies are based on the ratio of the concentration in the predator and the prey:
prey
predator
field C
CBMF =)(
There are several uncertainties concerning field based BMFs similar to field based trophic magnification factors with regard to food webs. There are biological, ecological factors which can influence the outcome of a BMF. Additionally as there is no standard procedure so far on how to conduct such field studies and therefore different study designs may also have an influence. The uncertainties of field studies have been addressed and discussed by Borga et al. (2011). As the authors actually refer to field based trophic magnifacation factors a summary of the discussion has been included in chapter 3.3.2.5 trophic magnification factors.
Problems arise with increasing body size of predators because analysis is based on tissue or serum samples. Whole-body analysis is not feasible for ethical reasons, i.e. a whole whale would be needed, and due to the challenging logistics with respect to sampling and laboratory constraints. Therefore, some of the derived BMF-values are restricted to certain tissue samples rather than whole body samples. BMF values based on liver samples may be overestimated. From a toxicological perspective concentrations in individual organs, such as the liver, may be more relevant when the potential for direct organ-specific toxicity (i.e., liver toxicity) is being predicted. Whole body values may be estimated if the tissue mass fraction is known for the organism regarded. There may however be some uncertainties due to inter individual and geographical differences but these uncertainties cannot be quantified (Houde et al., 2006).
In addition, extrapolation from tissue specific concentrations to whole body concentrations was done in some studies (e.g. Mueller et al. 2011). The assumptions under that extrapolation are explained in the studies however the calculation could have been done in different ways leading to different results.
At present no internationally accepted trigger value for BMF exists. The question whether only enrichment of a substance in predator proofs biomagnification or whether transfer from prey to predator already may be sufficient still is up for discussion. In a scientific context a BMF or TMF above 1 suggests biomagnification (Conder et al. 2008). However, also a BMF or TMF between 0-1 shows that a substance is taken up into the organism and the uptake may cause an adverse effect. A high accumulation in representatives at lower trophic levels directly causing adverse effects may cause for instance reduced prey supply. For example a reduced supply chain may affect predators more than the trophic magnification of pollutants. Thus no observable trophic magnification or an observed trophic dilution as single fact does not necessarily imply that there is no potential risk (Ehrlich et al. 2011). Additionally, experiences with revision or development of test guidelines show that even substances known to be bioaccumulative may show BMF < 1 in laboratory test systems (Inoue et al. 2012). However, keeping this in mind a BMF ≥ 1 will be used to indicate the potential for biomagnification. BMFs for PFOA are summarized in Table 11.
Martin et al. (2003b) exposed juvenile rainbow trout (Oncorhynchus mykiss) for 34 days to PFCAs (incl. PFOA) in the diet, followed by a 41 day depuration period. Though, the authors describe their results as BAF the results of this study should rather be assigned as BMFs according to the above mentioned definition as uptake only derived from the diet. During the uptake period, animals were daily fed with spiked food at a rate of 1.5 % food per body weight. Spiked food concentrations were 0.42 mg/kg for PFOA. Water samples collected before and after feeding revealed no traces of PFCAs in water. At 6 occasions during uptake period and during depuration period, fish were removed to determine the kinetics of uptake and depuration. The authors estimated the steady state to be reached after 10 days. Carcass and liver concentrations were determined by using liquid chromatography-tandem mass spectrometry, and kinetic rates were calculated to determine bioaccumulation

SVHC SUPPORT DOCUMENT – PFOA
28
parameters. Bioaccumulation (carcass) increased with increasing chain length but was not larger than one: 0.038 ± 0.0062 for PFOA; (see also Table 11). This indicates that a dietary exposure will not result in biomagnification in juvenile trout. In addition, for substances which are already known to have bioaccumulative properties BMFs do not indicate bioaccumulation (BMFs < 1 for C11,12-PFCAs and perfluorooctanoic sulfonicacid PFOS). A recently published comparison of BCFs and biomagnification factors (BMFs) investigated 9 substances in a laboratory fish feeding study with carp (Inoue et al. 2012). Five substances showed BCFs larger than 5000 but only two of these substances were likely to biomagnify. Hence, for laboratory based dietary studies on fish also BMFs below 1 may need to be regarded as critical. Martin et al. assume that the lack of observed biomagnification was likely due to the small size of fish used in the study, resulting in more rapid chemical elimination to water, relative to body size and that their natural feeding rate is too low. This more rapid chemical elimination would reduce the BMF stronger than what would be observed for larger species or size classes (Martin et al., 2003b). Therefore results from this study are not secure enough for an assessment on the bioaccumulation potential of PFOA. Furthermore gill breathing organisms are investigated, which might not be the most relevant endpoints to be considered as explained above. Besides this laboratory study BMFs were estimated from field studies. Studies are described below and results are shown in Table 11.
Transfer of PFOA was elucidated in Lake Ontario (Martin et al., 2004b) including one 4-membered pelagic food chain. Whole body samples were collected. The sampled organisms included a top predator fish, lake trout (Salvelinus namaycush), three forage fish species including rainbow smelt (Osmerus mordax), slimy sculpin (Cottus cognatus), and alewife (Alosa pseudoharengus), and two invertebrates Diporeia (Diporeia hoyi) and Mysis (Mysis
relicta), which were considered as primary prey. Lake trout samples were taken at various locations and years (1980-2001) in Lake Ontario. Seven samples were selected every three years (i.e. 7 individual fish samples per year). Forage fish species, including sculpin, smelt, and alewife, and intervebrate samples were collected on October 9th 2002 at an offshore site near Niagara-on-the-Lake, Lake Ontario. Due to the inherent uncertainties correlated with constitution of diet 4 individual combinations of rainbow trout and its prey were regarded. In all examples BMF for PFOA ranged between 0.02 and 0.63 (Table 11). As this study was conducted with fish uptake of PFOA may not have occurred exclusively over diet but also over the gills. Thus the factors may be more accurately addressed as BAF. A striking finding of this study was the unexpectedly high content of PFOA in both macro invertebrates occupying the lowest trophic level. Proportions in Diporeia were as high as 90 ng/g and the mechanism leading to this exceptional accumulation still needs to be unravelled. As a consequence sculpin as Diporeia´s consecutive predator still shows significant levels of PFOA (44 ng/g). Although no biomagnification can be proven, accounting for this elevated levels in Diporeia PFOA is still arousing suspicion of bioaccumulation. Furthermore, again fish might not be the most relevant endpoint to be considered in the assessment of the PFOA bioaccumulation behavior, because of elimination via gills.
Tomy et al. analysed an East Arctic food chain also including marine mammals (n=5-7). Again, as outlined in the previous investigation, out of all examined organisms zooplankton (n=5) as the initial part of a food web exhibited the highest level of PFOA (2.6 ng/g). For consecutive segments of food chains, based on zooplankton, BMF values were calculated below 1 (Table 11). Samples were taken from different years. This may influence the interpretation of the food web transfer due to temporal changes of the PFC concentration. On the other hand the Arctic as a remote area may be less prone to temporal changes and the existence of point sources there is limited or unlikely. Problems arise with increasing body size of predators because analysis is based on tissue or serum samples. Whole-body analysis is not feasible for ethical reasons and due to the challenging logistics with respect to sampling and laboratory constraints. Therefore, for walrus, narwhale and beluga whale only liver concentrations were assessable. From a toxicological perspective concentrations in individual organs, such as the liver, may be more relevant when the potential for direct

SVHC SUPPORT DOCUMENT – PFOA
29
organ-specific toxicity (i.e., liver toxicity) is being predicted. However, in order to gain comparable factors recalculation or extrapolation from liver or serum concentrations to whole body burdens is necessary though the required estimation may imply uncertainties. Such an estimation was, however, not conducted in this study. Therefore, the resulting BMFs will probably be overestimated and the three stated BMFs exceeding one have to be regarded with precaution (Table 11) (Tomy et al., 2004).
Tomy et al. also investigated beluga whale, ringed seal, fish pelagic amphipod and arctic copepod of the Western Canadian Arctic. The animals selected were from the sample archived repository at Fisheries and Oceans, Canada. Blubber and liver of beluga (n = 10, all males,) from Hendrickson Island and ringed seal (n = 10, all males) from Holman Island were collected in 2007 and 2004, respectively. Fish species collected in 2004 and 2005 included the marine pelagic Arctic cod (n = 10) from the Amundsen Gulf, the marine coastal Pacific herring (n = 10) from the Mackenzie Shelf and the anadromous Arctic Cisco (n = 9) from the Mackenzie estuary. The marine pelagic amphipod Themisto libellula (pooled samples, n = 2) and the marine Arctic copepod Calanus hyperboreus (pooled samples, n = 5) were collected in 2004 from the eastern Beaufort Sea and Amundsen Gulf region. As the authors state themselves differences in sampling years may influence the interpretation of the food web transfer. Again some of the derived BMF-values are restricted to the liver and the resulting BMF may be over estimative. The BMF-values reported range from 0.1 for ringed seal liver/arctic cod liver and 2.2 for arctic cod liver/marine arctic copepod (Tomy et al., 2009).
Overall, for both studies from Tomy et al. (2004 and 2009) uncertainties coming from different sampling years are expected to be minimal, because of limited variations of concentrations in remote regions. BMFs >1 and <1 suggest both bioaccumulation and no bioaccumulation of PFOA. BMFs >1 are based on organ specific concentrations and might therefore be overestimated however it is not possible to quantify this overestimation. Therefore no final conclusion on the bioaccumulation of PFOA can be drawn from these studies even though the target organ toxicity accumulation of PFOA in liver is of special concern.
Houde et al. (2004) investigated the biomagnifications of PFOA in the food web of bottlenose doplphins. In the course of the study PFOA concentrations in bottlenose dolphins were examined at two different locations. However, BMFs and TMFs were calculated for only one of these (Charleston Harbor and its tributaries (i.e., the Cooper, Ashley, and Wando rivers) and the Stono River estuary, South Carolina) because for the other one concentrations in fish were below the detection limit. Marine water (n=18), surface sediment (n=17), Atlantic croaker(n=3), pinfish(n=4), red drum (n=8), spotfish (n=10), spotted seatrout (n=11), striped mullet (n=8), and bottlenose dolphin samples (n=24) were collected around the Charleston Harbor area. Dolphin plasma, skin, and teeth were collected from both locations and additionally, dolphin tissue samples (i.e., liver, kidney, muscle, lungs, heart, thyroid, and thymus) were collected of recently deceased bottlenose dolphins (Charleston, (003, n = 1, female, 708.4 kg). 43 ng/g ww PFOA was found in bottlenose dolphin plasma and concentrations below 2 ng/g ww were found in fish samples, whereby concentrations in striped mullet and pin fish were below the quantification limit. Houde et al. claim that utilization of serum or liver concentrations of dolphins will overestimate the BMF by a factor of 10-30. Therefore they extrapolated tissue specific concentrations to whole body burdens based on the total body weight, the organ weights and the blood volumes. Samples were collected between 2002 and 2004, thus, entailing uncertainty when assessing BMF through the food chain. It may be assumed that media and biota were continuously exposed to PFOA in this area throughout the years. BMFs ranging from 1.8 to 13 for seven individual dolphin/prey relationships were stated using recalculated PFOA whole body burdens for dolphin(Houde et al., 2006a). Even if these results come with uncertainties (samples from different years, whole body estimation) they clearly indicate bioaccumulation of PFOA.
Butt et al. conducted a study in the Canadian Arctic. Ringed seal liver samples (n=10 per site) were provided by local hunters from 11 different locations in the Canadian Arctic.

SVHC SUPPORT DOCUMENT – PFOA
30
Sample collection years for ringed seal populations varied from 2002 to 2005. For this remote region concentration variation in different years are expected to be minimal. The age of the animals was determined via tooth aging and for a few samples the age was estimated using length-age correlations. Stable isotope analysis was done with 15N to 14N and 13C to 12C. Based on liver samples from polar bears obtained from another study and ringed seal data measured in this study BMFs were calculated. The polar bear sample sites were associated with ringed seal populations. In four different regions these factors ranged from 45 to 125 with a mean of 79 clearly indicating biomagnification even if the factors might be overestimated due to tissue specific concentrations(Butt et al., 2008).
Various predator prey relationships in the Westerschelde (Netherlands) were investigated by van Heuvel-Greve and co-workers. Samples (n=3-4) were collected in 2007 and 2008. The trophic level was estimated based on stable isotope (15N) analysis. BMFs were considerable for harbor seal as well as for the sediment dwelling flounder (Environment Canada, 2012; van den Heuvel-Greve et al., 2009).

SVHC SUPPORT DOCUMENT – PFOA
31
Table 11: Biomagnification factors (BMF) for PFOA
Location Species (tissue) BMF Reliability Reference
Laboratory juvenile rainbow trout (Carcass)
0.038 2 (Martin et al., 2003b)
Lake Ontario Lake trout/alewife 0.63 2 (Martin et al., 2004b)
Lake trout/smelt 0.50
Lake trout/sculpin 0.02
Lake trout/prey (weighted) 0.41
US, South Carolina Seatrout/pinfish 7.2 2 (Houde et al., 2006a)
Dolphin (whole,
estimated)/striped mullet 13
Dolphin (whole, estimated)/pinfish
13
Dolphin (whole, estimated)/red drum
2.7
Dolphin (whole, estimated)/atlantic croaker
2.3
Dolphin (whole, estimated)/spotfish
6.4
Dolphin (whole, estimated)/seatrout
1.8
Eastern Arctic Walrus (liver)/clam 1.8 2 (Tomy et al., 2004)
Narwhal (liver)/arctic cod 1.6
Beluga whale (liver)/arctic cod
2.7
Beluga whale (liver)/ redfish 0.8
Black-legged kittiwakes (liver)/arcitc cod
0.3
Glaucous gulls (liver)/arctic cod
0.6
Arcitc cod / zooplankton 0.04
Canadian Arctic Polar bear (liver)/ ringed seal (liver)
45-125
2 (Butt et al., 2008)
Western Canadian Arctic Ringed seal (liver)/ arctic cod (liver)
0.1 2 (Tomy et al., 2009)
Beluga whale (liver)/ arctic
cod (liver) 0.9
Beluga whale (liver)/ Pacific herring (liver)
1.3
Beluga whale (liver)/ arctic cisco (liver)
0.7
Arctic cod (liver)/ marine arctic copepod (whole body)
2.2
Arctic cod (liver)/ marine pelagic amphipod (whole body)
0.8
Westerschelde, Netherland Zooplankton/ herring 1.6 4 (secondary literature)
(Environment Canada, 2012; van den Heuvel-Greve et al., 2009)
Herring/ sea bass 0.6
Herring/ harbour seal 14

SVHC SUPPORT DOCUMENT – PFOA
32
Sea bass/ harbour seal (benthic food web for harbour seal
23
Peppery furrow shell/ flounder
31
Lugworm/ flounder 0.03
Flounder/ harbour seal (pelagic food web for harbour seal)
3.8
Brazil, Paraiba do Sul River
Croaker (liver) or scabbardfish (liver)//tucuxi dolphin (liver)
1.3-2.6
2 Quinete et al., 2009
Conclusion: The biomagnification potential of PFOA was investigated in several field studies. Gill breathing organisms like fish as predators do not show biomagnification of PFOA. The notable water solubility of PFOA may enable fish and mussels to quickly excrete this substance via gill permeation, facilitated by the high water throughput (Kelly et al., 2004; Kelly et al. 2009; Martin et al., 2003a; Martin et al., 2003b). However, air-breathing homeotherms are unable to efficiently eliminate PFOA to water via body surfaces such as gills. The study of a Arctic marine food web conducted by Kelly et al (2009) showed these differences between piscovorous and marine mammals food webs. These findings could only be confirmed in part by other studies. For predator prey relationships including seals and whales studies provide data not showing bioaccumulation as well as showing bioaccumulation (BMFs 0.1 – 2.7) and it is not possible to state which data are more reliable due to the uncertainties associated to the field studies. Clearly biomagnification of PFOA was shown for bottlenose dolphins and polar bears as predators (BMFs 1.8 – 125). Overall these findings provide further indication that different accumulation mechanisms are going on for gill and air breathing organisms and that gill breathing organisms are not the most relevant endpoints to be considered, whereby for air breathing organisms bioaccumulation occurs. These different accumulation mechanisms may be due to the partioning to protein-rich compartments which may lead to different toxicokinetics as Kelly et al. postulated (2009).
3.3.2.5 Trophic magnification factors (TMFs)
The trophic magnification factor (TMF) is a measure to evaluate biomagnification occurring in food webs. In the Guidance Document on Information Requirements, Chapter R.7.10.1.1, TMF is defined as the concentration increase in organisms with an increase of one trophic level. According to Conder et al., TMFs represent some of the most conclusive evidence of the biomagnification behaviour of a chemical substance in food webs (Conder et al., 2011). Again, a TMF greater than one indicates accumulation within the food chain.
There are several uncertainties concerning TMFs. These have been addressed and summarized by Borga et al. (2011). There are biological factors such as the differences between poikilotherms and homeotherms, sex, different energy requirements, different abilities to metabolize chemicals and slow or fast growing organisms.
Steady state between a consumer and its diet is assumed. However, as opportunistic feeders wild animals vary their diet over seasons or with life stage and point sources may influence observed TMFs. Additionally, apart from the diet there is always the possibility of a direct uptake of the substance under scrutiny and the relative importance of food versus e.g. water exposure can influence the magnitude of the TMF. The position in the food web is quantified using relative abundances of naturally occurring stable isotopes of N (15N/14N, referred to as δ15N). However the relative abundance of these isotopes and thus the determination of the trophic level and TMF is influenced by the physiology of the organism and its life trait history. Rapid growth with a higher protein demand for new tissue leads to lower enrichment factors than those with slower growth rates. Insufficient food supply and

SVHC SUPPORT DOCUMENT – PFOA
33
fasting and starvation leads to catabolism of body proteins and an increase of 15N in organisms relative to those organisms with adequate food supply. There is no standard procedure for conducting TMF field studies. Hence, the performance and sampling may vary between different studies. Disproportionate sampling of the food web or unbalanced replication of samples may significantly influence the TMF.
Particular problems with averaging the TMF may occur if food webs comprise both poikilotherms and homeotherms. An investigation of an Arctic food web revealed the unequal magnification behaviour of POPs within both thermal groups (Hop et al. 2002). These results may be explained by a higher food intake, caused by a higher energy demand, and a longer life span of birds and mammals. Intrinsic differences in gastrointestinal absorption mechanisms have also been suggested as an explanation in accounting for these differences between homeotherms and aquatic poikilotherms (Drouillard and Norstrom 2000). Therefore, when the trophic magnification potential of a substance is determined via a single regression for the overall food web, the magnification in poikilotherms may be overestimated and the magnification in homeotherms, in particular apex predators, may be underestimated (Fisk et al. 2001).
Additionally, as already discussed in the BMF chapter sample collection is often restricted to tissue or serum samples with increasing body size of predators due to ethical reasons and due to the challenging logistics with respect to sampling and laboratory constraints.
Moreover extrapolation from tissue specific concentrations to whole body concentrations was done in some studies (e.g. Mueller et al. 2011). The assumptions under that extrapolation are explained in the studies however the calculation could have been done in different ways leading to different results.
The following text in italic letters was copied from the OECD SIDS Initial Assessment Report for PFOA (OECD, 2006):
Martin et al. (Martin et al., 2004b) examined PFOA contents in the food web from Lake
Ontario (Canada). Adult lake trouts (top predator) were collected at various years and
locations in Lake Ontario. Samples of prey fish (sculpins, smelts and alewifes) and
macroinvertebrates (Mysis sp., Diporeia sp.) were collected at one location in October 2002.
Lake trout samples analyzed represented individual whole fish homogenates. The other
species were processed as composites of whole individuals. The mean PFOA content in
Diporeia sp. and sculpin was 90 ng/g and 44 ng/g, respectively. In the other fish samples
contents of 1.0 to 2.0 ng/l and in Mysis sp. of 2.5 ng/g could be detected. The authors note
that Diporeia sp. is a benthic invertebrate species, and sculpins feed mainly in the benthic
environment. Benthic contamination may therefore be the source of contamination of this
food web. As PFOA content in predators is lower than in prey species trophic
biomagnification of PFOA in the food web of Lake Ontario is unlikely to occur.
Trophic transfer of PFOA and other related perfluorinated compounds was examined in a
Great Lakes benthic foodweb including water – algae – zebra mussel – round goby –
smallmouth bass. In addition, perfluorinated compounds were measured in livers and eggs
of Chinook salmon and lake whitefish, in muscle tissue of carp, and in eggs of brown trout.
Similarly, green frog livers, snapping turtle plasma, mink livers, and bald eagle tissues were
analyzed to determine concentrations in higher trophic-level organisms in the food chain.
Biotic samples were collected from several rivers in Michigan and in the Calumet River in
Indiana, USA. PFOA-concentrations in two of the sampling sites, Raisin River and St. Clair
River, were 14.7 and 4.5 ng/l, respectively. The concentrations of PFOA in all tissue samples
were above detection limit but below the LOQ. Therefore, biomagnification of PFOA in the
Great Lakes benthic foodweb is unlikely occur (Kannan et al., 2005).
Overall fish was top predator of these investigated food webs and as already explained fish might not be the most relevant endpoint to be considered.
Houde et al. (2006a) investigated the food web of bottlenose dolphins. The results are

SVHC SUPPORT DOCUMENT – PFOA
34
summarized in Table 12. The authors sampled different biota, i.e. Atlantic croaker (n=3), pinfish (n=4), spotfish (n=10), spotted seatrout (n=11), striped mullet (n=8) and samples from bottlenose dolphins (n=24), as well as water (n=18, samples analyzed in duplicate) and surface sediment (n=17, samples analyzed in triplicate). Sample collection was conducted between 2002 and 2004. Based on stable isotope (15N) analysis the trophic level of each biota sample was determined. PFOA was analysed in plasma and liver of dolphins and afterwards a whole body burden was calculated. The extrapolation of tissue specific concentrations to whole body burdens is based on the total body weight, the organ weights and the blood volumes. For prey whole body homogenates were analysed for PFOA. TMFs indicate bioaccumulation of PFOA when dolphin plasma concentrations were taken into account as well as when whole body burdens for dolphins were considered.
Furthermore, Houde et al. (2006a) calculated TMFs for Arctic beluga whale on the basis of liver samples of beluga whale (n=5) and narwhal (n=5) from another study. For estimating the trophic magnification on the basis of the whole body, the weight of the animals tested in the former study was estimated, as well as the weight of their organs and plasma volume. It was assumed that the anatomy of dolphin and beluga is similar. The available dolphin anatomy data such as organ proportion compared to the entire body were extrapolated to beluga and narwhal. The authors conclude that the TMF for PFOA is >1 when using liver measurements and <1 when using whole marine mammal body burdens. The authors conclude further, that TMFs based on liver samples overestimate biomagnification. However, the calculated TMFs are due to above described estimations not reliable (Houde et al., 2006a).
Kelly et al. measured PFOA in the Canadian Arctic marine food web. Concentrations in sediment (n=9) and in different organisms (lichens, macroalgae (n=6), bivalves, fish (n=3-6)) and tissues and organs (stomach contents, liver, muscle, blubber and/or milk) of common eider ducks (n=5), seaducks (n=4), and marine mammals beluga whales and ringed seals to calculate TMFs (Table 12). Sample collection was conducted between 1999 and 2003 along the eastern Hudson Bay coastline in close proximity to the Inuit village Umiujaq. PFOA was measured in different tissues/fluids of the beluga whale including blood (n=18), muscle (n=18), liver (n=22), milk (n=6) and also in foetuses (n=2). The authors showed that PFOA especially accumulates in protein rich compartments such as blood and liver and that the TMF of perfluorinated compounds such as PFOA correlates with the partitioning behaviour between protein and water and protein and air. Comparisons of different food webs show that the TMF is below one in the case of piscivorous food webs if air breathing organisms are excluded but becomes larger than one if air breathing organisms are taken into account. TMFs for the food web of the beluga whale are >1, indicating bioaccumulation, when they are normalized to protein contents as well as without that normalization (Kelly et al. 2009).
TMFs for PFOA are summarized in Table 12.

SVHC SUPPORT DOCUMENT – PFOA
35
Table 12: Trophic Magnification Factors (TMF) of PFOA
Location Species (tissue) TMF Reliability Reference
Lake Ontario Diporeia/slimy sculpin 0.37 2 (Martin et al., 2004b)
Lake Ontario Mysis/alewife/rainbow smelt/lake trout
0.58 (Martin et al., 2004b)
US, South Carolina
Dolphin plasma croaker, pinfish, spotfish, spotted seatrout
13 ± 22 2 (Houde et al., 2006a)
Whole dolphin burden 6.3 ± 6.7
Arctic
Beluga whale/narwhale liver 1.6 ± 3 3
Whole beluga whale/narwhale burden
0.3 ± 0.3
Hudson Bay (north-eastern Canada
Sediment/ macroalgae/ bivalves/ fish/ seaduck/ beluga whale
2.33-4.61
1.4-2.64 (protein corrected)
2
(Kelly et al., 2009)
Sediment/ macroalgae/ bivalves/ fish
0.3-0.53 (protein corrected)
Westerschelde, Netherland
Sea bass/ harbour seal (benthic food web for harbour seal
1.2 4 (secondary literature)
(Environment Canada, 2012; van den Heuvel-Greve et al., 2009)
Flounder/ harbour seal (pelagic food web for harbour seal)
1.2
Mai Po Marshes Nature Reserve
Phytoplankton/zooplankton/gastropod/worm/shrimp/fish/waterbird liver
0.93-1.07 2 (Loi et al., 2011)
Conclusion: A number of field studies are available which analyzed the trophic magnification potential of PFOA. In the same manner as BMFs also TMFs do not indicate bioaccumulation if gill breathing organisms are top predators of the investigated food chain (TMF 0.3 – 0.5). If air breathing animals, i.e. whales and dolphins are top predators in the food chains all reliable studies clearly indicate trophic magnification of PFOA (TMFs 1.2 – 13).
3.3.3 Terrestrial bioaccumulation
Food web analyses covering also terrestrial mammals and birds have been performed. Martin et al. examined PFOA proportions in biota from Canadian Arctic. Only liver samples from polar bear exhibited significant PFOA levels (3-13 ng/g) whilst in 4 other terrestrial mammals and all of the 3 investigated bird species levels remained below the limit of detection (< 2 ng/g) (Martin et al., 2004a).
A comparison of PFOA concentrations in polar bear liver with concentrations of other (very) bioaccumulative substances is given in Figure 1. C11-14 perfluorinated carboxylicacids (PFCAs) are very bioaccumulative substances. From Figure 1 it is obvious that PFOA concentrations are in the same range or even higher compared to C12-14 PFCAs. In other locations, concentrations of C11-PFCAs are higher in polar bear liver compared to PFOA and are in the same range for other locations.

SVHC SUPPORT DOCUMENT – PFOA
36
0
20
40
60
80
100
120
1 2 3 4 5 6 7
Po
lar
be
ar
live
r (n
g g
-1w
et
wt)
PFOA
C11-PFCA
C12-PFCA
C13-PFCA
C14-PFCA
Figure 1: Concentrations of PFOA and very bioaccumulative C11-14 PFCAs in polar bear liver
from seven different locations in the Northern American and European Arctic (Smithwick et al. 2005).
An analogue result was stated by Kannan et al. (Kannan et al., 2005) indicating absence of PFOA in liver samples of predatory birds and presence only in 1 out of 8 piscivorous mammals (mink). In general, PFOA is occasionally detected in high trophic level avian predators, whereas it is frequently found in piscivorous mammals. In particular predatory birds and mammals at higher trophic levels usually inhabit a large geographic home range and their flexible migratory patterns impede a collection of collocated samples of prey and predator. Despite this, piscivorous mammals show a more residential behaviour and the proximate local association to their prey allows for proposing a more realistic trophic correlation of samples.
In a study undertaken by the German Environmental Specimen Bank (ESB), eggs from herring gull and from cormorants were analysed according their contamination with per- and polyfluorinated compounds. Herring gulls are omnivorous and opportunistic top predators of the North and Baltic Sea marine ecosystem, and eggs are routinely collected for the German ESB in the same regions where mussels and/or fish are sampled. PFOA values in herring gull eggs ranged from 6.5 to 118 ng/g ww at the North Sea, and from below the level of quantification up to 2.8 ng/g ww at the Baltic Sea. The cormorants from the Baltic Sea site Heuwiese are nesting on the ground in the neighbourhood of herring gull nest. PFOA was one of the chemicals frequently detected above the limit of quantification. The PFOA levels ranged from 0.9 to 1.8 ng/g ww. The levels in samples from the North Sea were higher than those from the Baltic Sea. Additionally, eggs of rook and feral pigeon from terrestrial ecosystems were analyzed regarding their burden of per- and polyfluorinated compounds. The values where very low compared to the ones from the coast. It was hypothesized that differences in per- and polyfluorinated compounds levels between aquatic and terrestrial birds are caused by different exposure pathways (Rüdel et al., 2011)
Swedish peregrine falcon eggs collected between 1974 and 2007 were also analyzed according to their PFC load. In contrast to the study of Rüdel et al. (2011), PFOA could not be detected above limit of quantification (Holmström et al., 2010). Ahrens and co-workers investigated PFCs in eggs from tawny owl from Norway collected from 1986 to 2009. PFOA was detected in 8% of the samples (Ahrens et al., 2011). Concentrations of PFOA and 15 other per- and polyfluorinated chemicals in eggs and plasma of great skuas were studied by Leat et al. (2013). The concentration of PFOA ranged from 0.015 to 0.494 ng/g ww.
SVHC SUPPORT DOCUMENT – PFOA
37
Because of the low concentration of per- and polyfluorinated chemicals in eggs and plasma compared to other species, the authors suggest that great skuas to not bioaccumulate PFCs to the same extent as some other seabirds.
Absorption and excretion of PFOA in cattle (Angus steers) were investigated by Lupton et al. (2012). After nine days of dosing (single oral exposure of 1 mg kg-1 body weight) 14C-PFOA was completely absorbed and excreted. The estimated plasma half-life was 19.2 ± 3.3h. Kowalczyk et al. (2013) showed transfer of PFOA from feed into plasma of Holstein cows. The average daily intake of PFOA from feed was 2.0 ± 1.2 µg/kg body weight. During the 28 days feeding period, the PFOA concentration in plasma showed no steady increase, but rather a constant concentration with a mean of 8.5 ± 5.7 µg/L. 50% of the tested cows were fed PFOA-free for further 21 days. After one week the PFOA concentration in plasma decreased below LOD (0.2 µg/L). Despite the fast clearance of PFOA in animals, elimination half-lives >2 years of PFOA in humans (see chapter 4) is still of concern. The reason for the differences in elimination is likely that PFOA is a substrate for renal organic anion transporters, regulating active renal reabsorption, and these transporters are differentially expressed between species and sex (Han et al. 2012).
Müller et al. conducted a terrestrial food web study consisting of lichen and plants, caribou, and wolves from two remote northern areas in Canada. This food web is considered as relatively well documented example (Kelly and Gobas, 2003) and in particular caribou have been studied intensively due to their economic and social importance for indigenous people in the Canadian Arctic. Furthermore the food web is relatively simple, as caribou feed mostly on lichen (in summer the diet also consists of willow, sedges and grasses) and wolves living near barren-ground caribou herds almost exclusively feed on them. Liver, muscle, and kidney samples (n=7 Porcupine herd food web and n=10 for the Bathurst food web) from two caribou herds were collected; from the Porcupine herd in northern Yukon Territory and the Bathurst herd in the Northwest Territories (NWT)/western Nunavut. Wolf (n=6 Porcupine herd food web and n=10 for the Bathurst food web), lichen, and plant samples were collected in the same region as the caribou. Plant samples included cottongrass, aquatic sedge, willow, moss, and mushrooms. Liver and muscle samples were collected from the sampled wolves. Lichen, moss and mushrooms were collected as a whole grass and willow without roots. Plant samples are from the same season (summer 2008 in Porcupine or summer 2009 in Bathurst) whereas wolf and caribou samples are from different years (2007 and 2010 in Porcupine and 2008 and 2007 in Bathurst). As variations in concentrations in remote regions are expected to be low the influence of sample from different year is expected to be low as well. Whole body concentrations were calculated for each individual caribou and wolf based on the concentration in the specific tissue and the mass fraction of this tissue. If one tissue has not been measured in this study, the concentration was estimated based on data in the literature, i.e. concentration in blood and lungs were assumed to be half of that of liver and the carcass was assumed to have half the concentration found in muscle tissue. Bones were excluded from the whole body calculation because per- and polyfluorinated chemicals are assumed to not enrich in this media and bones are not part of the diet of wolves. The study illustrates a considerable carry over between plants and caribou. Caribou are a major human food source in numerous arctic communities. This food-chain may also be considered comparable to the pasture-cow food-chain in temperate regions. The results of the study, BMFs as well as TMFs are shown in Table 13 and
Table 14. Tissue concentrations and whole body concentrations were used for calculations. Tissue based BMFs differ considerably. Therefore it is concluded that BMFs based on whole body concentrations are more appropriate (Müller et al., 2011). Even if there is no statistically significant relation between trophic level and concentrations, concentrations are increasing with trophic levels and TMFs >1 indicate some biomagnification. Overall, uncertainties in this study are comparably low (e.g. well known and simple food web) and results indicate that bioaccumulation of PFOA can occur in that food chain. .

SVHC SUPPORT DOCUMENT – PFOA
38
Table 13: BMFs for PFOA in a remote terrestrial food chain (from two different locations)
Species (tissue) BMF Reliability Reference
Caribou (muscle)/lichen 0.9 ± 0.4 2 (Müller et al., 2011)
Caribou (liver)/lichen 11 ± 1.2
Wolf (muscle)/caribou muscle 3.8 ± 1.5, 2.6 ± 0.8
Wolf (liver)/caribou liver 0.9 ± 0.3
Caribou (whole)/lichen 1.4 ± 0.4, 2.6 ± 0.5
Caribou (whole)/vegetation 1.8 ± 0.7, 0.3 ± 0.1
Wolf (whole)/caribou (whole) 2.4 ± 0.6, 2.1 ± 0.5
Table 14: TMFs for PFOA in a remote terrestrial food chain (from two different locations)
Species (tissue) TMF Reliability Reference
Wolf (liver) /caribou (liver)/lichen
2.4 ± 0.1, 2.2 ± 0.1 2 (Müller et al., 2011)
Wolf (whole)/caribou (whole)/lichen
1.3 ± 0.1, 1.3 ± 0.1
Wolf (whole)/caribou (whole)/vegetation
1.1 ± 0.1, 1.3 ± 0.1
Conclusion: The terrestrial BMFs and TMFs of PFOA are greater than one for the remote Arctic food chain lichen – caribou – wolf, indicating trophic biomagnification.
3.3.4 Summary and discussion of bioaccumulation
The estimation of bioaccumulation based on partition coefficient KOW appears to be inappropriate for PFOA, because the experimental determination of KOW is impeded by strong surface activity of PFOA and calculation of KOW using QSAR methods rely on physico-chemical parameters which are not completely validated for PFOA. Hydrophobicity is unlikely to be the sole driving force for the partitioning of perfluorinated substances to tissues because the oleophobic repellency opposes this partitioning process. Due to these properties, the assumption that the traditional hydrophobic and lipophilic interactions between compound and substrate are the main mechanisms governing partitioning may not be applicable for PFOA. As shown from binding assays and analyzing distribution pattern in aquatic animals PFOA preferentially binds to proteins in blood and liver (Ishibashi et al., 2008; Ahrens et al., 2009b). BCFs and BAFs values for PFOA do not support that PFOA is a bioaccumulative substance, because BCFs and BAFs are <2000. . Due to the notable water solubility of PFOA fish might quickly excrete this substance via gill permeation, facilitated by the high water throughput. Hence, bioconcentration in gill breathing organisms may not be the most relevant endpoint to consider and BCF and BAF values are not relevant for assessing the bioaccumulation potential of PFOA, because they do not take air breathing animals into account.
For air breathing organisms it has been shown that BCFs and KOW-predicted BCFs can be inadequate for assessing bioaccumulation (Conder et al., 2011; Czub and McLachlan, 2004;

SVHC SUPPORT DOCUMENT – PFOA
39
Kelly and Gobas, 2001; Kelly and Gobas, 2003; Kelly et al., 2007; Kitano, 2007). An excretion pathway of PFOA as suggested for gill breathing organisms does not exist for air breathing animals (Kelly et al., 2004; Kelly et al., 2007). The BCF is less accurate in quantifying biomagnification than TMFs and BMFs in terms of dietary accumulation (Borga et al., 2011; Gobas et al., 2009; Weisbrod et al., 2009). Other information beside bioconcentration studies can be used in the assessment of the bioaccumulation potential of a substance. In a weight of evidence approach other information such as for instance concentrations in terrestrial and endangered species, data on the magnification within food webs should be taken into consideration. These address the bioaccumulation mechanism of PFOA in a more appropriate way compared to the BCF and BAF values. Furthermore, data from human body fluids or tissues should also be taken into account. Data on accumulation of PFOA in humans are given in chapter 4 and will be considered in the overall B and PBT assessment in chapter 6.
In addition field studies provide evidence, that air-breathing organisms are more likely to biomagnify PFOA than water breathing organisms (Kelly et al., 2009). In general, field studies are complex and therefore difficult to judge concerning their reliability but their results are obtained under relevant conditions for the concern of bioaccumulation.
Results from field studies prove the presence of PFOA in several terrestrial as well as aquatic organisms. For example PFOA concentrations ranging from 6.5 to 118 ng/g (ww) has been found in herring gull eggs (Rüdel et al., 2011). Furthermore PFOA was found in polar bear liver (i.e. 3-13 ng/g (Martin et al., 2004b)) and concentrations are similar compared to concentrations of confirmed very bioaccumulative (vB) substances (C11-14-PFCAs). The fact that PFOA is ubiquitously present in terrestrial species especially in top predators and even in remote areas is of very high concern and indicates the bioaccumulation potential of PFOA.
In general the potential of bioaccumulation can be shown by TMFs and BMFs >1. Despite the uncertainties coming with the derivations of these factors from field data, TMFs and BMFs <1 for PFOA are mostly found for gill breathing organisms as top predators, such as lake trout and artic cod (Martin et al., 2004b; Tomy et al., 2004). These organisms seem to eliminate PFOA via their body surfaces like gills and are therefore not the most relevant endpoints. The bioaccumulation potential of PFOA is supported by TMFs and BMFs >1 from several studies for air breathing organisms like dolphins, walrus and wolf (Houde et al., 2006; Tomy et al., 2004; Müller at el., 2011) and are shown in Figure 1 - 4. Most of these results were derived from samples from different years, but especially for remote regions with quite constant concentration, the influence is expected to be low. Care has to be taken when, TMFs and BMFs were calculated with tissue specific concentrations, i.e. liver (Butt et al., 2008), because these might be overestimated. Anyhow, the TMFs and BMFs >1 show bioaccumulation and should be of concern because PFOA is know to be toxic to liver and toxicokinetic can be taken into account as well.
Taken together in a weight of evidence approach the data presented can be considered overall supportive of the bioaccumulation potential of PFOA. Environmental studies show that PFOA can biomagnify in the food chain, especially when air breathing animal are part of that food chain. It is of special concern that PFOA biomagnifies in endangered species as shown for the polar bear and in animals which are likely to become endangered in the near future (narwhale and beluga whale). In humans (chapter 4), gestational and lactational exposure to PFOA is of special concern as the foetus and newborn babies are highly vulnerable to exposure to toxic substances. Data from human body fluids provide quantitative proof of the bioaccumulation of PFOA (chapter 4).

SVHC SUPPORT DOCUMENT – PFOA
40
0123456789
1011121314
Se
atr
ou
t/p
infi
sh
Do
lph
in/s
trip
ed
mu
lle
t
Do
lph
in/p
infi
sh
Do
lph
in/r
ed
dru
m
Do
lph
in/a
tla
nti
c c
roa
ke
r
Do
lph
in/s
po
tfis
h
Do
lph
in/s
ea
tro
ut
Wa
lru
s (l
ive
r)/c
lam
Na
rwh
al
(liv
er)
/arc
tic
co
d
Be
lug
a w
ha
le (
liv
er)
/arc
tic
co
d
Be
lug
a w
ha
le (
liv
er)
/ re
dfi
sh
Bla
ck
-le
gg
ed
kit
tiw
ak
es
(liv
er)
/arc
itc
co
d
Gla
uc
ou
s g
ull
s (l
ive
r)/a
rcti
c c
od
Arc
itc
co
d /
zo
op
lan
kto
n
Po
lar
be
ar
(liv
er)
/ ri
ng
ed
se
al
(liv
er)
Po
lar
be
ar
(liv
er)
/ ri
ng
ed
se
al
(liv
er)
Rin
ge
d s
ea
l (l
ive
r)/
arc
tic
co
d (
liv
er)
Be
lug
a w
ha
le (
liv
er)
/ a
rcti
c c
od
(li
ve
r)
Be
lug
a w
ha
le (
liv
er)
/ P
ac
ific
he
rrin
g
(liv
er)
Be
lug
a w
ha
le (
liv
er)
/ a
rcti
c c
isc
o
(liv
er)
Arc
tic
co
d (
liv
er)
/ m
ari
ne
arc
tic
co
pe
po
d
Arc
tic
co
d (
liv
er)
/ m
ari
ne
pe
lag
ic
am
ph
ipo
d
Houde et al. 2006a Tomy et al. 2004 Butt et al.
2008
Tomy et al. 2009
BM
F45
-
125
Figure 2: BMFs of aquatic food webs show biomagnification of PFOA.
Figure 3: TMFs of aquatic food webs show biomagnification of PFOA (Houde et al. 2006a
report TMF±standard error, which are in the figure expressed with error bars. Kelly et al.
(2009) report ranges. Minimum and maximum TMFs of these ranges are given in the Figure).

SVHC SUPPORT DOCUMENT – PFOA
41
0
1
2
3
4
5
6
7
8
9
10
11
12
13
BMF
Figure 4: BMFs (calculated with average concentrations, ± standard error) of terrestrial food webs show biomagnification of PFOA (Müller et al. 2011).

SVHC SUPPORT DOCUMENT – PFOA
42
0
1
2
3T
MF
Figure 5: TMFs (± 95% confidence intervall (CI) of linear regression, upper and lower CI
did not differ after rounding to one decimal place) of terrestrial food webs show biomagnification of PFOA (Müller et al. 2011).
4 Human health hazard assessment
4.1 Toxicokinetics (absorption, metabolism, distribution and
elimination)
4.1.1 Non-human information
Absorption
Absorption in male rats was studied following administration of a single oral dose of 14C- PFOA (11mg/kg), and at least 93% of the total 14C was absorbed at 24 hours (Gibson and Johnson, 1979).
In another study, male and female rats were exposed via nose-only to aerosol atmospheres of PFOA (Hinderliter et al., 2006). The study was comprised of two separate experiments, a single inhalation exposure and repeated inhalation exposures for 3 weeks. The results demonstrated that the pharmacokinetic properties of inhaled PFOA in male and female rats are similar to those observed in male and female rats following oral dosing with PFOA.
Penetration of APFO through rat and human skin was tested in an in vitro study and by the end of the 48-h exposure period, only a negligible amount of the total APFO applied (0.048 ± 0.01%) had penetrated through human skin (Fasano et al., 2005). The steady-state penetration of APFO was approximately 34-fold faster through rat skin than human skin.

SVHC SUPPORT DOCUMENT – PFOA
43
In conclusion, PFOA/APFO is well absorbed in laboratory animals following oral and inhalation exposure, and to a lesser extent following dermal exposure.
Metabolism
Carbon-fluorine bonds are among the strongest in organic chemistry, and PFOA has not been found to be metabolised (Lau et al., 2007).
In conclusion, PFOA has not been found to be metabolised.
Distribution and elimination
In a study on male and female mice, rats, hamsters, and rabbits the absorption, distribution and excretion of APFO was studied (Hundley et al., 2006). The laboratory animals were treated with a single oral dose of 14C-APFO, and the excretion and tissue distributions were followed for 120 h (168 h in the rabbit). Substantial sex and species differences in the excretion and disposition of 14C-radioactivity derived from 14C-labeled APFO were observed. The female rat and the male hamster excreted more than 99% of the original 14C-radio activity by 120 h after dosing; conversely, the male rat and the female hamster excreted only 39% and 60% of the original 14C-radio activity, respectively, by 120 h postdosing. The male and female rabbits excreted the 14C-radio activity as rapidly and completely as the female rat and the male hamster, whereas male and female mice excreted only 21% of the original 14C-radio activity by 120 h postdosing. The rapid excretors (female rat, male hamster, and male and female rabbits) contained negligible amounts of 14C in organs and tissues at sacrifice. The slow excretors exhibited the highest 14C- concentrations in the blood and liver followed by the kidneys, lungs, and skin. Preferential sequestering of 14C-labeled APFO in the fat was not observed in any of the species studied.
In a study on rats, 14C-PFOA was administered orally and binding to plasma proteins was studied (Han et al., 2003). Most PFOA was found to be in protein-bound form in male and female rat plasma, and the primary PFOA binding protein in plasma was serum albumin. In the same study no significant difference was found between PFOA binding to rat serum albumin and PFOA binding to human serum albumin. PFOA has been demonstrated to undergo enterohepatic circulation in rats (Johnson et al., 1984).
The pharmacokinetics of PFOA in cynomolgus monkeys was studied in a six-month oral capsule dosing study of APFO and in a single dose intravenous study (Butenhoff et al., 2004b). During the repeated oral dosing, PFOA reached a steady concentration in the serum, urine, and feces within four weeks with concentrations increasing with dose in a nonlinear manner. Serum PFOA followed first-order elimination kinetics after the last dose. Urine was the primary elimination route. The PFOA elimination half life following either oral or intravenous dosing was approximately 20–30 days.
To develop understanding of the potential for gestational and lactational transfer of PFOA, female rats were dosed by oral gavage once daily with APFO starting on gestation day 4 and continuing until sacrifice (Hinderliter et al., 2005). Concentrations of PFOA in all biological samples were proportional to maternal dose. PFOA was detected in the embryo/foetus and placenta, and nursing pup and milk confirming placental and lactational transfer. Steady-state concentrations in milk were approximately 10 times less than those in maternal plasma. The concentration of PFOA in fetal plasma was approximately half the steady-state concentration in maternal plasma. The milk concentrations appeared to be generally comparable to the concentrations in pup plasma.
In conclusion, the highest concentrations of PFOA are found in blood, liver, kidney and lung. Urine is the primary route of excretion. There are large sex and species differences in the excretion of PFOA. The reason for the differences in elimination is likely that PFOA is a substrate for renal organic anion transporters, regulating active renal reabsorption, and these transporters are differentially expressed between species and sex (Han et al. 2012). PFOA is transferred to the foetus through the placenta and the offspring is exposed to PFOA from breast milk.
SVHC SUPPORT DOCUMENT – PFOA
44
4.1.2 Human information
Levels of PFOA in human body fluids
PFOA has been found in human blood samples all around the world (Lau et al., 2007). In European populations, serum and plasma concentrations of PFOA in the range from <0.5 to 40 ng/mL have been reported (Vestergren and Cousins 2009, Fromme et al., 2009). For instance, the results of a Bavarian human biomonitoring study (n=365) with background exposed young adults showed PFOA concentrations of 0.5 to 19 ng/mL in blood plasma (Fromme et al., 2007).
Considerably higher levels have been found at two locations, in USA and in Germany, where the population had been exposed to PFOA contaminated drinking water (Emmet et al., 2006; Wilhelm et al., 2008). For the people living in the vicinity of a fluoropolymer production facility in Ohio, a median serum PFOA concentration of 354 ng/mL has been reported (Emmet et al., 2006). From the dependence of serum levels on the person’s use of water, it was concluded that drinking water was the major route of exposure. In the same study group, markedly higher serum levels of PFOA were associated with working at the chemical plant that was the source of the contamination (Steenland et al., 2009). Workers who no longer worked at the plant had much higher PFOA levels than did non-workers but lower levels than those who continued working there. These findings are consistent with a gradual excretion of PFOA from the body after ending high exposure. Age showed a J-shaped relationship with serum PFOA, with higher levels in the young and the old subjects. In Germany, PFC contaminated material had been applied on a large agricultural area leading to the contamination of drinking water sources. Drinking water concentrations of PFOA ranged from 500 ng/L to 640 ng/L. Plasma PFOA levels were around 24 ng/mL in adult residents from the contaminated area which was 4.4 (males) and 8.3 (females) times higher than PFOA levels from a control region (Wilhelm et al., 2008; Hölzer et al., 2009).
Very high serum concentrations have been reported in fluorochemical production workers with mean concentrations of PFOA in the range of 500 to 7,000 ng/mL depending on the type of work (Fromme et al., 2009). The highest serum level reported for PFOA was 114,100 ng/mL in 1995 (Fromme et al., 2009).
A recent Swedish study reported significantly elevated PFOA levels in humans after using fluorinated ski wax. Monthly blood samples were collected before the ski season, i.e., pre-season, then at four FIS World Cup competitions in cross country skiing, and finally during an unexposed 5-month post-season period (Nilsson et al., 2010a). The PFOA levels in three technicians with “low” initial levels of PFOA (<100 ng/mL in pre-season whole blood) increased from pre-season to post-season by 254, 134, and 120 %, whereas no increases in the blood levels were observed for the five technicians with “high” initial levels (>100 ng/mL in pre-season sample).
In a Norwegian study, serum samples from 13 professional male ski waxers were collected at three occasions (Freberg et al., 2010). The first blood sample was drawn at the end of season I (spring), the second at the beginning of season II (autumn) and the third at the end of season II (spring). The median concentration of PFOA was 50 ng/mL by the end of season I (range; 15-174 ng/mL), which is around 25 times higher than the background level. The median concentrations of PFOA sampled in the aerosol fractions were 15 mg/g dust (range: 5.6-38 mg/g). Precursor substances were not evaluated. A statistically significant positive association between years exposed as a ski waxer and concentration of PFOA in serum was observed. The reduction in the concentrations measured at the start of season II (autumn) compared to the end of season I (spring) was of statistical significance (p < 0.05), but was below 10%. This indicates long elimination half-lives of PFOA in humans.
Several factors could potentially affect the human blood levels of PFOA. In some publications addressing human blood levels of PFOA with life time, no correlation between PFOA concentration and age was reported (Calafat et al., 2007; Olsen et al., 2003; Olsen et al., 2004), while in other studies the concentration of PFOA in blood increased significantly
SVHC SUPPORT DOCUMENT – PFOA
45
with increasing age (Haug et al., 2010b; Haug et al., 2011a). In the US NHANES study, Calafat and co-workers (2007) found higher levels of PFOA in males, compared to females, at age 26 and 39 (fertile age), but not at age 55. Similar findings have been observed in a Japanese study (Harada et al., 2004). In a study by Thomsen and co-workers relatively high levels of PFOA were found in breast milk. After breast-feeding for a year, the concentration of PFOA in the breast milk was reduced by more than 90%. This demonstrates a significant transfer of PFOA to breast-fed children and a significantly reduced PFOA level in the mothers (Thomsen et al., 2010). A highly reduced PFOA level in breast-feeding women may at least partly explain the lower levels of PFOA in females compared to males at fertile age (26 and 39 year) shown in the NHANES study.
Also, PFOA in diet is an important exposure source. It has been shown that people eating more shrimps have statistically significant higher levels of PFOA than people eating a smaller amount (Haug et al., 2010b). Other sources such as ski-waxing, prolonged use of proofing agents, indoor carpets and food contact materials may also be of importance. In a previous study, levels of PFOA in dust samples were highly correlated to serum levels in humans and the study indicated that inhalation of PFOA in the indoor environment may be a significant contributing source to total PFOA exposure (Haug et al., 2011a). As a result of different activities and age of fabrics and furniture, exposure via indoor environment may also vary between age groups. Taken together, breastfeeding, differences in diet, life style and indoor environment are important exposure factors not addressed in the studies by Calafat et al., and Olsen et al. and are confounding factors that most likely will affect and possibly mask the measurable accumulation increase of PFOA with age (Calafat et al., 2007; Olsen et al., 2003; Olsen et al., 2004). This is further supported by two Norwegian studies using multiple linear regression analyses to adjust for different contributing factors. In the Norwegian Fish and Game Study (n=175) levels of PFOA in serum from men and women increase statistically significantly with age (Haug et al., 2010b). Also in a study with 41 women in the age of 25-45 years a statistically significant increase in the PFOA levels with age was found (Haug et al., 2011a). In a recent study, previous pregnancies and breastfeeding duration were the most important determinants of PFASs in a study group of 487 pregnant women (Brantsæter et al. 2013). In this study parity, total number of months breastfeeding and time since most recent pregnancy significantly influenced the PFOA level in the women's blood plasma (p<0.001). Nulliparous women (i.e. women who have not given birth) had higher PFOA plasma concentrations than parous women. PFOA plasma concentrations were decreasing with increasing number of months of breastfeeding. And PFOA plasma concentrations were increasing with number of months since most recent pregnancy as shown in figure 6. This shows that after excreting considerable amounts of PFOA when giving birth and breastfeeding, PFOA is re-accumulating in their bodies. These three studies strongly indicate that PFOA levels increase with age, and that breast feeding, diet and indoor environment are important factors for PFOA exposure that need to be addressed in the evaluation of human exposure and accumulation of PFOA.

SVHC SUPPORT DOCUMENT – PFOA
46
Figure 6: Unadjusted plasma PFOA concentrations (ng/mL) by categories representing
time intervals since the most recent pregnancy (Brantsæter et al. 2013). Reprinted from Environment International, 53, Brantsaeter AL, Whitworth KW, Ydersbond TA, Haug LS, Haugen M,
Knutsen HK, Thomsen C, Meltzer HM, Becher G, Sabaredzovic A, Hoppin JA, Eggesbø M, Longnecker MP, Determinants of plasma concentrations of perfluorinated alkyl substances in pregnant Norwegian
women, 74-84, Copyright (2013), with permission from Elsevier.
In figure 6, the horizontal lines indicate median PFOA concentration; the box indicates the interquartile range (IQR) (25th percentile to 75th percentile); the whiskers represent observations within 1.5 times the IQR; and the circles indicate observations more than 1.5 times the IQR away from the box, considered outliers. The median values showed statistical significant increase.
In a Norwegian time trend study, PFOA concentrations in serum were measured in samples collected in the period from 1977 to 2006. A nine-fold increase in the serum concentrations was measured for from 1977 to the mid 1990s where the concentrations reached a plateau before starting to decrease around year 2000 (Haug et al., 2009). This is in line with a decrease of PFOA blood concentrations reported by several studies from the USA (Vestergren and Cousins, 2009). Time trend of PFOA levels in archived human blood specimen from Germany has also been analysed (Wiesmüller and Gies 2011). In 1982, mean blood levels (standard deviation) of PFOA, were 4(2) ng/mL, concentrations were highest in 1986 (7(4) ng/mL) and fluctuated more or less around 5 ng/mL until 2007. The decrease found in Norwegian and American studies could not be confirmed for Germany.
In conclusion, PFOA is present in human blood in the general population. Elevated concentrations are seen following specific exposure to PFOA, either via the environment (e.g contaminated drinking water) or occupationally. Further, breastfeeding, diet, life style and indoor environment influences the human blood levels and are important to take into consideration when assessing the human bioaccumulation potential.
Gestational and lactational transfer
Several studies have reported detectable concentrations of PFOA in cord blood (Apelberg et al., 2007a; Fei et al., 2007; Gützkow et al., 2011; Hanssen et al., 2010; Midasch et al., 2007; Monroy et al., 2008). The concentrations of PFOA in cord blood have been shown to be highly correlated with the corresponding concentration in maternal serum at the time of delivery (Gützkow et al., 2011; Monroy et al., 2008). The transport across the placental barrier seems to be dependent on the compound structure. In a study from Norway including 123 pairs of maternal and cord plasma samples, the median PFOA concentration in cord plasma was 78% of the corresponding concentration in maternal plasma (Gützkow et al., 2011).

SVHC SUPPORT DOCUMENT – PFOA
47
PFOA has also been found to be transferred to infants through breast-feeding (Fromme et al., 2009; Kärrman et al., 2007; Tao et al., 2008; Völkel et al., 2008). The average breast milk concentration of PFOA was 3.8% of the corresponding serum concentrations in a recent Norwegian study (Haug et al., 2011a), and similar numbers were also found in a study from Korea (Kim et al., 2011). Although levels of PFOA in breast milk are low compared to those in blood (Fromme et al., 2010; Kuklenyik et al., 2004; Llorca et al., 2010; So et al., 2006; Tao et al., 2008; Wilhelm et al., 2009), a breast-fed infant will be exposed to considerable amounts of PFOA during the first months of life. A median daily intake of 4.1 ng PFOA/kg bw/day was calculated in a recent Norwegian study, and consumption of breast milk was found to be the major source of exposure for exclusively or predominantly breast-fed infants (Haug et al., 2011a). The total exposure to PFOA for infants was around 15 times higher than the corresponding estimates for adults. The considerable exposure of infants through breast feeding is also supported by the decreasing concentrations of PFOA in breast milk during the course of lactation, seen in an elimination rate study (Thomsen et al. 2010). In a study from Germany, median PFOA levels in cord blood were reported to be 1.7 ng/mL and in blood of 6 month old infants the corresponding level was 6.9 ng/mL (Fromme et al., 2010). PFOA concentrations in infant serum at 6 months of age were 4.6 times higher than in maternal serum at delivery. Further, for all subjects, increasing PFOA concentrations were seen during the first 6 months of life, and most subjects showed a clear decrease in the following months likely due to ended breast feeding.
In conclusion, PFOA has been shown to be readily transferred to the foetus through the placenta in humans. Further, breast milk is an important source of exposure to breast-fed infants and the PFOA exposure for infants is considerably higher than for adults.
Distribution in the human body
In an Italian study, the concentrations of PFOA were examined in various tissues (liver, kidney, adipose tissue, brain, basal ganglia, hypophysis, thyroid, gonads, pancreas, lung, skeletal muscle and blood) from post-mortem examinations of seven subjects whose cause of death had not been related to intoxication (Maestri et al., 2006). PFOA was observed in all tissues, and in line with findings in animal studies the highest concentrations were found in lung, kidney, liver and blood.
In a study from the US, the concentrations of PFOA in 23 paired samples of blood and liver were examined and the mean liver to serum ratio was found to be 1.3 (Olsen et al., 2003). In contrast, higher concentrations were found in blood than liver in a study from Spain, but the samples of liver and blood were not from the same subjects thus drawing conclusions is more difficult (Kärrman et al., 2010).
In conclusion, a similar distribution pattern was seen in humans as in laboratory animals for PFOA, with the highest concentrations found in lung, kidney, liver and blood.
Elimination
The half-life of PFOA has been studied in 26 retired fluorochemical production workers who had high initial serum concentrations (mean = 691 ng/mL) (Olsen et al., 2007). Elimination followed a first-order kinetic model, and the geometric mean half-life for PFOA was 3.5 years (95% confidence interval, 3.0-4.1 years). In a study from West Virginia where people had been exposed to PFOA contaminated drinking water, filtration through granular activated carbon was started (Bartell et al., 2010). Up to six blood samples were collected from each of 200 participants the first year after filtration. The observed data are consistent with first-order elimination and a median serum PFOA half-life of 2.3 years (95% confidence interval, 2.1–2.4 years) was found. The authors found no evidence of age- or sex-dependence of the postfiltration elimination rates. In a following study of the same authors, differences in serum clearance rates between low- and high-exposure water districts were seen, and it was suggested a possible concentration-dependent or time-dependent clearance process or inadequate adjustment for background exposures to being the reason for this observation. Nevertheless, the study indicates that the general population exposed to lower levels of PFOA and therefore a lower starting concentration of PFOA has a long elimination rate, up to 8.5 years. The higher exposed population showed an elimination rate

SVHC SUPPORT DOCUMENT – PFOA
48
of only 2.3 years (Seals et al., 2011). In examinations of people from Germany having consumed contaminated drinking water, a geometric mean plasma PFOA half-life of 3.3 years (range: 1.0 – 14.7 years) was calculated (Brede et al., 2010). Two recent studies on exposures of professional ski waxing technicians indicated a long half-life of PFOA as well (Freberg et al., 2010; Nilsson et al., 2010a).
The long half-life in humans is in contrast to mice and rats with a half-life of PFOA of around 30 to 60 days in mouse and from 1 to 30 days in rat (Tatum-Gibbs et al., 2011). A study by Harada et al. (Harada et al., 2005) showed that the renal clearances of PFOA were almost negligible in both sexes in humans, in clear contrast to the large active excretion in the female rat. In conclusion, an elimination half-life around 2-4 years for PFOA has been reported in humans, and in contrast to certain laboratory animals no sex differences have been observed with respect to the elimination rates.
4.1.3 Bioaccumulation in humans
As described above, PFOA is a very persistent contaminant that does not undergo metabolism and has a long elimination half-life in humans. Thus, if the elimination rate is lower than the uptake, the body burden will increase with age. This is well described for other persistent organic compounds such as PCBs and dioxins. To explore whether this is applicable for PFOA, serum concentrations were modelled using the Ritter population PK model (Ritter et al., 2011). This model defines the relationship between biomonitoring, intake and intrinsic elimination rate of a chemical. The model developed by Ritter et al. (2011) was slightly modified to be applicable for PFOA (Cousins et al, 2013). As PFOA is bound to proteins and not lipids, the body weight and volume of distribution was used instead of lipid fraction. Two different distribution volumes (Vd) for serum have been reported for PFOA in studies involving one-compartment steady-state pharmacokinetic models. The Vd is defined as the total amount of the substance in the body (absorbed dose) devided by its concentration in the serum and the elemination rate (Thompson et al., 2010). Andersen et al. (2006) reported a Vd of 140 mL/kg bw (Cynomolgus monkeys), and a similar Vd of 170 mL/kg bw was found by Thompson et al. (2010) using human data. The apparent Vd of PFOA does not vary significantly in different species suggesting that PFOA is mainly distributed in plasma and in well-perfused tissues such as liver and kindney. PFOA does not significantly bind to tissues. PFOAs´primary carier is albumin (40 g/L albumin in blood, Han et al. 2012) For the Ritter model, the volume of distribution was set to 170 mL/kg body weight (Thompson et al., 2010). Because we are interested in the inherent properties of the compound, the intake was set to be constant (1 ng/kg bw/day) and only the age between 20-55 years was studied. In this age period the body weight is assumed to be constant. Different half-lives between 2.3 and 5 years were put in to the model to illustrate how the half-life affects the trends in PFOA levels with age. As can be seen in the figure on the next page, a half-life between 2.3 and 5 years would result in increasing serum concentration with age until a steady-state condition is reached. How fast the steady-state condition is reached highly depends on the half-life of the compound.

SVHC SUPPORT DOCUMENT – PFOA
49
Figure 7: Modelled PFOA concentrations using a modified Ritter population PK model.
Even though the Ritter population PK model shows that PFOA serum concentration will increase with age, scientific papers, which have explored this are not consistent. As described above, exploring trends in PFOA levels with age in humans is challenging, as there are several factors that might influence the results. In order to obtain "ideal" studies, the exposure needs to be constant in the whole time period (as done in the Ritter population PK model) and the serum measurements need to be performed in the same individuals at different time points. No such studies exist.
In a study by Weihe et al. (2008), concentrations of PFOA were determined in serum samples of 103 Faroese 7-year-olds collected in 1993-94 and in serum samples of 79 of the same individuals in 2000-2001. The median concentration of the 7-year-old children was 5.0 ng/mL while the median concentration of the 14-year-old adolescents was 4.2 ng/mL. As described in the figure below, a higher median concentration in the 7-year-old children than in 14-year-old adolescents is expected due to the change in body weight in this period. However, as we are aiming at describing the inherent properties of PFOA, the bioaccumulation potential needs to be addressed in a time period when the body weight is fairly constant.

SVHC SUPPORT DOCUMENT – PFOA
50
Figure 8: Modelled PFOA concentrations using a modified Ritter population PK model (age
0-80 years) showing the expected decrease in levels in a period when body weight increases.
A study by Olsen et al. (2005) determined the serum concentration at two time points in 58 subjects. The reported increase in serum concentrations of PFOA in this study was explained as a result of increasing exposure related to a general increase in manufacture and use without specific information on exposure of these individuals. However, it is not unlikely that at least a part of the observed increase between these time points is caused by bioaccumulation as modelled by the Ritter model. In some other studies addressing human blood levels of PFOA with life time, no correlation between PFOA concentration and age was reported (Calafat et al., 2007; Olsen et al., 2003; Olsen et al., 2004). In contrast, two Norwegian studies reported significant positive associations between age and serum PFOA concentrations (Haug et al., 2010b; Haug et al., 2011a). As described in section 4.1.2, breast feeding history, diet, life style and indoor environment are important exposure factors and are confounding factors that most likely will hide the measurable accumulation of PFOA with age. This is further supported by two Norwegian studies using multiple linear regression analyses to adjust for different contributing factors. In the Norwegian Fish and Game Study (n=175) levels of PFOA in serum from men and women increase statistically significant with age (Haug et al., 2010b). Also in a study with 41 women aged 25-45 years a statistically significant increase in the PFOA levels with age was found (Haug et al., 2011a). These two studies strongly indicate that PFOA levels increase with age, hence bioaccumulate, but that other important factors of PFOA exposure also need to be addressed in the evaluation of human exposure and accumulation of PFOA. The studies mentioned above that did not observe any correlation between PFOA levels and age did not take these confounding factors into consideration and must therefore be given less weight. As described above, a recent study exploring predictors of PFOA plasma concentrations, found significantly increasing concentrations with increasing number of months since most recent pregnancy (Brantsæter et al. 2013). This shows that after excreting considerable amounts of PFOA when giving birth and breastfeeding, PFOA is re-accumulating in blood. As already mentioned, two recent studies from Norway and Sweden reported significantly elevated PFOA levels in blood serum samples and whole blood samples of professional ski

SVHC SUPPORT DOCUMENT – PFOA
51
waxers compared to the general populations, after using fluorinated ski wax (Freberg et al., 2010; Nilsson et al., 2010a). In the Swedish study, the PFOA levels in three technicians with “low” initial levels of PFOA (<100 ng/mL in pre-season blood) increased from pre-season to post-season by 254, 134, and 120% each, whereas no increases in the serum levels were observed for the five technicians with “high” initial levels (>100 ng/mL in pre-season sample). In the Norwegian study, a statistically significant positive association between the number of years exposed as a ski waxer and the PFOA concentrations in blood serum was observed. Taken together, there are strong indications that PFOA bioaccumulates in humans. This is also as expected based on the toxicokinetic properties of PFOA as illustrated using the Ritter population PK model.
4.1.4 Conclusion on toxicokinetics and bioaccumulation in humans
PFOA is well absorbed following oral and inhalation exposure, and to a lesser extent following dermal exposure in laboratory animals. PFOA is present in human blood of the general population and elevated concentrations are seen following specific exposure to PFOA, either environmentally (e.g. contaminated drinking water) or occupationally. PFOA has not been found to be metabolised. The highest concentrations of PFOA are found in blood, liver, kidney and lung. Urine is the primary route of excretion. Humans have a very slow elimination of PFOA compared with other species, with a half-life around 2-4 years. PFOA has been shown to be readily transferred to the foetus through the placenta both in laboratory animals and humans. Further, breast milk is an important source of exposure to breast-fed infants and the PFOA exposure for these infants is considerably higher than for adults. Gestational and lactational exposure is of special concern as the foetus and newborn babies are highly vulnerable to exposure to toxic substances. The time trend studies show that PFOA levels are significantly associated with the time working as a ski waxer (Freberg et al., 2010; Nilsson et al., 2010a; Nilsson et al., 2010b). The toxicokinetic properties of PFOA and some recent studies strongly indicate that PFOA levels increase with age (Haug et al., 2011a; Haug et al., 2010b, Brantsæter et al., 2013). Based on a weight of evidence approach, there are strong indications that PFOA bioaccumulates in humans. This is also as expected based on the toxicokinetic properties of PFOA as illustrated using the Ritter population PK model.
5 Environmental hazard assessment
The acute and chronic toxicity of PFOA and APFO to environmental species has already been assessed in the OECD SIDS Initial Assessment Report (OECD, 2006). Low toxicity to the organisms in aquatic and terrestrial compartment was observed. As no newer data are available the toxicity of PFOA and APFO to environmental species is considered to be low.
6 Conclusions on the SVHC Properties
The free perfluoroocanoic acid (PFOA) stays in equilibrium with perfluorooctanoate (PFO), the conjugate base, in aqueous media in the environment as well as in the laboratory. The ammonium salt (APFO), which is often used in animal experiments, is very soluble in water. In aqueous solution it is present as anion PFO and the ammonium cation. The dissolved anion PFO will stay in equilibrium with the corresponding acid in aqueous media. In the following PFOA refers to the acid (PFOA) as well as to its conjugate base PFO. Therefore conclusions on PFOA/APFO are considered to be valid for APFO/PFOA as well.
SVHC SUPPORT DOCUMENT – PFOA
52
6.1 PBT, vPvB assessment
6.1.1 Assessment of PBT/vPvB properties – comparison with the criteria of Annex XIII
A weight of evidence determination according to the provisions of Annex XIII of REACH is used to identify the substance as P and B. The available results are assembled together in a single weight of evidence determination. The individual results have been considered in the assessment with differing weights depending on their nature, adequacy and relevance.
6.1.1.1 Persistence
The stability of organic fluorine compounds has been described in detail by Siegemund et al., 2000: When all valences of a carbon chain are satisfied by fluorine, the zig-zag-shaped carbon skeleton is twisted out of its plane in the form of a helix. This situation allows the electronegative fluorine substituents to envelope the carbon skeleton completely and shield it from chemical attack. Several other properties of the carbon-fluorine bond contribute to the fact that highly fluorinated alkanes are the most stable organic compounds. These include polarizability and high bond energies, which increase with increasing substitution by fluorine. The influence of fluorine is greatest in highly fluorinated and perfluorinated compounds. Properties that are exploited commercially include high thermal and chemical stability (Siegemund et al., 2000).
Abiotic degradation
Under relevant environmental conditions in aqueous media PFOA is hydrolytically stable (DT50 > 92 days) and does not undergo direct photodegradation in natural waters. The estimated DT50 for indirect photolysis is 349 days.
Biotic degradation
Screening studies indicate that PFOA is not ready biodegradable. The results of biodegradation tests demonstrate that no biodegradation in water, soil and sediment occurs. Due to the high persistency and lack of degradation, no half-lives could be calculated.
Conclusion on Persistence
All degradation results show, that PFOA is persistent and does not undergo any abiotic or biotic degradation under relevant environmental conditions. According to Annex XIII (section 1.1.1), APFO and PFOA meet the criteria for being persistent (P) and very persistent (vP).
6.1.1.2 Bioaccumulation
According to Annex XIII a number of different information can be used to assess the bioaccumulation potential of a compound. In the following, all available information as outlined in 3.2.2 of REACH Annex XIII, i.e. bioaccumulation in aquatic and terrestrial species and in humans, was considered together in a weight of evidence approach. The individual results have been considered in the assessment with differing weights depending on their nature, adequacy and relevance.
(a) Bioconcentration or bioaccumulation in aquatic species:
The reported BCFs and BAFs for PFOA and APFO are in the range from 0.9 to 266. Therefore, the numerical criterion of Annex XIII (section 1.1.2) is not met.

SVHC SUPPORT DOCUMENT – PFOA
53
However, bioconcentration values in gill breathing organisms is not the most relevant endpoint because of the relatively high water solubility of PFOA which may enable gill breathing organisms to quickly excrete the substance via gill permeation. Air breathing and terrestrial species do not have this ability of excretion.
Furthermore, PFOA does not “bind” to lipids but to proteins.
Therefore, the numerical bioaccumulation (B) criterion defined in the REACH regulation Annex XIII (sections 1.1.1 and 3.2.2 (a)) is not suitable to assess the bioaccumulation potential of PFOA.
(b) Other information on the bioaccumulation potential of the substance:
— Bioaccumulation in terrestrial species;
PFOA has been found in piscivorous mammals and in high trophic level avian predators (Kannan et al., 2005). In herring gull eggs, e.g. PFOA concentrations were measured in the range from 6.5 to 118 ng/g (ww) (Rüdel et al., 2011). Values in polar bear liver ranged from 3-13 ng/g (Martin et al., 2004b) and are similar or even higher compared to very bioaccumulative (vB) long chain PFCAs (Smithwick et al. 2005). The focus of these studies was not to measure the bioaccumulation potential. The fact that PFOA is present in terrestrial species, even in remote areas is of special concern and indicates bioaccumulation potential.
In addition, bioaccumulation of PFOA was studied in lichen, caribou, and wolf, living in the remote Canadian environment (Müller et al., 2011). Calculated biomagnification factors (BMFs 0.3 - 11) and trophic magnification factors (TMFs 1.1 – 2.4) were >1 clearly indicating bioaccumulation within this relatively simple and well described food web, which suggests a high reliability of the results.
— Toxicokinetics and bioaccumulation in humans
PFOA is well absorbed following oral and inhalation exposure, and to a lesser extent following dermal exposure in laboratory animals. PFOA is present in human blood of the general population and elevated concentrations are seen following specific exposure to PFOA, either environmentally (e.g. contaminated drinking water) or occupationally. PFOA has not been found to be metabolised. The highest concentrations of PFOA are found in blood, liver, kidney and lung. Urine is the primary route of excretion. Humans have a very slow elimination of PFOA compared with other species, with a half-life around 2-4 years. The reason for the differences in elimination is likely that PFOA is a substrate for renal organic anion transporters, regulating active renal reabsorption, and these transporters are differentially expressed between species and sex (Han et al. 2012). PFOA has been shown to be readily transferred to the foetus through the placenta both in laboratory animals and humans. Further, breast milk is an important source of exposure to breast-fed infants and the PFOA exposure for these infants is considerably higher than for adults. Gestational and lactational exposure is of special concern as the foetus and newborn babies are highly vulnerable to exposure to toxic substances. In addition after excreting considerable amounts of PFOA when giving birth and breastfeeding, PFOA is re-accumulating in the mothers’ blood.
The time trend studies show that PFOA levels are significantly associated with the time working as a ski waxer (Freberg et al., 2010; Nilsson et al., 2010a; Nilsson et al., 2010b)
The toxicokinetic properties of PFOA and some recent studies, taking into account relevant confounding factors, strongly indicate that PFOA levels increase with age (Haug et al., 2011a; Haug et al., 2010b, Brantsæter et al., 2013). Thus, there are strong indications that PFOA bioaccumulates in humans as defined in REACH Annex XIII. This is also as expected based on the toxicokinetic properties of PFOA as illustrated by using the Ritter population PK model.
— Detection of elevated levels in biota, in particular in endangered species or in

SVHC SUPPORT DOCUMENT – PFOA
54
vulnerable populations, compared to levels in their surrounding environment;
Values in polar bear liver ranged from 3 ng/g to 13 ng/g (Martin et al., 2004b). Butt et al. report concentrations of PFOA in polar bears up to 3.4 ng/g ww. Polar bears live in remote regions where PFOA concentrations in the surrounding water are in the pg/l range. Hence, the levels of PFOA analyzed in polar bear tissues and blood indicate uptake and accumulation of PFOA from the surrounding environment and food (Butt et al., 2010). Even if a quantitative description of bioaccumulation cannot be performed with these data, these data show the presence of PFOA in endangered species in line with REACH Annex XIII.
(c) Ability of the substance to biomagnify in the food chain,
For certain predator-prey relationships or whole food chains trophic magnification factors (TMFs) or biomagnification factors (BMFs) greater than one have been reported, indicating biomagnification of PFOA. If gill breathing animals are top predators within the investigated food webs, no bioaccumulation was shown (Martin et al., 2004b; Kelly et al., 2009). This can be explained by elimination of PFOA via the gills and shows that accumulation in gill breathing animals is not the most relevant endpoint to consider. There are five studies with high reliability investigating aquatic food webs with air breathing organisms as top predators, which show that biomagnification of PFOA is taking place and which can be considered in accordance with assessment of B or vB properties of REACH Annex XIII: For the food chains walrus (liver)/clam, narwhal (liver)/Arctic cod, beluga (liver)/Arctic cod, beluga whale (liver)/Pacific herring (liver) and Artic cod (liver)/marine artic copepod the BMFs are 1.8, 1.6, 2.7, 1.3 and 2.2 respectively, indicating biomagnification (Tomy et al. 2004; Tomy et al., 2009). BMFs ranging from 1.8 to 13 for seven individual dolphin/prey relationships were stated using recalculated PFOA whole body burdens for dolphin indicating biomagnification of PFOA (Houde et al., 2006a). Furthermore, TMFs of 13 for dolphins’ food web, based on dolphin plasma and of 6.3 for whole body estimates (Houde et al., 2006a) support the biomagnification of PFOA. BMFs in the range of 45 to 125 were derived for polar bears (liver) and ringed seal (Butt et al., 2008). Protein corrected TMFs for the the Canadian Arctic food web of beluga whale was 1.4 – 2.64 (Kelly et al., 2009). Often samples of these studies originate from different years but the influence is expected to be low when samples are from remote regions with low variability in environmental concentrations. Care has to be taken when TMFs and BMFs are based on tissue specific concentrations, i.e. for liver, because these factors might be overestimated. Nevertheless, these factors prove the bioaccumulation potential of PFOA as well and raise special concern because of PFOA´s target organ toxicity to liver. Additionally, a relatively simple and well described terrestrial food chain has also been investigated: Bioaccumulation was studied in lichen, caribou, and wolf, living in the remote Canadian environment. Measured BMFs were in the range from 0.9 to 11 and indicate bioaccumulation. Calculated TMFs were in the range from 1.1 to 2.4, indicating trophic magnification, too (Müller et al., 2011). Using the weight of evidence approach the results of the presented studies suggest that PFOA can biomagnify in certain food chains as indicated by biomagnifications factors and trophic magnification factors larger than one. Conclusion on bioaccumulation
The numeric criterion as suggested in REACH Annex XIII (sections 1.1.2 and 3.2.2(a)) for a bioaccumulative substance is not fulfilled for PFOA. Due to its notable water solubility, PFOA might quickly be excreted via gill permeation. Furthermore, PFOA occurs mainly in protein rich tissues like blood and liver (OECD, 2006; Kelly et al. 2009). Hence, bioconcentration in gill breathing organisms and the accumulation in lipids may not be the most relevant endpoint to consider. Field studies show, that air-breathing organisms are more likely to biomagnify PFOA compared to water breathing organisms. Therefore, the numerical bioaccumulation (B) criterion defined in the REACH regulation Annex XIII (sections 1.1.2 and 3.2.2(a)) is not suitable for PFOA to assess its bioaccumulation potential.

SVHC SUPPORT DOCUMENT – PFOA
55
Annex XIII (section 3.2.2 (b)) defines information which should be taken into account when the numerical criterion is not applicable, for example data on the bioaccumulation potential in terrestrial species or in endangered species. PFOA was found in terrestrial species as well as in endangered species as shown for the polar bear and in animals which are likely to become endangered in the near future (narwhale and beluga whale). These findings are of high concern and indicate a bioaccumulation potential.
Furthermore Annex XIII (section 3.2.2(b)) allows taking data from human body fluids or tissues and the toxicokinetic behavior of a substance into account. For PFOA a gestational and lactational exposure in humans was shown, which are of special concern as the foetus and newborn babies are highly vulnerable to exposure to toxic substances. On top of that data from human body fluids clearly provide quantitative proof of the bioaccumulation of PFOA: Half-lives in humans are around 2-4 years. In addition, recent studies, taking into account relevant confounding factors, show that PFOA blood concentrations in humans increase with increasing age.
Finally Annex XIII (section 3.2.2(c)) foresees that the ability for biomagnifications in food chains of a substance is assessed. For PFOA field studies provide trophic magnification factors (TMFs) or biomagnification factors (BMFs) for PFOA for aquatic and terrestrial food chains. When air breathing organisms are top predators in these food chains biomagnification was quantitatively demonstrated by TMFs and BMFs > 1 for several food chains, for example TMFs 1.1 – 2.4 in the food chain on wolfs 6.3 – 13 in the food chain of dolphins and 1.4 – 2.6 (protein corrected) in the food chain of beluga whale.
Conclusion:
1. PFOA does not accumulate in water breathing animals
a. BCFs range from 1.8 to 8.0
b. BAFs range from 0.9 to 266
c. BMFs range from 0.02 to 7.2 whereas most of the data are below 1
d. TMFs range from 0.3 to 0.58 in aquatic piscovorous food webs
2. There is evidence that PFOA biomagnifies in air-breathing mammals
a. BMFs range from 1.3 – 125 for selected predator prey relationships
b. TMFs range from 1.1 to 13 for selected food chains
3. PFOA accumulates in humans
a. PFOA is present in human blood of the general population
b. Half-lives in blood range from 2 - 4 years in humans
c. PFOA levels increase with age after adjusting for relevant confounding factors
d. Elevated levels in human body fluids in population exposed to PFOA contaminated drinking water and in workers in fluorochemical production sites (up to 114,100 ng/ml)
e. Mothers excret PFOA via breast milk and transfer PFOA to infants. After giving birth and at the end of breast feeding PFOA is reaccumulating in maternal blood.
Overall, taken all available information together in a weight of evidence approach the data

SVHC SUPPORT DOCUMENT – PFOA
56
from environmental species and humans indicates that PFOA bioaccumulates. Therefore it is considered that the B criterion of REACH Annex XIII is fulfilled.
6.1.1.3 Toxicity
The acute and chronic toxicity of APFO and PFOA to environmental species is considered to be low.
There is evidence based on the RAC opinion of PFOA that the substance meets the criteria for classification as toxic for reproduction category 1B and the criteria for classification as specific target organ toxic after repeated dose cat.1 (STOT RE 1). With this classification PFOA and APFO fulfils the T criterion according to REACH Annex XIII (sections 1.1.3(b) and (c)).
6.1.2 Summary and overall conclusions on the PBT, vPvB properties
Based on all available information from degradation experiments PFOA and APFO are not degraded in the environment and therefore fulfil the P- and vP-criteria of REACH Annex XIII (section 1.1.1).
Furthermore, it is concluded that PFOA and APFO are bioaccumulative compounds.
The bioaccumulative property is proven by studies from aquatic and terrestrial food webs, which clearly indicate accumulation of PFOA and APFO. In addition, human data strongly indicate that PFOA and APFO bioaccumulate in humans.
It is of special concern that PFOA and APFO biomagnify in endangered species as shown for the polar bear and in animals which are likely to become endangered in the near future (narwhale and beluga whale). Additionally, human gestational and lactational exposure are of special concern as the foetus and newborn babies are highly vulnerable to exposure to toxic substances.
Based on a weight of evidence approach, it is considered that the data from environmental species and humans shows that the B criterion of REACH Annex XIII is fulfilled.
There is evidence based on the RAC opinion of PFOA that the substance meets the criteria for classification as toxic for reproduction category 1B and the criteria for classification as as specific target organ toxic after repeated dose cat.1 (STOT RE 1). With this classification PFOA and APFO fulfils the T criterion according to REACH Annex XIII (sections 1.1.3(b) and (c). Overall, PFOA and APFO are identified as PBT-substances according to Art. 57 (d) of REACH by comparing all relevant and available information listed in Annex XIII of REACH with the criteria set out in the same Annex, partly a weight of evidence determination using expert judgement was applied.
6.2 CMR assessment
The substance is not yet listed in Annex VI of CLP (Regulation (EC) 1272/2008) however there is evidence based on the RAC opinion on PFOA that the substance meets the criteria for classification as toxic for reproduction in accordance with Article 57 (c) of REACH
6.3 Substances of equivalent level of concern assessment.
Not relevant for the SVHC identification of the substance in accordance with Articles 57 (c) and 57 (d).

SVHC SUPPORT DOCUMENT – PFOA
57
7 References
3M Co. 1978a. Biodegradation (ABS/LAS Shake Culture Test). St. Paul, MN. Project number 9970612613. U.S. Environmental Protection Agency Administrative Record 226-0489.
3M Co. 1978b. Environmental Laboratory Technical Report Summary, Adsorption of FC-95 and FC-143 on soil. Environmental Laboratory, 3M Company Project 9970612633: Fate of Fluorochemicals, Report Number 1. St. Paul, MN. U.S. Environmental Protection Agency Administrative Record 226-0488.
3M Co. 1979. Photolysis study using simulated sunlight. FC-143 Photolysis study using simualted sunlight U.S. Environmental Protection Agency Administrative Record 226-0490.
3M Co. 1980c. Environmental Laboratory Acute Toxicity Testing: FC-12. U.S. Environmental Protection Agency Administrative Record 226-0504.
3M Co. 1985. Ready Biodegradation of FX-1001 (BOD/COD). Lab Request No. C1006. Environmental Laboratory. St. Paul, MN. U.S. Environmental Protection Agency Administrative Record 226-0494.
3M Co. 1995. Assessment of bioaccumulatve properties of ammonium perfluorooctanoic acid: Static fish. U.S. Environmental Protection Agency Administrative Record 226-0496.
3M Co. 2001a. Hydrolysis REactions of Perfluorooctanoic Acid (PFOA). 3M Lab Request Number E00-1851. U.S. Environmental Protection Agency Administrative Record 226-1030a090.
3M Co. 2001b. Screening study on the aqueous photolytic degradation of perfluoroctanoic acid [PFOA]. U.S. Environmental Protection Agency Administrative Record 226-1030a091.
3M Co. 2005. Analysis of PFBS, PFHS, PFOS and PFOA in Water Samples collected at 3M Guin. Amended Analytical Report E05-0662. U.S. Environmental Protection Agency Administrative Record 226-3571.
Ahrens L. 2011 Jan. Polyfluoroalkyl compounds in the aquatic environment: a review of their occurrence and fate. J Environ Monit 13(1):20-31.
Ahrens L, Herzke D, Huber S, Bustnes JO, Bangjord G, Ebinghaus R. 2011 Jan. Temporal trends and pattern of polyfluoroalkyl compounds in tawny owl (Strix aluco) eggs from Norway, 1986-2009. Environ Sci Technol.
Ahrens L, Siebert U, Ebinghaus R. 2009 Aprb. Total body burden and tissue distribution of polyfluorinated compounds in harbor seals (Phoca vitulina) from the German Bight. Mar Pollut Bull 58(4):520-525.
Andersen ME, Clewell III HJ, Tan Y-M, Butenhoff JL, Olsen GW. 2006. Pharmacokinetic modeling of saturable, renal resorption of perfluoroalkzlacids in monkeys – Probing the determinants of long plasma half-lives. Toxicology 227: 156 – 164.
Bartell SM, Calafat AM, Lyu C, Kato K, Ryan PB, Steenland K. 2010. Rate of decline in serum PFOA concentrations after granular activated carbon filtration at two public water systems in Ohio and West Virginia. Environmental Health Perspectives 118(2):222-228.
Beilstein. 2005. Handbook of Organic Chemistry (online). request Jaunary 12.

SVHC SUPPORT DOCUMENT – PFOA
58
Borga K, Kidd KA, Muir DC, Berglund O, Conder JM, Gobas FA, Kucklick J, Malm O, Powell DE. 2011. Trophic magnification factors: Considerations of ecology, ecosystems and study design. Integr Environ Assess Manag Epub ahead of print.
Brace NO. 1962. Long chain alkanoic and alkenoic acids with perfluoroalkyl terminal segments. J Org Chem 27(12):4491-4498.
Brantsaeter AL, Whitworth KW, Ydersbond TA, Haug LS, Haugen M, Knutsen HK, Thomsen C, Meltzer HM, Becher G, Sabaredzovic A, Hoppin JA, Eggesbø M, Longnecker MP. Determinants of plasma concentrations of perfluorinated alkyl substances in pregnant Norwegian women. Environ Int. (2013), 53, 74-84.
Brede E, Wilhelm M, Göen T, Müller J, Rauchfuss K, Kraft M, Hölzer J. 2010 Jun. Two-year follow-up biomonitoring pilot study of residents' and controls' PFC plasma levels after PFOA reduction in public water system in Arnsberg, Germany. Int J Hyg Environ Health 213(3):217-223.
Butenhoff JL, Kennedy J, Hinderliter PM, Lieder PH, Jung R, Hansen KJ, Gorma GS, Nokers PE, Thomford PJ. 2004b. Pharmacokinetics of perfluorooctanoate in cynomolgus monkeys. Toxicol Sci 82(2):394-406.
Butt CM, Mabury SA, Kwan M, Wang X, Muir DC. 2008 Mar. Spatial trends of perfluoroalkyl compounds in ringed seals (Phoca hispida) from the Canadian Arctic. Environ Toxicol Chem 27(3):542-553.
Calafat AM, Kuklenyik Z, Reidy JA, Caudill SP, Tully JS, Needham LL. 2007. Serum concentrations of 11 polyfluoroalkyl compounds in the U.S. population: Data from the National Health and Nutrition Examination Survey (NHANES) 1999-2000. Environmental Science and Technology 41(7):2237-2242.
Conder, J.M.,Hoke, R.A.,De Wolf, W.,Russell, M.H.,Buck, R.C. Are PFCAs bioaccumulative? A critical review and comparison with regulatory criteria and persistent lipophilic compounds (2008)Environmental Science and Technology, 42(4),pp. 995-1003. Conder JM, Gobas FAPC, Borga K, Muir DCG, Powell DE. 2011. Use of trophic magnification factors and related measures to characterize bioaccumulation potential of chemicals. Integr Environ Assess Manag:n/a.
Cousins IT, Wong F, MacLeod M. 2013. Understanding the exposure, body burden and elimination of PFAAs in the North American population. Presented at the 23rd Annual Meeting of the Society of Environmental Toxicology and Chemistry (SETAC Europe), 12-16 May 2013, Glasgow, Scotland, United Kingdom.Czub G, McLachlan MS. 2004. Bioaccumulation potential of persistent organic chemicals in humans. Environmental Science and Technology 38(8):2406-2412.
Daikin. 2000. Bioaccumulation test of perfluoralkyl- carboxylic acid (C=7-13) in carp. Test No. 51519, p.26, Kurume Laboratory, Chemicals Evaluation and Research Institue, Japan.
Drouillard KG, Norstrom RJ. 2000. Dietary absorption efficiencies and toxicokinetics of polychlorinated biphenyls in ring doves following exposure to arochlor mixtures. Environ Toxicol Chem 19:2707–2714.
DuPont Co. 1999a. RCRA Facility Investigation Report. DuPont Washington Works, West Virginia USEPA Permit Number WVD04-587-5291. Docket # OPPT-2003-0012-0184.
DuPont Co. 2003. Surface Water Monitoring Report for Washington Works Facility and Local, Letart and Dry Run Landfills. Washington, WV. U.S. Environmental Protection Agency
Ehrlich G, Jöhncke U,Drost W, Schulte C. 2011. Problems faced when evaluating the

SVHC SUPPORT DOCUMENT – PFOA
59
bioaccumulation potential of substances under REACH. Integrated Environmental Assessment and Management 7(4): 550-558. Emmet EA, Shofer FS, Zhang H, Freemann D, Desai C, Shaw LM. 2006. Community exposure to perfluorooctanoate: Relationships between serum concentrations and exposure sources. J Occup Environ Med 48(8):759-770.
Environment Canada. 2012. Ecological Screening Assessment Report. Long-Chain (C9-C20) Perfluorocarboxylic Acids, their Salts and their Precursors.
Fasano WJ, Kennedy GL, Szostek B, Farrar DG, Ward RJ, Haroun L, Hinderliter PM. 2005. Penetration of ammonium perfluorooctanoate through rat and human skin in vitro. Drug and Chemical Toxicology 28(1):79-90.
Fei C, McLaughlin JK, Tarone RE, Olsen J. 2007 Nov. Perfluorinated chemicals and fetal growth: a study within the Danish National Birth Cohort. Environ Health Perspect 115(11):1677-1682.
Fisk AT, Hobson KA, NorstromRJ. 2001. Influence of chemical and biological factors on trophic transfer of persistent organic pollutants in the northwater polynyamarine food web. Environ Sci Technol 35:732–738.
Freberg BI, Haug LS, Olsen R, Daae HL, Hersson M, Thomsen C, Thorud S, Becher G, Molander P, Ellingsen DG. 2010 Oct. Occupational exposure to airborne perfluorinated compounds during professional ski waxing. Environ Sci Technol 44(19):7723-7728.
Fromme H, Midasch O, Twardella D, Angerer J, Boehmer S, Liebl B. 2007 Feb. Occurrence of perfluorinated substances in an adult German population in southern Bavaria. Int Arch Occup Environ Health 80(4):313-319.
Fromme H, Mosch C, Morovitz M, Alba-Alejandre I, Boehmer S, Kiranoglu M, Faber F, Hannibal I, Genzel-Boroviczeny O, Koletzko B, Volkel W. 2010 Sep. Pre- and postnatal exposure to perfluorinated compounds (PFCs). Environ Sci Technol 44(18):7123-7129.
Fromme H, Tittlemier SA, Volkel W, Wilhelm M, Twardella D. 2009. Perfluorinated compounds - Exposure assessment for the general population in western countries. Int J Hyg Environ Health 212(3):239-270.
Gibson SJ, Johnson JD. 1979. Absorption of FC-143-14C in rats after a single oral dose. Riker Laboratories, Inc., Subsidiary of 3M, St. Paul, MN.
Gobas FAPC, de Wolf W, Burkhard LP, Verbruggen E, Plotzke K. 2009. Revisiting Bioaccumulation Criteria for POPs and PBT Assessments. Integr Environ Assess Manag 5:624-637.
Gützkow KB, Haug LS, Thomsen C, Sabaredzovic A, Becher G, Brunborg G. 2011. Placental transfer of perfluorinated compounds is selective - A Norwegian Mother and Child sub-cohort study.
Han X, Snow TA, Kemper RA, Jepson GW. 2003. Binding of perfluorooctanoic acid to rat and human plasma proteins. Chem Res Toxicol 16(6):775-781.
Han X, Nabb DL, Russell MH, Kennedy GL, Rickard RW. 2012. Reneal elimination of perfluorocarboxylates (PFCAs). Chem Res Toxicol 25 (1): 35 – 46.
Hanson M, Small J, Sibley P, Boudreau T, Brain R, Mabury S, Solomon K. 2005 Oct. Microcosm Evaluation of the Fate, Toxicity, and Risk to Aquatic Macrophytes from Perfluorooctanoic Acid (PFOA). aect 49(3):307-316.

SVHC SUPPORT DOCUMENT – PFOA
60
Hanssen L, Röllin H, Odland JO, Moe MK, Sandanger TM. 2010. Perfluorinated compounds in maternal serum and cord blood from selected areas of South Africa: Results of a pilot study. Journal of Environmental Monitoring 12(6):1355-1361.
Harada K, Inoue K, Morikawa A, Yoshinaga T, Saito N, Koizumi A. 2005. Renal clearance of perfluorooctane sulfonate and perfluorooctanoate in humans and their species-specific excretion. Environmental Research 99(2):253-261.
Harada K, Saito N, Inoue K, Yoshinaga T, Watanabe T, Sasaki S, Kamiyama S, Koizumi A. 2004 Mar. The influence of time, sex and geographic factors on levels of perfluorooctane sulfonate and perfluorooctanoate in human serum over the last 25 years. J Occup Health 46(2):141-147.
Haug LS, Huber S, Becher G, Thomsen C. 2011a. Characterisation of human exposure pathways to perfluorinated compounds - Comparing exposure estimates with biomarkers of exposure. Environment International 37(4):687-693.
Haug LS, Thomsen C, Becher G. 2009 Mar. Time trends and the influence of age and gender on serum concentrations of perfluorinated compounds in archived human samples. Environ Sci Technol 43(6):2131-2136.
Haug LS, Thomsen C, Brantsaeter AL, Kvalem HE, Haugen M, Becher G, Alexander J, Meltzer HM, Knutsen HK. 2010 Octb. Diet and particularly seafood are major sources of perfluorinated compounds in humans. Environ Int 36(7):772-778.
Higgins CP, Luthy RG. 2006 Dec. Sorption of perfluorinated surfactants on sediments. Environ Sci Technol 40(23):7251-7256.
Higgins CP, McLeod PB, MacManus-Spencer LA, Luthy RG. 2007 Jul. Bioaccumulation of perfluorochemicals in sediments by the aquatic oligochaete Lumbriculus variegatus. Environ Sci Technol 41(13):4600-4606.
Hinderliter PM, DeLorme MP, Kennedy GL. 2006. Perfluorooctanoic acid: Relationship between repeated inhalation exposures and plasma PFOA concentration in the rat. Toxicology 222(1-2):80-85.
Hinderliter PM, Mylchreest E, Gannon SA, Butenhoff JL, Kennedy J. 2005. Perfluorooctanoate: Placental and lactational transport pharmacokinetics in rats. Toxicology 211(1-2):139-148.
Holmström KE, Johansson AK, Bignert A, Lindberg P, Berger U. 2010 May. Temporal trends of perfluorinated surfactants in Swedish peregrine falcon eggs (Falco peregrinus), 1974-2007. Environ Sci Technol 44(11):4083-4088.
Hölzer J, Göen T, Rauchfuss K, Kraft M, Angerer J, Kleeschulte P, Wilhelm M. 2009. One-year follow-up of perfluorinated compounds in plasma of German residents from Arnsberg formerly exposed to PFOA-contaminated drinking water. International Journal of Hygiene and Environmental Health In Press, Corrected Proof.
Hop H, Borga K, Wing G, Lars G, Janneche K, Skaare U. 2002. Food web magnification of persistent organic pollutants in poikilotherms and homeotherms from the Barents Sea. Environmental Science and Technology 36(12):2589-2597.
Hori H, Hayakawa E, Einaga H, Kutsuna S, Koike K, Ibusuki T, Kiatagawa H, Arakawa R. 2004 Nov. Decomposition of environmentally persistent perfluorooctanoic acid in water by photochemical approaches. Environ Sci Technol 38(22):6118-6124.
Hori H, Nagaoka Y, Murayama M, Kutsuna S. 2008 Oct. Efficient decomposition of perfluorocarboxylic acids and alternative fluorochemical surfactants in hot water. Environ Sci

SVHC SUPPORT DOCUMENT – PFOA
61
Technol 42(19):7438-7443.
Hori H, Yamamoto A, Hayakawa E, Taniyasu S, Yamashita N, Kutsuna S, Kiatagawa H, Arakawa R. 2005 Apr. Efficient decomposition of environmentally persistent perfluorocarboxylic acids by use of persulfate as a photochemical oxidant. Environ Sci Technol 39(7):2383-2388.
Houde M, Bujas TA, Small J, Wells RS, Fair PA, Bossart GD, Solomon KR, Muir DC. 2006a. Biomagnification of perfluoroalkyl compounds in the bottlenose dolphin (Tursiops truncatus) food web. Environ Sci Technol 40(13):4138-4144.
Houde M, Martin JW, Letcher RJ, Solomon KR, Muir DC. 2006b. Biological monitoring of polyfluoroalkyl substances: A review. Environ Sci Technol 40(11):3463-3473.
Hundley SG, Sarrif AM, Kennedy J. 2006. Absorption, distribution, and excretion of ammonium perfluorooctanoate (APFO) after oral administration to various species. Drug and Chemical Toxicology 29(2):137-145.
Hurley MD, Andersen MPS, Wallington TJ, Ellis DA, Martin JW, Mabury SA. 2004. Atmospheric chemistry of perfluorinated carboxylic acids: Reaction with OH radicals and atmospheric lifetimes. Journal of Physical Chemistry A 108(4):615-620.
Inoue Y, Hashizume N, Yoshida T, Murakami H, Suzuki Y, Koga Y, Takeshige R, Kikushima E, Yakata N, Otsuka M. 2012. Comparison of Bioconcentration and Biomagnification Factors for Poorly Water-Soluble Chemicals Using Common Carp (Cyprinus carpio L.). Arch Environ Contam Toxicol. 63(2):241-8.
Ishibashi H, Iwata H, Kim EY, Tao L, Kannan K, Amano M, Miyazaki N, Tanabe S, Batoev VB, Petrov EA. 2008 Apr. Contamination and Effects of Perfluorochemicals in Baikal Seal (Pusa sibirica). 1. Residue Level, Tissue Distribution, and Temporal Trend. Environ Sci Technol 42(7):2295-2301.
Jardine TD, Kidd KA, Fisk AT. 2006. Applications, considerations, and sources of uncertainty when using stable isotope analysis in ecotoxicology. Environmental Science and Technology
Johnson JD, Gibson SJ, Ober RE. 1984. Cholestyramine-enhanced fecal elimination of carbon-14 in rats after administration of ammonium [14C]perfluorooctanoate or potassium [14C]perfluorooctanesulfonate. Fundam Appl Toxicol 4(6):972-976.
Kannan K, Tao L, Sinclair E, Pastva SD, Jude DJ, Giesy JP. 2005 May. Perfluorinated compounds in aquatic organisms at various trophic levels in a Great Lakes food chain. Arch Environ Contam Toxicol 48(4):559-566.
Kärrman A, Domingo JL, Llebaria X, Nadal M, Bigas E, Van BB, Lindstrom G. 2010. Biomonitoring perfluorinated compounds in Catalonia, Spain: concentrations and trends in human liver and milk samples 65. Environ Sci Pollut Res Int 17(3):750-758.
Kärrman A, Ericson I, Van BB, Darnerud PO, Aune M, Glynn A, Lignell S, Lindstrom G. 2007 Feb. Exposure of perfluorinated chemicals through lactation: levels of matched human milk and serum and a temporal trend, 1996-2004, in Sweden. Environ Health Perspect 115(2):226-230.
Kauck EA, Diesslin AR. 1951. Some properties of perfluorocarboxylic acids. Ind Enf Chem 43:2332-2334.
Kelly BC, Gobas FAPC. 2001. Bioaccumulation of persistent organic pollutants in lichen-caribou-wolf food chains of Canada's Central and Western Arctic. Environmental Science and Technology 35(2):325-334.

SVHC SUPPORT DOCUMENT – PFOA
62
Kelly BC, Gobas FAPC. 2003 Jul. An arctic terrestrial food-chain bioaccumulation model for persistent organic pollutants 1. Environ Sci Technol 37(13):2966-2974.
Kelly BC, Gobas FAPC, McLachlan MS. 2004 Oct. Intestinal absorption and biomagnification of organic contaminants in fish, wildlife, and humans. Environ Toxicol Chem 23(10):2324-2336.
Kelly BC, Ikonomou MG, Blair JD, Surridge B, Hoover D, Grace R, Gobas FAPC. 2009. Perfluoroalkyl Contaminants in an Arctic Marine Food Web: Trophic Magnification and Wildlife Exposure. Environ Sci Technol 43(11):4037-4043.
Kelly BC, Ikonomou MG, Blair JD, Morin AE, Gobas FAPC. 2007 Jul. Food web-specific biomagnification of persistent organic pollutants. Science 317(5835):236-239.
Kim SK, Lee KT, Kang CS, Tao L, Kannan K, Kim KR, Kim CK, Lee JS, Park PS, Yoo YW, Ha JY, Shin YS, Lee JH. 2011. Distribution of perfluorochemicals between sera and milk from the same mothers and implications for prenatal and postnatal exposures. Environmental Pollution 159(1):169-174.
Kirk-Othmer. 1994. Encyclopaedia of Chemical Technology. 14th ed. Volumes 1: New York, NY. John Wiley and Sons, 1991-Present., p. V11 551.
Kissa E. 2001. Fluorinated Surfactants and Reppelents. Marcel Dekker; New York.
Kitano M. 2007. Discussion paper on bioaccumulation evaluation. UNEP/POPS/POPRC.3/INF/8. Geneva (CH): UN Environment Programme. 17p.Kowalczyk J, Ehlers S, Oberhausen A, Tischer M, Fürst P, Schafft H, Lahrssen-Wiederholt M. Absorption, distribution, and milk secretion of the perfluoroalkyl acids PFBS, PFHxS, PFOS, and PFOA by dairy cows fed natuarally contaminated feed. 2013. J Agric Food Chem 61(12): 2903-2912.
Kudo N, Bandai N, Suzuki E, Katakura M, Kawashima Y. 2000. Induction by perfluorinated fatty acids with different carbon chain length of peroxisomal beta-oxidation in the liver of rats. Chem Biol Interact 124(2):119-132
Kuklenyik Z, Reich JA, Tully JS, Needham LL, Calafat AM. 2004 Jul. Automated solid-phase extraction and measurement of perfluorinated organic acids and amides in human serum and milk. Environ Sci Technol 38(13):3698-3704.
Lau C, Anitole K, Hodes C, Lai D, Pfahles-Hutchens A, Seed J. 2007 Oct. Perfluoroalkyl acids: A review of monitoring and toxicological findings. Toxicol Sci 99(2):366-394.
Leat EHK, Bourgeon S, Eze JI, Muir DCG, Williamson M, Bustnes JO, Furness RW, Borga K. 2013. Perfluoroalkyl substances in eggs and plasma of an avian top predator, great skua (Stercorarius skua), in the north Atlantik. Environl Toxicol and Chem 32(3): 569-576.
Lide DR. 2003. CRC Handbook of Chemistry and Physics. CRC Press.
Liou JS, Szostek B, Derito CM, Madsen EL. 2010 Apr. Investigating the biodegradability of perfluorooctanoic acid. Chemosphere 80(2):176-183.
Llorca M, Farré M, Picó Y, Teijon ML, Alvarez JG, Barceló D. 2010 Aug. Infant exposure of perfluorinated compounds: Levels in breast milk and commercial baby food. Environ Int 36(6):584-592.
Loi EI, Yeung LW, Taniyasu S, Lam PK, Kannan K, Yamashita N. 2011 Jul. Trophic magnification of poly- and perfluorinated compounds in a subtropical food web. Environ Sci Technol 45(13):5506-5513.

SVHC SUPPORT DOCUMENT – PFOA
63
Lupton SJ, Huwe JK, Smith DJ, Dearfield KL, Johnston JJ. 2012. Absorption and excretion of 14C-perfluorooctanoic acid (PFOA) in Agnus catle (Bos taurus). J Agric Food Chem 60(4): 1128-1134.
Maestri L, Negri S, Ferrari M, Ghittori S, Fabris F, Danesino P, Imbriani M. 2006. Determination of perfluorooctanoic acid and perfluorooctanesulfonate in human tissues by liquid chromatography/single quadrupole mass spectrometry. Rapid Commun Mass Spectrom 20(18):2728-2734.
Martin JW, Mabury SA, Solomon KR, Muir DC. 2003 Jana. Bioconcentration and tissue distribution of perfluorinated acids in rainbow trout (Oncorhynchus mykiss). Environ Toxicol Chem 22(1):196-204.
Martin JW, Mabury SA, Solomon KR, Muir DC. 2003 Janb. Dietary accumulation of perfluorinated acids in juvenile rainbow trout (Oncorhynchus mykiss). Environ Toxicol Chem 22(1):189-195.
Martin JW, Smithwick MM, Braune BM, Hoekstra PF, Muir DC, Mabury SA. 2004 Jana. Identification of long-chain perfluorinated acids in biota from the Canadian Arctic. Environ Sci Technol 38(2):373-380.
Martin JW, Whittle DM, Muir DC, Mabury SA. 2004 Octb. Perfluoroalkyl contaminants in a food web from Lake Ontario. Environ Sci Technol 38(20):5379-5385.
Meesters RJ, Schroeder HF. 2004. Perfluorooctane sulfonate - a quite mobile anionic anthropogenic surfactant, ubiquitously found in the environment. Water Sci Technol 50(5):235-242.
Merck. 2005. Material Safety Data Sheet.
Midasch O, Drexler H, Hart N, Beckmann MW, Angerer J. 2007 Jul. Transplacental exposure of neonates to perfluorooctanesulfonate and perfluorooctanoate: a pilot study. Int Arch Occup Environ Health 80(7):643-648.
MITI-List. 2002. Biodegradation and Bioaccumulation of Existing Chemical Substances under the Chemical Substance Control Law. National Institute of Technology and Evaluation, Japan.
Monroy R, Morrison K, Teo K, Atkinson S, Kubwabo C, Stewart B, Foster WG. 2008 Sep. Serum levels of perfluoroalkyl compounds in human maternal and umbilical cord blood samples. Environ Res 108(1):56-62.
Moody CA, Field JA. 1999. Determination of perfluorocarboxylates in groundwater impacted by fire- fighting activity. Environmental Science and Technology 33(16):2800-2806.
Moody CA, Hebert GN, Strauss SH, Field JA. 2003 Apr. Occurrence and persistence of perfluorooctanesulfonate and other perfluorinated surfactants in groundwater at a fire-training area at Wurtsmith Air Force Base, Michigan, USA. J Environ Monit 5(2):341-345.
Morikawa A, Kamei N, Harada K, Inoue K, Yoshinaga T, Saito N, Koizumi A. 2005. The bioconcentration factor of perfluorooctane sulfonate is significantly larger than that of perfluorooctanoate in wild turtles (Trachemys scripta elegans and Chinemys reevesii): an Ai river ecological study in Japan. Ecotoxicol Environ Saf 65(1):14-21.
Müller CE, De Silva AO, Small J, Williamson M, Wang X, Morris A, Katz S, Gamberg M, Muir DC. 2011 Sep. Biomagnification of Perfluorinated Compounds in a Remote Terrestrial Food Chain: Lichen-Caribou-Wolf. Environ Sci Technol 45(20):8665-8673.
Nilsson H, Karrman A, Westberg H, Rotander A, Van BB, Lindstrom G. 2010 Mara. A time

SVHC SUPPORT DOCUMENT – PFOA
64
trend study of significantly elevated perfluorocarboxylate levels in humans after using fluorinated ski wax. Environ Sci Technol 44(6):2150-2155.
Nilsson H, Rotander A, Van Bavel B, Lindström G, Westberg H. 2010b. Inhalation exposure to fluorotelomer alcohols yield perfluorocarboxylates in human blood? Environmental Science and Technology 44(19):7717-7722.
Oakes KD, Sibley PK, Solomon KR, Mabury SA, Van der Kraak GJ. 2004 Aug. Impact of perfluorooctanoic acid on fathead minnow (Pimephales promelas) fatty acyl-CoA oxidase activity, circulating steroids, and reproduction in outdoor microcosms. Environ Toxicol Chem 23(8):1912-1919.
OECD. 2006. SIDS Initial Assessment Report after SIAM 22 - Ammonium Perfluorooctanoate & Perfluorooctanic Acid. 1-210.
Olsen GW, Hansen KJ, Stevenson LA, Burris JM, Mandel JH. 2003. Human donor liver and serum concentrations of perfluorooctanesulfonate and other perfluorochemicals. Environmental Science and Technology 37(5):888-891.
Olsen GW, Church TR, Hansen KJ, Burris JM, Butenhoff JL, Mandel JH, Zobel LR. 2004. Quantitative evaluation of perfluorooctanesulfonate (PFOS) and other fluorochemicals in the serum of children. Journal of Children`s Health 2(1):53-76.
Olsen GW, Huang HY, Helzlsouer KJ, Hansen KJ, Butenhoff JL, Mandel JH. 2005. Historical comparison of perfluorooctanesulfonate, perfluorooctanoate, and other fluorochemicals in human blood.Environ Health Perspect. 113(5):539-45.
Olsen GW, Burris JM, Ehresman DJ, Froehlich JW, Seacat AM, Butenhoff JL, Zobel LR. 2007. Half-life of serum elimination of perfluorooctanesulfonate, perfluorohexanesulfonate, and perfluorooctanoate in retired fluorochemical production workers. Environ Health Perspect 115(9):1298-1305.
Olsen GW, Zobel LR. 2007. Assessment of lipid, hepatic, and thyroid parameters with serum perfluorooctanoate (PFOA) concentrations in fluorochemical production workers. Int Arch Occup Environ Health. 81(2):231-46.
Olsen GW, Butenhoff JL, Zobel LR. 2009. Perfluoroalkyl chemicals and human fetal development: An epidemiologic review with clinical and toxicological perspectives. Reproductive Toxicology 27(3-4):212-230.
Pace Analytical. 1987. Ready Biodegradation of FC-126 (BOD/COD). 3M Company Lab Request No. E1282. Minneapolis, MN. U.S. Environmental Protection Agency Administrative Record 226-0495.
Prokop HW, Zhou HJ, Xu SQ, Wu CH, Liu CC. 1989 May. Analysis of the products from the electrochemical fluorination of octanoyl chloride. J Fluorine Chem 43(2):277-290.
Quinete N, Wu Q, Zhang T, Yun SH, Moreira I, Kannan K. 2009 Oct. Specific profiles of perfluorinated compounds in surface and drinking waters and accumulation in mussels, fish, and dolphins from southeastern Brazil. Chemosphere 77(6):863-869.
Ritter R, Scheringer M, MacLeod M, Moeckel C, Jones KC, Hungerbuhler K, 2011. Intrinsic human elimination half-lives of polychlorinated biphenyls derived from the temporal evolution of cross-sectional biomonitoring data from the United Kingdom. Environ Health Perspect 119, 225-231.
Rüdel H, Müller J, Jürling H, Bartel-Steinbach M, Koschorreck J. 2011 Apr. Survey of patterns, levels, and trends of perfluorinated compounds in aquatic organisms and bird eggs from representative German ecosystems. Environ Sci Pollut Res Int.

SVHC SUPPORT DOCUMENT – PFOA
65
Schröder HF. 2003 Dec. Determination of fluorinated surfactants and their metabolites in sewage sludge samples by liquid chromatography with mass spectrometry and tandem mass spectrometry after pressurised liquid extraction and separation on fluorine-modified reversed-phase sorbents. Journal of Chromatography A 1020(1):131-151.
Siegemund G, Schwertfeger W, Feiring A, Smart B, Behr F, Vogel H, McKusick B. 2000. Fluorine compounds, organic. Ullmann's Encyclopedia of Industrial Chemistry.
Smithwick M, Mabury SA, Solomon KR, Sonne C, Martin JW, Born EW, Dietz R, Derocher AE, Letcher RJ, Evans TJ, Gabrielsen GW, Nagy J, Stirling I, Taylor MK, Muir DCG. 2005. Circumpolar study of perfluoroalkyl contaminants in polar bears (Ursus maritimus). Environ. Sci. Technol. 39: 5517-5523.
So MK, Yamashita N, Taniyasu S, Jiang Q, Giesy JP, Chen K, Lam PKS. 2006. Health risks in infants associated with exposure to perfluorinated compounds in human breast milk from Zhoushan, China. Environmental Science and Technology 40(9):2924-2929.
Stasinakis AS, Petalas AV, Mamais D, Thomaidis NS. 2008 Jun. Application of the OECD 301F respirometric test for the biodegradability assessment of various potential endocrine disrupting chemicals. Bioresour Technol 99(9):3458-3467.
Steenland K, Jin C, MacNeil J, Lally C, Ducatman A, Vieira V, Fletcher T. 2009. Predictors of PFOA levels in a community surrounding a chemical plant. Environmental Health Perspectives 117(7):1083-1088.
Tao L, Kannan K, Wong CM, Arcaro KF, Butenhoff JL. 2008 Apr. Perfluorinated compounds in human milk from Massachusetts, U.S.A. Environ Sci Technol 42(8):3096-3101.
Tatum-Gibbs K, Wambaugh JF, Das KP, Zehr RD, Strynar MJ, Lindstrom AB, Delinsky A, Lau C. 2011 Mar. Comparative pharmacokinetics of perfluorononanoic acid in rat and mouse. Toxicology 281(1-3):48-55.
Thompson J, Lorber M, Toms LML, Kato K, Calafat AM, Mueller JF, 2010. Use of simple pharmacokinetic modeling to characterize exposure of Australians to perfluorooctanoic acid and perfluorooctane sulfonic acid. Environ. Int. 36: 390-397.
Thomsen C, Haug LS, Stigum H, Frøshaug M, Broadwell SL, Becher G. 2010. Changes in concentrations of perfluorinated compounds, polybrominated diphenyl ethers, and polychlorinated biphenyls in Norwegian breast-milk during twelve months of lactation. Environmental Science and Technology 44(24):9550-9556.
Tomy GT, Budakowski W, Halldorson T, Helm PA, Stern GA, Friesen K, Pepper K, Tittlemier SA, Fisk AT. 2004 Dec. Fluorinated organic compounds in an eastern Arctic marine food web. Environ Sci Technol 38(24):6475-6481.
Tomy GT, Pleskach K, Ferguson SH, Hare J, Stern G, Macinnis G, Marvin CH, Loseto L. 2009. Trophodynamics of some PFCs and BFRs in a western Canadian Arctic marine food web. Environmental Science and Technology 43(11):4076-4081.
Upham BL, Deocampo ND, Wurl B, Trosko JE. 1998. Inhibition of gap junctional intercellular communication by perfluorinated fatty acids is dependent on the chain length of the fluorinated tail. International Journal of Cancer 78(4): 491-495. van den Heuvel-Greve M, Leonards P, Brasseur S, Kotterman M, Zabel A, Vethaak D. 2009. Bioaccumulation of perfluorinated compounds in a harbour seal food web in the Westerschelde, the Netherlands: a field study. In: Poster presentation at SETAC North America, New Orleans.
Van Leeuwen SPJ, Karrman A, Van Bavel B, De Boer J, Lindstrom G. 2006. Struggle for

SVHC SUPPORT DOCUMENT – PFOA
66
quality in determination of perfluorinated contaminats in environmental and human samples. Environ Sci Technol 40(24): 7854-7860.
Vestergren R, Cousins IT. 2009 Aug. Tracking the pathways of human exposure to perfluorocarboxylates. Environ Sci Technol 43(15):5565-5575.
Völkel W, Genzel-Boroviczeny O, Demmelmair H, Gebauer C, Koletzko B, Twardella D, Raab U, Fromme H. 2008 Jul. Perfluorooctane sulphonate (PFOS) and perfluorooctanoic acid (PFOA) in human breast milk: Results of a pilot study. Int J Hyg Environ Health 211(3-4):440-446.
Wang N, Szostek B, Buck RC, Folsom PW, Sulecki LM, Capka V, Berti WR, Gannon JT. 2005 Oct. Fluorotelomer alcohol biodegradation-direct evidence that perfluorinated carbon chains breakdown. Environ Sci Technol 39(19):7516-7528.
Weihe P, Kato K, Calafat AM, Nielsen F, Wanigatunga AA, Needham LL, Grandjean P. 2008. Serum concentrations of polyfluoroalkyl compounds in Faroese whale meat consumers. Environ Sci Technol. 42(16):6291-5.
Weisbrod AV, Woodburn KB, Koelmans AA, Parkerton TF, McElroy AE. 2009. Evaluation of Bioaccumulation Using In Vivo Laboratory and Field Studies. Integr Environ Assess Manag 5:598-623.
Wiesmüller, G. A., Gies, A. 2011. Environmental Specimen Bank for Human Tissues. In: Nriagu, J.O. (Edt.): Encyclopedia of Environmental Health: 507-527
Wilhelm M, Hölzer J, Dobler L, Rauchfuss K, Midasch O, Kraft M, Angerer J, Wiesmuller G. 2009. Preliminary observations on perfluorinated compounds in plasma samples (1977-2004) of young German adults from an area with perfluorooctanoate-contaminated drinking water. Int J Hyg Environ Health 212:142-145.
Wilhelm M, Kraft M, Rauchfuss K, Hölzer J. 2008. Assessment and management of the first German case of a contamination with perfluorinated compounds (PFC) in the Region Sauerland, North Rhine-Westphalia. J Toxicol Environ Health A 71(11-12):725-733.
Ylinen M, Kojo A, Hanhijarvi H, Peura P. 1990. Deposition of perfluorooctanoic acid in the rat after single and subchronic administration. Bulletin of Environmental Contamination and Toxicology 44(1):46-53.