sublethal effects to individuals - university of minnesota ... · sublethal effects to individuals...
TRANSCRIPT

Sublethal Effects to Individuals
EcotoxicologyBiology 5868
2009

Sublethal Effects
Sublethal effects: changes in physiological processes, growth, reproduction
behavior, development, etc.
- common theme: adverse effect on individual’s fitness
Ecological context and concepts:
- sublethal effects may have lethal consequences
- individuals must compete for food, avoid predation, mate, etc.
- ecological mortality v. somatic mortality
- toxicant-related diminution of fitness may equal somatic mortality
(effects expressed in the next generation)

General Adaptation SyndromeSeylean stress - response- specific suite of responses to generalized stress
1) Alarm reaction - short-term
- catecholamine release; epinephrine, norepinephrine)
- glucocorticosteroid release; e.g. cortisol, corticosterone
- increased blood pressure
- increased blood sugar
- immune suppression
2) Adaptation or resistance – mid/long term
- tissue-level response
- hypertrophy, atrophy
3) Exhaustion - long term
- failure to compensate
- eventually leads to death
- depletion of reserves
General Adaptation Syndrome
Exposure Duration
“Cost”
Alarm Adaptation Exhaustion
deathrapid
heart
rate
adrenal
hypertrophy
Immediate Long-Termlow
high

Sublethal Effects - Growth
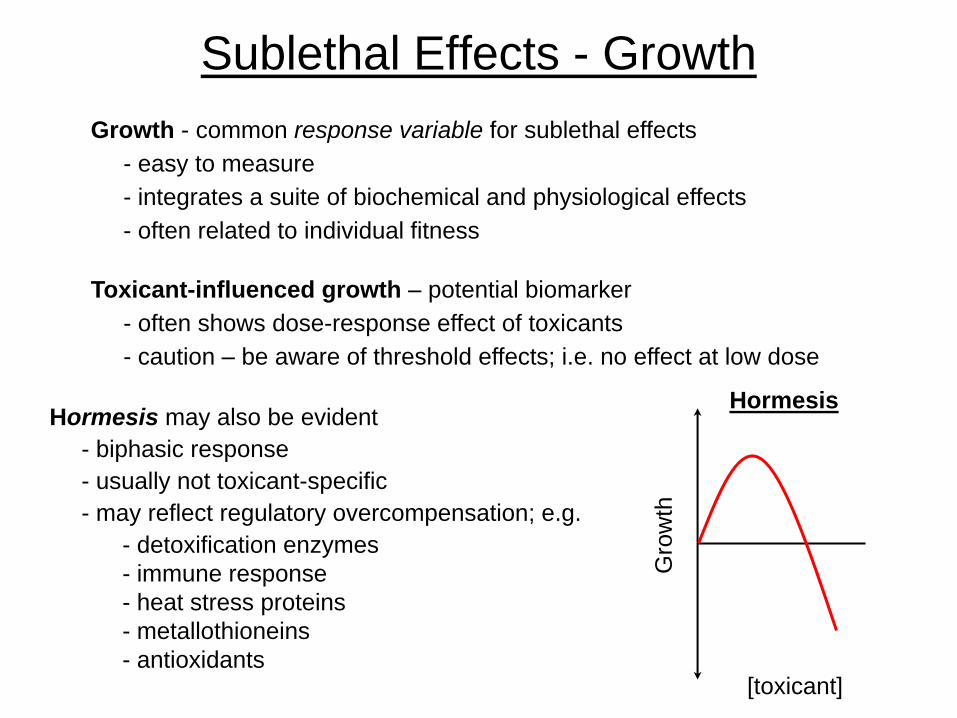
Growth - common response variable for sublethal effects
- often related to individual fitness
Toxicant-influenced growth – potential biomarker
- often shows dose-response effect of toxicants
- caution – be aware of threshold effects; i.e. no effect at low dose
Nomenclature:
Lethal – L
Sublethal Effect – E
Dose – D
Concentration – C
Inhibitory - I
50% mortality – LD50, LC50
50% response – EC50, ED50
50% reduction in normal response – IC50, EC50
by definition, 50% mortality (response) = median dose
test duration: e.g. 48, 96 h
- 48 hour LC50, 96 h EC50
- integrates a suite of biochemical and physiological effects
- easy to measure
Sublethal Effects - Growth
Gro
wth
Hormesis
[toxicant]
Hormesis may also be evident
- biphasic response
- usually not toxicant-specific
- may reflect regulatory overcompensation; e.g.
- detoxification enzymes
- immune response
- heat stress proteins
- metallothioneins
- antioxidants
Growth - common response variable for sublethal effects
- often related to individual fitness
Toxicant-influenced growth – potential biomarker
- often shows dose-response effect of toxicants
- caution – be aware of threshold effects; i.e. no effect at low dose
- integrates a suite of biochemical and physiological effects
- easy to measure

Developmental ToxicityDevelopmental stages are generally more sensitive to toxicants. (Why?)
bill deformity
Toxicant exposure:
- egg stage
- contaminants deposited in yolk
- some contaminants cross placenta
- many vulnerabilities
- embryonic/larval stage
lordosis (flounder)
Critical periods or windows for developmental toxicity; e.g.
- Hg effects (Minamata disease)
- thalidomide
- endocrine disruptors
- malformations (teratogenesis)
- developmental mortality
Effects (e.g.)
- functional deficiencies
- slow growth
- behavior

Teratogenesis Assays
FETAX assay (frog embryo teratogenesis assay – Xenopus)
- 96 h exposure to contaminants
- compare concentrations producing 50% death (LC50)
and 50% abnormalities (TC50)
- mortality and abnormal development scored
- teratogenic index (TI) = LC50/TC50
- reflects developmental hazard of a contaminant
FETAX

Developmental Toxicity
Behavioral teratology – behavioral abnormalities arising after
embryonic exposure to toxicant; e.g.
- mummichogs exposed to Hg as embryos had decreased ability to capture prey
polymelia (Rana pipiens)
- green frogs exposed to pesticides as embryos had decreased
predator avoidance response
Developmental stability – capacity of an organism to
develop into a consistent phenotype
- correlated to fitness
- deviations measured from norm; e.g.
- bilaterality: fluctuating asymmetry (FA)
- FA thought to reflect perturbations in
normal developmental processes

Sexual CharacteristicsEndocrine Disrupting Chemicals (EDCs)
- xenobiotic estrogens (xenoestrogens) mimic estrogens
- regulate activity of estrogen-responsive genes by binding to estrogen receptor (ER)
- disrupt hormonal signaling
- affect sex organ development, brain development, behavior, fertility, physiology; e.g.
- male vitellogenisis (fish)
- male gulls ignore nesting colonies
- female gulls pair, lay infertile eggs (DDT/DDE)
- imposex (mollusks)
- intersex (fish, amphibians)
- sex reversals (fish)
- abnormal sex ratios
Imposex in the dogwhelk
testicular oocytes (leopard frog)

ReproductionEffect: lowered fitness of individuals due to reproductive impairment; e.g.
- DDT/DDE induced eggshell thinning (inhibition of Ca-dependent ATPase
in eggshell gland)
- imposex in mollusks
- various fish:
- reduced egg size
- reduced egg and larval survival
- reproductive failure
- lower fry survival
- lowered fertilization rates
- lower embryo success
- lab experiments; e.g.
- Daphnia – reduced number of young
- Gambusia – low number of embryos

Sublethal Effects - Physiology
Physiological biomarkers: deviations from homeostatic state
- may reflect threshold effects
- may be used to infer mode of action
- e.g. AChE inhibitors may affect feeding, respiration, etc.
- imply lowered fitness
Physiological biomarkers include:
- impaired performance; swimming speed, stamina
- changes in respiration
- excretion
- ion regulation
- osmoregulation
- bioenergetics (i.e. food conversion efficiency)
- immunological capabilities/disease resistance
- etc.

Physiological Biomarkers
Respiratory activity:
- e.g. fish “coughs” (gill purges)
Adenylate energy charge (AEC)
- reflects balance between anabolic and catabolic activities
AEC =ATP + ½ ADP
ATP + ADP + AMP
Respiration (oxidative phosphorylation)
- O2 consumption under minimal and maximal activity levels
- compare with N excretion rate (protein degradation) to determine
CHO v. protein catabolism

Behavior
Contaminants/toxicants cause a wide variety of behavioral changes.
- often measured in lab settings; occasionally in the field
- difficult to objectively score
- considerable “normal” variability
- difficult to extrapolate accurately from structured lab
experiments to field situations
- preference/avoidance
- e.g. light, temp, salinity
- movement towards or away from stimulant
- activity levels; e.g. fatigue, hyperactivity
- feeding; e.g.
- diminished or cessation (lab)
- deviations from predictions from optimal foraging theory (field)
Behavioral biomarkers include:

Behavioral Biomarkers
- performance
- swimming against current
- maintaining proper orientation
- critical swimming speed
- learning
- memory impairment (humans)
- memory loss (humans)
- predation
- avoidance
- sub-optimal foraging behavior
- reproductive behavior
- social interactions
Behavioral biomarkers, cont.

Toxicant Delivery and Exposure
Measured Exposures – Identical to nominal exposure, except that actual
exposures are quantified by analytical chemistry methods.
Nominal Exposures – Toxicant is weighed/diluted/mixed as necessary to
theoretically match the target exposures.
Aquatic organisms are typically exposed to a Concentration of toxicant;
i.e. toxicant is in solution with the water.
Terrestrial organisms are typically administered a Dose of toxicant;
i.e. toxicant is injected into or fed to the test organism.
Nomenclature:
Lethal – L
Sublethal Effect – E
Dose – D
Concentration – C
Inhibitory - I
50% mortality – LD50, LC50
50% response – EC50, ED50
50% reduction in normal response – IC50, EC50
by definition, 50% mortality (response) = median dose
test duration: e.g. 48, 96 h
- 48 hour LC50

Detecting Toxic Effects
Experimental Designs
Sublethal – no death to the test organism; however, effects to its
behavior and/or biochemical & physiological processes occur.
Chronic Lethal – death to the test organism following a prolonged
low-intensity exposure to a toxic substance.
Acute Lethal – death to the test organism following a brief, and
often intense, exposure to a toxic substance.
Effects detected and quantified in tests involving different exposures,
replicates, time series (intervals or single time points)

Proportion of Life Span and System Complexity
Toxicity Tests
Acute
Chronic
Microcosms
Mesocosms
Field studies
Aquatic
Toxicity
Study
Methods

Toxicity Tests
Acute (lethal) - short period of life span
- fish, daphnids, rats, birds
- 24, 48 h
Chronic (lethal) - significant portion of lifespan
- must include gestational period (female)
- must include portion of spermatogenesis (male)

Test SystemsAcute - Aquatic single species tests
toxicant concentrations and O2 returned to original values
animals fed; waste products removed
small amount of waste products
Static: one-time addition of toxicant (test compound), water, food, etc.
O2 content and toxicant decrease over time
- high COD or BOD can be dangerous
metabolic waste products increase
least sensitive; chemical degradation may reduce apparent sensitivity
simple, cost effective
small amount of chemical, waste+
-
Static renewal: periodic addition/removal of toxicant, water, food, etc.; or,
organisms are periodically placed in new solutions
more handling of test vessels and organisms
- increased chance of accidents
- increased stress on animals
less sensitive than flow-through; chemical degradation, absorption
+
-

Test Systems
Flow-through (recirculating, intermittent flow, continuous flow): continual
replacement of toxicant, O2, etc. removal of waste
Acute - Solid Phase (terrestrial, sediment) – cages, pens, soil (flats or plots),
sediments, controlled-environment chambers. • use contaminated substrates
• use spiked substrates
provides more representative evaluation of acute toxicity; sample
can be administered directly from source
higher loading factor (biomass) may be used
maintains water quality
constant toxicant exposure; loss due to volatilization, absorption,
degradation, uptake, reduced
large volumes of sample and dilution water required
increased complexity; space, equipment
uncertainty about effect of water treatment on toxicant concentration
opportunities for mechanical failure
large increase in waste water and toxicant
+
-
Acute - Aquatic single species tests
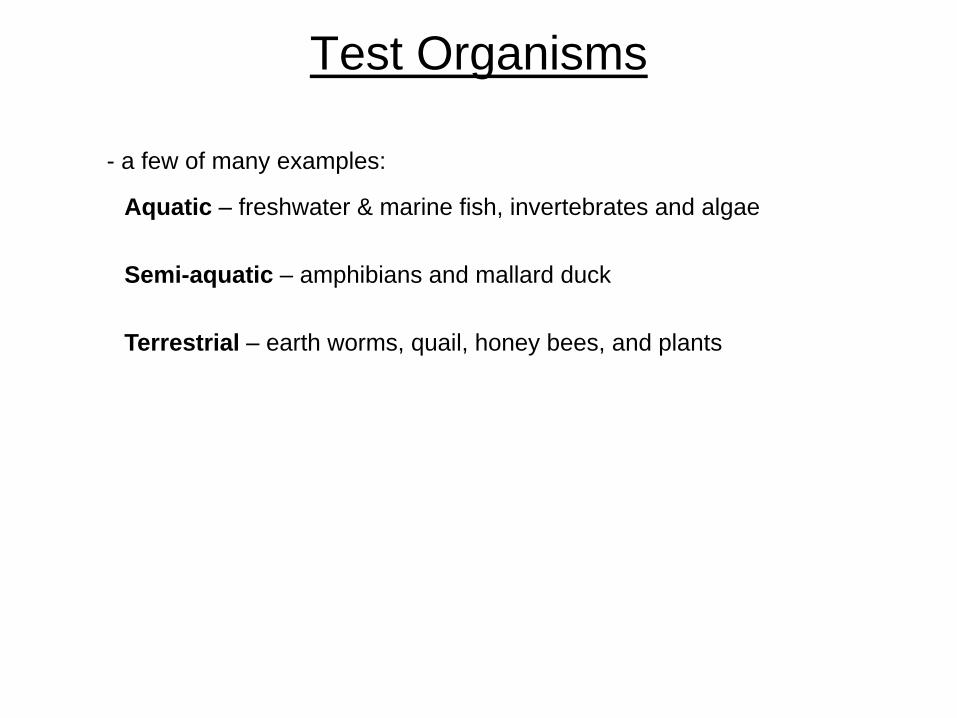
Test Organisms
Terrestrial – earth worms, quail, honey bees, and plants
Semi-aquatic – amphibians and mallard duck
Aquatic – freshwater & marine fish, invertebrates and algae
- a few of many examples:

Test Considerations and Parameters
Dilution water properties – e.g. D.O., hardness, alkalinity, pH, conductivity, salinity
Test substance properties – e.g. solubility, volatility and stability
Test organisms must be subjected to an acclimation period where
all key environmental parameters match the actual test conditions
in the absence of toxicant.
Test organism considerations
- source, age, condition, handling, acclimation or acclimatization
Acclimatization – same processes applied to natural or field settings
Acclimation – (controlled environments or laboratory settings)
Physiological adjustment to a change in environmental conditions;
maintains or minimizes deviations from homeostasis

Test Considerations and Parameters
Feeding – generally avoided, unless organisms are cannibalistic or test duration
significantly overlaps organism’s life span
Environmental variables – temperature and photoperiod
Loading – minimize biomass per unit volume of test solution

Concentration or Dose Units
Aquatic
mg / L = ppm
μg / L = ppb
ng / L = ppt
Terrestrial
mg / kg = ppm
μg / kg = ppb
ng / kg = ppt
ppm – part per million
ppb – part per billion
ppt – part per trillion

Experimental Design
exposure environment
replicates
experimental units
various concentrations = dose/response
[a] [b] [c] [d]
[a] [b] [c] [d] [a’] [b’] [c’] [d’] [a’’] [b’’] [c’’] [d’’]
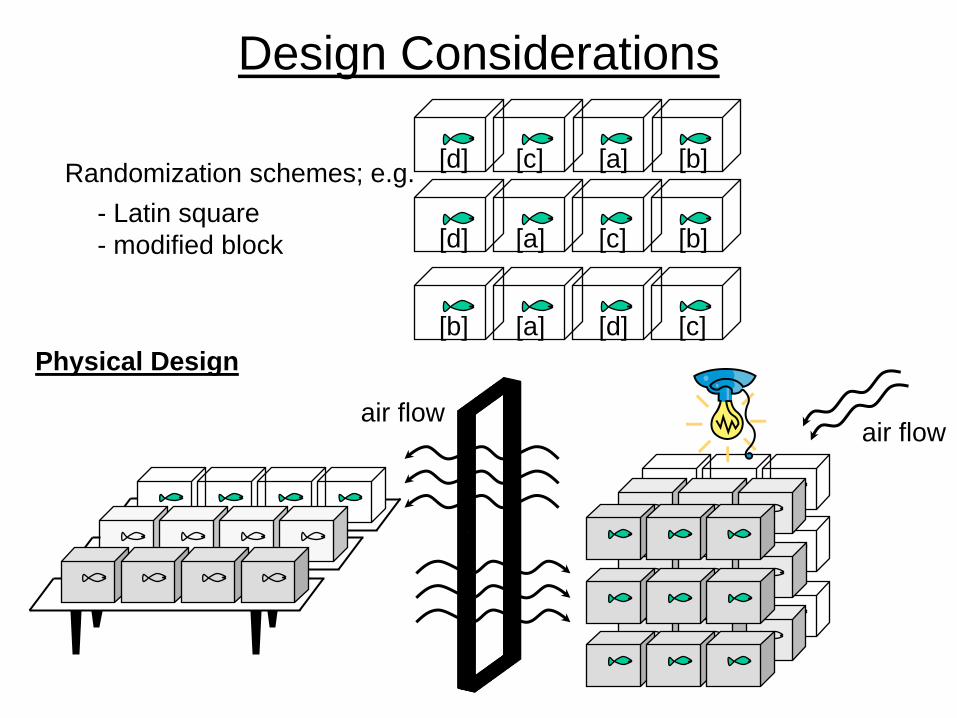
Design Considerations
Physical Design
air flowair flow
[a][d] [c]
[d]
[a][b] [c]
[b][a]
[b]
[c]
[d]
Randomization schemes; e.g.
- Latin square
- modified block

Results and Analysis
Resp
on
se
Concentration
10
50
100
- how potent is the toxicant?
- what is a “safe” concentration
- at what concentration can we expect
lethal effects?
March 19, 2007
FixedFixedOriginalOriginalDateCumulative
LengthWeightLengthWeightStageEuthanizeGrowoutIndividualTubN
200.6411230.81314508/0207/311221
190.5107220.67464508/0208/031292
180.423220.60624508/0808/03123
180.3994210.55494508/0808/04144
180.5047220.68154508/1008/061435
230.9364251.25744508/2808/02136
220.8834231.24234509/0409/011107
220.7950251.21444509/0408/301138
231.0923261.27624509/0809/01119
220.9822261.30244509/0809/042110
241.0814281.44984509/0809/043111
241.2044271.43684509/0809/041812
200.6842230.96404509/081913
231.0118251.25414509/0809/0412414
251.0983271.47974509/0809/0113215
220.7700251.10164509/0809/0414216
241.2381281.65524509/0809/0424317
220.9307251.28644509/1009/042418
220.9640261.26624509/1009/042819
220.8503241.07534509/0809/043820
190.6440230.89094509/1009/0611121
220.7479251.02054509/1009/0411522
230.9425271.20004509/1009/0621523
220.9258261.21084509/1009/0611624
241.0554261.29264509/1009/0413325
230.9516261.23094509/1009/0414126
220.8469251.14054509/1009/0424227
261.1196291.55104509/1009/0434328
250.8391261.06154509/1509/062229
230.7794250.99784509/1509/041530
240.8452241.14274509/1509/0811731
230.8782251.12684509/1509/0821732
261.1169281.59124509/1509/0611833
240.9794271.34294509/1509/0621834
220.7293240.94924509/1509/0612535
210.5885230.81294509/1509/1122536
240.8653261.21804509/1509/0812637
230.7477240.98174509/1509/0813638
240.7812261.11814509/1509/0813839
271.2711291.58664509/1509/0844340
220.7941251.05434509/1509/0814441
230.6952240.97734509/1509/0824442
220.6480240.87124509/1609/1112043
240.8189261.08564509/1609/1122244
240.8290261.08714509/1609/1132245
230.8460261.10954509/1609/1124146
230.7544250.90614509/209/8,11,122347
230.7349250.95624509/209/8,11,123348
240.9958261.23364509/209/8,11,124349
220.6836240.86994509/2009/153450
220.6610230.86274509/209/11,152551
230.7129250.84134509/209/11,153552
230.8777251.06934509/209/14,151653
200.5687230.77334509/209/14,152654
220.8767261.06884509/209/14,153655
210.7083240.95044509/2009/151756
220.8678251.15084509/2009/144857
220.7147250.93404509/2009/1121358
210.7155240.90044509/2009/1511459
240.9278261.19534509/2009/1123360
220.7230230.92364509/2009/0814061
210.7473241.04524509/2009/1534262
220.6897230.86384509/284163
Independent variable – concentration
Dependent variables – response
(e.g. growth, reproduction, behavior,
development, etc.)

Analysis
Hypothesis Testing: Which of the treatment groups is significantly different
from the others? Includes:
1. ANOVA (analysis of variance)
- ANOVA compares variance within treatments (i.e. replicates)
to variance among treatments
-variance within treatments assumed to reflect sampling
- or error variance
- variance among treatments includes error variance plus
any additional variance associated with the treatment
- Null hypothesis states that there should be no difference between,
within, and among variance
- F statistic tests the null hypothesis of equal means among treatments

Analysis
- ANOVA assumptions:
1) equal variances among treatments
2) normally distributed data (Shapiro-Wilk’s test)
- Also, observations must be independent
- depends on good experimental design
- random assignment of treatments
NOTE – data can be transformed (e.g. arcsine, log, square root)
to achieve normality/linearity
concentration log concentration
Hypothesis Testing: continued

**
*
**
Post-ANOVA Tests
ANOVA - differences in variances indicate different means
e.g. Dunnett’s test, students t-test, Williams’s test
- assign a significance to the response means for different treatments
- null hypothesis rejected (differences in variances) - post-ANOVA tests
show which treatments differ significantly from each other
Resp
on
se
Concentration
- level of significance (α) set; most often 0.05 (i.e. 0.95)
10
50
100- various biological effects can be predicted
EC50
However: statistical hypothesis testing only
demonstrates that something that is present
in the data set differs significantly from
the null hypothesis
- null hypothesis accepted (no difference in variances) - no further analysis

Non-Parametric Post-ANOVA Tests
Some data sets will not qualify for ANOVA
- various tests can be used to establish significant differences
- Steel’s many-one rank test
- Wilcoxon rank sum test
- ANOVA assumptions:
1) equal variances among treatments
2) normally distributed data

Sublethal Effects Concepts/Terminology
MATC – maximum acceptable toxicant concentration:
- undetermined concentration within the
interval bounded by the NOEC and
LOEC that is presumed safe
NOEC (NOEL) - no-observed-effects concentration:
- highest test concentration for which there was no statistically
detectable difference of the control response
NOAEC - no observed adverse effects concentrations
LOEC (LOEL) - lowest-observed-effects concentration:
- lowest concentration in a test with a statistically significant difference
from the control response
LOAEC - lowest observed adverse effects level
NOEC < MATC < LOEC
log concentration
NOEC
LOEC
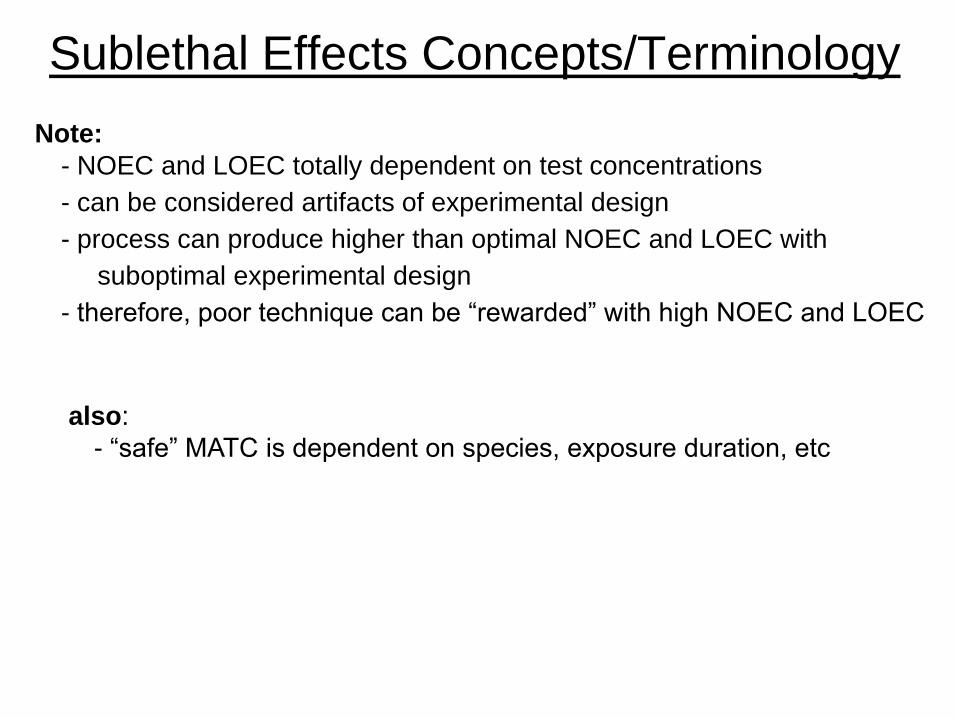
Sublethal Effects Concepts/Terminology
- “safe” MATC is dependent on species, exposure duration, etc
also:
- NOEC and LOEC totally dependent on test concentrations
- can be considered artifacts of experimental design
- process can produce higher than optimal NOEC and LOEC with
suboptimal experimental design
- therefore, poor technique can be “rewarded” with high NOEC and LOEC
Note:

Regression Methods
Data fit to a concentration-effect model by various regression methods; e.g.
- least-squares
- maximum-likelihoodR
esp
on
se
Concentration
50
10
- concentrations and their associated confidence intervals having biologically
significant effects can be calculated by interpolation
- e.g. IC10, LC5, etc.
EC50
EC10