subcompartment analysis rwcu line break: [filter/demineralizer … · 2012-11-19 · break room...
TRANSCRIPT

Subcompartment AnalysisRW'CU Line Break:
[Filter/Demineralizer Room]
1 Background
Subcompartment analysis review for the RWCU line break in the Filter/Demineralizerroom of a Mark III containment is characterized by a need to assess and establishconservative modeling for phenomena associated with 1) the break up of subcooled andflashing liquid jets; 2) entrainment and de-entrainment rates for suspended liquid water;and, 3) two-phase pressure drop across vent pathways. Shown in Figure 1 are thethermodynamic boundary conditions for various coolant injections. In most scenariosinvolving primary system line ruptures the injection will begin with a flashing liquidrelease (a) and then transition from a flashing liquid (b) to a flashing two-phase (c) andfinally to a vapor-vapor (d) release. In the case of the RWCU line break, a significantportion of the injection (first - 10 seconds) is from a subcooled liquid release followed bya flashing liquid release. For the flashing liquid release, the final condition is a vaporstate in the containment, yet only a portion of the liquid flashes (pressure flash expansionoption). Benchmarking and analysis of subcompartment events have typically beenperformed for only flashing liquid and higher energy releases. For some RWCU linebreaks it is important to realize that 1) the injections are unique in that a large portion ofthe release is as subcooled liquid, and 2) the SRP [1] guidelines for review calculationsare provided mainly for primary system line breaks and not the type of breaks that arecharacterized by large initial releases of subcooled liquid.
In this paper, phenomena associated with a particular RWCU line break which isdiscussed in light of a recent River Bend Station (RBS) request to utilize the GOTHICcode for subcompartment analysis using a drop/liquid conversion model. A number ofCONTAIN subcompartment calculations are presented to demonstrate the range of breakroom peak pressures that may be encountered with this class of subcompartment analysisbased on water entrainment, de-entrainment, and slip ratios in exit pathways.Additionally, the appropriate assumptions for a conservative assessment of the RBSRWCU line break in the Filter/Demineralizer room are summarized.
The recommendations for subcompartment analysis for highly subcooled injections, suchas the RWCU line break, remain as stated in the CONTAIN qualification report' forsubcompartment analysis, with the addition that water from liquid jets that does not flashshould not be entrained into the break room atmosphere.
'CONTAIN Code Qualification Report/User Guide for Auditing Subcompartment Analysis Calculations,SMSAB-02-04, September 2002.
Final Draft I

2 Phenomena
Shown in Table I is a list of phenomena that affect the break room pressure and also thepressure differential between the break room and the rest of containment. Note that thispaper uses peak break room pressure as a safety criterion for the subcompartmentanalysis.2 Because the time period for reaching peak pressure (and peak differentialpressure) is short, and in lieu of a requirement for conservative analysis, the wall andpool components that would include phenomena associated with forced convection heatand mass transfer (condensation) is neglected. Entrainment of liquid however from walland pool surfaces is included as part of the cell volume component.
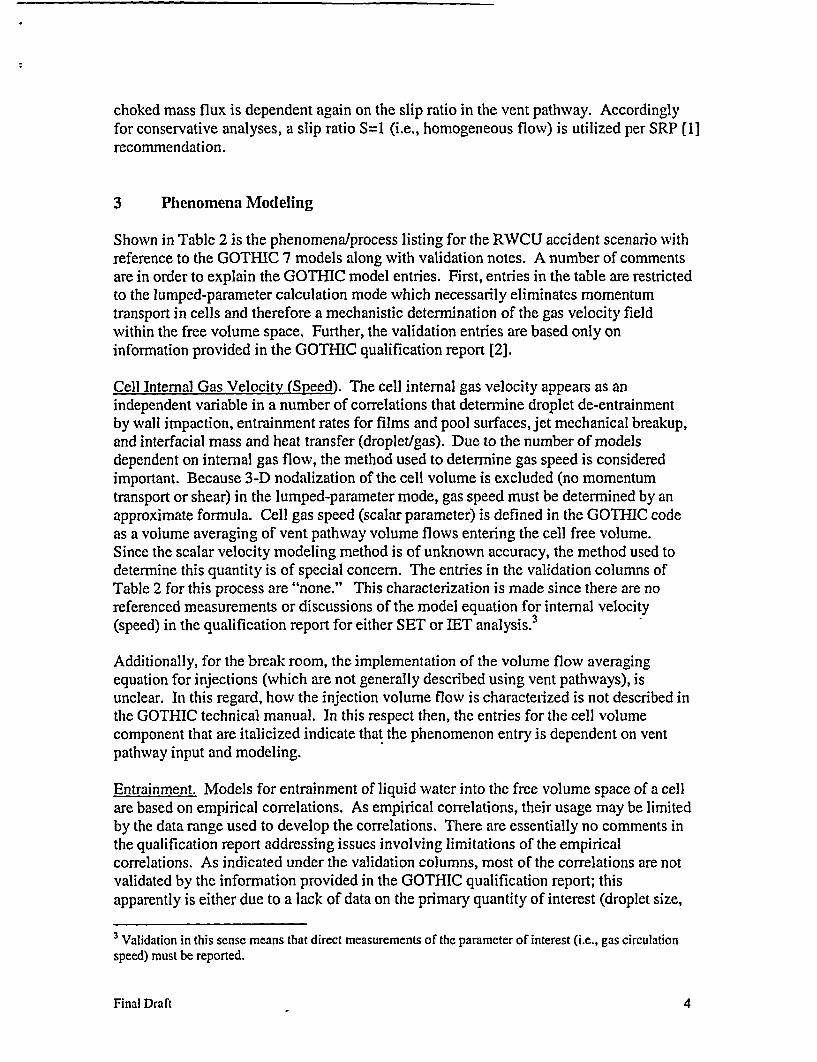
The list includes phenomena or processes that occur throughout the injection period. Theperiod however is realistically divided into to sub-periods that include 1) the subcooledliquid release phase (0-10 seconds) and 2) the flashing liquid release phase (10-60seconds). These periods are indicated in the source injection, as shown in Figure 2. Inthis figure the horizontal line represents the saturated liquid water specific enthalpy at aninitial pressure of - 1 atmosphere. Water enthalpy below this horizontal line representssubcooled liquid that will not flash; whereas, water enthalpy above the line correspondsto flashing liquid water.
Subcooled Liquid Release Phase
During the first ten seconds of the scenario, no vapor will be generated in the break room.The break room pressure will therefore remain essentially at atmospheric pressure. Asmall portion of the break room air will exit the room as liquid from the break partiallydisplaces the air volume in the sump region.
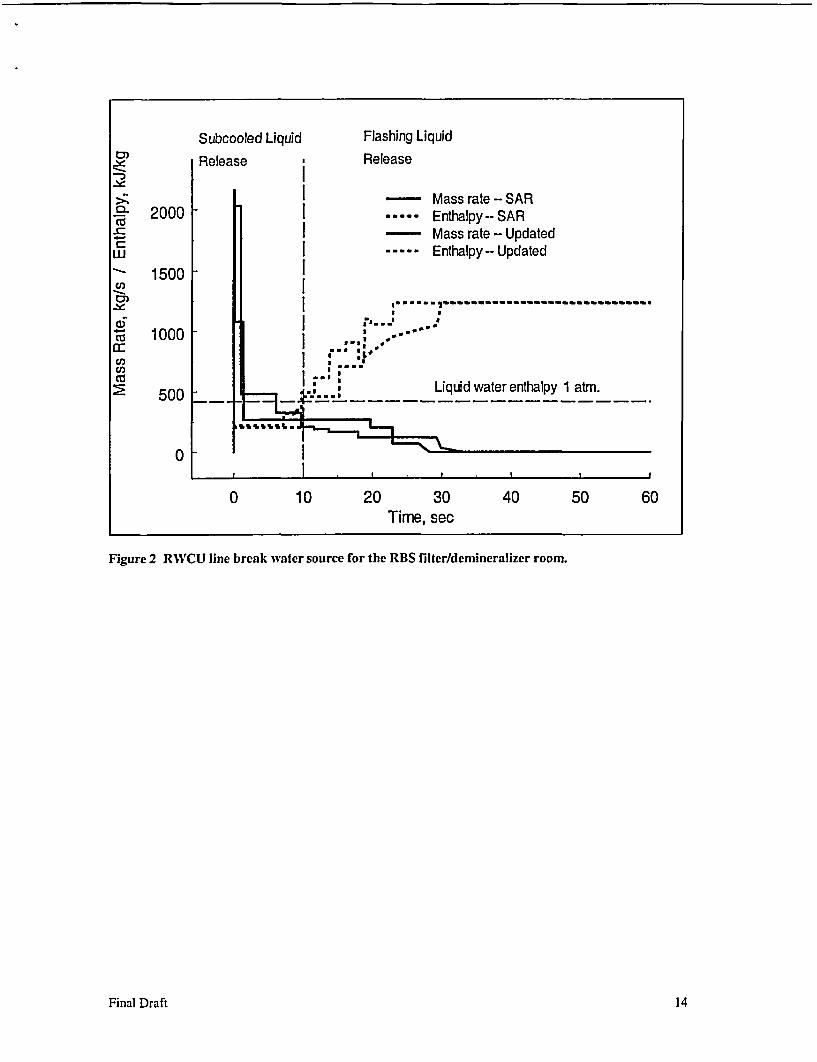
The liquid entering the break room during the early period S,.b may be subject to partialatomization due to mechanical breakup of the liquid jet, Figure 3. However, since thereis no vaporization that could generate significant gas flows within the break room, anddue to the small size of the room, the jet core and any droplets formed may be assumed toimpact surrounding structures (walls, tank, etc.) and drain and/or rainout rapidly onto thefloor or sump of the room. It is noted that approximately 50% of the total water injectedfor the RWCU break scenario is from this subcooled liquid release. Therefore, theamount of water entrained into the break room atmosphere during the first 10 seconds ofthe RWCU injection would be considered minimal at the beginning of the flashing liquidrelease (t>10 seconds).
Flashing Liquid Release Phase
Following the subcooled liquid release, a portion of the sutperheated water will flashresulting in a vapor (steam) source S"P, and an atomization of unflashed water SIi' dueflow flash
2 The RWCU line break source is significant for raising the pressure in the break room but has aninsignificant effect on containment pressure. Therefore the pressure differential between the break room
and containment may be approximated simply as AP,, = P,,(,, (breakroom) - P,,,ir .
Final Draft 2

to flashing phenomena occurring within and on the surface of the liquid core of theinjected jet, Figure 4. Shown in Figure 5 is an estimate of the partitioning of liquid andvapor for the injection based on a constant enthalpy expansion to the total pressure of thebreak room (pressure flash assumption in CONTAIN, i.e., safety relief valve injectionoption). As indicated, the portion of liquid that flashes goes from zero at - 10 seconds tox,,it- 0.3 at about 30 seconds. For most cases involving flashing of liquid jets, thebreakup of the unflashed liquid will be significant such that the Sauter mean dropletdiameter (SMD) will be approximately < 100 pm. The vapor portion of the injection willgenerate gas circulation flows in the break room which may entrain a significant portionof the dispersed unflashed water droplets within the circulation flow. However, jetimpaction on surrounding structures can significantly reduce this amount. And thereforejet impaction in the vicinity of the break, dependent on the break geometry and roomobstructions, will significantly affect how much of the unflashed liquid will enter andremain in the cell free volume space.
Within the break room, droplets entrained in the flow may subsequently be deposited onwall or floor surfaces as a result of impaction and gravitation settling enhanced bycoalescence. Additionally, liquid deposited on structures as a film and on the pool orsump water surface can be re-entrained into the gas flow provided that surface gas flowsare relatively high (- > 10 m/s) and directed along the surfaces. The characterizationtherefore of entrainment and de-entrainment by all the processes described is exceedinglycomplex for any arbitrary injection into a small room containing large amounts ofequipment. Therefore, sensitivity analyses for the models involving these processes arerequired to ascertain the uncertainties in the safety criterion (peak pressure) in order toassure a conservative assessment.
The break room pressure will also be dependent on the rate of the gas mixture (air/steam)flow exiting the break room through the vent pathway(s). Due to the relatively high massfluxes that are expected in subcompartment analyses (G > 1000 kg/s-M2 ), and the smalldroplet sizes (normally characterized as a fog), the conservative practice has been toassume that the drag force on the particles due to the gas flow through the pathway issufficiently large such that the flow is essentially homogeneous (i.e., with a slip ratio S =1). Under such conditions the stagnant quality of the gas/steam/droplet mixture in thebreak room Xst is also the flow quality X in the vent pathway. The formula relatingstagnant and flow quality is given as
IX,, = 1-X S (1)
Shown in Figure 6 is the functional dependence of the flow quality with slip for variousstagnation qualities. For a mass flux Gm through a vent pathway, the gas/steam mixtureexit flow is X*Gm; therefore, for a given mass flux, slip ratios much greater than S=1(homogeneous flow) will result in significant increases in the gas/vapor flow rates withattendant reductions in break room pressure. Furthermore, as break room pressureincreases during the injection, the potential for choking increases also such that atpressure ratios P,; / P.p,,,enm of approximately 0.5 the exit flow is choked. The critical
Final Draft 3
choked mass flux is dependent again on the slip ratio in the vent pathway. Accordinglyfor conservative analyses, a slip ratio S=1 (i.e., homogeneous flow) is utilized per SRP [1]recommendation.
3 Phenomena Modeling
Shown in Table 2 is the phenomena/process listing for the RWCU accident scenario withreference to the GOTHIC 7 models along with validation notes. A number of commentsare in order to explain the GOTHIC model entries. First, entries in the table are restrictedto the lumped-parameter calculation mode which necessarily eliminates momentumtransport in cells and therefore a mechanistic determination of the gas velocity fieldwithin the free volume space. Further, the validation entries are based only oninformation provided in the GOTHIC qualification report [2].
Cell Internal Gas Velocity (Speed). The cell internal gas velocity appears as anindependent variable in a number of correlations that determine droplet de-entrainmentby wall impaction, entrainment rates for films and pool surfaces, jet mechanical breakup,and interfacial mass and heat transfer (droplet/gas). Due to the number of modelsdependent on internal gas flow, the method used to determine gas speed is consideredimportant. Because 3-D nodalization of the cell volume is excluded (no momentumtransport or shear) in the lumped-parameter mode, gas speed must be determined by anapproximate formula. Cell gas speed (scalar parameter) is defined in the GOTHIC codeas a volume averaging of vent pathway volume flows entering the cell free volume.Since the scalar velocity modeling method is of unknown accuracy, the method used todetennine this quantity is of special concern. The entries in the validation columns ofTable 2 for this process are "none." This characterization is made since there are noreferenced measurements or discussions of the model equation for internal velocity(speed) in the qualification report for either SET or lET analysis.3
Additionally, for the break room, the implementation of the volume flow averagingequation for injections (which are not generally described using vent pathways), isunclear. In this regard, how the injection volume flow is characterized is not described inthe GOTHIC technical manual. In this respect then, the entries for the cell volumecomponent that are italicized indicate that the phenomenon entry is dependent on ventpathway input and modeling.
Entrainment. Models for entrainment of liquid water into the free volume space of a cellare based on empirical correlations. As empirical correlations, their usage may be limitedby the data range used to develop the correlations. There are essentially no comments inthe qualification report addressing issues involving limitations of the empiricalcorrelations. As indicated under the validation columns, most of the correlations are notvalidated by the information provided in the GOTHIC qualification report; thisapparently is either due to a lack of data on the primary quantity of interest (droplet size,
3 Validation in this sense means that direct measurements of the parameter of interest (i.e., gas circulationspeed) must be reported.
Final Draft 4

concentration, etc.) or a lack of information regarding key parameters on which themodel is based (e.g., pool effective depth for entrainment, etc.).
De-entrainment. There are a number of phenomena associated with de-entrainmentprocesses. The models for these processes are either empirical or analytical. Theanalytical models are simplified and therefore validation under accident type conditionsis questionable. As with the entrainment models there is a minimum of SET/ET de-entrainment validation provided in the GOTHIC qualification report. One of the moreimportant de-entrainment phenomena is direct jet impaction, as mentioned above. Forthis phenomenon there is only one IET set of data included; however, the data are limitedto very low droplet concentrations corresponding to severe accident type of injectionrates. Direct impaction modeling for lumped-parameter cells is parametric in that de-entrainment is not mechanistically calculated; rather, the de-entrainment depends on atuning parameter "bend angle." Lack of data for impinging flashing jets in thequalification report for GOTHIC together with the limitation for the lumped-parameterrepresentation of jets severely limits any validation of direct jet impaction modeling.Because it is believed that direct jet impaction significantly affects droplet size andconcentration in the atmosphere, the lack of validation for jet impaction is a serious faultfor the GOTHIC droplet/liquid conversion modeling in general.
Interfacial Drag. Separate field equations are solved in GOTHIC to determine phasemass fluxes in a vent pathway. The prediction of phase slip depends on the method usedto determine interfacial drag between the phases. There are no SET data presented in thequalification report that validates the separate field modeling as implemented in theGOTHIC code. JET data from the HDR facility and the Battelle Model Containment(BMC) tests provide information on secondary quantities (pressures and pressuredifferentials), but no data are provided on the primary quantities of phase velocities invent pathways. It should be noted however that instrumentation to obtain these velocitieswere included in the HDR test plan. Unfortunately, no reliable data were obtained fromthese instruments.
Critical Choked Flow. Essentially, all of the IET data involving two-phase flow betweencompartments during a simulated blowdown is for unchoked flows. As a result, thepressure differentials reported in the qualification report can not validate the critical flowmodels used in the GOTHIC code. Therefore, the analytical correlations (HEM) arevalidated only through verification that the correlations are implemented as described inthe GOTHIC technical manual. Validation therefore relies on the acceptance of the HEMchoked model, which appears to be an acceptable conservative method based on varioustest comparisons from a variety of sources not listed in the qualification report.
Final Draft Is

4 RWCU Line Break Accident
The discussion of the RWCU line break scenario focuses on four topical areas:
* Benchmarking* Subcooled liquid entrainment* Flashing liquid entrainment* Vent pathway flow areas
(Except for the benchmarking exercise, the CONTAIN calculations reported below arefor the SAR sources and vent pathways. The updated sources and new pathwaysreferenced in the recent RBS submittal do not substantially affect the conclusions drawnfrom the results obtained using the SAR inputs.)
The CONTAIN input options that control simulations of jet entrainment (subcooled orflashing liquid) amounts and de-entrainment are listed in Table 3. In the cases involvingpartial entrainment of the liquid portion of the flashing jet (cases 6 and 7), the externalatmospheric source is determined through a standalone analysis for constant enthalpyexpansion to the break room pressure.
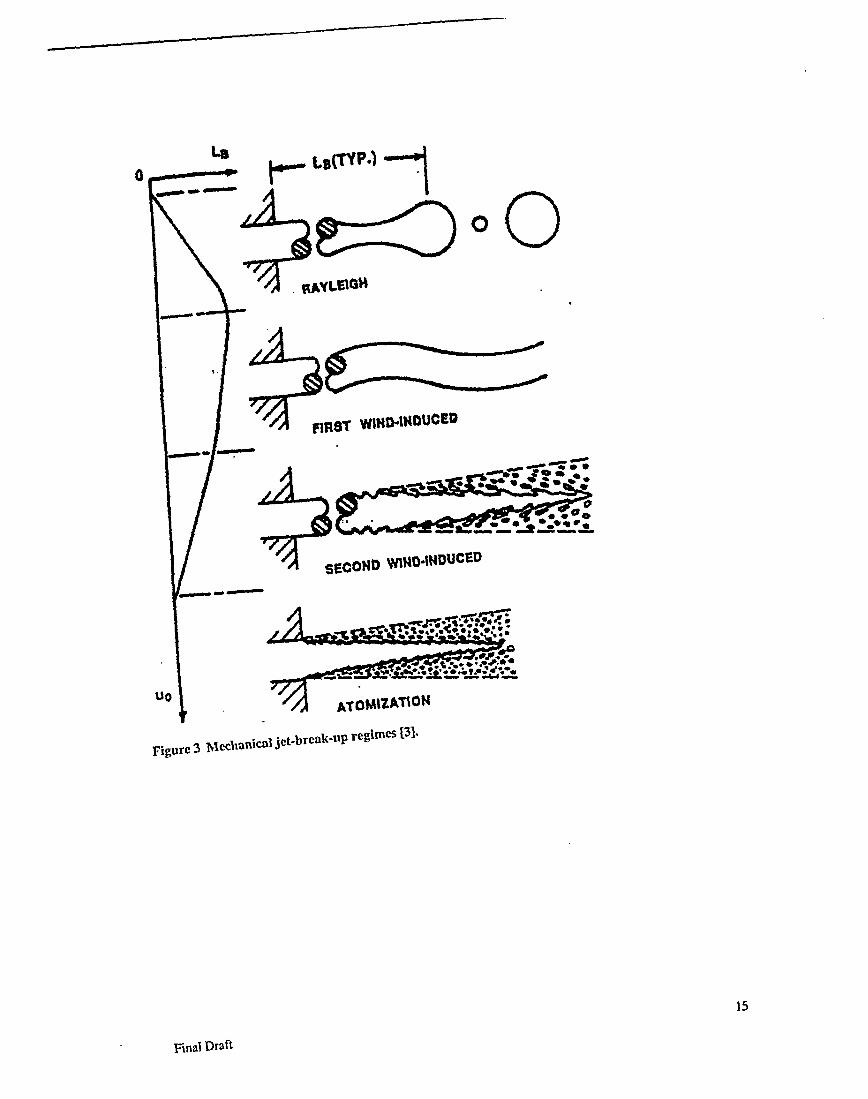
Benchmarking. Shown in Figures 7 and 8 are comparisons of the CONTAIN calculationsfor the RWCU line break in the Filter/Demineralizer room, with similar RBS codecalculations performed with THREED (SAR) and GOTHIC 7 (new pathways andupdated source), respectively. In the CONTAIN calculations, 100% entrainment ofunflashed water is assumed, along with homogeneous flow through the pathways. Figure7 shows that the CONTAIN and THREED code results are essentially identical. Thisconfirms the original licensing basis and assumptions for entrainment and flow used inthe RBS SAR. Figure 8 indicates that the CONTAIN results also compare favorably withGOTHIC calculations using updated break line sources and new vent pathways providedthat the drop/liquid conversion model option is not used. Without the drop/liquidconversion model, the GOTHIC code appears to include models that force 1) 100%entrainment, and 2) homogeneous flow. Because the exit flows are choked in both theSAR and updated calculations (per CONTAIN result analysis), it would also appear thatthe critical choked modeling in all three codes, with S=1, are also similar. We note thatthe homogeneous frozen modeling (HFI) for critical choked flow in CONTAIN isscaled by input (recommended multiplier factor = 0.7) to approximate the homogeneousequilibrium model (HEM) used in both THREED and GOTHIC: the period of chokingcalculated by CONTAIN is shown in both Figure 7 and 8.
Subcooled liquid entrainment. The initial injection of subcooled liquid into the breakroom was assumed to have 100% water entrained into the free gas volume with no de-entrainment. Some breakup of the liquid jet could be expected due to mechanical oraerodynamic forces, but as noted above the assumption that 100% of the liquid issuspended would appear to be an overestimate, and nonconservative. Shown in Figure 9are pressure profiles calculated assuming various entrainment amounts for the initial (10second) injection of subcooled water. In these calculations, the liquidflashing jet, after
Final Draft 6

10 seconds, is assumed to be 100% entrained (as assumed in the benchmark exercise).These results from CONTAIN calculations show that peak pressure in the break room isvery sensitive to the assumption of how much entrainment of the initial subcooled liquidwater occurs.4 From the discussion concerning subcooled liquid injections, it would bereasonable to select entrainment percentages significant below 100% for this early sourceof water. A conservative assumption would exclude subcooled liquid water as a possibleentrainment source, locating this water into the sump of the break room.
Flashing liquid entrainment. Subsequent to the subcooled liquid injection, the enthalpyof the water is increased above the boiling point of water in the break room.Vaporization of water within the jet generates bubbles that aid in breaking up the jet, andforming small droplets (Sauter mean droplet diameters typically less than 100 Pjm). Sincethe vapor amounts are substantial, gas/steam mixture circulation flows within the breakroom will be relatively high such that some portion of the liquid droplets generatedduring the jet break up will be suspended. However, much of the unflashed liquid (asdroplets and ligaments) will be removed from the atmosphere due to direct impaction ofthe jet with the surrounding structures. It seems reasonable that the net entrainmentpercentage for the unflashed liquid will be less than 100%. Shown in FigurelO arepressure profiles for various entrainment percentages for the unflashed liquid that isinjected into the break room at times greater than 10 seconds. In the calculations, thesubcooled liquid injected prior to 10 seconds is assumed to fall directly into the breakroom sump with no subsequent entrainment into the break room atmosphere. Clearly, asmore unflashed liquid water is suspended, the peak pressure in the break room increases.This behavior of pressure increasing as a result of entrainment for flashing liquid jets isalso confirmed for large scale liquid flashing tests such as the HDR tests V44 and T3 1.5.
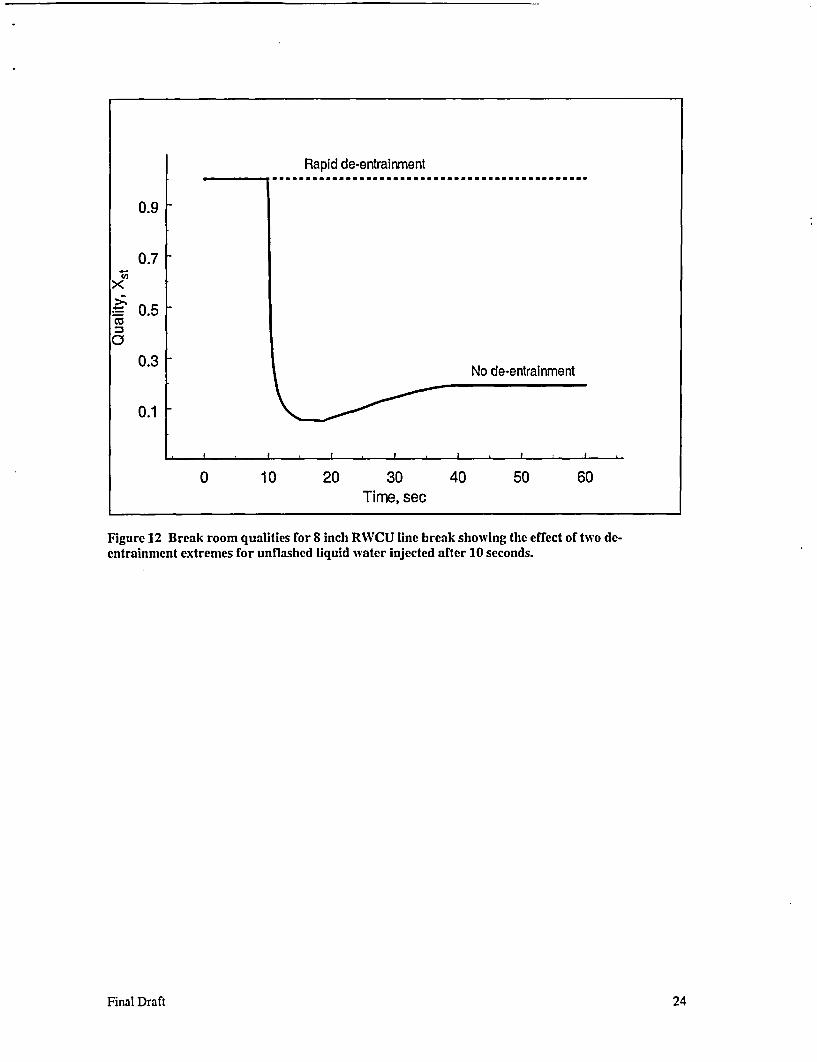
In the above flashing liquid calculations, the unflashed liquid entrained into theatmosphere is assumed to remain suspended throughout the accident. Of course someliquid will be de-entrained by some of the processes listed in Table 1. Shown in Figure11 is a sensitivity calculation assuming an initial 100% entrainment of unflashed liquidwater with subsequent rapid dropout (removal of liquid water at end of timestep). Thegas/vapor quality in the break room is shown in Figure 12. The increased quality for thecase with essentially an infinite deposition rate effectively increases the gas/steam massflux through the exit pathway according to G, = Xst*Gm. The low quality for the - zerodeposition rate significantly reduces the gas/steam flow and therefore increases the peakpressure calculated for the break room.
As we noted in the discussion on slip, if the slip ratio is increased the flow quality alsoincreases. Therefore, at high slip ratios, the flow through the exit pathway is essentiallyall gas/steam. In CONTAIN, if the flashing liquid is injected into the break roomatmosphere as an external water source along with liquid water aerosol generation, asimulation of near infinite slip ratio can be approximated. The infinite slip is effectivelyapproximated since aerosol mass is not included in the homogeneous fluid density ofgas/steam/aerosol mixture flowing through the pathway exit. By not including the
4 Note that peak break room pressures above - 35.6 psia are above the design limit for theFilter/Demineralizer room (with the containment pressure remaining at initial pressure).
Final Draft 7

suspended liquid aerosol in the fluid density, an infinite slip ratio is simulated. Shown inFigure 13 is the pressure profile comparisons for 100% entrainment of unflashed liquidwith liquid included in the fluid density (G, = Xst*Gm), and the case with liquid excluded(Gv = G.n). The break room qualities, representing suspended water, are shown in Figure14 (note: only for the case labeled "liquid suspension" is the quality factored into thecalculation of gas/steam flow). Both methods have the suspended water in thermalequilibrium with the gas/steam mixture. It is interesting to note that the pressure profilesfor aerosol suspension and the case with rapid dropout are essentially identical. Thesecomparisons indicate that whether simulating rapid de-entrainment or - infinite slip ratiothe cases result in similar break room pressures.
Vent pathway flows. The exit pathway area for the Filter/Demineralizer room,referenced in the RBS SAR calculations, is 0.127 m2 (1.4 ft2 ). This vent area is quitesmall, and notably smaller than similar vents for Filter/Demineralizer rooms in someother Mark III containments (- 1.4 m2 or 15.1 ft2 ). Shown in FigurelS is a comparison ofpressure profiles for the 8 inch RWCU line break for various exit vent areas. Asindicated in the figure, very modest peak pressures are shown for vent areas thatapproach the 1.4 m2 vent exit area. Figure 16 shows the quality profiles in the breakroom calculated for these vent areas. Note that these calculations are performed with thesubcooled liquid directed to the sump and 100% entrainment of unflashed liquid waterwith no de-entrainment in the break room. The vent flow is modeled as homogeneousflow.
5 Summary
Phenomena expected to occur in the Filter/Demineralizer room during a RWCU linebreak has been described. The list of phenomena has been related to GOTHIC modelsand the validation of those models, as indicated in the GOTHIC qualification report. Ingeneral, the validation of the complex phenomena and interaction of phenomenaassociated with droplet formation, entrainment, and de-entrainment in a break room hasnot been established for the conditions expected during RWCU line break events.Furthermore, the separate field modeling method used with the droplet/liquid conversionoption in the GOTHIC code also does not appear to be validated for the highly subcooledinjections that characterize the RWCU line breaks.
The CONTAIN code calculations for the RWCU line break, with equivalent assumptionsregarding liquid water entrainment and flow modeling, have been benchmarked to theSAR THREED calculations and the more recent GOTHIC calculations for updated SARsources and vent pathways.
5 The aerosol sizes generated by nucleation are smaller than what may be generated by jet break up;therefore, we might expect a slight variation in the comparisons shown here if larges drops sizes had beenused to simulate thermal non-equilibrium between drops and atmosphere. The effect however is believedto be insignificant for droplet diameters < 100 pm.
Final Draft 8

CONTAIN calculations using reasonable assumptions regarding entrainment ofsubcooled liquid jets, flashing jets, de-entrainment rates, and slip ratios for vent pathwayshave indicated that the conservative peak pressure (and also pressure differential) for theFilter/Demineralizer room is likely to be higher than the SAR values reported, and abovedesign limits. It would appear that the RBS exit pathway area for theFilter/Demineralizer room at 0.127 m2 is uncharacteristically too small. A more realisticpathway area for this relatively small room would likely result in peak and differentialpressures that would be within the design limits of the break room. It is recommendedthat the original SAR peak pressure and differential pressure calculations for the RBSRWCU line break (and any subsequent calculations based onfill entrainment ofsubcooled liquid releases) be re-evaluated in light of questionable assumptions regardingthe early suspension of subcooled liquid water releases.
6 References
1. U.S. Nuclear Regulatory Commission Standard Review Plan, Section 6.2.1.2,NUREG-0800, Rev. 2, July 1981.
2. "GOTHIC Containment Analysis Package: Qualification Report," NAI8907-09Rev 6, July 2001.
3. Witlox H. and Bowen P. J., "Flashing liquid jets and two-phase dispersion: Areview," Health and Safety Executive Books (Contract Research Report403/2002), Sudbury, Suffolk CO10 2WA, UK [HSE website: www.hse.gov.ukl.
4. Park. B. S. and Lee S. Y., "An experimental investigation of the flash atomizationmechanism," Atomization and Sprays, Volume 4, pp. 159-179, 1994.
Final Draft 9

Table 1. Phenomena Identification for RWCU Line Break in theFilter/Demineralizer Room
Component Description
Cell Volume Vapor/Gas circulation / velocity, u,[break room] Entrainment: Y,
Jet atoinisationMechanical breakupFlashing
FilmPool
De-entrainment: Yd
Gravity settlingImpaction (walls)Impaction (jet)
Coalescence, Ad
Droplet Vaporization/Condensation, AdDroplet Convection heat transferMist/drop formation, y,Nucleation
Vent pathway Interfacial drag, Dv, Dud[from break room] Form/friction drag, K
Critical flow, Gcho0cd
Final Draft 10

:it7 Table 2. Identification of breakroom phenomena for lum d parameter modeling of sub-compartment accident events.
Component Description GOTHIC ModelType Validation Report
SET IETCell Volume Vapor/Gas circulation/speed, u, Approx. assumption None None[breakroom] Entrainment: y, Empirical
Jet atomisotionMechanical breakup None No dataFlashing Small jet No dataFilm Annular flow (small No data
diameter tube)Pool None No data
De-entrainment: ydGravity settling Analytical approx. Correlation verification NoneImpaction (walls) Empirical None Limited rangeImpaction (jet) Parametric None Parametric assessment
Coalescence, Ad Analytic approx. None NoneDroplet Vaporization/Condensation, Ad HMTA Free fall evaporation Limited rangeDroplet Convection heat transfer Analytic approx. Free fall evaporation NoneMist/drop formation, y, Parametric None NoneNucleation _ _
Vent pathway Interfacial drag, D,,, Ddd | Empirical/single droplet None Limited range[from breakroom] Form/friction drag, K Input _ _
Critical flow, Gc I Analytical (HEM) Correlation verification None

21
rimTable 3. Source and Entrainment/De-entrainment options for the CONTAIN calculationsCase No. Simulation Type Subcooled Jt (t<10 secon Flashing Liqu id Jet (t>IO seconds)
Source Source De-entrainmentc Source Source De-cntrainmentC_ (Ext.) (SRV)b (Ext.) (SRV)
BenchmarkI SAR (THREED) Sb None None SNone None
2 Updated (GOTHIC) S:u None None S' None Nonc
Subcooled3 0% entrainment None Ssub None S,^None None
4 5% 0.05S,,b 0.95Sb None Srs None None
5 20% 0 .2 0 5 b 0.OSOsb None Si None None
Flashing Liquid _6 5% entainment None S,~bNone 0.05Sh14 S None
7 30% None S bNone 0.30S~h S, None
8 100% None Ssub None sah None None
9 Rapid de-entrainment None SsubNone S11-, None dropout
10 Water aerosols None sb None Sash None aerosol (NAC=1)
Vent PathwaysI None Sb None S None None
abC
External atmospneric source linermal equilirlum; I.e., temperature iasnj -Safety Relief Valve source [pressure flash - with premixed dropout of liquid to sump]None is default [atmospheric liquid remains in atmosphere, with liquid added to atmospheric density]dropout [removal to atmospheric liquid at end of timestep, after thermal equilibrium mixing (i.e., saturation)]aerosol [water aerosols by homogeneous nucleation, water aerosol mass not included in atmospheric density]
t)

SUBCOOLED LIQUID RELEASE
I 2 i: 0'! co 20
a Vapour
FLASHING LIQUID RELEASE
0! . I
201
o Vapour
Temperature Temperature
(a) (b)
FLASHING TWO-PHASE VAPOUR-VAPOUR RELEASE
Vapou'rVapour
Temperature Temperature
(c) (d)
Figure 1 Thermodynamic boundary conditions in relation to saturated conditions (3]; point "1"refers to the initial liquid stagnation condition or far upstream condition, and point "2" refers to theatmospheric condition beyond the break exit.
Final Draft 13
Subcooled Liquid Flashing Liquid
Release Release
- Mass rate - SAR< 2000 l I". Enthalpy-- SAR
I - Mass rate -- UpdatedC:w .. Enthalpy-- Updated
-- 1500
a)
CZ 1000 I .- .
.. Liquidwater enthalpy 1 atm.
0__ ________________
0 10 20 30 40 50 60Time, sec
Figure 2 RWCU line break water source for the RBS filter/demineralizer room.
Final Draft 14
La LaMTP4)
mj
R AYLE10G
-* E~s: w olo4 o11DUCED
-
N-VIIDIDU-E
footao
A OMIZAtION
Figure 3 Mechanical jet-brcakUP
regimes [31.
Final Draft

itmeat
slug babble
(c)m* *.* *..
Figure 4 Dependence of spray characteristics on upstream flow conditions [4].
Final Draft 16

0.4 i
0.3 I
C I0
1i 0.2 Subcooled Uquid| Flashing Liquidc Release ReleaseC IC,,I
LL 0.1
I
0.00 1 I 2 .. 4 0 600 10 20 '.:: 30 40 50 60
Time, sec
Figure 5 Flashing fraction (pressure flash) for RWCU break [RBS SAR].
Final Draft 17

1.0 _ _- - -- -_- --- --00 .... . .. . .. . .. . .
0.8
a 0.6
0AlLL U,.
* 04 / - 0.2./ -e- 0.3
... 0.50.2-- 0.8
0 10 20 30 40Slip rati.o
Figure 6 Relationship between flow qualities and slip ratio for various stagnation qualities.
Final Draft 18
Figure 7 Pressure calculations in the filter/demineralizer room for the 8 inch RIVCU line break[SAR injection sources and SAR vent pathways].
Final Draft 19

35 - CONTAINo GOTHIC 7
30 i
E 25 -
(nCD
, I20 I o/Choked
15
0 10 20 30 40 50 60Time, sec
Figure 8 Pressure calculations in the filter/demineralizer room for the 8 inch RWCU line break -GOTHIC calculation without droplet/liquid conversion option [updated SAR injection sources andnew vent pathways].
Final Draft 20

0%
70
60
.* 50
=-t
3 40enCaa)
0X 30
20
10
100%
I
0 10 20 30Time, sec
40 50 60
Figure 9 Break room pressure sensitivities for various subcooled liquid entrainment percentages forthe 8 inch RWCU break in the filter/demineralizer room.
Final Draft 21

Fntrainment80 _
5%70 - *... 100% Unflashed liquid (t>10 sec)
60 ..
Mu' 5
0 10 20 30 40 50 60Time, sec
Figure 10 CONTAIN calculated filter/demineralizer room pressure for 8 inch RWCU line breakusing SAR water sources and pathways. Water injection prior to 10 seconds (subcooled liquid) isassumed to be transferred directly to the room sump.
Final Draft 22

80
70
60Camn 50a)
n 40a)m on
- 100% entrainment, no de-entrainment.... 100 % entrainment, rapid de-entrainment
MUaI
20
10l I l.. .. . . . ...
0 10 20 30Time, sec
40 50 60
Figure 11 Sensitivity of break room pressure for 8 inch RWCU line break to de-entrainment ofunflashed liquid water injected after 10 seconds.
Final Draft 23
Rapid de-entrainmentP...............................................
0.9
0.7-
*t> 0.5
O
0.3 No de-entrainment
0.1 \
0 10 20 30 40 50 60Time, sec
Figure 12 Break room qualities for 8 inch RWCU line break showing the effect of two de-entrainment extremes for unflashed liquid wvater injected after 10 seconds.
Final Draft 24

- 100% entrainment, no de-entrainmentI- 100% entrainment, water aerosols80
70
60
o. 50
' 40
L 30
20
10I I I I I
0 10 20 30Time, sec
40 50 60
Figure 13 Sensitivity of break room pressure for 8 inch RWCU line break to slip ratios. The solidline represent the case with homogeneous flow, S=1. The dash-dot line corresponds to a simulation ofnear infinite slip ratio.
Final Draft 25

0.9
0.7
0.5 Water aerosol
0.3 ~~~,...,......... """'0.3 fl
0.1' Liquid suspension
0.1 _
. I I I .- . . . . - I - .
0 10 20 30 40 50 60Time, sec
Figure 14 CONTAIN calculated qualities for 8 inch RWCU break for assumptions regarding thetreatment of suspended water.
Final Draft 26

Area = 0.127m2 (1.4 ff2)80 - -- 0.3 m2 (3.2 ft2)
*--- 0.75 m2 (8.1 ft2)70 .... 1.4 m2 (15.1 f2) f*%..
60.FCZ
m- 50a)
'n 40CnC,,a)d- 30
20
10
0 10 20 30 40 50 60Time, sec
Figure 15 Sensitivity of pressure profiles to exit pathway area for the filter/demineralizer during an8 inch RWCU line break (SAR sources and pathways).
Final Draft 27

0.9 - Area= 0.127 m2 (1.4 ft2)-- 0.3 m2 (3.2 ft2)
0.75 m2 (8.1 ft2)0.7 -a.. 1.4 m2 (15.1 ft2)
C,,
- 0.5
*0.3 L-nm
. .. . ~. . . /0.1
0 10 20 30 40 50 60Time, sec
Figure 16 Sensitivity of quality profiles to exit pathway area for the filter/demineralizer during an 8inch RWCU line break (SAR sources and pathways).
Final Draft 28