study of limits for cement and gwp of concrete
TRANSCRIPT

Bay Area Low Carbon Concrete Code. Last updated 10/18/2019 Page 1 of 16
STUDY OF LIMITS FOR CEMENT AND GWP OF CONCRETE
This is a summary of a study of both cement content and embodied carbon in concrete used in
Northern California. The first section of the summary is intended to be included as an appendix
to support the proposed code language. The second section documents the history and process
of setting limits in this project in order to provide additional context.
In order to evaluate the cement and embodied carbon (referred to in this report as GWP) impacts
for different concrete mix designs in use in Northern California, a wide set of data was analyzed.
The set includes (1) data from the National Ready-Mix Concrete Association’s (NRMCA) Life
Cycle Assessment (LCA) report for the US1 and Pacific South West (PSW), which includes
California2, (2) data from ClimateEarth, which include one major ready-mix producer in the Bay
Area as well as producers in Seattle and Texas3, and (3) data collected by structural engineers in
the Structural Engineer’s Association of Northern California (SEAONC)4. This analysis is
summarized in the figures below.
Figure 1: NRMCA cement use per strength mix design options
Figure 1 plots data from the NRMCA report and shows that the amount of cement required for
different concrete mixes varies significantly based upon strength as well as the type of mix (most
1 https://www.nrmca.org/sustainability/EPDProgram/Downloads/EPD10080.pdf
2 https://www.nrmca.org/sustainability/EPDProgram/Downloads/NRMCA_Benchmark_Report_-_October_14_2014_web.pdf
3 https://www.nrmca.org/sustainability/EPDProgram/Downloads/EPD10080.pdf
4 https://docs.google.com/forms/d/e/1FAIpQLSfKVqr8_DFliFwtcc2d086ZekvwJCv0MLRGUCtw-HQG8oQj8A/viewform
Bay Area Low Carbon Concrete Code. Last updated 10/18/2019 Page 2 of 16
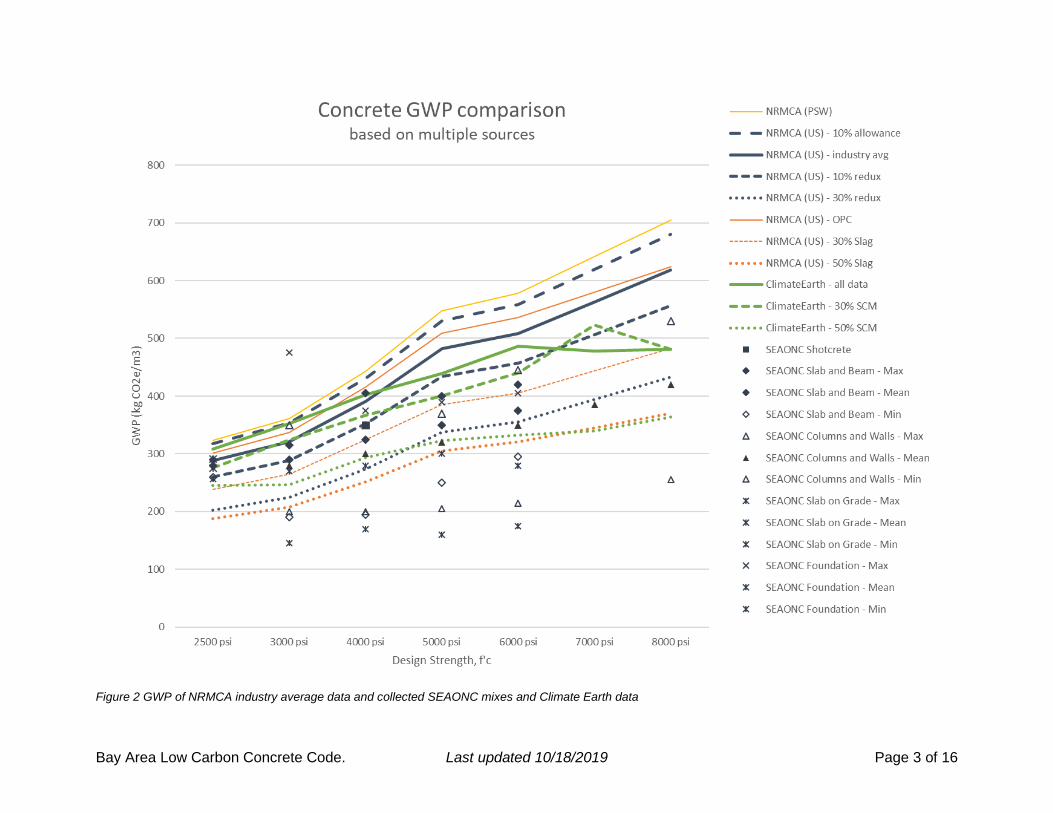
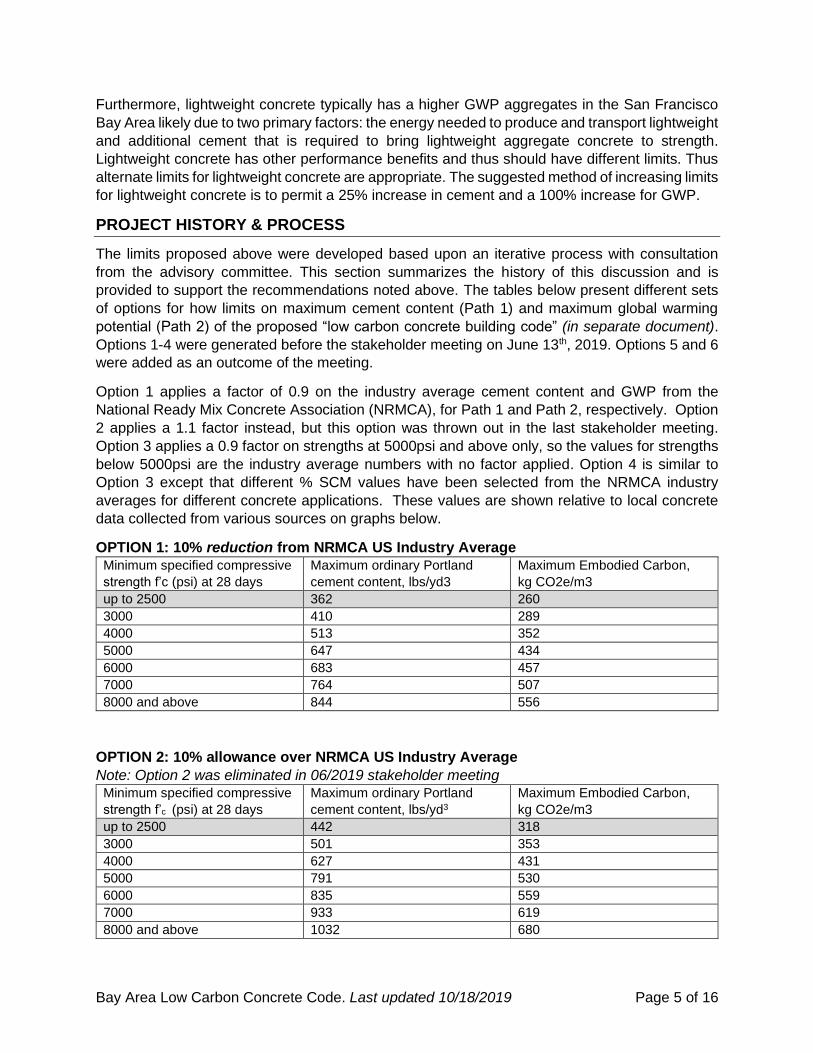
notably the addition of supplementary cementitious materials such as fly ash, from coal plants, or
blast furnace slag, from steel mills, that reduce the amount of cement required). This chart
presents pounds of cement per strength as building industry professionals are used to assessing
these metrics. There is a strong correlation between the amount of cement used and the
embodied carbon footprint (GWP) of concrete. See Figure 2 for the NRMCA data plotted by GWP.
The NRMCA data is created using aggregated information from across a broad region (includes
all of California and other states as well as a range of supplier types etc.). Cement is a primary
ingredient to concrete acting as the binder to lock together sand and rocks into finished concrete.
Increasing cement tends to increase the concrete strength. The amount of cement required to
achieve a specified strength also depends upon the quality and strength of the aggregate (rocks)
and the time the concrete needs to be at the specified strength. The committee assessed that the
aggregate available in Northern California is generally of higher quality than the average in the
PSW which allows for lower cement in the standard mixes in Northern California compared to the
NRMCA PSW regional average.
In order to better understand the composition of concrete mixes in use in the San Francisco Bay
Area, a group of volunteer structural engineers in SEAONC began collecting information about
concrete used in their jobs including the strength, application (e.g. for slabs or columns) and mix
proportions. Over 400 mix designs were collected, primarily for projects within San Francisco. The
min, max, and mean of these are reported in Figure 2.
Bay Area Low Carbon Concrete Code. Last updated 10/18/2019 Page 3 of 16
Figure 2 GWP of NRMCA industry average data and collected SEAONC mixes and Climate Earth data

Bay Area Low Carbon Concrete Code. Last updated 10/18/2019 Page 4 of 16
As noted in Figure 2, the great majority of SEAONC mixes collected fall below the 10% reduction
to the NRMCA benchmark number. For higher strength mixes, the majority fall below the 30%
reduction based on the NRMCA benchmark.
Based upon this analysis and discussions among the committee regarding the typical use of low
strength concretes (smaller jobs with potentially smaller ready mix suppliers and applications such
as sidewalks that can have high early strength requirements for serviceability) as well as noting
the ‘kink’ in the NRMCA data at 5,000 psi concrete, the limits currently proposed in the code draft
are:
• for f'c < 3,000 psi, we use 90% of the NRMCA values;
• for f’c = 4000 psi we use 80% of NRMCA values, and;
• for > 5000 psi we use 70% of NRMCA values.
Figure 3 shows the proposed limits in a bright blue solid line noted as ‘Option 6’.
Figure 3: Limit target in June draft language (Option 6)
Note, that concretes needing early strength – precast, prestressed, beams and slabs above
grade, and retaining walls requiring immediate backfill – have been allowed a 30% increase in
these limits, based on review and deliberation between local suppliers and concrete industry
materials experts within the stakeholder group.
0
100
200
300
400
500
600
700
800
2500 psi 3000 psi 4000 psi 5000 psi 6000 psi 7000 psi 8000 psi
GW
P (
kg C
O2
e/m
3)
Design Strength, f'c
Concrete GWP comparisonwith Options 5 & 6
NRMCA (US) - 10% allowance(Option 2)
NRMCA (US) - industry avg
NRMCA (US) - 10% redux(Option 1)
NRMCA (US) - 30% redux(Option 5)
NRMCA (US) - OPC
NRMCA (US) - 30% Slag
NRMCA (US) - 50% Slag
NRMCA US avg - 10% to 30%redux (Option 6)
Bay Area Low Carbon Concrete Code. Last updated 10/18/2019 Page 5 of 16
Furthermore, lightweight concrete typically has a higher GWP aggregates in the San Francisco
Bay Area likely due to two primary factors: the energy needed to produce and transport lightweight
and additional cement that is required to bring lightweight aggregate concrete to strength.
Lightweight concrete has other performance benefits and thus should have different limits. Thus
alternate limits for lightweight concrete are appropriate. The suggested method of increasing limits
for lightweight concrete is to permit a 25% increase in cement and a 100% increase for GWP.
PROJECT HISTORY & PROCESS
The limits proposed above were developed based upon an iterative process with consultation
from the advisory committee. This section summarizes the history of this discussion and is
provided to support the recommendations noted above. The tables below present different sets
of options for how limits on maximum cement content (Path 1) and maximum global warming
potential (Path 2) of the proposed “low carbon concrete building code” (in separate document).
Options 1-4 were generated before the stakeholder meeting on June 13th, 2019. Options 5 and 6
were added as an outcome of the meeting.
Option 1 applies a factor of 0.9 on the industry average cement content and GWP from the
National Ready Mix Concrete Association (NRMCA), for Path 1 and Path 2, respectively. Option
2 applies a 1.1 factor instead, but this option was thrown out in the last stakeholder meeting.
Option 3 applies a 0.9 factor on strengths at 5000psi and above only, so the values for strengths
below 5000psi are the industry average numbers with no factor applied. Option 4 is similar to
Option 3 except that different % SCM values have been selected from the NRMCA industry
averages for different concrete applications. These values are shown relative to local concrete
data collected from various sources on graphs below.
OPTION 1: 10% reduction from NRMCA US Industry Average
Minimum specified compressive
strength f’c (psi) at 28 days
Maximum ordinary Portland
cement content, lbs/yd3
Maximum Embodied Carbon,
kg CO2e/m3
up to 2500 362 260
3000 410 289
4000 513 352
5000 647 434
6000 683 457
7000 764 507
8000 and above 844 556
OPTION 2: 10% allowance over NRMCA US Industry Average
Note: Option 2 was eliminated in 06/2019 stakeholder meeting
Minimum specified compressive
strength f’c (psi) at 28 days
Maximum ordinary Portland
cement content, lbs/yd3
Maximum Embodied Carbon,
kg CO2e/m3
up to 2500 442 318
3000 501 353
4000 627 431
5000 791 530
6000 835 559
7000 933 619
8000 and above 1032 680

Bay Area Low Carbon Concrete Code. Last updated 10/18/2019 Page 6 of 16
OPTION 3: NRMCA US Industry Average up to 4000psi, then 10% redux for 5000psi and
above
Note: Option 3 was developed to smooth out the kink that occurs at 5000psi
Minimum specified compressive
strength f’c (psi) at 28 days
Maximum ordinary Portland
cement content, lbs/yd3
Maximum Embodied Carbon,
kg CO2e/m3
up to 2500 402 289
3000 455 321
4000 570 392
5000 647 434
6000 683 457
7000 764 507
8000 and above 844 556
Figure 4: Concrete GWP comparison with Option 3

Bay Area Low Carbon Concrete Code. Last updated 10/18/2019 Page 7 of 16
OPTION 4: Categorized by Strengths and Application
Note: Option 4 was deemed too complicated for the purposes of local government permitting and
applicants
Foundation & Shear Walls (subset of Option 4)
Roughly based on NRMCA US Industry Average for 50% SCMs
Minimum specified compressive
strength f’c (psi) at 28 days
Maximum ordinary Portland
cement content, lbs/yd3
Maximum Embodied Carbon,
kg CO2e/m3
up to 2500 282 226
3000 319 250
4000 361 277
5000 404 305
6000 427 321
7000 465 346
8000 and above 503 370
Figure 5: Concrete GWP comparison with Option 4; Foundations and Shear Walls

Bay Area Low Carbon Concrete Code. Last updated 10/18/2019 Page 8 of 16
Columns & Walls (subset of Option 4)
Roughly based on NRMCA US Industry Average for 40% SCMs
Minimum specified compressive
strength f’c (psi) at 28 days
Maximum ordinary Portland
cement content, lbs/yd3
Maximum Embodied Carbon,
kg CO2e/m3
up to 2500 324 252
3000 364 278
4000 413 311
5000 461 343
6000 487 361
7000 530 390
8000 and above 573 418
Figure 6: Concrete GWP comparison with Option 4; Columns and Walls

Bay Area Low Carbon Concrete Code. Last updated 10/18/2019 Page 9 of 16
Suspended Beams & Slabs, Fill In Metal Deck (subset of Option 4)
Roughly based on NRMCA US Industry Average for 30% SCMs
Minimum specified compressive
strength f’c (psi) at 28 days
Maximum ordinary Portland
cement content, lbs/yd3
Maximum Embodied Carbon,
kg CO2e/m3
up to 2500 372 318
3000 420 353
4000 479 392
5000 537 434
6000 568 457
7000 619 507
8000 and above 669 556
Figure 7: Concrete GWP comparison with Option 4; Suspended Beams and Slabs, Fill In Metal Deck

Bay Area Low Carbon Concrete Code. Last updated 10/18/2019 Page 10 of 16
Other (subset of Option 4)
Roughly based on NRMCA US Industry Average
Minimum specified compressive
strength f’c (psi) at 28 days
Maximum ordinary Portland
cement content, lbs/yd3
Maximum Embodied Carbon,
kg CO2e/m3
up to 2500 432 318
3000 487 353
4000 570 392
5000 613 434
6000 649 457
7000 727 507
8000 and above 804 556
Figure 8: Concrete GWP comparison with Option 4; Other
Bay Area Low Carbon Concrete Code. Last updated 10/18/2019 Page 11 of 16
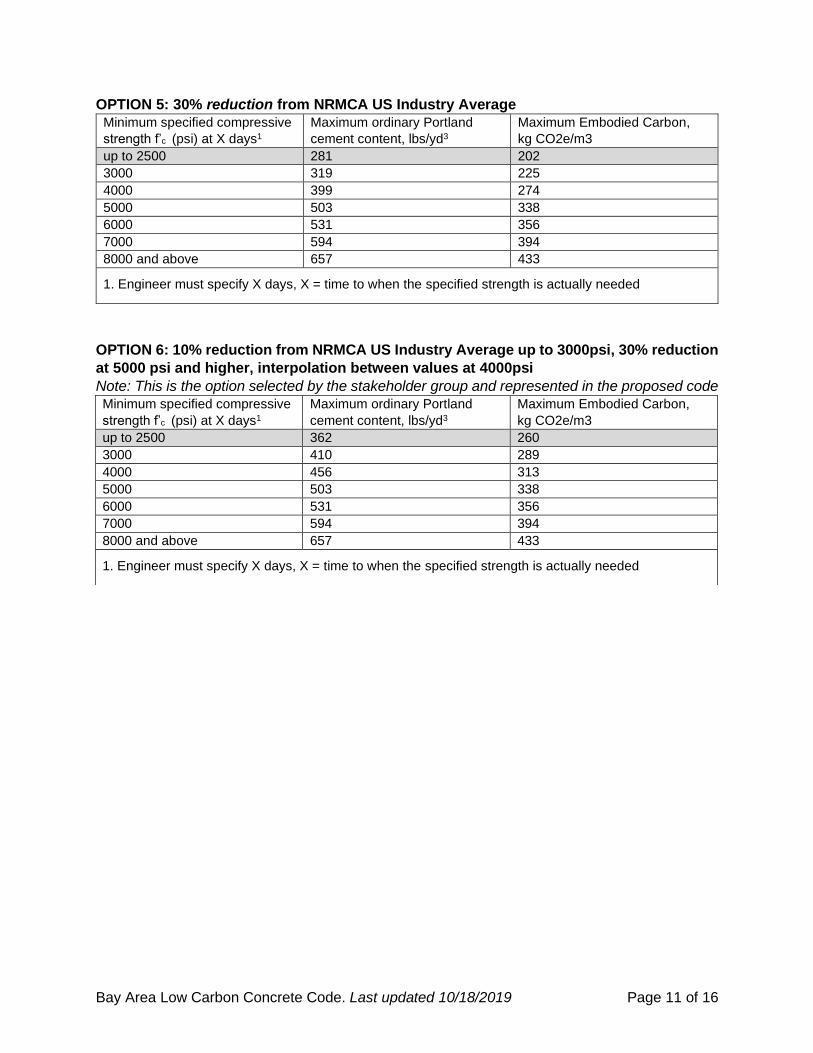
OPTION 5: 30% reduction from NRMCA US Industry Average
Minimum specified compressive
strength f’c (psi) at X days1
Maximum ordinary Portland
cement content, lbs/yd3
Maximum Embodied Carbon,
kg CO2e/m3
up to 2500 281 202
3000 319 225
4000 399 274
5000 503 338
6000 531 356
7000 594 394
8000 and above 657 433
1. Engineer must specify X days, X = time to when the specified strength is actually needed
OPTION 6: 10% reduction from NRMCA US Industry Average up to 3000psi, 30% reduction
at 5000 psi and higher, interpolation between values at 4000psi
Note: This is the option selected by the stakeholder group and represented in the proposed code
Minimum specified compressive
strength f’c (psi) at X days1
Maximum ordinary Portland
cement content, lbs/yd3
Maximum Embodied Carbon,
kg CO2e/m3
up to 2500 362 260
3000 410 289
4000 456 313
5000 503 338
6000 531 356
7000 594 394
8000 and above 657 433
1. Engineer must specify X days, X = time to when the specified strength is actually needed

Bay Area Low Carbon Concrete Code. Last updated 10/18/2019 Page 12 of 16
Figure 9: Concrete GWP comparison with Options 5 & 6
0
100
200
300
400
500
600
700
800
2500 psi 3000 psi 4000 psi 5000 psi 6000 psi 7000 psi 8000 psi
GW
P (
kg C
O2
e/m
3)
Design Strength, f'c
Concrete GWP comparisonwith Options 5 & 6
NRMCA (US) - 10% allowance(Option 2)
NRMCA (US) - industry avg
NRMCA (US) - 10% redux(Option 1)
NRMCA (US) - 30% redux(Option 5)
NRMCA (US) - OPC
NRMCA (US) - 30% Slag
NRMCA (US) - 50% Slag
NRMCA US avg - 10% to 30%redux (Option 6)

Bay Area Low Carbon Concrete Code. Last updated 10/18/2019 Page 13 of 16
LIGHTWEIGHT CONCRETE
Local suppliers explain that a manufactured lightweight aggregate is more energy intensive to
produce, and thus has relatively high embodied carbon. Therefore, lightweight concrete tends to
have higher GWP values. A non-manufactured lightweight (such as pumice) tends to have lower
strength, so higher cement contents are required and thus you still have higher GWP for those
lightweight mixes. Sample mixes provided show the need to start the limits fairly high in
comparison to the NRMCA industry averages for lightweight concrete.
Option 6: 25% increase in cement and 100% increase in GWP compared to NWC under
Option 6
Note: This is the option selected by the stakeholder group and represented in the proposed code.
Minimum specified compressive strength f’c (psi) at X days1
Maximum ordinary Portland cement content, lbs/yd3
Maximum Global Warming Potential, kg CO2e/m3
up to 3000 512 578
4000 571 626
5000 and above 629 675
Data provided locally also shows fairly little increase in cement and GWP as strength increases
from 3000 psi to 5000 psi. This additional option decreases the percentage above industry
average for each incremental increase in strength.
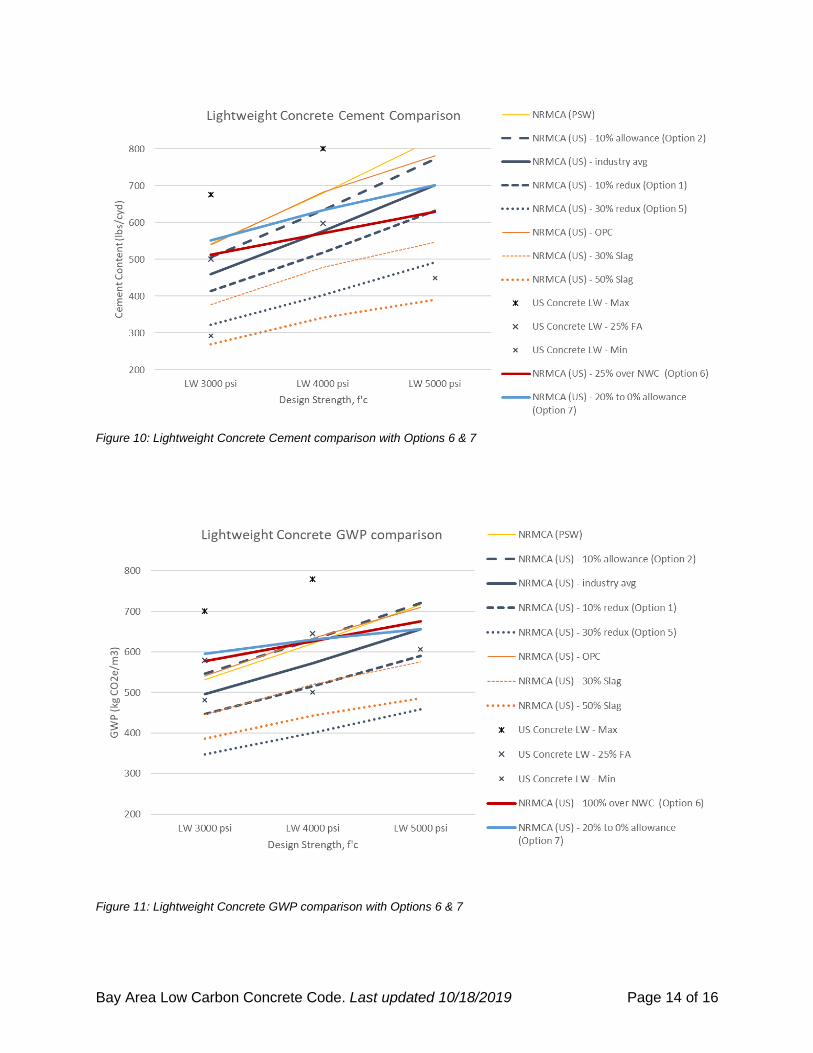
Option 7: 20% above NRMCA LWC US Industry Average up to 3000psi, 10% above for
4000psi, 0% above for 5000psi and greater
Minimum specified compressive strength f’c (psi) at X days1
Maximum ordinary Portland cement content, lbs/yd3
Maximum Global Warming Potential, kg CO2e/m3
up to 3000 552 595
4000 633 630
5000 and above 702 656
Bay Area Low Carbon Concrete Code. Last updated 10/18/2019 Page 14 of 16
Figure 10: Lightweight Concrete Cement comparison with Options 6 & 7
Figure 11: Lightweight Concrete GWP comparison with Options 6 & 7

Bay Area Low Carbon Concrete Code. Last updated 10/18/2019 Page 15 of 16
EXPANDED DATA
Just before the last in-person stakeholder meeting on July 17, 2019, SEAONC provided the
project team a new set of mix data from their second round of concrete mix collection by volunteer
committee members and their colleagues. This set includes over 220 mixes from within the Bay
Area and statistical analysis results are presented with the proposed limit line from Option 6, as
well as the NRMCA Industry Average line, below. This additional data further supports that the
proposed limits are both feasible and aggressive in averting excessive use of cement.
Figure 12: Bay Area Low Carbon Concrete Limit vs. NRMCA US Avg., Cement vs. f’c
Figure 13: Bay Area Low Carbon Concrete Limit vs. NRMCA US Avg., GWP vs. f’c

Bay Area Low Carbon Concrete Code. Last updated 10/18/2019 Page 16 of 16
Two additional charts below show the difference in data when the mixes are parsed into those
with and without cement replacement, compared to the GWP limit line. The first of the two charts
shows that mixes with cement replacement are numerous and can meet the limits easily, while
the mixes without cement replacement comprise a smaller subset of the data and would have
difficulty meeting the limits. Comparing these charts shows how introducing GWP limits will
promote use of cement replacement and prevent continued use of mixes with excessive amounts
of cement.
Figure 14: Bay Area Low Carbon Concrete Limit vs. NRMCA US Avg., GWP vs. f’c WITH Cement Replacement
Figure 15: Bay Area Low Carbon Concrete Limit vs. NRMCA US Avg., GWP vs. f’c WITHOUT Cement Replacement