study of government interventions for … publications/fpb/z… · final report january 2014 ......
TRANSCRIPT

STUDY OF GOVERNMENT INTERVENTIONS FOR EMPLOYMENT GENERATION
IN THE PRIVATE SECTOR
Marife M Ballesteros and Danilo C Israel
Final Report January 2014
Philippine Institute for Development Studies Department of Budget and Management
Table of Contents
Executive Summary ............................................................................................................................. i I. Introduction ................................................................................................................................ 1
II. Conceptual Framework: Growth, Employment and Relevance of ALMPs ........................ 2
A. Economic Growth and Employment Nexus ..................................................................... 2
B. Impact of ALMPs: Review of International Experience .................................................. 3
III. Trends in Growth and Employment in the Philippines .......................................................... 6
A. Macroeconomic Trends .................................................................................................... 6
B. Regional Trends ............................................................................................................... 8
IV. Employment Generated from ALMPs of Government Agencies .......................................... 9
A. Type of Policy Interventions ............................................................................................ 9
B. Government Priority ALMPs: The Community-Based Employment Program (CBEP) 10
1. Department of Trade and Industry (DTI) ................................................................... 11
2. Department of Agrarian Reform (DAR) .................................................................... 11
3. Department of Social Welfare and Development (DSWD) ....................................... 11
4. Department of Tourism (DOT)................................................................................... 12
5. Department of Labor and Employment (DOLE) ........................................................ 12
6. Department of Agriculture (DA) ................................................................................ 13
7. Department of Public Works and Highways (DPWH) ............................................... 13
8. Department of Transportation and Communication (DOTC) .................................... 14
V. Assessment of Selected Employment Generation Programs ................................................ 15
A. One Town, One Product (OTOP) Program, DTI ........................................................... 15
1. Macrolevel Assessment of Performance .................................................................... 15
2. Review of OTOP Performance Evaluation ................................................................ 16
B. Sustainable Livelihood Program (SLP), DSWD ............................................................ 17
C. Comprehensive Livelihood and Emergency Employment Program (CLEEP), ............. 19
D. High Value Crops Development Program (HVDCP), DA ............................................ 20
E. Accelerated Hunger Mitigation Program (AHMP), DPWH .......................................... 20
VI. Conclusions and Recommendations ....................................................................................... 21
References .......................................................................................................................................... 89
Appendices ......................................................................................................................................... 93

List of Tables Table 1. Policy and Institutional Barriers to Industry Upgrading ................................................. 23 Table 2. Relevant Instruments, Target Groups and Intended Effects of ALMP's ........................ 23
Table 3. Overview of Impact Evaluation on Active Labor Programs .......................................... 25 Table 4. Effectiveness of ALMP's ................................................................................................ 26
Table 5. Employed Persons by Major Industry group, Philippines .............................................. 32 Table 6. Labor Productivity by Major Industry Group, Philippines ............................................. 33 Table 7. Share of Establishments to Total and Growth Rate, by Size Category and Industry ..... 34
Table 8. Share of Employees to Total and Growth Rate, by Size Category and Industry ............ 37
Table 9. GDP by Expenditure Share in Constant 2000 Prices, 2001-2012 .................................. 40
Table 10. Gross Regional Domestic Product Growth Rate, 2000-2012 ....................................... 41
Table 11. Labor Productivity, by Region, 2000-2011 .................................................................. 42 Table 12. Unemployment Rate, by Region, 2000-2012 ............................................................... 43 Table 13. Underemployment Rate, by Region, 2000-2012 .......................................................... 44 Table 14. Share of Establishments to Total and Growth Rate, by Size Category and Region ..... 45
Table 15. Share of Employees to Total and Growth Rate, by Size Category and Region ........... 48
Table 16. ALMPs by Program Intervention and by Department .................................................. 51 Table 17. Methodology for determining jobs generated, Selected Departments .......................... 55
Table 18. Jobs generated by Programs Enrolled in CBEP by Department, 2012 ......................... 59
Table 19. Recipients of Community-Based Tourism Assistance (GREET), DOT....................... 64
Table 20. Investments Generated under OTOP Programs ............................................................ 65 Table 21. Number of MSMEs Assisted by OTOP ........................................................................ 66 Table 22. Average Investment per MSME Assisted ..................................................................... 67 Table 23. New Jobs Created under OTOP Program ..................................................................... 68 Table 24. Domestic Sales under OTOP Program ......................................................................... 69 Table 25. Domestic Sales per MSME Assisted under OTOP Program ........................................ 70
Table 26. OTOP Program Correlation Results ............................................................................. 71 Table 27. Number of MSMEs Developed and Assisted, 2007-2009 ............................................ 72
Table 28. Representation of OTOP Beneficiaries......................................................................... 73 Table 29. Number of new jobs generated and direct jobs sustained, 2006-2009 ......................... 74
Table 30. Main Findings: Study on the Socio-Economic Impact Assessment of DTI’s ONE TOWN, ONE PRODUCT Program .............................................................................................. 75 Table 31. Constraints and Challenges: Study on the Socio-Economic Impact Assessment of DTI’s ONE TOWN, ONE PRODUCT Program .......................................................................... 76 Table 32. Result of Evaluation: Rapid Assessment of SEA-K ..................................................... 77 Table 33. Sustainable Livelihood Program-Track 1: Microenterprise Development (January 2011-June 2013)............................................................................................................................ 78
Table 34. Repayment Status of DSWD Funded Pantawid Households (January 2011-June 2013)....................................................................................................................................................... 79
Table 35. Sustainable Livelihood Program-Track 2: Employment Facilitation (January 2011-June 2013) ............................................................................................................................................. 80
Table 36. Assistance to Workers during the Global Financial Crisis Under the Comprehensive Livelihood and Emergency Employment Program (CLEEP), 2009 ............................................. 81

Table 37. Emergency Employment for Displaced Workers and their Dependents Under the Comprehensive Livelihood and Emergency Employment Program (CLEEP), as of December 31, 2009............................................................................................................................................... 82
Table 38. Physical Accomplishment, Financial Utilization, and Amount Utilized per Person of Emergency Employment for Displaced Workers and their Dependents Under the Comprehensive Livelihood and Emergency Employment Program (CLEEP), as of December 31, 2009 ............. 85
Table 39. Number of Jobs Generated, High Value Crops Development Program of the DA, 2008-2012............................................................................................................................................... 87
Table 40. Status of the Accelerated Hunger Mitigation Program (AHMP) Projects Implemented by the DENR, 2005-2009 ............................................................................................................. 88
List of Figures Figure 1. GDP Growth, Employment Growth and Labor Productivity Growth, Philippines 2000-2012............................................................................................................................................... 31
Figure 2. Philippine Unemployment and Underemployment, 2000-2012 .................................... 31
List of Appendices Appendix 1. Department of Trade and Industry: Employment Generating Programs ................. 93
Appendix 2. Department of Social Welfare and Development: Employment Generating Programs ....................................................................................................................................... 98
Appendix 3. Department of Agrarian Reform: Employment Generating Programs .................. 102
Appendix 4. Department of Labor and Employment: Employment Generating Programs ........ 105
Appendix 5. Employment-Generating Programs and Projects of the Department of Agriculture (DA) of the Philippines, by Year, 2001-2011 ............................................................................. 111 Appendix 6. Employment-Generating Programs and Projects of the Department of Public Works and Highways (DPWH) of the Philippines, by Year, 2001-2011 ............................................... 113 Appendix 7. Employment-Generating Programs and Projects of the Department of Transportation and Communication (DOTC) of the Philippines, by Year, 2001-2011.............. 115
Appendix 8. Status on the collection of data on completed government projects which are related to employment generation........................................................................................................... 116

List of Acronyms
ADB Asian Development Bank AFMA Agricultural Fisheries Modernization Act AHMP Accelerated Hunger Mitigation Program ALMP Active Labor Market Program ARCP Agrarian Reform Communities Project ARISP Agrarian Reform Infrastructure Project BWSC Bureau of Workers and Special Concerns CBEP Community-Based Employment Program CFW Cash for Work CLEEP Comprehensive Livelihood and Emergency Employment Program DA Department of Agriculture DAR Department of Agrarian Reform DENR Department of Environment and Natural Resources DILP DOLE Integrated Livelihood Program DOJ Department of Justice DOLE Department of Labor and Employment DOT Department of Tourism DOTC Department of Transportation and Communication DPWH Department of Public Ways and Highways DSWD Department of Social Welfare and Development DTI Department of Trade and Industry FDA Food and Drug Administration GIP Government Internship Program GDP Gross Domestic Product GREET Grassroots Entrepreneurship for Eco Tourism GVA Gross Value Added HVDCP High Value Crops Development Program ILO International Labour Organization KALAHI- CIDSS Kapit-Bisig Laban sa Kahirapan Comprehensive and Integrated
Delivery of Social Services LGU Local Government Unit MFI Microfinance Institution MIAA Manila International Airport Authority MSME Micro, Small and Medium Enterprises NEDA National Economic and Development Authority NGO Non-Government Organization OPS Office of the Press Secretary OTOP One Town, One Product OYSTER Out-of-School Youth toward Economic Recovery PIDWW Pamilacan Island Dolphin and Whale Watching PPP Public-Private Partnership

RUMEPP Rural Micro Enterprise Promotion Program SEA-K Self-Employment Assistance Kaunlaran SBGFC Small Business Guarantee and Finance Corporation SLP Sustainable Livelihood Program SPES Special Program for Employment of Students TP-KP Tulay sa Pangulo sa Kaunlarang Pang Agraryo

i
Study of Government Interventions for Employment Generation in the Private Sector
Executive Summary
This study reviews the relationship between economic growth and employment and the role of government interventions/programs on employment generation. There are several such programs undertaken by government most of which are classified as active labor market programs (ALMPs), which are programs intended to improved employability of targeted sectors. There are only a few programs intended to promote private investments for employment creation. Thus, the review focuses on the ALMPs with limited discussion on employment generation for investments promotion. In particular, employment programs of the following agencies are reviewed- (1) Department of Trade and Industry (DTI); (2) Department of Labor and Employment (DOLE); (3) Department of Agrarian Reform (DAR); (4) Department of Social Welfare and Development (DSWD); (5) Department of Transportation and Communication (DOTC); (6) Department of Public Ways and Highways (DPWH); and (8) Department of Tourism (DoT).
Economic growth in the Philippines has not been accompanied by significant
improvements in employment. While the country displayed strong economic growth in the past three years, employment growth remained sluggish at 1.1%. Underemployment and unemployment rate remained high at 19% and 6.8% respectively. Moreover, about one-third of total workers are employed in microenterprises, which are predominantly into self-help informal economy with no paid employees or unpaid family labor.
Several studies attributed the slow growth in employment to the lack of broad base
development and to the low level of private investments in the country. Economic growth is concentrated in the services sectors while the agriculture and manufacturing industries, which are the sources of jobs for the unskilled and semi-skilled labor, are lagging. Gross capital investment averages at only 19% of GDP in the last decade while domestic and government consumption accounts for an average of more than 80% of GDP. .
To support employment generation or alleviate unemployment, the government
implements programs, commonly referred to as Active Labor Market Programs or ALMPs. ALMPs are “purposive, selective, interventions by the government that indirectly or directly act to provide work to, or increase the employability of people with certain disadvantages in the labor market” (ILO). ALMPs are generally targeted to disadvantaged households and include interventions such as direct employment, wage subsidy, livelihood or self-employment, employment services and human resource development.
In particular, the national government’s priority ALMPs from 2010 to present, are clustered under the Community-Based Employment Program (CBEP), which aims to provide employment to skilled, semi-skilled, and low-skilled workers in the community through the infrastructure and non-infrastructure projects of national government agencies (NGAs), local government units (LGUs), government-owned and controlled corporations (GOCCs),

ii
government financial institutions (GFIs), and public-private partnerships (PPPs) in the national, regional, provincial, city, and municipal levels. The CBEP National Steering Committee is chaired by DOLE with NEDA as Co-Chair. As such, the DOLE is tasked to lead the monitoring and reporting of jobs generated from the enrolled programs and projects of government agencies and other instrumentalities.
• The DOLE enrolled under CBEP two (2) programs which are being managed by the
Bureau of Workers with Special Concerns (BWSC), namely, Special Program for Employment of Students (SPES) and the DOLE Integrated Livelihood Program (DILP). In 2012, SPES benefited 138,381 students or 97.86 percent accomplishment utilizing a total budget of P341 million. Meanwhile, the DILP benefitted 84,207 for a 145.18 percent accomplishment rate and utilized P291.079 million which translates to a per capita cost of P3, 493.00.
• DTI implements the Rural Micro Enterprise Promotion Program (or RUMEPP) which is a livelihood, self/employment program targeted to microentrepreneurs. Total accomplishment of RUMEPP in terms of jobs generated is 15,831 or 152% of its target (10,400) in 2012. This was achieved with 75% utilization of funds. The employment was generated at an estimated cost of about P 8,732 per job based on obligated funds (PhP 138.23 million) for the project.
• DAR has three main programs in CBEP which provides both infrastructure and non-infrastructure jobs. The programs are: (1) the Agrarian Reform Infrastructure Project (or ARISP III); (2) Agrarian Reform Communities Project (ARCP II); and (3) Tulay sa Pangulo sa Kaunlarang Pang Agraryo (TP-KP). These programs include both public works and microenterprise development. Overall employment accomplishment based on 2012 targets is 48% for infrastructure related jobs and 72% for microenterprise development (non-infrastructure). The low accomplishment corresponds to low utilization of funds.
• DSWD includes all current programs under CBEP. These programs are: (1) Sustainable
Livelihood Program (/SLP); (2) Kapit-Bisig Laban sa Kahirapan Comprehensive and Integrated Delivery of Social Services (KALAHI-CIDSS); (3) Cash for Work (CFW) Programs and (d) Government Internship Program. Except for the KALAH-CIDSS, which is an infrastructure program, all other programs are non-infrastructure programs involving employment services and livelihood programs. KALAHI-CIDSS reports 100% employment accomplishment and utilization of funds. On the other hand, overall employment accomplishment of the non-infrastructure projects is at about 75% of 2012 targets. On a per program basis CFW and GIP accomplished above 100% of target employment while SLP shows an accomplishment rate of only 42%despite more than 100% utilization of funds..
• The SLP, which is an offshoot of the SEA-K (Self-Employment Assistance Kaunlaran Program), is targeted to poor households specifically beneficiaries of the DSWD Pantawid Pamilyang Pilipino Program, which represents 84% of SLP beneficiaries. It is implemented through a two-track program: (1) the Micro-Enterprise Development Track,

iii
and (2) the Employment Facilitation Track. Further assessment of the program shows that the program is exhibiting promising results. Under the Microenterprise Development Track, DSWD reveals movement of some microenterprises from government (NGA/LGU) capital seed fund users to self–finance and borrowers of MFIs within less than three years of program implementation. From January 2011 to June 2013, a total of 215,699 households benefited from the Microenterprise Development program of which 32,817 (or 15%) were supported by MFIs. For households supported by DSWD credit funds, overall repayment performance is good at 82.93%. However, the sustainability of the microenterprise developed is a continuing challenge for DSWD. Monitoring and partnership is important to help microenterprises that were developed and assisted to attain viability in the long-term. On the other hand, the Employment Facilitation Track Program reflects the job placement activity of DSWD in partnership with national government agencies, NGOs and other private sectors. From January 2011 to June 2013, the program employed a total of 5,702 persons. The bulk (or 86%) has been employed in DPWH infrastructure projects. A key challenge for the program is how to move employment to the private sector, to enhance their skills or upgrade them to microenterprise development to ensure long-term effects.
• DOT like DPWH also provides employment through public works and maintenance services. These programs are undertaken by the DOT main office and attached agencies such as the Tourism Infrastructure and Enterprise Zone Authority (TIEZA) and the National Parks and Development Committee (NPDC). Overall, these agencies provided 3,976 jobs which correspond to an accomplishment rate of 100%. With regards to facilitating employment in the private sector, the DOT focuses on the development of community-based eco-tourism in potential tourist sites. A case in point is the Pamilacan Island Dolphin and Whale Watching (PIDWW) Project. The PIDWW organization is now the largest revenue contributor in the LGU. With the success of this primary industry, secondary and support businesses are being set-up, which are expected to generate more jobs and incomes for the entire community.
• DA’s employment-generating programs and projects include those related to the
Agricultural Fisheries Modernization Act (AFMA), credit programs of the Land Bank of the Philippines and the Medium Term Philippine Development Plan. DA also had the Office of the One Million Jobs program during the Arroyo administration which is now terminated. In particular, DA CBEP projects provided or facilitated through public works and livelihood programs. In totality, the DA employed 292,116 persons for an accomplishment rate of 74.63% and utilized P7.7 billion of its allocation for a utilization rate of 48.20 %. DPWH mainly provided employment through public works. Among its programs are: the President’s Roadside Maintenance Program (Kalsada Natin, Alagaan Natin), Job Creation KNAN on Roadside Maintenance, and the Out-of-School Youth toward Economic Recovery (OYSTER) Program which are all aimed at gainfully employing specific disadvantaged sectors. All these programs are currently implemented. The

iv
DPWH has yet to fully utilize its budget. Based on employment targets, accomplishment rate is at 63.05 percent in 2011 and only 29% in 2012.
• The DOTC has implemented both infrastructure and non-infrastructure projects which provided a total of 20,963 and 2,968 jobs, respectively. This shows an accomplishment rate of 78% for infrastructure projects and 66% for non-infrastructure projects. Among the agencies under the DOTC, the Cebu Port Authority provided the most employment (about 17,000) for infrastructure program. For non-infrastructure programs, the Philippine national railways (PNR) contributed the most to direct employment, providing jobs to 1,889 individuals for janitorial services and similar jobs.
A similar program to CBEP is the Comprehensive Livelihood and Emergency Employment
Program (CLEEP) which was implemented in 2009 to protect the most vulnerable sectors from threats and consequences of reduced or lost income as a result of the global economic crisis, through the provision of emergency employment and implementation of livelihood projects. The assistance to workers during the global financial crisis under CLEEP benefited a total of 28,890 workers in 2009. About 94% of the programs total MOOE of P1.35 billion was utilized. The total target number of workers to be hired was 48,532 persons while the actual number of workers hired was 32,410 persons for an accomplishment rate of 66.78 percent.
Among programs enrolled under CLEEP, DOT and DOLE exceeded their targets while DOJ
and DENR had the weakest performance. In terms of financial utilization, PMS, OPS, and DTI had the highest performance exceeding more than 100 percent while NEDA and DOJ had the lowest performance registering less than 1 percent. In terms of amount utilized per person, DOJ and DA had the best performance spending lower than P3,000 per person while OPS and PMS had the weakest achievement spending at least P150,000 per person.
In addition to ALMPs and CBEP programs, government also implements programs intended to promote private sector investments to generate employment. Most of these programs are undertaken by DTI. One major program is the One Town, One Product (OTOP) Program. Unlike RUMEPP, OTOP is not ALMP or covered by CBEP. It is a program intended to support local economic development through development of MSMEs. While the policy interventions include training and livelihood assistance, the intent is primarily investment promotion. The performance of the OTOP in terms of investment generated and assisted MSMEs have been positive. For the period 2007 to 2012, the OTOP program generated total investments of P11.6 Billion or an average investment of about P 2.0 Billion annually. The program assisted over 50,000 MSME or about 8,500 MSME annually. Average investment per MSME is about P226,328. Regions IX and XII, registered the highest investment per MSME of about P2.0 Million. However, the number of jobs generated in these regions is not impressive. Regions VII which registered only an annual investment of P 74.75 Million and the lowest investment per MSME of P57,526 was able to generate annually 7,456 jobs compared to 5,811 jobs for Regions IX and 2,290 jobs for Regions XII. Regions IX though generated the highest annual domestic sales and domestic sale per MSME.
Based on the data, there is a positive and significant correlation between investments and
job generation and between number of MSMEs and job generation. On the other hand, there is

v
negative and weak correlation between average investments per MSME to job generation. Although the relationship is not significant, the evidence suggests that assisting bigger firms does not necessarily lead to higher employment. However, it is possible that bigger firms are more stable and provide sustained employment compared to micro and small firms.
A rapid assessment on the program undertaken in 2010 revealed that OTOP resulted in a
90% increase in income of the MSMEs beneficiaries which translated into an upgraded quality of life and upgraded business activities. However, the program has weak employment effects with only 6% of the MSMEs assisted citing that the OTOP resulted in additional employment and 25% citing possible positive effects on community employment. It has been observed that the growth of SMEs has been constrained by (1) the lack of access to additional capital; (2) Unavailability /inaccessibility of raw materials and (3) difficulty to comply with FDA requirements to penetrate larger markets. These constraints are consistent with the macro studies on the reasons for the low private investments in the country. Moreover, OTOP has not necessarily led to local economic development due to the following: (1) lack of support from some LGUs on the OTOP program; and (2) lack of innovative or more comprehensive marketing strategy provided under OTOP (i.e. some products may require strategies that are not yet tried and tested”).
Compared to programs for investment promotion, the CBEP programs are primarily stop-gap measures to address unemployment and adverse effects of economic crisis on employment. Overall, the employment performance of ALMPs of government agencies appears transitory and short-term. Although some programs exceeded the employment targets, it is not clear how these numbers are translated at the macro level. The programs are apparently intended to address other social issues such as poverty reduction, social/human development or community development. It is therefore possible that most programs are desirable for the social objectives rather than for providing net employment impact. These inferences however need to be validated through in-depth impact analysis of specific programs, which has not been possible under this study.
However, impact studies on ALMPs based on international experience, suggests similar
conclusions. Among the key findings of the studies are: (1) Public works may temporarily increase employment but may also increase unemployment
by providing incentives to discouraged workers to reenter the labor market; (2) In‐work benefits (e.g. wage subsidy) and public works are very cost‐inefficient in terms
of raising employment, but might be cost‐efficient in reducing poverty and inequity; (3) Most authors point out the usefulness of the self-employment (livelihood) programs but
its applicability or impact is only up to 3 percent of the unemployed workforce. There are also significant failure rate of small businesses suggesting high cost with minimal or temporary employment effect. Moreover, studies show that the impact is more positive for male, better educated workers with particular interest in entrepreneurial activities.
(4) Human capital enhancement are widely used and generally represent the largest share in
governments’ expenditure. Training programs generally had positive impacts on raising

vi
employability but these programs can be costly and have the effect of selecting unemployed workers with higher employability leaving out disadvantage workers. Among training programs, a more cost effective measure is on-the-job training targeted at long-term unemployed workers.
With regards to government interventions for investment promotions such as OTOP, the employment impact appears minimal. The effects specifically for microenterprises seems similar to livelihood, self-employment programs of government whereby beneficiaries experience positive results on incomes but effects tend to be short-term.
There is clearly a need to define the intent of employment programs. Most government
agencies are implementing ALMPS which clearly are intended to the vulnerable/marginalized population or in emergency situations. The other focus should be on programs or policies that will promote private investments to generate employment. The policies need to address the constraints identified in several studies and to undertake programs linked to the overall industrial policy of government.
There is also a need for the Departments to improve monitoring and evaluation system for the programs to facilitate impact analysis. Within Departments there is no standard monitoring system since different programs are managed by separate divisions or Bureaus. Thus, data are generated as the need arise. The absence of a central evaluation monitoring and evaluation office in each Department has created difficulty in identifying and integrating information and data.
Moreover, there is also a need to create convergence and agreements among key
Departments with regards to the methodology and definitions in identification and counting of jobs. The DOLE, as the lead employment agency, can take the initiative starting with programs listed under the CBEP.

1
Study of Government Interventions for Employment Generation in the Private Sector
M.M. Ballesteros and D.C. Israel1
I. Introduction
This study reviews the relationship between economic growth and employment and the role of government interventions such as active labor market programs (ALMPs) in generating employment. The government also implements other employment programs intended to promote private investments for employment but information on these programs are limited and the bulk of programs under the agencies of government, with the exception of the Department of Trade and Industry and the Department of Tourism, implement ALMPs.
Active labor market programs (ALMPs) have been adopted in many countries in response
to conditions that caused or may result in rising unemployment, reduction in wages and increase in poverty. These programs, which are advocated by the Overseas Economic Council for Development (OECD), have gained support especially in developing and transition economies.
ALMPs include policy interventions in both the demand and supply side of the labor
market. Demand side instruments are intended to assist firms or enterprises to increase jobs through direct employment programs or by providing incentives for creating or retaining employment (e.g. wage subsidy, financing support, marketing support, etc.). On the other hand, supply side interventions are directed to those in the labor force such as programs intended for human capital enhancement, labor market matching and in-work benefits such as tax credits and public works.
In the Philippines, ALMPs are mostly targeted to poor/ marginalized or vulnerable
households or communities. In particular, the programs include direct employment through public works, livelihood or self-employment development, employment facilitation/services and human resource development.
There are several national agencies implementing ALMPs with each agency targeting specific sectors. For purpose of this study, we reviewed the implementation of ALMPs of the following national agencies: (1) Department of Trade and Industry (DTI); (2) Department of Labor and Employment (DOLE); (3) Department of Agrarian Reform (DAR); (4) Department of Social Welfare and Development (DSWD); (5) Department of Transportation and Communication (DOTC); (6) Department of Public Ways and Highways (DPWH); (7) Department of Agriculture (DA) and (8) Department of Tourism (DoT). Given time
1 Senior Research Fellows, PIDS. Assessment of employment-generating programs of DA,DOLE, DPWH and DOTC is undertaken by Dr. Israel while the remaining agencies ( DTI, DAR, DSWD and DoT) is assessed by Dr. Ballesteros. Research assistance is provided by Jasmine Egana and Diyina Gem Arbo.

2
constraints and the unavailability of data to undertake impact assessment, the study focuses on employment accomplishment, and the program relevance.
The paper is organized as follows: The next section provides the conceptual framework
on the relationship between growth and employment and the relevance of labor market programs of government in employment. Section III presents the trends in Philippines economic growth and associated effects on employment at the national and regional levels. Section IV provides a review of ALMPs in different government agencies, the program interventions implemented and the jobs generated from these interventions. Section V provides performance evaluation for selected programs of specific Departments. The programs were selected based on available data and information. The last section concludes the study.
II. Conceptual Framework: Growth, Employment and Relevance of ALMPs
A. Economic Growth and Employment Nexus
It is widely acknowledged that economic growth leads to job creation. Growth brings
about higher demand for output leading to increase investments that generate employment and create opportunities for human capital. However, the relationship between economic growth and employment growth is not the same across countries or over time. Some types of economic growth may lead to faster job creation than others and in some cases, a “job-less” growth is possible. In transition and developing countries which are undergoing economic transformation and reforms, the initial sources of economic growth may be high rates of labour productivity growth, which may lead to job losses in the short to medium term. As labour productivity gains are sustained, employment growth is expected to pick up in the long run.2
Empirical studies show that the relationship between growth and employment is affected
by the following factors: (1) the sectoral pattern of growth; (2) policy and institutional environment; (3) development of SMEs. Economic growth which are biased towards labour-intensive sectors such as smallholder agriculture and small and medium enterprises in the manufacturing and services sectors are more likely to lead to faster employment growth than growth patterns that are biased towards capital-intensive (such as pharmaceuticals) and resource-intensive sectors (such as mining).
On the other hand, policy and institutional constraints create barriers to investment and
employment growth. A recent ADB study identified the key institutional barriers to investments in the Philippines which are: (1) the low return to economic activity; and (2) high cost of finance (Table 1). Low returns to investment is affected by bad infrastructure,
2 Islam, R (2004); Loayza and Raddatz 2006; Satchi and Temple 2006.

3
the large pool of unskilled workers and the high cost of doing business resulting from both micro risks (e.g. corruption, unclear property rights, etc.) and macro risks (e.g. financial, monetary and fiscal instability).
The growth of micro, small and medium enterprises (or MSMEs) is critical specifically in
developing countries since more than 90% of firms are microenterprises. Historical experiences in many nations also showed that SMEs have provided the bulk of entrepreneurs and employment and the necessary foundations for sustained economic growth and rising incomes (ADB 1990). Given SMEs’ lower capital requirement, they are expected to stimulate growth of numerous indigenous enterprises with wide regional dispersal.
On the other hand, recent literature noted that while the development of MSMEs are
critical, success rate is usually low, that is, there are many MSMEs that tend to fail (Page and Soderboom 2012). Thus, if the objective is to create more “good” jobs, interventions should consider the constraints in growth of firms of all sizes. Microenterprises should not be confused with the self-help informal economy, with no paid employees and unpaid family labor (e.g. ambulant vendors, pedicabs drivers). These informal enterprises are not the types of employment that have to grow. Labor market programs of government should in fact moved these workers to the formal labor market and to ensure their employability in the long run.
B. Impact of ALMPs: Review of International Experience
Active Labor Market Programs or ALMPs are government funded programs intended to directly and indirectly contribute to the generation of employment in the country. The International Labor organization or ILO defines ALMPs as “purposive, selective interventions by the government in the pursuit of efficiency and/or equity objectives, acting indirectly or directly to provide work to, or increase the employability of people with certain disadvantages in the labour market.” The relevant instruments, target groups, and intended effects of ALMPs are summarized in Table 2.
The effectiveness of these programs however differs. There are various ALMPs that
were implemented in Asia, the OECD and other countries. The choice of program depends on various factors such as the economic situation the country is in, the objective(s) for which the program is intended to address, the financial resources and the institutional capacity available for implementation of the programs.
There have been several evaluations made on ALMPs. Abrahart et al. (2000) reviewed
the evidence of more than 100 evaluations of ALMPs covering OECD countries - mainly the U.S., Canada, U.K., Sweden and Germany – and some developing and transition economies such as Hungary, Poland, the Czech Republic, Turkey and Mexico. Brown and Kottl (2012) provided a similar review focusing on the how, why, when and to what extent specific policies are effective. In both reviews, the evaluation studies showed mixed results depending on the intervention, the period in which the intervention was given, and whether evaluation was conducted in the short-run or long-run (see Tables 3 and 4).

4
The key findings based on these summaries are as follows:
• ALMPs for retaining employment such as subsidies to employers (wage subsidy) may reduce unemployment but is susceptible to extremely high deadweight and substitution effects. The program also targets the “insiders”, strengthening their position relative to “outsiders” thus does not really have the effect of generating jobs. Such programs should be used only for very short periods and in severe recessions. The more cost‐effective and desirable programs are those creating employment which redistributes incentives to outsiders in the labor market.
• ALMPs providing incentives for employment creation such as financial and
advisory support for self-employment (e.g. livelihood programs) is a smaller program used in several countries. Besides the direct objective of supporting the outflow of unemployment into self-employment, the indirect objective is that the start-ups create further employment. The results of evaluation in several countries are mixed. Most authors point out the usefulness of the instrument but its restricted applicability to a small fraction of the unemployed workforce of up to 3 percent. There are also significant failure rate of small businesses suggesting high cost with minimal or temporary employment effect. Moreover, studies show that the impact is more positive for male, better educated workers with particular interest in entrepreneurial activities. Self-employment subsidies are also especially effective for the disadvantaged workers, namely the young, low-skilled, long-term unemployed and inactive workers. It can significantly lead to higher incomes and employability for participants.
• ALMPs intended to provide incentives for seeking and keeping a job includes
program such as in-work benefits, tax credits and other work pay schemes paid to low-wage workers or low-income families to raise their incomes conditional on working (e.g. public works). These measures are conditional on employment and generate incentives for specific disadvantage labor market actors. The direct effect on employment of these measures lies on raising labor supply and labor force participation, increasing transition into employment, activating discouraged workers, and improving income and future employment prospects. Countries such as the USA and the UK and other European countries are especially increasing this type of program. It is considered more acceptable instrument compared to tax or benefit reductions. However, this program may create disincentives for unskilled workers to move to a better job or enhance their human capital. It can effectively decrease wage differentials between low-wage work and high-skilled work which will have negative long-run effects. Public works, for instance, may temporarily increase employment but may also increase unemployment by providing incentives to discouraged workers to reenter the labor market. Based on the studies, in‐work benefits and public works are very cost‐inefficient in terms of raising employment, but might be cost‐efficient in reducing poverty and inequity.

5
• ALMPs providing incentives for human capital enhancement are widely used and generally represent the largest share in governments’ expenditure. A wide array of training and retraining measures are adopted from basic job skills to vocational skills and from targeting disadvantage workers to across-the-board programs. The objective of these measures is to increase employability, productivity and earnings of workers. Training programs generally had positive impacts on raising employability but these programs can be costly and have the effect of selecting unemployed workers with higher employability leaving out disadvantage workers. Among training programs, a more cost effective measure is on-the-job training targeted at long-term unemployed workers. Training programs are especially effective the nearer they are to regular jobs and targeting disadvantaged outsiders.
• ALMPs improving labor market matching are highly cost effective and desirable
(that is even better than training). Besides giving incentive for job search of the unemployed, it alleviates structural imbalances by improving matches and adapting qualifications to employers’ needs. Studies provide evidence on the significant effects of intensified job search assistance on employment probabilities and sometimes earnings especially for long-term unemployed workers. However, there can be difficulty in identifying who needs help. Moreover, while results are achievable, the effectiveness is only in the short‐run. It is also not sustainable and may not have much impact in times of recessions.
• ALMPs considered most cost effective and desirable are those creating
employment, which redistribute incentives to outsiders in the labor market, whereby their attachment to the labor market is strengthened, the outflow out of unemployment is supported thereby reducing labor market persistence. These ALMPs are highly effective in supporting recoveries. Nonetheless it should be realized that ALMPs can only have modest impacts and may even be desirable without any net employment impact.
Given the above findings, the authors suggest the following approaches and considerations:
• Betcherman et al. (2009) suggest that policy-makers should be realistic about
what ALMPs can do and that investments in this area should be made carefully and modestly. It is good practice to start with modest programs. The authors argued that the following issues relating to the formulation of an active labour market policy should be considered:
Priority setting- While ALMPs can have various policy objectives, in designing an overall strategy, it is important to identify which of these are the priority objectives since it is the objectives that should determine program choices and program design. Role of private sector –Private sector participation can lead to more diverse, innovative, and cost-efficient services. However, governments must be responsible for the overall system to ensure focus on public priorities.

6
Promoting partnerships and dialogue - The identification of priorities can benefit from dialogue between government, business, labor, and other groups. Where done effectively, a close connection with the needs of the labor market can be maintained. “Infrastructure” for the labor market - Labor market information, a viable and complete network of employment service offices, and certification and accreditation systems are critical “infrastructure for ALMPs. These infrastructure services should be given priority. Coordination within government – ALMPs can be complicated when many government agencies are involved and that coordination is insufficient. This must be addressed through intra- government coordination. Administrative/operational capacity - Designing and implementing ALMPs requires considerable capacity within government. Government must recognize that capacity building is a slow but essential process. Financing ALMPs – Innovative financing arrangements that address market imperfections but reflect the private-return aspect of ALMPs should be considered. In public financing, the choice is to draw from general revenues or finance ALMPs through earmarked funds. Monitoring and evaluation - In an effort to improve the targeting and efficiency of social programs, sound impact evaluation techniques should be used to evaluate ALMPs. This is also suggested by Abrahart et al. (2000)
III. Trends in Growth and Employment in the Philippines
This section presents Philippine growth and employment trends based on the nexus of growth and employment theory. In particular, the discussion focuses on the following employment indicators: (1) improved productivity of various sectors and occupation; (2) shift in the structure of employment towards occupations with higher levels of productivity and (3) change in labor force participation rate. Note, however, the arguments do not imply causality as this is difficult to show in the absence of general equilibrium model and deficiencies in data. The indicators are meant to observe correlation between growth, employment and productivity.
A. Macroeconomic Trends
• Philippine economic growth has been positive but relatively slow in the last decade. From 2000 to 2012, GDP growth posted an average growth of 4.8

7
percent (Figure 1). However, in the last three years, there has been considerable excitement on the economic outlook as the country moves into a steady growth pace with international agencies providing credit rating upgrades.
• GDP in 2012 grew at 6.6% but employment growth rate is still slow at 1.1%.
Underemployment and unemployment both decelerated but remains high at 19% and 6.8%, respectively (Figure 2). With the growing population and high underemployment and unemployment rate, the level of dependency remains high in the country. About 39% of working population supports the total population.
• The services sector has been the main provider of jobs accounting for 53% of
employment in 2012 (Table 5). Employment is growing in this sector but the increase is primarily a result of shift in labor from agriculture to services. The contribution of industry to employment is practically unchanged. In the manufacturing sector, there is a noticeable decline in the employment contribution implying that the manufacturing industry did not take off in the last decade. In the services sector, most employed are engaged in wholesale and retail (19%) and community, social and personal services (19%). There is a need to broaden the base of economic growth specifically agriculture and manufacturing which have high demand for the unskilled and semi-skilled workers.
• While employment growth has been slow, improvement in labor productivity has
been significant suggesting better jobs for the employed. For the period 2000 to 2012, labor productivity increased by 28%. The high growth in 2012 was accompanied by a 5.4% increase in labor productivity, the highest productivity growth rate since 2001 (Table 6). Labor productivity for all sectors grew, with service sector posting the highest contribution to growth in labor productivity. Among sectors, labor productivity in the industry sector is highest (P350,000 compared to only P182,000 in the service sector and about P58,000 in the agriculture sector). However, the development of the industry sector specifically manufacturing has remained slow.
• SMEs have accounted for the bulk of employment in the country. More than 50%
of total workers are employed in micro and small enterprises (Table 7 and 8). Most workers in the microenterprises are in the informal sector with unpaid family labor and with no paid employees. Medium-sized enterprises accounted for another 7%. Large enterprises also employed a significant number of workers (about 39%) and this share is noted to be on the rise in the last decade. The concentration of employment is in the services sector for all size categories.
• The slow growth in employment can also be attributed to low investment growth.
In the last decade, economic growth is fuelled mainly by domestic and government consumption, which account for an average of more than 80% of GDP while gross capital investment account for an average of 19% (Table 9). Philippine economic growth has yet to translate into higher investments specifically in the agriculture and manufacturing sector to have significant

8
increase in jobs. Gross capital formation increased only by an average of 4.57% annually since 2001.
B. Regional Trends
The regional trends are as follows:
• In the last three years (2009 to 2012), economic growth was highest in eight regions (Regions ARMM, VIII, VII, XII, III, VI, X, XI and XII), where growth of more than 5% average was posted. On the other hand, lowest growth of below 3% was noted in CAR and region V (Table 10). For the same period labour productivity was highest in NCR followed by CALABARZON (Region 4-A) (Table 11).
• Growth patterns, however, did not correspond to employment statistics.
Unemployment was high in regions which exhibited high to modest growth while relatively lower in Regions of slow growth. Unemployment higher than the Philippine average is noted in Regions NCR, 4-A, 3 and 1 while lowest unemployment rate (below 4%) is posted in Regions 2, 9, ARMM and 12 (Table 12). For underemployment, Regions 5, 10 and 9 exhibited underemployment rates higher by 10 percentage points than the Philippine average. Regions 3 and NCR posted the lowest underemployment rate (Table 13).
• The number of establishments and employment are concentrated in three regions:
NCR, Central Luzon (Region 3) and CALABARZON (Region IV-A). About one-fourth of total establishments are found in NCR (Table 14). Central Luzon and CALABARZON together account for also one-fourth of total establishments. The three regions significantly contributed to the total number of establishment categorized by size. The combined employment generated from these regions amounted to 65% of which 43 percentage points is accounted for by NCR (Table 15).
• A far second to the top regions are Central and Western Visayas (Regions 7 and
8) which account for 6% and 5.8% of total establishment, respectively. These regions combined provide 12% of total employment.

9
IV. Employment Generated from ALMPs of Government Agencies
A. Type of Policy Interventions Between the period 2004 and 2012, the government has funded several employment
generation programs in the DTI and various other Departments - DOLE, DA, DAR, DSWD, DOTC, DPWH and DOT (Table 16. See Appendix 1-7 for detailed program description). Most programs are considered ALMPs but there are also programs directed to investment promotions specifically for DTI and DOT. For the ALMPs, the common interventions are self-employment support, training and in-work benefits such as public works. Public works are usually undertaken by the Departments in partnership with the DPWH, DA and DAR. Among the Departments under review, the DTI is specifically involved (by virtue of its mandate) with development of MSMEs through training, investment facilitation and promotion services. Prior to 2010, DTI provided direct credit programs for livelihood/micro enterprise development (a form of self-employment support) but these programs have not been continued. At present, DTI mainly facilities access to financing of MSMEs through the Small Business Guarantee Fund Corporation (SBGFC) or private sector finance institutions. On the other hand, DSWD provides financing for livelihood projects of households specifically for PANTAWID beneficiaries. For households qualified for private sector financing, DSWD facilitates access to microfinance institutions.
The DAR programs are mainly geared to develop agrarian reform communities and
beneficiaries and the interventions include in-work benefits (or public works) through Agrarian Reform Community (ARC) Infrastructure Projects; training for agro-industrial livelihood enterprises, market facilitation and direct credit programs. In particular, the development of agro-industrial microenterprises in ARCs is implemented in association with the DTI.
Between 2006 and 2010, the DOT implemented a grassroots entrepreneurship and
employment in tourism (or GREET), which provides start-up capital or financing for the development of livelihood or microenterprise activities of ecotourism warriors and entrepreneurs. The program was conceived not only for employment generation but as a strategy to develop ecotourism destinations.
The DOLE has the largest number of programs/projects related to employment
generation, being the main agency handling labor and employment. Most of the programs/projects fall under employment facilitation (i.e. job placement or job matching) and human capital formation (e.g. training). The programs and projects of the DA include those related to the AFMA, credit programs of the Land Bank of the Philippines and the Medium Term Philippine Development Plan. In addition, the DA has the Office of the One Million Jobs program which is directly related to employment generation. The programs and projects of the DPWH are mainly public works in national and community road projects, which include the President’s Roadside Maintenance Program (Kalsada Natin, Alagaan Natin), Job Creation KNAN on Roadside Maintenance, Out-of-School Youth toward Economic Recovery (OYSTER) Program. In DOTC, the employment generation activities include
10
employment to support maintenance activities at airports, ports, railways administered by attached agencies of DOTC (LRTA, MIAA, PNR, etc.).
B. Government Priority ALMPs: The Community-Based Employment Program (CBEP)
The CBEP is among the priority programs of the government that aims to contribute to
the national goal of inclusive growth, poverty reduction and job creation, particularly in the countryside or the local community. It has been in existence for more than two decades and called different names in the past including Emergency Community Employment Program, Community Employment and Development Program, Kabuhayan 2000, Rural Works Program, and Community Livelihood Emergency Employment Program. As Chair of the Steering Committee of the program, the DOLE leads in coordinating and the monitoring of jobs generated by various involved agencies with enrolled infrastructure and non-infrastructure projects under the program.
The three components of the CBEP are:
• Infrastructure projects - job-generating government or public-private partnership (PPP) initiatives implemented at the local community, i.e., construction of roads, bridges, flood control structures, school buildings, and water systems;
• Non-infrastructure projects - job generating initiatives that cover social
infrastructure, i.e., reforestation, coastal resource management, livelihood and self-employment undertakings/projects;
• Emergency employment projects - emergency response income support projects
that create short-term wage employment or self-employment in distressed/remote areas or those affected by calamities/contingencies
It is important to note that not all employment generating programs of the Departments
are enrolled in CBEP. Only ALMP programs are enrolled. The Departments decide on which program to enrol and programs maybe added or deleted brought about by changes in the development thrust of government. In general, enrolled programs under CBEP are those targeted to poor and marginalized sectors in line with CBEP’s core objective of “reducing the vulnerabilities of individuals and households against risk particularly during the economic downturns or natural disasters that can push them down to poverty” (CBEP Reference Manual). Essentially CBEP supports the Social Protection Plan of the DOLE and the Philippine Development Plan, 2010-2016.
The reported employment generated across Departments is not comparable because of the
differences in methodology of Departments in reporting jobs. Note that the generated jobs are not actual jobs but estimates of employment generation based on either the budgetary allocation, gross value added, target area or target beneficiaries (Table 17). Year on year jobs generated does not also mean new jobs each year since the numbers may reflect

11
replacement or rehires as well as seasonality. For instance, DPWH count as one job a 4-month employment while DSWD define one job as a six-month employment. DOLE reports jobs generated in terms of calculated beneficiaries of programs and projects while DTI includes both direct and indirect employment that is generated from its investment facilitation and promotion programs.
Analysis of CBEP accomplishments in employment generation for each Department is
discussed below.
1. Department of Trade and Industry (DTI) The DTI implements the Rural Micro Enterprise Promotion Program (or RUMEPP),
which is a livelihood, self/employment program targeted to microentrepreneurs. DTI provides technical support and facilitates access to financing from the Small Business Guarantee and Finance Corporation (SBGFC) or microfinance institutions (or MFIs). The development of the microenterprises is expected to provide income for the household and also benefit other poor families through new job opportunities. Total accomplishment of RUMEPP in terms of jobs generated is 15,831 or 152% of its target (10,400) in 2012. This was achieved with 75% utilization of funds. The employment was generated at an estimated cost of about P 8,732 per job based on obligated funds (PhP 138.23 million) for the project.
2. Department of Agrarian Reform (DAR)
The DAR has three main programs in CBEP which e are: (1) the Agrarian Reform
Infrastructure Project (or ARISP III); (2) Agrarian Reform Communities Project (ARCP II); and (3) Tulay sa Pangulo sa Kaunlarang Pang Agraryo (TP-KP). These programs include both public works and microenterprise development. Overall employment accomplishment based on 2012 targets is 48% for infrastructure related jobs and 72% for microenterprise development (non-infrastructure. The low accomplishment corresponds to low utilization of funds.
3. Department of Social Welfare and Development (DSWD)
The DSWD has included all current programs under CBEP. These programs are: (1) Sustainable Livelihood Program, an off shoot of the Self-Employment Assistance Kaunlaran (SEA-K); (2) Kapit-Bisig Laban sa Kahirapan Comprehensive and Integrated Delivery of Social Services (KALAHI-CIDSS); (3) Cash for Work (CFW) Programs and (d) Government Internship Program. SLP is the major ALMP program at DSWD. The program supports not only community-based livelihood or microentrepreneurial activities but also employment facilitation. Employment facilitation is a job placement program implemented in partnership with other government agencies (e.g. DPWH, DA, DENR, LGUs and other NGAs). Except for the KALAHI-CIDSS Program which support infrastructure projects of LGUs, all other programs are for non-infrastructure specifically livelihood development. Overall, non-infrastructure programs accomplished about 75% of targeted employment in 2012. On a per program basis KALAHI-CIDSS, CFW and GIP accomplished 100% of target employment in 2012.

12
4. Department of Tourism (DOT)
In general, DOT does not implement specific ALMPs. Employment generation is
considered part of DOT activities mainly because tourism is itself a major industry and its activities are geared towards investment promotion for employment generation. In particular, the activities of the Department specifically Product Development and Marketing Promotions are expected to result in jobs.
A case in point is the development of community-based eco-tourism in potential tourist
sites such as the Pinatubo Volcano and the Pamilacan Island Dolphin and Whale Watching (PIDWW) Project. One major tourist development around the Pinatubo Volcano is the Sta Juliana-O’ Donnell Crater route, which is now one of the tourist service center in the Province of Pampanga. Likewise, the Pamilacan Island Dolphin and Whale Watching (PIDWW) Project is a major tourist destination in the Province of Bohol. From a small fishing village, the area is now part of the marine life tour in the country and the PIDWW community organization has been the largest contributor to local government revenues. With the success of this primary industry, it is expected that a series of secondary and support businesses will follow, thus, generate more jobs and incomes to the entire community.
These projects were developed through DOT product development strategy and
facilitation in community organizing, entrepreneurial and professional training, market support and funding facilitation. Prior to 2010, DOT also implemented a credit program for eco-tourism under GREET. Between 2007 and 2010, GREET approved and disbursed P18.7 Million for different microenterprise projects (Table 19).
DOT estimates jobs generated in terms of gross value added of the tourism industry.
Tourism industry accounts for 6% of GDP and gross value added in 2011 amounted to P571 Billion. The tourism industry also exhibited double digit increase in GVA in the last two years due to marketing promotions and tourism development projects of DOT.
5. Department of Labor and Employment (DOLE)
The DOLE is the national government agency mandated to formulate and implement
policies and programs, and serve as the policy-advisory arm of the Executive Branch in the field of labor and employment. The DOLE recognizes that the private sector is the primary engine of economic growth, particularly in creating adequate employment opportunities. However, given a labor market that is characterized by high rates of unemployment and underemployment, public policy requires the Department to pursue an active strategy and play a vital role in employment creation. For this reason, the DOLE actively advocates for employment generation and provides bridging or transition opportunities for workers, particularly for those who are in the vulnerable and disadvantaged sectors.
In general, the data and information on employment-generating programs and projects of
the government, including those of the DOLE, have been limited. In totality, there have been 13 ongoing programs and projects and 5 completed programs and projects for employment

13
generation at the department from 2000 to 2013. Given the data and information presented in the Tables, an in-depth analysis of these programs and projects is not possible. (See detailed program in Appendix 4)
From the CBEP data, the DOLE implemented two CBEP projects through the Bureau of
Workers and Special Concerns (BWSC) (Table 18). These projects were the Special Program for Employment of Students (SPES) and the DOLE Integrated Livelihood Program (DILP). In that year, the SPES employed 138,381 students for a 98 percent accomplishment rate. On the other hand, the DILP employed 84,207 for a 145.18 percent accomplishment rate and utilized P291 million which which translates to a per capita cost of P3, 493.00Based on the available data, therefore, the SPES in 2012 almost attained its employment target although it is not known at what cost. On the other hand, in the case of the DILP, the DOLE has greatly exceeded its employment target while spending much less of its budget.
6. Department of Agriculture (DA)
The DA is the principal agency of the Philippine government responsible for the promotion of agricultural and fisheries development and growth. Key informants at the DA said that employment generation is an incidental and secondary function of the department.
The employment-generating programs and projects of the Department are listed in
Appendix 5. The list covers the period 2000 to 2012 and includes those related to the Agricultural Fisheries Modernization Act (AFMA), credit programs of the Land Bank of the Philippines and the Medium Term Philippine Development Plan which are on-going. In addition, the DA had the Office of the One Million Jobs program during the Arroyo administration which was directly related to employment generation but which is now terminated.
The DA implemented infrastructure and non-infrastructure projects under CBEP (Table
18). In totality, the DA employed 292,116 persons for an accomplishment rate of 74.63 percent and utilized P7.7 billion of its allocation for a utilization rate of 48.20 percent. Therefore, in the case of the CBEP in 2012, the Department has not attained its employment target and furthermore was low on its fund utilization.
7. Department of Public Works and Highways (DPWH)
The stated mission of the DPWH is to provide and manage quality infrastructure facilities
and services responsive to the needs of the Filipino people in the pursuit of national development objectives. Hence, like many other Departments except the DOLE, the promotion of employment is only a secondary function of the Department.
Appendix 6 presents the employment-generating programs and projects of the
Department from 2001 to 2011. The list includes the President’s Roadside Maintenance Program (Kalsada Natin, Alagaan Natin), Job Creation KNAN on Roadside Maintenance, Out-of-School Youth toward Economic Recovery (OYSTER) Program and Nationwide jobs’

14
Fair which are all aimed at gainfully employing specific disadvantaged sectors. All these programs are currently implemented.
The DPWH implemented infrastructure and non-infrastructure projects under CBEP
(Table 18). In totality, the DPWH employed 279,057 persons for an accomplishment rate of 63.05 percent and utilized P38.65 billion of its allocation for a utilization rate of 20.66 percent. Therefore, in the case of the CBEP in 2012, the DPWH has not attained its employment target and is also low on its fund utilization.
8. Department of Transportation and Communication (DOTC) The Department of Transportation and Communications (DOTC) is the government
institution which is mandated to promote, develop and regulate a dependable and coordinated network of transportation and communications systems, as well as in the fast, safe, efficient and reliable transportation and communications services.
Appendix 7 lists the employment-generating programs and projects of the Department
from 2001 to 2011. The employment generating activities reported are by agency attached to DOTC and data reported were only for 2011. Among the agencies under the DOTC, the MIAA appeared to have contributed the most to direct employment, providing jobs 1,899 individuals in janitorial services and similar jobs.
Under CBEP, The DOTC has implemented both infrastructure and non-infrastructure
projects which provided a total of 20,963 and 2,968 jobs, respectively (Table 18). This shows an accomplishment rate of 78% for infrastructure projects and 66% for non-infrastructure projects. Among the agencies under the DOTC, the Cebu Port Authority provided the most employment (about 17,000) for infrastructure program. For non-infrastructure programs, the Philippine national railways (PNR) contributed the most to direct employment, providing jobs to 1,889 individuals for janitorial services and similar jobs. .
Overall, the different Departments of government acknowledge the need for greater
access to employment opportunities. While the impact of the CBEP programs is not yet clear due to lack of impact analysis, DOLE argues that government needs to make program interventions specifically to address the following (DOLE 2011):
Vulnerable employment. A more serious dimension of the employment problem is the number of persons in vulnerable employment. Accounting for two (2) out of every five (5) employed persons, workers in vulnerable employment are under relatively precarious circumstances i.e., less likely to have formal work arrangements or access to benefits or social protection, and are more at risk to adverse impact of economic cycles.
Youth unemployment. Globally, one out of four in the working age population is between 15 and 24 years old. About half of them are unemployed. This is also the case in the Philippines. In 2010, of the total 2.9 million unemployed, more than half were in the age range of 15-24.

15
Educated unemployed. Unemployment among the educated is also high. In 2005 to 2010, an average of 39.8% of the unemployed or 1.1 million reached college. The unemployment of the educated means lost opportunities for productive work among this population group.
Job and skill mismatch. Due to inadequate employment opportunities in the formal economy, limited labor market information and inadequate academic preparation, the mismatch between jobs and skills compounds the problem of high levels of unemployment of youth and the educated.
V. Assessment of Selected Employment Generation Programs This section provides further evaluation on ALMPs and other employment generation
programs of selected Departments. The choice of program and Departments is based on available data and/or evaluation studies undertaken on the programs. For most agencies, it is not possible to undertake in-depth analysis due to limited data and information.
A. One Town, One Product (OTOP) Program, DTI
The OTOP was launched in 2004 as a major strategy for MSMEs development and job generation. The program provides a localized approach by focusing on the development and promotion of locality’s competitive product or service through a comprehensive assistance package that includes business counselling, skills and entrepreneurial training, product design and development, appropriate technologies and marketing. The capability building strategies are designed to expand and improve the managerial and technical competence of entrepreneurs and workers while marketing support enhances the opportunities to expand domestic and export markets.
The DTI’s regional operations and Development Group is the lead implementor of OTOP
with partnership from the local government units (LGUs) and other national government agencies.
1. Macrolevel Assessment of Performance The OTOP performance indicators are based on DTI’s monitoring data which includes
information on the following: (1) investment generated; (2) MSMEs assisted; (3) New jobs created; (4) Domestic sales generated; and (5) services extended in terms of loan facilitation and trainings conducted. Investment generated refers to the capital spending of the entrepreneurs as start-up capital or as capital to expand existing business. MSME assisted refers to the number of enterprises that have been assisted under the program for start-up or expansion. New jobs refer to employment, which is the number of people hired by the enterprises on a permanent or temporary basis. This number is likely to be affected by seasonality of production and also by replacements. The practice of replacement means that

16
if one job is equivalent to 4-month employment, there can be 3 jobs (or employment) generated within a year for the same activity or item. Domestic sales refer to local receipt of products and services sold/consumed in the country. DTI also monitors exports sales but this data has not been consistently provided by the regions. Services extended refer to the major business development support for capability building.
For the period 2007 to 2012, the OTOP program generated total investment of P11.6
Billion or an average investment of about P 2.0 Billion annually (Table 20). Regions IX and XII generated the highest investment among regions while Regions VIII and IV-B registered the lowest investment. The program assisted over 50,000 MSME for the period 2007 to 2012 or about 8,500 MSME annually (Table 25). Average investment per MSME is about P226,328 (Table 22). On a regional basis, the average investment per MSME normally range from P57,500 to P399,000 except in Regions IX and XII, where the average investment generated is about P2.0 Million per MSME. However, while Regions IX and XII generated the highest investment per MSME, the number of jobs generated has not been impressive (Table 23). Regions VII which registered only an annual investment of P 74.75 Million and the lowest investment per MSME of P57,526 was able to generate annually 7,456 jobs compared to 5,811 jobs for Regions IX and 2,290 jobs for Regions 12. Similar trend is observed for Regions III, IV-A and VI. Regions IX though generated the highest annual domestic sales and domestic sale per MSME (Tables 24 and 25).
Based on the data, there is a positive and significant correlation between investments and
job generation and between number of MSMEs and job generation (Table 26). This implies that increase in investments and in the number of MSMEs supported raise or generate employment. However, the assumption here is that new investments are created yearly and that the MSMEs developed are able to sustain and expand operations in the medium to long term period.
On the other hand, there is negative and weak correlation between average investments
per MSME to job generation. Although the relationship is not significant, the evidence suggests that assisting bigger firms does not necessarily lead to higher employment. However, it is possible that bigger firms are more stable and provide sustained employment compared to micro and small firms where seasonal and temporal employment are more common.
2. Review of OTOP Performance Evaluation In 2010, DTI commissioned a study to assess the effectiveness of the OTOP program
specifically to determine the socioeconomic effects of the program on the MSMEs.3 The analysis covered the period 2006 to 2009 (taking out the years 2004 and 2005, which corresponds to OTOP’s formative phase).
The relevant findings on the OTOP performance are:
3 The study was undertaken by the Development Academy of the Philippines (DAP 2011).
17
• OTOP has supported 33,654 MSMEs for the period 2007 to 2009 (Table 27). Most (or 88%) of the enterprises had existing business while about 7,496 (or 22%) were established through the program. The enterprises are mainly microenterprises with small and medium businesses accounting for 25% (Table 28). The top three products of these businesses in order of ranking are food, fashion and homestyle.
• The top three regions in MSMEs developed are Region 8, Region 3 and Region 3 while the lowest are in NCR, Region 4b and CARAGA.
• On jobs generated, 495,194 jobs (i.e. permanent or seasonal) were generated from 2006 to 2009 representing only 66% of the 750,000 jobs targeted by the program (Table 29). Of the total jobs generated only 40% are direct jobs sustained.
• The socioeconomic indicators of OTOP performance reveals a 90% increase in
income of the MSMEs beneficiaries which translated into an upgraded quality of life and upgraded business activities (Table 30). About one-fourth of the respondents perceived that the positive effects of OTOP are increased employment and better quality of local products. DTI interventions considered most useful in assisting MSMEs are product design and development and skill, business and entrepreneurial training.
• Major constraints faced by MSMEs in their business are: (1) the lack of access to
additional capital; (2) Unavailability /inaccessibility of raw materials and (3) difficulty to comply with FDA requirements to penetrate larger markets (Table 35).
• Main challenges to the OTOP program are: (1) lack of support from some LGUs on
the OTOP program; and (2) lack of innovative or more comprehensive marketing strategy provided under OTOP (i.e. some products may require strategies that are not yet tried and tested”).
B. Sustainable Livelihood Program (SLP), DSWD
The SLP is a community-based capacity building program which aims to enhance the socioeconomic status of its participants. It is implemented through a two-track program: (1) the Micro-Enterprise Development Track, which involves skills enhancement, partnership building and provision of seed capital assistance; and (2) the Employment Facilitation Track, which involves occupational guidance, technical skills training and job referral or placement. Both tracks are targeted to poor families as identified in the National Household Targeting Survey (NHTS).
The SLP, which was launched in 2011 is an offshoot of the Self-Employment Assistance
Kaunlaran (SEA-K) Program implemented under the Arroyo administration. However, unlike SLP, SEA-K focused mainly on microenterprise development through the provision of credit and access to community social services. The expanded version of SEA-K also included credit for shelter/home improvement. There has been no impact evaluation of the

18
SEA-K Program but initial assessment show some positive results in terms of improvement in incomes (Table 32). However, performance in terms of employment generation and access to basic services (water, health management) is poor. A major challenge mentioned about the program is the sustainability of microenterprise projects of the beneficiaries. It appears that the surge in income has been the result of credit provision rather than enterprise development thus, the employment effect has been minimal.
Comparatively, the SLP is showing more positive results than SEA-K. Under the Microenterprise Development Track, DSWD reveals movement of some microenterprises from government (NGA/LGU) capital seed fund users to self–finance and borrowers of MFIs within less than three years of program implementation. The program is also better targeted since only the poorest households have access to DSWD/LGUs or NGAs credit funds while households qualified to take a loan are partnered with microfinance institutions (or MFIs). From January 2011 to June 2013, a total of 215,699 households benefited from the Microenterprise Development program of which 32,817 (or 15%) were supported by MFIs (Table 33).
For households supported by DSWD credit funds, overall repayment performance is good at 82.93% (Table 34). However, there are regions with poor repayment performance such as Region 12 (22%), ARMM (55%) and CAR (55%). The high performing regions with 100% repayment performance are regions IV-B, IX, X, XI and CARAGA.
SLP Track 2 Employment Facilitation Program reflects the job placement activity of
DSWD in partnership with national government agencies, NGOs and other private sectors. Employment is defined as a 6-month contract. From January 2011 to June 2013, the program employed a total of 5,702 persons (Table 35). The bulk (or 86%) has been employed in DPWH infrastructure projects. Other sources of employment are the private sector (9%) and other government agencies (DENR, DA, DOT, DOLE, LGU and TESDA).
SLP also works as support program for the DSWD Pantawid Pamilyang Pilipino
Program, which is a short-term conditional cash transfer program that invests on the health and education of poor households. Thus, as indicated in SLP’s accomplishment, the bulk of beneficiaries (about 84%) for both tracks are also Pantawid households. The rationale for this is to provide a comprehensive program that will enable the benefited Pantawid households to increase income and continue the investment for the health and education of their children after they exit from Pantawid.
Therefore, the sustainability of the microenterprise developed and employability of SLP
beneficiaries are continuing challenges for DSWD. Monitoring and partnership is a major component of the program to help microenterprises that were developed and assisted to attain viability in the long-term. In the case of the Employment Track, moving them to private sector employment, enhancing their skills or upgrading them to microenterprise development is needed to ensure long-term effects. DSWD is also at the forefront of collaborative approach among key government agencies. There is a need to strengthen convergence of programs among agencies to address the increasing and other important needs of the underprivileged.

19
C. Comprehensive Livelihood and Emergency Employment Program (CLEEP),
The Comprehensive Livelihood and Emergency Employment Program (CLEEP) is
another CBEP, which was set into motion in 2009 as a stop-gap measure to reduce the impact on employment of the global financial crisis and the economic crisis following natural disasters (Typhoon Ondoy and Pepeng). The program was targeted to the most vulnerable sectors. Specifically, this program intends to hire workers for emergency employment and to fund and supervise livelihood projects.
Similar with CBEP, DOLE was tasked to lead the monitoring and reporting of
employment generated through employment and livelihood programs and projects enrolled under CLEEP by government agencies and other instrumentalities. All cabinet members were instructed to draw up emergency work programs and doable and fundable livelihood projects for the middle class, middle-low income class and the poorest of the poor. The priority areas of the program include the Mindanao Agri-business Quadrangle, North Luzon Agri-business Quadrangle, 12 poorest provinces, depressed areas of the National Capital Region (NCR) and 12 most food poor provinces, Luzon urban beltway, and tourism center (EO 783). Concerned agencies and instrumentalities of the government were directed to allocate and utilize 1.5 % of their budget for operating expenses for temporary hiring of qualified DOLE-registered displaced workers and their dependents (EO 782, series of 2009).
Table 36 shows that in 2009, the assistance to workers during the global financial crisis
under CLEEP benefited a total of 28,890 workers. The region which gained the most from the program in terms of workers benefited was NCR while the region which gained the least was Region XII. The Regions in Luzon which were affected by Typhoons Ondoy and Pepeng in 2009 also benefited with NCR gaining the most and Region II gaining the least. In totality, 16,521 workers benefited under TUPAD, 7,025 gained under ISLA, 194 benefited under 1.5% MOOE provision of EO 782 and 5,150 gained under the emergency employment due to Typhoons Ondoy and Pepeng.
Table 37 further shows some data and information on the emergency employment for
displaced workers and their dependents under CLEEP. The total 1.5% MOOE of the program in 2009 under EO 742 was P1.35 billion while the total amount utilized was P1.27 billion for a utilization rate of 94 percent. The total target number of workers to be hired was 48,532 persons while the actual number of workers hired was 32,410 persons for an accomplishment rate of 66.78 percent.
In terms of employment accomplishment by agency, DOT and DOLE exceeded their
targets while DOJ and DENR had the weakest performance (Table 38). In terms of financial utilization, PMS, OPS, and DTI had the highest performance exceeding more than 100 percent while NEDA and DOJ had the lowest performance registering less than 1 percent. In terms of amount utilized per person, DOJ and DA had the best performance spending lower

20
than P3,000 per person while OPS and PMS had the weakest achievement spending at least P150,000 per person.
D. High Value Crops Development Program (HVDCP), DA
The HVDCP is a priority program of the Department which was created to help address food security, poverty alleviation and sustainable growth of the country. It was intended to promote the production, processing, marketing and distribution of high value crops. Its stated goals were to a) increase production, income and livelihood opportunities among small producers; and b) access to affordable, safe and healthy food.
Data on performance of the HVCP in terms of number of jobs generated are available for
2008 and 2012 and are shown in Table 39. In 2008, the accomplishment rates were more than 100 percent for some crops planted including banana, vegetable, and coffee but less for others namely mango, pineapple, and rubber. In general, the accomplishment rates for production-oriented activities were also higher compared to non-production-oriented activities. Also, the accomplishment rate was 178 percent for production (agriculture and fisheries) support services in 2008 but this decreased to only 73 percent in 2012. Furthermore, the accomplishment rate of other infrastructure and postharvest development was only 26 percent in 2008 but this increased to 32 percent in 2012. While the available data are sketchy, it is apparent that the performance of the HVCP in terms of number of jobs generated has been inconsistent between crops planted, between production and non-production-oriented activities and between years. Based on this, the overall performance of the program is indeterminate.
E. Accelerated Hunger Mitigation Program (AHMP), DPWH
Based on additional data availed by the study team from the DPWH through the DBM,
some analysis can be done on the component of the Accelerated Hunger Mitigation Program (AHMP) implemented by the DPWH. Launched by the government in 2007, AHMP is a program which seeks to diminish food insecurity and hunger in the country. As such, its target beneficiaries include 42 priority provinces, identified by a nationwide survey adopting Social Weather Station’s self-rated hunger survey. On the supply side, the program includes increased food production and enhanced efficiency of logistics and food delivery. The first is addressed through seed subsidies, repair and rehabilitation of irrigation facilities, and technical assistance. The second is addressed through food depositories called Barangay Food Terminals in Manila and major cities in the country, TN, RO-RO ports, farm-to- market roads, and Food for School Program. On the demand side, on the other hand, the program includes “putting money into poor people’s pockets”—training, microfinance, and upland distribution to poor people; promoting nutrition through education; and managing the population. The AHMP is also a component of the pump-priming strategy of the government which seeks to generate investments, create jobs, and provide basic services to poor families which is why is considered an employment generating program.
21
Table 40 presents data on the status of the AHMP as implemented by the DPWH from 2005 to 2009. During the period, the accomplishment rates for the completion of projects were generally higher during the earlier years than in the latter years. In particular, accomplishment rates for farm-to-market roads, roadside maintenance, and water supply were 100 percent in 2005 but these were down to less than 50 percent in 2009. The man-days and number of workers, on the other hand, were generally lower in the earlier years compared to the latter years. In particular, total man-days employed increased from 545,790 in 2005 to 4,336,903 in 2009 while number of workers employed rose from 8,430 in 2005 to 26,658 in 2009. During the period, roadside maintenance employed a lot more people compared to farm-to-market roads and water supply.
VI. Conclusions and Recommendations
In the last three years, the country has been experiencing strong economic growth but this
trend has not been matched by growth in employment. Employment barely grew during the period registering lower than the 1.9% population growth rate. The level of dependency thus remains high with about 39% of the working population supporting the entire population.
A major factor to the sluggish growth in employment is the low growth of private
investment. In the last decade, economic growth is fuelled mainly by domestic and government consumption, which account for an average of more than 80% of GDP. Gross capital investment was only 19% of GDP and grew by an average of only 4.5% annually since 2000. Philippine economic growth has yet to translate into higher investments specifically in the agriculture and manufacturing sector to have significant increase in jobs.
The government has established active labor market programs (ALMPs) to address this
persistent unemployment and underemployment. In particular, national government agencies implemented several ALMPs targeting specific groups of clientele. However, the impact of this program has been apparently irregular and short-term. The ALMPs were also intended to address other social issues such as poverty reduction, social/human development or community development. It is therefore possible that most ALMPs are desirable for the social objectives rather than for providing net employment impact. However, these inferences need to be validated through an in-depth analysis of specific programs, which has not been possible under the study.
Aside from ALMPs, government also implemented programs for investment promotion
to generate jobs. In particular, the DTI implements mostly this type of program. A major program is the One Town One Program (OTOP) a program intended to support local economic development through development of MSMEs. The performance of the OTOP in terms of investment generated and assisted MSMEs have been positive. Moreover, OTOP resulted in a 90% increase in income of the MSMEs beneficiaries which translated into an upgraded quality of life and upgraded business activities. However, the program has weak employment effects with only 6% of the MSMEs assisted citing that the OTOP resulted in additional employment and 25% citing possible positive effects on community employment.

22
It has been observed that the growth of SMEs has been constrained by (1) the lack of access to additional capital; (2) Unavailability /inaccessibility of raw materials and (3) difficulty to comply with FDA requirements to penetrate larger markets. These constraints are consistent with the macro studies on the reasons for the low private investments in the country. Moreover, OTOP has not necessarily led to local economic development due to the following: (1) lack of support from some LGUs on the OTOP program; and (2) lack of innovative or more comprehensive marketing strategy provided under OTOP (i.e. some products may require strategies that are not yet tried and tested”).
There is clearly a need to define the intent of employment programs. Most government
agencies are implementing ALMPS which clearly are intended to the vulnerable/marginalized population or in emergency situations. The other focus should be on programs or policies that will promote private investments to generate employment. The policies need to address the constraints identified and to undertake programs linked to the overall industrial policy of government.
It is also important to examine the employment targets provided by agencies. First, job is
defined by most agencies as employment (or hired manpower) monitored on a yearly basis. This definition implies that employment for a specific service maybe counted several times within a year. For instance, DAR and DPWH define 1 job as 4-month employment. This means that in one year, there can be 3 jobs for a specific work activity. Second, the jobs reported by one Department may also be reported by another Department because of partnerships among Department specifically for job placement or even assisted MSMEs. Third, jobs reported are not actual figures but derived from assumptions and factors with each Department having its own basis or methodology for counting jobs. Fourth, double counting may result from the methodology of some Departments to count the impact of the program intervention on both direct jobs and indirect jobs. For instance, investment facilitation or product development activities of DTI and DOT would likely affect other sectors. The employment impact is not confined to households or enterprises directly assisted but also those that are linked to these industries/firms.
Given these issues there is a need to create convergence and agreements among key
Departments with regards to the methodology and definitions in identification and counting of jobs. The DOLE, as the lead employment agency, can take the initiative starting with programs listed under the CBEP.
The Departments also need to improve monitoring and evaluation system for ALMPs that
are administered by their offices. The indicators usually have not been identified in the conceptualization of the program thus data or information is not available to facilitate assessment of programs’ impact. Within Departments there is no standard monitoring system since different programs are managed by separate divisions or Bureaus. The absence of a central evaluation monitoring and evaluation office in each Department has created difficulty in identifying and integrating information and data.
Tables and Figures

23
Table 1. Policy and Institutional Barriers to Industry Upgrading
LOW LEVELS OF
PRIVATE
INVESTMENT AND
ENTREPRENEURSHIP
Low Return to
Economic Activity
� Low Social Returns
• Poor Geography
• Low Human Capital
• Bad Infrastructure
� Low Appropriability
• Government Failures o Micro Risks: Property Rights,
Corruption, Taxes
o Macro Risks: Financial, Monetary,
Fiscal Instability
• Market Failures o Information Externalities: “Self
Discovery”
o Coordination Externalities
High Cost of Finance
� Bad International Finance
• Market Failures
� Bad Local Finance
• Low Domestic Savings
• Poor Intermediation Source: ADB (2007). Country Diagnostics Study. Manila, Philippines
Table 2. Relevant Instruments, Target Groups and Intended Effects of ALMP's
Target
Area Aim Instruments
Targeted
Workers Intended Effects
Labor
Demand
Provide
Incentives for
retaining
employment
Work sharing
and short work
Insiders
Reduce outflow from employment
Wage Subsidies Retain labor market attachment
Provide
Incentives for
creating
employment
Hiring Subsidies
Outsiders
Increase inflow into employment
Business start-up
support Increase labor market attachment
Labor
Supply
Provide
incentives for
In-work benefits,
subsidies, tax
Insiders and
Outsiders
Increase inflow into employment by
strengthening work incentives

24
seeking and
keeping a job
credits Reduce outflow from employment
Increase labor market attachment
Provide income support
Public works Outsiders
Increase inflow into employment by
strengthening work incentives
Increase labor market attachment
Provide income support
Activation and
Workfare Outsiders
Increase inflow into employment by
strengthening work incentives
Sanctions
Provide
incentives for
human capital
enhancement
On the job
training Outsiders
and Insiders
Increase inflow into employment
Increase productivity
Classroom
training Improve match quality
Labor
Market
Matching
Improved labor
market
matching
Job search
assistance Outsiders
Improve job search efficiency
Increase inflow into employment
Employee
intermediation
services
Outsiders
and Insiders
Improve job search efficiency
Improve match quality
Increase inflow into employment
Counselling and
monitoring Outsiders
Improve job search efficiency
Increase inflow into employment
Source: Brown and Kottl (2012)

25
Table 3. Overview of Impact Evaluation on Active Labor Programs
Program Appear to Help Impact
1 Public Works Severely disadvantaged Long-term employment prospects not helped: program
Programs/Public groups in providing participants are less likely to be employed in a normal job
Service temporary employment and earn less than do individuals in the control group. Not a
Employment (13 and a safety net. cost-effective instrument if objective is to get people into
evaluations) gainful employment after program completion.
2 Job-search Adult unemployed Relatively more cost-effective than other labor market
assistance/ generally when interventions (e.g. training) - mainly due to the lower cost,
Employment economic conditions are youth do not benefit usually. Difficulty lies in deciding
Services (18 improving; women may who needs help in order to minimize deadweight loss.
evaluations) benefit more.
3. Training of Women and other These programs are no more effective than job-search
long-term disadvantaged groups assistance in increasing re-employment probabilities and
unemployed (23 generally when post-intervention earnings and are 2-4 times more costly.
evaluations) economy is improving. However, job search assistance may not be a direct
substitute as it may cater to a different groups of the
unemployed.
4. Retraining in Little positive impact mainly These programs are no more effective than job-search
the case of mass when economy assistance and significantly more expensive. Rate of return
layoffs (11 Is on these programs usually negative. However, job search
evaluations) doing better. assistance may not be a direct substitute as it may cater to a
different groups of the unemployed.
5. Training for No positive impact. Employment/earnings prospects not improved as a result of
youth (7 going through the training. Taking costs into account – the
evaluations) real rate of return of these programs both in the short as
well as the long run is negative.
6. Microenterprise Relatively older groups, Very low take-up rate among unemployed. Significant
Development the more educated. failure rate of small businesses. High deadweight and
Programs displacement effects. High costs (cost-benefit analysis
(13 rarely conducted).
evaluations)
7. Employment/ Long-term unemployed Extremely high deadweight and substitution effects. Impact
Wage subsidies in providing an entry analysis shows treatment group does not do well as
(15 evaluations) into the labor force. compared to control. Sometimes used by firms as a
However, no long-term permanent subsidy program.
impact.
Source: Abrahart et al. (2000)

26
Table 4. Effectiveness of ALMP's
ALMP Policy Effective
Objective Positive Effects Negative Effects Impact in Normal Times Role During Crisis and Recovery Cost- Effectiveness
Incentives
for retaining
employment
Work
sharing/
Short
work
Reduce outflow
from
employment
Temporarily
prevent layoffs
Substantial deadweight,
substitution and
displacement effects
*Increased LM
segmentation
Useful temporarily at beginning of
severe recessions
Very costly and potential
negative longer-term impacts
*Increase in unemployment
prone groups, lower
productivity
Needs to be in place before
Only useful for a very limited
time for existing schemes at
onset of severe recessions Negative competition,
wage effects and no
effect on temporary jobs
*Inhibits efficient Labor
reallocations
Might obstruct recovery if not
phased out swiftly
Wage
Subsidie
s
Continued
employment of
insiders
Lock-in effects, skill
acquisition disincentives
and retaining low-
productivity workers
*Reduced outflow from
unemployment
Potentially useful temporarily at
beginning of severe recessions
Cost-ineffective and potential
negative longer-term impacts
*Increased LM persistence,
long-term unemployment
*Skill attrition, lack of
adaption
Might obstruct recovery if not
phased out swiftly
Incentives
for creating
employment
Increase
outflow from
unemployment
Employment of
outsiders
Substantial deadweight,
and displacement effects
*Skill attrition, lack of
adaption
Negative competition,
wage effects
Locking-in effects, skill
acquisition disincentives

27
Hiring
subsidie
s
Very significant
transition and
screening
effects
Potentially sizeable
short-run displacement
effects
*Cost-effective
countercyclical automatic
stabilizer to increase
outflow from
unemployment Important stabilizer to support
recoveries
Cheapest and most cost-
effective measure
*Increase of LM flows,
reduction of persistence
As automatic stabilizer: target
disadvantaged, especially long-
term unemployed worker for
limited period
Competition
effects
Limited deadweight and
substitution effects,
displacement
*Strengthen LM
attachment
Keep LM attachment in recessions
*Promote adaptability
Self-
employ
ment
incentiv
es
Potentially high
deadweight and
displacement
effects Potentially high
deadweight and
displacement effects
*Increase of LM flows,
reduction of persistence
Support recoveries Cost-effective, but restricted
applicability *Strengthen LM
attachment
Competition
effects *Promote adaptability
Incentives
for seeking a
job and
working
In-work
benefits
and
subsidie
s
Create
employment
incentives
Positive
screening, wage
and
competition
effects
Substantial deadweight,
substitution and
displacement
*Increased LM persistence,
long-term unemployment
Cost-effective redistributive
instrument to soften income
shortfalls
Cost-ineffective: costly and no
long-run positive employment
effects
Sizeable skill acquisition
disincentives and
incentives for low-
productivity work
*Increase in unemployment
prone groups, lower
productivity
Temporary use in crises together
with demand side policies
Cost-effective redistribution
policy in crises, but targeting
issues

28
Reduce
inequality and
in-work poverty
Very limited
transition
effects
Locking-in and
asymmetric information
effects
*Skill attrition, lack of
adaption
Public
works
No transition
effects
Strong stigmatizing and
locking-in effects, skill
acquisition disincentives
*Lower employment
probabilities
Temporary safety-net in MICs
during crises
Cost-ineffective: costly and no
long-run positive employment
effects
Threat effect,
Infrastructure
provision,
safety-net
*Skill attrition, lack of
adaptation
Employment of last resort in LICs
during crises Safety-net role in crises
Activati
on and
workfar
e
Make
unemployment
more costly
Threat effects
and wage
effects
Locking-in effects
*Increase in employment
incentives
No special role during crises, but
can support recovery in tandem
with demand side policies
Cost-effective policy in shifting
towards active income support
*Increase of LM flows,
reduction of persistence,
shorter unemployment
durations
Sanctio
ns
Make
unemployment
more costly
Threat effects
and wage
effects
*Increase in employment
incentives
No special role during crises, but
can support recovery in tandem
with demand side policies
*Increase of LM flows,
reduction of persistence,
shorter unemployment
durations
Incentives
for human
capital
formation
On the
job
training
Enhance labor
supply by
adapting and
increasing skills
Strong
screening,
competition
and transition
effects
Sizeable deadweight
costs as well as creaming
and locking-in effects
*Effective in increasing
long-run employability and
earnings through skill
upgrading In recessions to counter
disadvantages of work sharing
schemes, to strengthen LM
attachment, and upgrade skills.
On the job training targeted at
long-term unemployed workers
are particularly cost-effective in
the long-run
*Strengthen LM
attachment

29
Classroo
m
training
Increase
productivity,
employability
and earnings
Weak
screening,
competition
and transition
effects
Small wage effects
*Promote adaptability
Most effective in strengthening
recoveries.
Important: training focus,
involving employers providing
formal qualifications, targeting. *Increase of LM flows,
shorter unemployment
durations
Improved
labor market
matching
Job
search
assistan
ce
Increase job
search and
matching
efficiency
Competition
effects
Deadweight and
creaming effects
potentially strong
*Increase outflow from
unemployment, job search
incentives
Strong role in supporting the
recovery
Cost-effective policy, essential
for LM functioning with short-
run impact
Employ
er
interme
diation
service
*Strengthen LM
attachment
Threat effects
combined with
sanctions
Also displacement, wage
and churning effects
*Increase of LM flows,
shorter unemployment
durations Search assistance: proven strong
impacts on employability, esp.
for disadvantaged workers Counsell
ing,
monitor
ing
*Promote adaptability
Source: Brown and Kottl (2012)

30

31
Figure 1. GDP Growth, Employment Growth and Labor Productivity Growth, Philippines 2000-2012
Source: National Statistical Coordination Board and National Statistics Office
Figure 2. Philippine Unemployment and Underemployment, 2000-2012
Source: National Statistics Office
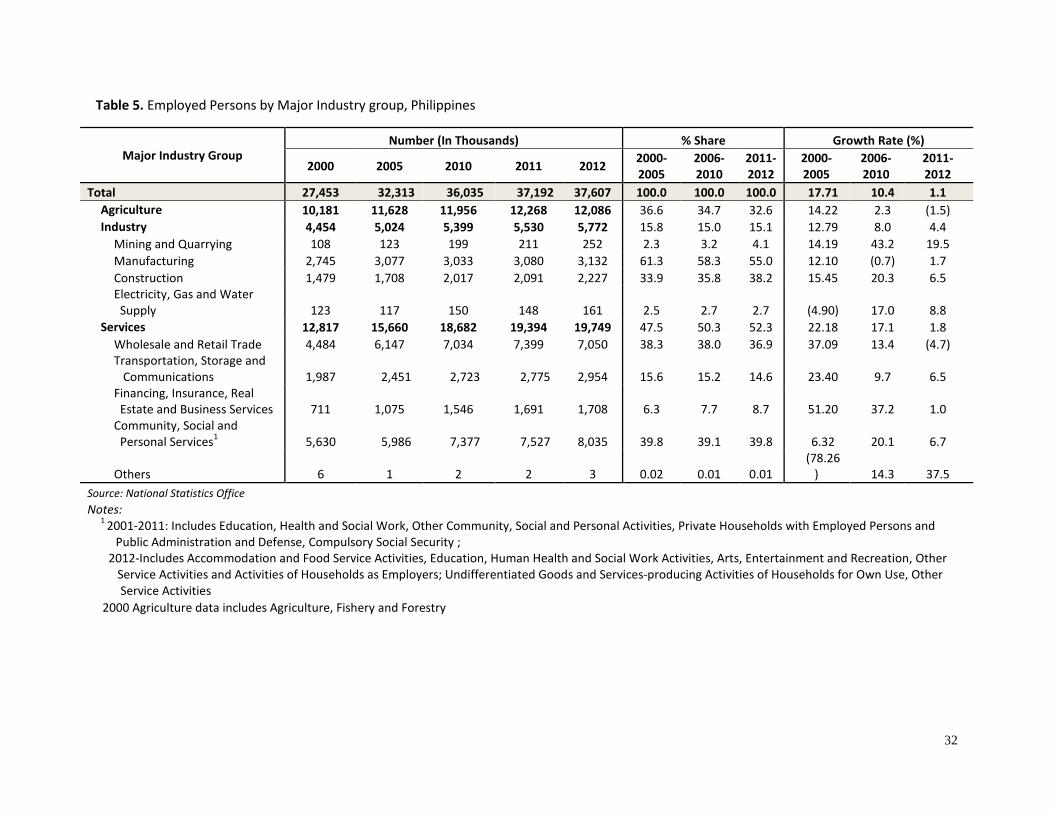
32
Table 5. Employed Persons by Major Industry group, Philippines
Major Industry Group
Number (In Thousands) % Share Growth Rate (%)
2000 2005 2010 2011 2012 2000-
2005
2006-
2010
2011-
2012
2000-
2005
2006-
2010
2011-
2012
Total 27,453 32,313 36,035 37,192 37,607 100.0 100.0 100.0 17.71 10.4 1.1
Agriculture 10,181 11,628 11,956 12,268 12,086 36.6 34.7 32.6 14.22 2.3 (1.5)
Industry 4,454 5,024 5,399 5,530 5,772 15.8 15.0 15.1 12.79 8.0 4.4
Mining and Quarrying 108 123 199 211 252 2.3 3.2 4.1 14.19 43.2 19.5
Manufacturing 2,745 3,077 3,033 3,080 3,132 61.3 58.3 55.0 12.10 (0.7) 1.7
Construction 1,479 1,708 2,017 2,091 2,227 33.9 35.8 38.2 15.45 20.3 6.5
Electricity, Gas and Water
Supply 123 117 150 148 161 2.5 2.7 2.7 (4.90) 17.0 8.8
Services 12,817 15,660 18,682 19,394 19,749 47.5 50.3 52.3 22.18 17.1 1.8
Wholesale and Retail Trade 4,484 6,147 7,034 7,399 7,050 38.3 38.0 36.9 37.09 13.4 (4.7)
Transportation, Storage and
Communications 1,987 2,451 2,723 2,775 2,954 15.6 15.2 14.6 23.40 9.7 6.5
Financing, Insurance, Real
Estate and Business Services 711 1,075 1,546 1,691 1,708 6.3 7.7 8.7 51.20 37.2 1.0
Community, Social and
Personal Services1 5,630 5,986 7,377 7,527 8,035 39.8 39.1 39.8 6.32 20.1 6.7
Others 6 1 2 2 3 0.02 0.01 0.01
(78.26
) 14.3 37.5
Source: National Statistics Office
Notes: 1
2001-2011: Includes Education, Health and Social Work, Other Community, Social and Personal Activities, Private Households with Employed Persons and
Public Administration and Defense, Compulsory Social Security ;
2012-Includes Accommodation and Food Service Activities, Education, Human Health and Social Work Activities, Arts, Entertainment and Recreation, Other
Service Activities and Activities of Households as Employers; Undifferentiated Goods and Services-producing Activities of Households for Own Use, Other
Service Activities
2000 Agriculture data includes Agriculture, Fishery and Forestry

33
Table 6. Labor Productivity by Major Industry Group, Philippines
In 2000 Constant Prices
Major Industry Group
Labor Productivity (In 2000 Constant Prices) Growth Rate (%)
2000 2005 2010 2011 2012 2000-
2005
2006-
2010
2011-
2012
Total 130,433 138,683 158,222 159,293 167,918 6.33 9.49 5.42
Agriculture 49,123 51,317 55,425 55,465 57,815 4.47 4.69 4.24
Industry 277,003 291,669 344,418 343,834 350,759 5.29 12.29 2.01
Mining and Quarrying 209,472 355,390 331,146 334,166 269,110 69.66 5.73 (19.47)
Manufacturing 319,194 345,368 416,922 429,977 445,802 8.20 15.09 3.68
Construction 137,862 116,032 161,537 144,435 155,168 (15.83) 24.45 7.43
Electricity, Gas and Water Supply 1,071,150 1,380,965 1,355,159 1,382,074 1,335,882 28.92 4.96 (3.34)
Services 144,092 154,485 170,183 172,350 181,864 7.21 5.87 5.52
Source: National Statistics Office
Note: Labor productivity= Gross Value Added (GVA in real terms)/ Number of Employed Persons

34
Table 7. Share of Establishments to Total and Growth Rate, by Size Category and Industry
Major Industry Group Total Micro Small Medium Large
Total (2002) 100.00 91.86 7.47 0.34 0.33
Agriculture 0.51 0.24 0.24 0.01 0.02
Industry 15.70 13.71 1.70 0.14 0.15
Mining & Quarrying 0.04 0.03 0.01 0.00 0.00
Manufacturing 15.19 13.44 1.51 0.11 0.13
Construction 0.32 0.18 0.12 0.01 0.01
Electricity, Gas and Water Supply 0.14 0.06 0.06 0.01 0.01
Services 83.79 77.92 5.53 0.18 0.16
Wholesale and Retail Trade 53.66 51.33 2.24 0.05 0.03
Transportation, Storage and Communications 1.75 1.32 0.39 0.02 0.02
Financing, Insurance, Real Estate and Business Services 7.78 6.54 1.15 0.04 0.05
Community, Social and Personal Services 5.02 4.73 0.27 0.01 0.01
Others 15.58 13.99 1.48 0.07 0.05
Total (2005) 100.0 91.3 8.0 0.4 0.3
Agriculture 0.72 0.42 0.26 0.02 0.02
Industry 15.53 13.54 1.68 0.16 0.15
Mining & Quarrying 0.04 0.03 0.01 0.00 0.00
Manufacturing 14.99 13.28 1.45 0.13 0.13
Construction 0.32 0.17 0.13 0.01 0.01
Electricity, Gas and Water Supply 0.18 0.07 0.08 0.01 0.01
Services 83.75 77.31 6.09 0.19 0.16
Wholesale and Retail Trade 49.98 47.43 2.47 0.05 0.03
Transportation, Storage and Communications 1.19 0.87 0.29 0.02 0.01
Financing, Insurance, Real Estate and Business Services 8.85 7.59 1.14 0.05 0.07
Community, Social and Personal Services 5.70 5.37 0.32 0.01 0.01
Others 18.04 16.06 1.87 0.06 0.04
Total (2010) 100.0 91.3 8.0 0.4 0.4
Agriculture 0.66 0.45 0.17 0.02 0.02
Industry 14.95 13.24 1.43 0.14 0.15
Mining & Quarrying 0.05 0.03 0.02 0.00 0.00
Manufacturing 14.38 12.96 1.20 0.10 0.12
Construction 0.31 0.17 0.11 0.02 0.02
Electricity, Gas and Water Supply 0.21 0.08 0.10 0.02 0.01

35
Services 84.39 77.60 6.37 0.20 0.22
Wholesale and Retail Trade 47.79 45.34 2.36 0.05 0.04
Transportation, Storage and Communications 2.31 1.93 0.33 0.02 0.03
Financing, Insurance, Real Estate and Business Services 8.69 7.33 1.22 0.05 0.09
Community, Social and Personal Services 13.12 11.73 1.29 0.05 0.05
Others 12.48 11.27 1.18 0.02 0.01
Total (2011) 100.0 90.6 8.6 0.4 0.4
Agriculture 0.62 0.43 0.16 0.02 0.02
Industry 14.41 12.62 1.48 0.14 0.16
Mining & Quarrying 0.07 0.04 0.02 0.00 0.00
Manufacturing 13.75 12.29 1.22 0.11 0.12
Construction 0.37 0.20 0.14 0.01 0.02
Electricity, Gas and Water Supply 0.22 0.09 0.10 0.02 0.01
Services 84.97 77.56 6.93 0.24 0.25
Wholesale and Retail Trade 46.82 44.15 2.55 0.07 0.05
Transportation, Storage and Communications 3.15 2.72 0.38 0.03 0.03
Financing, Insurance, Real Estate and Business Services 8.86 7.40 1.29 0.06 0.11
Community, Social and Personal Services 13.31 11.86 1.34 0.06 0.05
Others 12.83 11.42 1.37 0.02 0.01
Growth Rate (%)
2002-2005
Total (3.25) (3.87) 3.85 4.97 (0.11)
Agriculture 36.76 73.80 3.12 28.10 8.51
Industry (4.31) (4.45) (4.81) 12.47 (1.31)
Mining & Quarrying (3.06) - (6.32) (44.44) -
Manufacturing (4.54) (4.42) (7.33) 14.79 (0.79)
Construction (4.87) (12.79) 8.57 (1.16) (19.59)
Electricity, Gas and Water Supply 20.85 13.00 32.92 8.16 11.83
Services (3.29) (4.00) 6.54 (2.41) 0.08
Wholesale and Retail Trade (9.88) (10.60) 6.38 0.26 (11.85)
Transportation, Storage and Communications (34.04) (36.40) (27.06) (22.70) (25.00)
Financing, Insurance, Real Estate and Business Services 9.95 12.23 (4.31) 22.83 27.90
Community, Social and Personal Services 9.87 9.68 14.15 (6.90) (14.04)
Others 12.00 11.07 22.67 (13.74) (10.05)
2006-2010

36
Total (0.69) (1.43) 7.90 (1.87) 16.45
Agriculture (9.46) (0.45) (28.28) (6.45) 4.70
Industry (4.32) (3.99) (7.17) (10.76) 0.59
Mining & Quarrying 31.66 7.37 78.05 200.00 73.33
Manufacturing (4.69) (4.10) (9.15) (19.42) (6.19)
Construction (2.89) (5.03) (9.81) 48.81 69.86
Electricity, Gas and Water Supply 15.58 14.85 18.10 14.15 5.77
Services 0.06 (0.98) 13.55 5.79 32.52
Wholesale and Retail Trade (5.06) (5.66) 7.18 9.11 35.62
Transportation, Storage and Communications 90.62 113.33 18.80 39.02 88.60
Financing, Insurance, Real Estate and Business Services (2.10) (4.41) 12.71 (13.64) 32.34
Community, Social and Personal Services 128.29 115.87 328.42 744.00 700.00
Others (31.30) (30.90) (32.65) (65.67) (81.07)
2010-2011
Total 5.47 4.70 13.30 17.98 15.65
Agriculture 0.23 1.54 (2.22) (3.45) (5.13)
Industry 1.60 0.58 9.31 9.44 10.81
Mining & Quarrying 35.71 52.79 10.96 20.00 30.77
Manufacturing 0.84 0.06 7.45 11.12 10.82
Construction 23.92 24.77 29.11 (4.80) 7.26
Electricity, Gas and Water Supply 12.00 16.04 8.87 11.57 10.00
Services 6.20 5.42 14.60 25.78 20.97
Wholesale and Retail Trade 3.33 2.72 14.08 32.94 25.00
Transportation, Storage and Communications 44.34 48.77 22.26 35.67 2.33
Financing, Insurance, Real Estate and Business Services 7.57 6.52 11.11 32.08 30.90
Community, Social and Personal Services 6.95 6.60 9.91 11.37 7.45
Others 8.40 6.91 22.25 18.75 32.81
Source: National Statistics Office
Note: Growth Rate: No Available data for 2012, used period 2010-2011

37
Table 8. Share of Employees to Total and Growth Rate, by Size Category and Industry
Major Industry Group Total Micro Small Medium Large
Total (2002) 100.00 39.84 24.22 6.86 29.07
Agriculture 2.89 0.15 0.84 0.30 1.60
Industry 30.43 6.72 6.23 2.81 14.67
Mining & Quarrying 0.36 0.02 0.05 0.02 0.26
Manufacturing 26.14 6.54 5.47 2.31 11.82
Construction 2.52 0.12 0.44 0.21 1.74
Electricity, Gas and Water Supply 1.41 0.04 0.27 0.26 0.84
Services 66.68 32.98 17.15 3.75 12.80
Wholesale and Retail Trade 29.90 20.52 6.26 0.96 2.16
Transportation, Storage and Communications 5.20 0.73 1.35 0.40 2.71
Financing, Insurance, Real Estate and Business Services 11.67 3.34 3.43 0.88 4.02
Community, Social and Personal Services 3.42 1.95 0.82 0.15 0.50
Others 16.49 6.44 5.28 1.36 3.41
Total (2005) 100.00 37.55 24.88 7.01 30.56
Agriculture 3.27 0.24 0.83 0.40 1.80
Industry 30.30 6.08 5.80 3.02 15.40
Mining & Quarrying 0.28 0.02 0.04 0.01 0.21
Manufacturing 26.71 5.90 4.93 2.51 13.35
Construction 1.78 0.11 0.49 0.21 0.97
Electricity, Gas and Water Supply 1.53 0.05 0.35 0.28 0.86
Services 66.43 31.23 18.25 3.60 13.36
Wholesale and Retail Trade 27.88 18.24 6.79 0.95 1.90
Transportation, Storage and Communications 3.50 0.51 0.97 0.31 1.70
Financing, Insurance, Real Estate and Business Services 14.32 3.51 3.30 1.01 6.50
Community, Social and Personal Services 3.52 2.08 0.82 0.13 0.50
Others 17.22 6.89 6.37 1.20 2.76
Total (2010) 100.00 30.50 25.01 6.81 37.68
Agriculture 2.94 0.23 0.65 0.37 1.69
Industry 27.72 4.73 5.23 2.66 15.10
Mining & Quarrying 0.49 0.02 0.07 0.03 0.37
Manufacturing 22.78 4.55 4.24 1.98 12.00
Construction 2.53 0.09 0.49 0.31 1.64

38
Electricity, Gas and Water Supply 1.76 0.05 0.40 0.31 1.00
Services 69.34 25.54 19.12 3.78 20.90
Wholesale and Retail Trade 23.81 13.98 6.37 1.01 2.45
Transportation, Storage and Communications 5.02 0.73 1.19 0.41 2.70
Financing, Insurance, Real Estate and Business Services 19.90 3.15 3.52 0.97 12.26
Community, Social and Personal Services 11.89 3.57 4.11 1.05 3.16
Others 8.71 4.11 3.93 0.35 0.33
Total (2011) 100.00 28.02 25.88 7.12 38.98
Agriculture 2.77 0.21 0.57 0.30 1.69
Industry 26.33 4.18 5.26 2.56 14.32
Mining & Quarrying 0.67 0.02 0.08 0.04 0.53
Manufacturing 21.64 4.00 4.26 1.96 11.42
Construction 2.27 0.10 0.54 0.26 1.37
Electricity, Gas and Water Supply 1.75 0.05 0.39 0.31 1.00
Services 70.91 23.64 20.05 4.25 22.96
Wholesale and Retail Trade 23.44 12.70 6.79 1.20 2.75
Transportation, Storage and Communications 5.06 0.79 1.34 0.49 2.45
Financing, Insurance, Real Estate and Business Services 21.95 2.93 3.62 1.14 14.27
Community, Social and Personal Services 11.37 3.41 4.01 1.03 2.92
Others 9.08 3.81 4.29 0.39 0.58
Average Annual Growth Rate (%)
2002-2005
Total 1.52 (4.32) 4.25 3.71 6.72
Agriculture 14.84 69.26 0.12 32.80 14.16
Industry 1.07 (8.15) (5.46) 9.02 6.55
Mining & Quarrying (21.15) (4.98) (34.09) (40.76) (17.72)
Manufacturing 3.73 (8.29) (8.37) 10.27 14.68
Construction (28.38) (12.47) 12.29 1.97 (43.49)
Electricity, Gas and Water Supply 10.30 27.07 30.47 8.44 3.64
Services 1.14 (3.87) 7.98 (2.61) 5.98
Wholesale and Retail Trade (5.37) (9.74) 10.02 0.27 (11.01)
Transportation, Storage and Communications (31.73) (29.70) (27.11) (21.33) (36.13)
Financing, Insurance, Real Estate and Business Services 24.56 6.77 (2.36) 16.60 64.02
Community, Social and Personal Services 4.63 8.38 0.91 (12.19) 1.14
Others 6.00 8.53 22.38 (10.50) (17.58)

39
2006-2010
Total 13.73 3.67 10.84 1.35 28.93
Agriculture (4.40) 0.18 (12.31) (3.84) (1.73)
Industry 0.38 (0.26) (0.72) (5.72) 2.14
Mining & Quarrying 88.41 9.41 106.61 145.61 87.29
Manufacturing (5.94) (0.60) (4.98) (15.07) (6.53)
Construction 52.28 (4.03) 9.40 50.39 79.83
Electricity, Gas and Water Supply 19.67 13.43 20.12 15.62 21.15
Services 21.15 4.47 15.56 7.58 64.63
Wholesale and Retail Trade 5.16 0.27 6.53 9.78 36.15
Transportation, Storage and Communications 53.83 59.70 33.38 39.16 66.03
Financing, Insurance, Real Estate and Business Services 49.96 4.56 14.90 (6.68) 99.21
Community, Social and Personal Services 294.19 112.18 447.71 802.49 632.54
Others (42.09) (23.22) (32.96) (69.68) (87.86)
2010-2011
Total 11.93 2.85 15.86 16.94 15.77
Agriculture 5.18 (1.78) (1.90) (8.70) 11.91
Industry 6.33 (1.09) 12.59 7.97 6.19
Mining & Quarrying 52.60 45.59 30.45 20.05 59.97
Manufacturing 6.36 (1.62) 12.39 10.80 6.51
Construction 0.42 20.30 23.94 (6.05) (6.54)
Electricity, Gas and Water Supply 10.82 11.36 9.09 11.29 11.32
Services 14.46 3.62 17.36 25.73 23.01
Wholesale and Retail Trade 10.22 1.72 19.30 32.85 25.79
Transportation, Storage and Communications 12.82 21.08 26.19 34.40 1.45
Financing, Insurance, Real Estate and Business Services 23.45 4.07 15.02 30.80 30.26
Community, Social and Personal Services 7.00 6.80 9.05 10.55 3.36
Others 16.63 3.86 22.33 26.50 98.56
Source: National Statistics Office
Note: Growth Rate: No Available data for 2012, used period 2010-2011
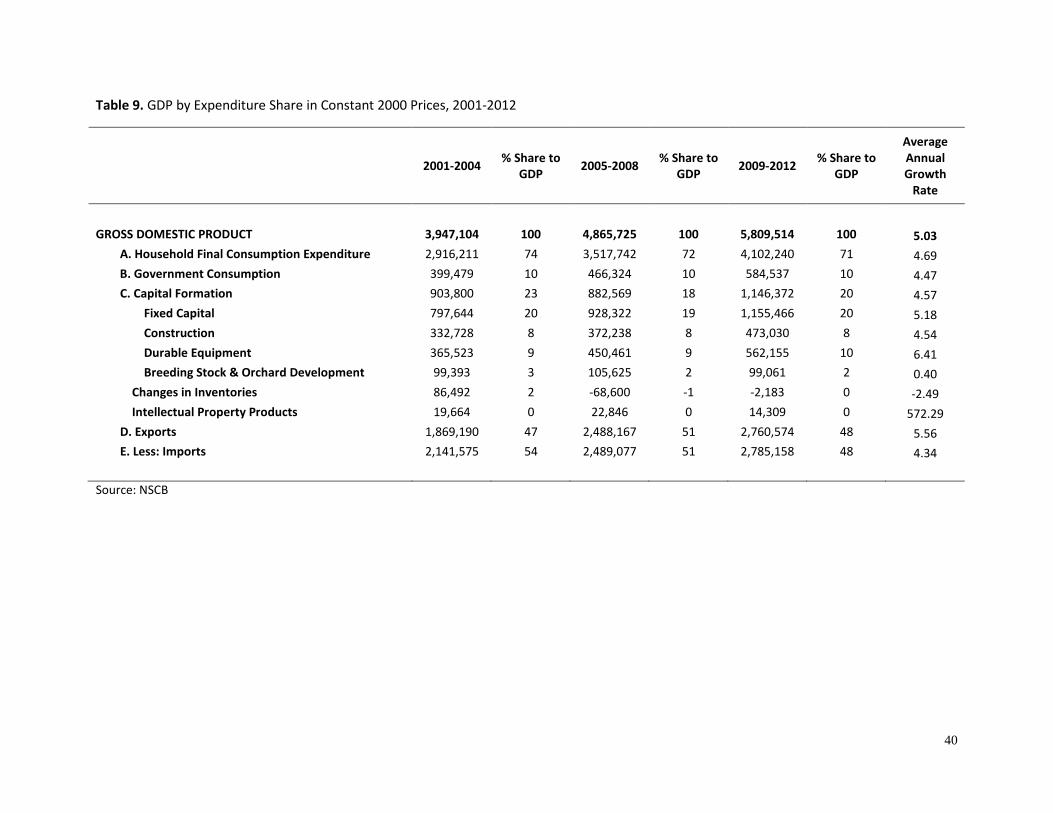
40
Table 9. GDP by Expenditure Share in Constant 2000 Prices, 2001-2012
2001-2004 % Share to
GDP 2005-2008
% Share to
GDP 2009-2012
% Share to
GDP
Average
Annual
Growth
Rate
GROSS DOMESTIC PRODUCT 3,947,104 100 4,865,725 100 5,809,514 100 5.03
A. Household Final Consumption Expenditure 2,916,211 74 3,517,742 72 4,102,240 71 4.69
B. Government Consumption 399,479 10 466,324 10 584,537 10 4.47
C. Capital Formation 903,800 23 882,569 18 1,146,372 20 4.57
Fixed Capital 797,644 20 928,322 19 1,155,466 20 5.18
Construction 332,728 8 372,238 8 473,030 8 4.54
Durable Equipment 365,523 9 450,461 9 562,155 10 6.41
Breeding Stock & Orchard Development 99,393 3 105,625 2 99,061 2 0.40
Changes in Inventories 86,492 2 -68,600 -1 -2,183 0 -2.49
Intellectual Property Products 19,664 0 22,846 0 14,309 0 572.29
D. Exports 1,869,190 47 2,488,167 51 2,760,574 48 5.56
E. Less: Imports 2,141,575 54 2,489,077 51 2,785,158 48 4.34
Source: NSCB

41
Table 10. Gross Regional Domestic Product Growth Rate, 2000-2012 In Constant Prices
Region 2000-2004 2005-2008 2009-2012
Philippines 4.7 5.3 4.79
NCR 5.4 6.7 4.41
CAR 2.8 3.3 2.65
I 3.8 4.8 3.40
II 3.0 2.9 3.64
III 4.0 4.2 5.68
IV-A 4.2 3.5
IV-B 6.6 5.2 4.55
V 4.7 4.9 2.31
VI 4.9 5.5 5.60
VII 5.1 5.7 5.82
VIII 3.6 3.7 7.32
IX 3.2 4.6 (0.10)
X 10.0 6.1 5.73
XI (1.0) 4.7 5.75
XII 11.8 5.0 5.38
XIII 3.3 5.4 4.19
ARMM 3.0 3.7 7.29
Source: National Statistical Coordination Board
Notes:
2000-2008: 1985 Constant Prices
2009-2012: 2000 Constant Prices

42
Table 11. Labor Productivity, by Region, 2000-2011
In Constant Prices
Region 2000-2004 2005-2008 2009-2011
Philippines 35,146 39,722 150,463
NCR 82,903 106,137 449,394
CAR 45,283 45,330 163,296
I 19,970 22,505 89,580
II 18,784 19,516 70,567
III 32,205 32,942 129,495
IV-A 39,838 39,641 208,838
IV-B 33,229 33,712 84,195
V 16,259 18,769 54,355
VI 29,757 34,467 73,985
VII 34,756 37,485 112,452
VIII 15,863 17,746 87,646
IX 24,266 26,839 84,022
X 31,751 37,211 108,358
XI 31,439 36,297 119,410
XII 27,429 30,998 91,196
XIII 16,476 18,376 60,385
ARMM 11,755 11,175 39,430
Source: National Statistical Coordination Board and National Statistics Office
Notes:
2000-2008: 1985 Constant Prices
2009-2011: 2000 Constant Prices
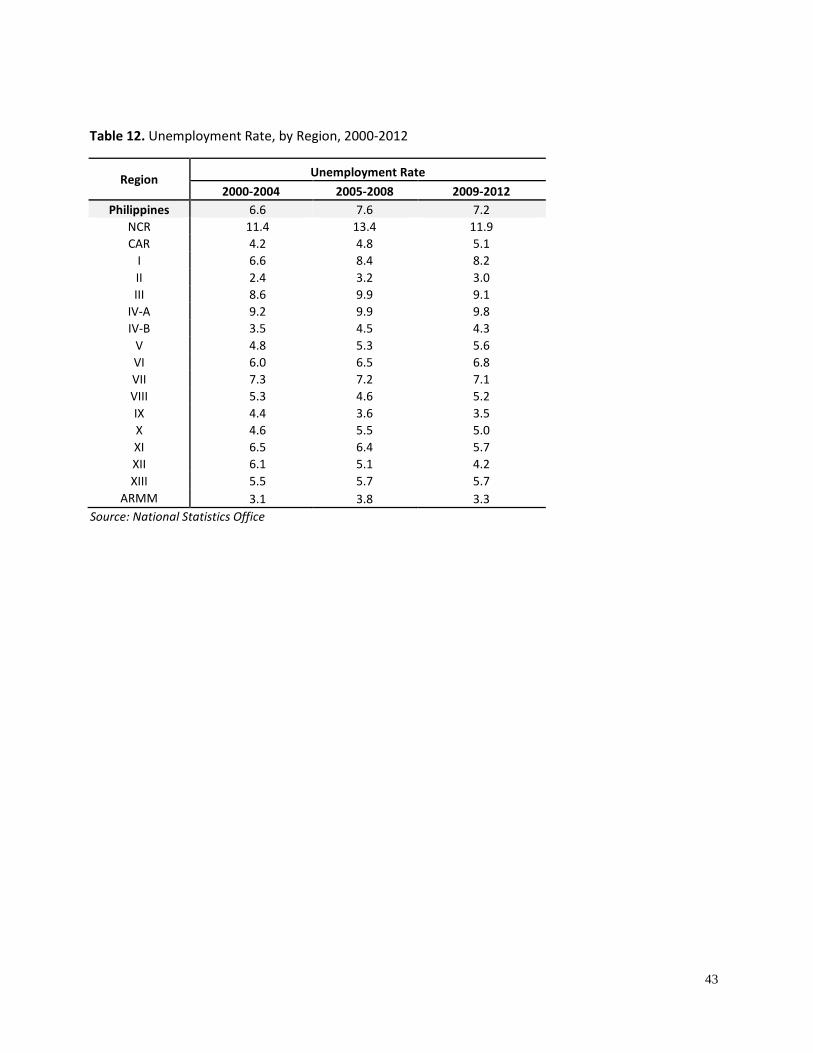
43
Table 12. Unemployment Rate, by Region, 2000-2012
Region Unemployment Rate
2000-2004 2005-2008 2009-2012
Philippines 6.6 7.6 7.2
NCR 11.4 13.4 11.9
CAR 4.2 4.8 5.1
I 6.6 8.4 8.2
II 2.4 3.2 3.0
III 8.6 9.9 9.1
IV-A 9.2 9.9 9.8
IV-B 3.5 4.5 4.3
V 4.8 5.3 5.6
VI 6.0 6.5 6.8
VII 7.3 7.2 7.1
VIII 5.3 4.6 5.2
IX 4.4 3.6 3.5
X 4.6 5.5 5.0
XI 6.5 6.4 5.7
XII 6.1 5.1 4.2
XIII 5.5 5.7 5.7
ARMM 3.1 3.8 3.3
Source: National Statistics Office

44
Table 13. Underemployment Rate, by Region, 2000-2012
Region 2000-2004 2005-2008 2009-2012
Philippines 18.1 20.8 19.3
NCR 11.5 14.1 13.0
CAR 15.0 19.9 16.7
I 15.5 18.3 17.6
II 19.7 20.0 15.1
III 8.9 10.9 9.6
IV-A 12.2 16.7 17.2
IV-B 16.5 24.8 24.0
V 32.0 36.5 35.9
VI 22.3 24.9 23.9
VII 11.1 17.9 17.0
VIII 25.7 28.7 24.7
IX 19.6 23.9 23.6
X 30.4 30.6 28.7
XI 24.3 22.0 18.9
XII 23.8 25.7 21.8
XIII 21.3 25.8 24.3
ARMM 11.0 15.3 13.3
Source: National Statistics Office

45
Table 14. Share of Establishments to Total and Growth Rate, by Size Category and Region
2005 2011
Total Micro Small Medium Large Total Micro Small Medium Large
Philippines 100.00 91.28 8.02 0.36 0.34 100.00 90.61 8.56 0.40 0.43
NCR 24.96 21.44 3.22 0.16 0.14 26.04 21.97 3.70 0.18 0.20
CAR 1.89 1.77 0.11 0.00 0.00 1.87 1.76 0.10 0.00 0.00
I 5.64 5.35 0.27 0.01 0.00 5.30 5.05 0.24 0.01 0.00
II 3.06 2.94 0.12 0.00 0.00 2.96 2.84 0.12 0.00 0.00
III 10.78 10.00 0.73 0.03 0.02 10.18 9.37 0.75 0.03 0.02
IV-A 14.58 13.47 0.98 0.06 0.07 15.02 13.93 0.95 0.06 0.07
IV-B 2.96 2.81 0.15 0.00 0.00 2.78 2.65 0.13 0.00 0.00
V 4.04 3.82 0.21 0.01 0.00 3.26 3.05 0.20 0.01 0.00
VI 5.91 5.44 0.44 0.02 0.01 5.77 5.29 0.44 0.02 0.02
VII 5.67 5.06 0.54 0.03 0.03 6.15 5.50 0.57 0.03 0.04
VIII 2.65 2.50 0.14 0.00 0.00 2.24 2.11 0.13 0.01 0.00
IX 3.23 3.05 0.16 0.00 0.00 3.32 3.14 0.17 0.01 0.01
X 3.76 3.46 0.28 0.01 0.01 3.64 3.30 0.31 0.01 0.01
XI 4.69 4.30 0.35 0.02 0.02 4.92 4.48 0.40 0.02 0.02
XII 3.40 3.18 0.20 0.01 0.01 3.86 3.62 0.22 0.01 0.01
XIII 1.73 1.63 0.10 0.00 0.00 1.69 1.57 0.11 0.00 0.00
ARMM 1.06 1.02 0.03 0.00 0.00 1.00 0.97 0.03 0.00 0.00
Source: National Statistics Office
Growth Rate (%)
Total MICRO SMALL MEDIUM LARGE
PHILIPPINES (2002-2005) (44.1) (44.7) (38.2) (36.8) (38.5)
NATIONAL CAPITAL REGION (14.8) (14.0) (18.5) (17.0) (28.0)
CORDILLERA ADMINISTRATIVE REGION (65.3) (65.1) (66.8) (74.2) (74.7)
ILOCOS REGION (8.8) (9.1) (2.1) (11.1) 6.7
CAGAYAN VALLEY (4.5) (4.6) (0.5) (23.8) (22.7)
CENTRAL LUZON (4.0) (4.5) 3.7 (2.3) (5.6)
SOUTHERN TAGALOG (21.5) (22.5) (8.1) 1.6 8.6
BICOL REGION (70.9) (71.0) (68.4) (86.9) (85.5)
WESTERN VISAYAS (55.6) (55.3) (59.3) (64.8) (77.7)

46
CENTRAL VISAYAS (66.4) (66.4) (66.4) (67.8) (72.6)
EASTERN VISAYAS (73.5) (74.7) (57.3) (53.6) (50.4)
ZAMBOANGA PENINSULA (65.3) (65.4) (63.1) (67.0) (75.4)
NORTHERN MINDANAO (65.9) (65.2) (74.7) (82.9) (77.6)
DAVAO REGION (69.9) (69.6) (72.4) (76.5) (79.3)
SOCCSKSARGEN (15.3) (17.9) 28.8 54.8 160.0
CARAGA (30.2) (31.3) (8.3) (6.5) 16.3
AUTONOMOUS REGION IN MUSLIM MINDANAO (74.8) (74.4) (79.0) (85.2) (82.8)
PHILIPPINES (2006-2010) (0.7) (0.7) (1.3) (2.3) 14.4
NATIONAL CAPITAL REGION 7.8 7.4 10.1 0.7 22.8
CORDILLERA ADMINISTRATIVE REGION (4.6) (4.1) (13.7) 25.0 21.1
ILOCOS REGION (4.4) (3.6) (21.1) 20.8 3.1
CAGAYAN VALLEY (1.1) (0.8) (10.1) 56.3 23.5
CENTRAL LUZON (6.1) (6.1) (7.5) (4.3) 17.6
CALABARZON 0.2 0.9 (8.4) (22.2) (4.8)
MIMAROPA (3.1) (2.1) (20.2) (7.1) 30.0
BICOL REGION (13.3) (13.6) (8.1) 15.9 36.0
WESTERN VISAYAS (2.1) (1.8) (7.0) 4.3 26.4
CENTRAL VISAYAS 2.8 3.4 (2.2) (12.6) 8.7
EASTERN VISAYAS (13.3) (13.5) (11.0) 12.1 64.7
ZAMBOANGA PENINSULA (4.0) (3.2) (20.8) 5.6 5.4
NORTHERN MINDANAO (3.3) (3.6) (1.0) 14.1 15.5
DAVAO REGION 0.0 0.6 (7.8) 12.3 6.9
SOCCSKSARGEN (6.4) (5.8) (17.3) 1.7 31.6
CARAGA (9.3) (10.1) 3.3 13.6 3.4
AUTONOMOUS REGION IN MUSLIM MINDANAO (3.5) (3.0) (22.4) 44.4 -
PHILIPPINES (2010-2011) 5.5 4.7 13.3 18.0 15.6
NATIONAL CAPITAL REGION 1.4 (0.0) 9.3 18.7 19.9
CORDILLERA ADMINISTRATIVE REGION 8.8 9.1 3.6 (3.3) 17.4
ILOCOS REGION 3.1 2.6 14.2 13.8 18.2
CAGAYAN VALLEY 2.4 1.8 18.0 16.0 (4.8)
CENTRAL LUZON 5.4 4.4 17.8 31.2 (1.5)
CALABARZON 7.7 7.3 11.6 19.3 17.7
MIMAROPA 1.4 1.0 8.9 76.9 30.8
BICOL REGION (2.4) (3.2) 11.5 7.8 5.9

47
WESTERN VISAYAS 4.4 3.7 13.4 13.9 (3.6)
CENTRAL VISAYAS 10.5 10.2 13.8 11.7 16.0
EASTERN VISAYAS 2.1 1.9 5.4 16.2 (7.1)
ZAMBOANGA PENINSULA 12.4 11.2 39.6 39.5 20.5
NORTHERN MINDANAO 5.0 3.6 19.5 29.2 32.9
DAVAO REGION 9.8 8.5 27.9 8.9 12.9
SOCCSKSARGEN 27.0 26.5 37.2 (3.4) 1.3
CARAGA 13.0 12.4 20.1 24.0 16.7
AUTONOMOUS REGION IN MUSLIM MINDANAO 2.8 2.6 15.3 (38.5) 20.0
Note: Growth Rate: No Available data for 2012, used period 2010-2011

48
Table 15. Share of Employees to Total and Growth Rate, by Size Category and Region
2005 2011
Total Micro Small Medium Large Total Micro Small Medium Large
Philippines 100.00 35.79 23.71 6.68 29.13 100.00 28.02 25.88 7.12 38.98
NCR 34.38 9.11 10.01 2.90 12.35 43.23 7.83 11.68 3.18 20.55
CAR 1.23 0.61 0.30 0.06 0.26 1.16 0.47 0.27 0.06 0.36
I 3.05 2.01 0.72 0.12 0.20 2.49 1.40 0.67 0.14 0.28
II 1.55 1.11 0.30 0.04 0.09 1.26 0.77 0.31 0.06 0.12
III 8.35 3.85 2.06 0.51 1.93 7.30 2.76 2.23 0.58 1.72
IV-A 16.09 5.07 2.98 1.13 6.90 14.93 3.96 3.00 1.01 6.96
IV-B 1.45 1.03 0.33 0.04 0.05 1.16 0.70 0.32 0.05 0.09
V 2.26 1.45 0.55 0.10 0.16 1.90 0.96 0.56 0.12 0.27
VI 4.56 2.11 1.26 0.32 0.86 4.26 1.64 1.26 0.35 1.02
VII 7.01 2.01 1.63 0.58 2.78 7.58 1.78 1.75 0.54 3.51
VIII 1.57 1.01 0.37 0.08 0.11 1.27 0.66 0.34 0.09 0.18
IX 1.95 1.12 0.46 0.09 0.28 1.76 0.84 0.47 0.12 0.32
X 3.04 1.35 0.78 0.18 0.72 3.16 1.05 0.88 0.26 0.98
XI 4.30 1.68 1.04 0.31 1.28 4.33 1.43 1.14 0.35 1.41
XII 2.72 1.22 0.55 0.15 0.81 2.57 1.02 0.62 0.13 0.80
XIII 1.17 0.63 0.26 0.94 0.22 1.16 0.47 0.30 0.07 0.31
ARMM 0.63 0.42 0.08 0.02 0.12 0.48 0.28 0.08 0.02 0.10
Source: National Statistics Office
Growth Rate (%)
Total MICRO SMALL MEDIUM LARGE
PHILIPPINES (2002-2005) 6.5 (4.3) 4.3 3.7 6.7
NATIONAL CAPITAL REGION (6.1) (3.8) (1.4) (2.7) (11.8)
CORDILLERA ADMINISTRATIVE REGION 6.1 (0.5) 27.0 10.0 1.7
ILOCOS REGION (3.1) (3.5) 5.6 (13.9) (18.2)
CAGAYAN VALLEY (5.6) (4.7) (1.8) (9.5) (22.4)

49
Growth Rate (%)
Total MICRO SMALL MEDIUM LARGE
CENTRAL LUZON 6.8 (6.2) 16.1 17.9 28.0
SOUTHERN TAGALOG 6.8 (20.1) 2.2 20.0 42.3
BICOL REGION (36.9) (28.2) (37.1) (71.0) (74.5)
WESTERN VISAYAS (49.7) (32.5) (50.6) (71.9) (81.9)
CENTRAL VISAYAS (31.0) (5.5) (21.5) (34.3) (62.0)
EASTERN VISAYAS 326.2 98.0 345.2 501.5 1,587.7
ZAMBOANGA PENINSULA (19.0) (11.4) (16.9) (18.9) (57.2)
NORTHERN MINDANAO (35.7) (25.9) (37.8) (56.2) (50.7)
DAVAO REGION (26.0) (18.0) (22.8) (33.9) (38.3)
SOCCSKSARGEN 95.6 36.7 143.7 242.4 180.7
CARAGA 126.6 69.0 114.8 146.6 387.7
AUTONOMOUS REGION IN MUSLIM MINDANAO 25.9 16.0 61.5 1,820.8 27.3
PHILIPPINES (2005-2010) (1.4) (16.0) 4.0 0.5 27.6
NATIONAL CAPITAL REGION 22.5 (5.0) 14.0 2.7 54.3
CORDILLERA ADMINISTRATIVE REGION (3.2) (16.8) (7.4) 29.3 26.8
ILOCOS REGION (17.5) (23.5) (14.9) 19.1 11.4
CAGAYAN VALLEY (14.4) (23.6) (3.7) 42.9 36.4
CENTRAL LUZON (10.4) (24.4) (1.3) (4.3) 6.0
CALABARZON (9.5) (18.7) (2.0) (16.2) (4.8)
MIMAROPA (11.2) (16.8) (3.4) (12.9) 50.7
BICOL REGION (5.3) (20.7) (1.5) 18.0 107.9
WESTERN VISAYAS (4.8) (18.0) (4.7) 7.2 22.6
CENTRAL VISAYAS 2.6 (9.9) 3.9 (8.7) 13.2
EASTERN VISAYAS (13.5) (26.9) (3.0) 12.4 57.9
ZAMBOANGA PENINSULA (14.4) (23.7) (17.6) 0.7 21.6
NORTHERN MINDANAO 1.0 (14.9) 2.4 22.7 23.8
DAVAO REGION (4.4) (13.6) (7.8) 18.1 4.9
SOCCSKSARGEN 0.2 (21.8) (11.5) 2.3 40.7

50
Growth Rate (%)
Total MICRO SMALL MEDIUM LARGE
CARAGA (9.6) (20.6) 8.8 (93.8) (2.9)
AUTONOMOUS REGION IN MUSLIM MINDANAO (23.2) (27.6) (12.6) 27.7 (28.9)
PHILIPPINES (2010-2011) 11.9 2.8 15.9 16.9 15.8
NATIONAL CAPITAL REGION 13.3 (0.1) 12.9 17.7 19.0
CORDILLERA ADMINISTRATIVE REGION 8.1 2.1 5.0 (4.2) 22.9
ILOCOS REGION 9.1 0.3 20.4 11.7 36.3
CAGAYAN VALLEY 5.1 0.1 17.1 15.2 6.1
CENTRAL LUZON 7.7 4.5 21.1 32.3 (6.9)
CALABARZON 13.2 6.0 13.4 17.9 16.9
MIMAROPA (0.6) (9.5) 12.5 66.4 16.1
BICOL REGION (1.8) (8.0) 13.7 10.9 (10.1)
WESTERN VISAYAS 8.3 4.8 15.0 10.3 5.9
CENTRAL VISAYAS 16.2 8.5 13.8 10.9 22.9
EASTERN VISAYAS 3.0 (2.1) 3.2 13.1 19.5
ZAMBOANGA PENINSULA 16.1 8.9 37.7 40.3 3.6
NORTHERN MINDANAO 13.9 0.3 22.1 25.5 21.1
DAVAO REGION 16.3 9.2 31.7 7.1 15.7
SOCCSKSARGEN 4.1 19.0 38.9 (4.8) (22.0)
CARAGA 21.4 4.8 20.5 27.4 59.2
AUTONOMOUS REGION IN MUSLIM MINDANAO 8.3 2.7 20.8 (27.1) 29.4
Note: Growth Rate: No Available data for 2012, used period 2010-2011
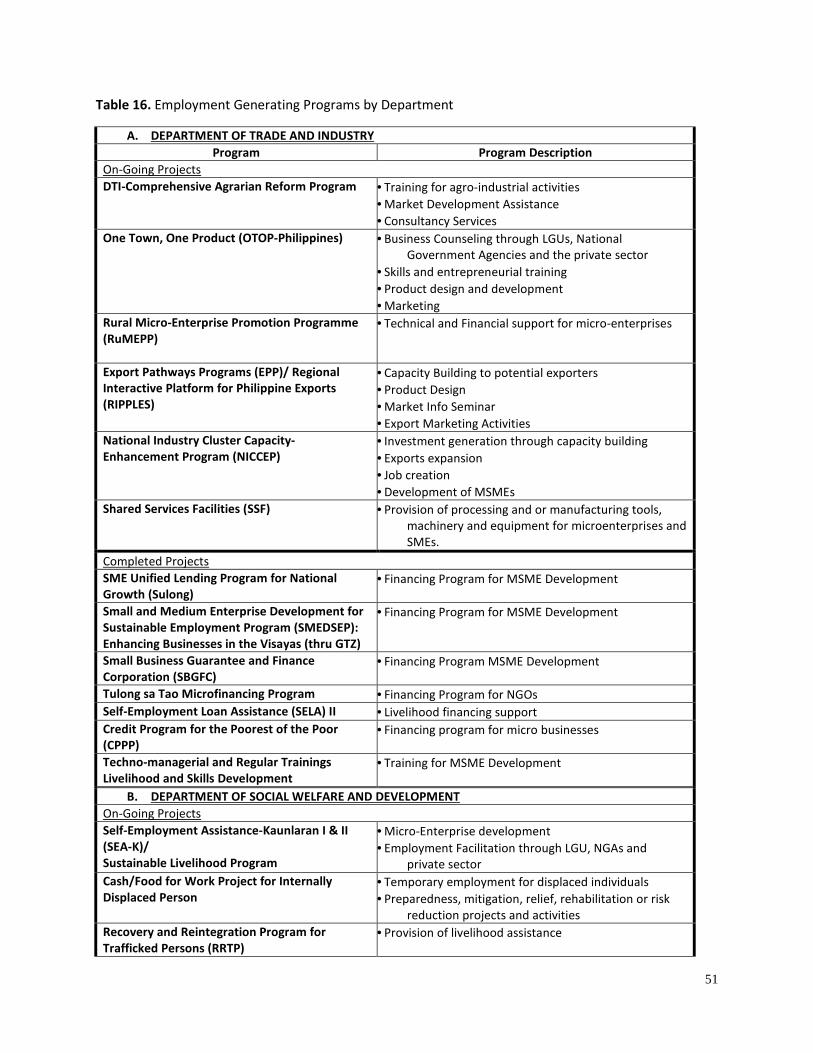
51
Table 16. Employment Generating Programs by Department
A. DEPARTMENT OF TRADE AND INDUSTRY
Program Program Description
On-Going Projects
DTI-Comprehensive Agrarian Reform Program • Training for agro-industrial activities
• Market Development Assistance
• Consultancy Services
One Town, One Product (OTOP-Philippines) • Business Counseling through LGUs, National
Government Agencies and the private sector
• Skills and entrepreneurial training
• Product design and development
• Marketing
Rural Micro-Enterprise Promotion Programme
(RuMEPP)
• Technical and Financial support for micro-enterprises
Export Pathways Programs (EPP)/ Regional
Interactive Platform for Philippine Exports
(RIPPLES)
• Capacity Building to potential exporters
• Product Design
• Market Info Seminar
• Export Marketing Activities
National Industry Cluster Capacity-
Enhancement Program (NICCEP)
• Investment generation through capacity building
• Exports expansion
• Job creation
• Development of MSMEs
Shared Services Facilities (SSF) • Provision of processing and or manufacturing tools,
machinery and equipment for microenterprises and
SMEs.
Completed Projects
SME Unified Lending Program for National
Growth (Sulong)
• Financing Program for MSME Development
Small and Medium Enterprise Development for
Sustainable Employment Program (SMEDSEP):
Enhancing Businesses in the Visayas (thru GTZ)
• Financing Program for MSME Development
Small Business Guarantee and Finance
Corporation (SBGFC)
• Financing Program MSME Development
Tulong sa Tao Microfinancing Program • Financing Program for NGOs
Self-Employment Loan Assistance (SELA) II • Livelihood financing support
Credit Program for the Poorest of the Poor
(CPPP)
• Financing program for micro businesses
Techno-managerial and Regular Trainings
Livelihood and Skills Development
• Training for MSME Development
B. DEPARTMENT OF SOCIAL WELFARE AND DEVELOPMENT
On-Going Projects
Self-Employment Assistance-Kaunlaran I & II
(SEA-K)/
Sustainable Livelihood Program
• Micro-Enterprise development
• Employment Facilitation through LGU, NGAs and
private sector
Cash/Food for Work Project for Internally
Displaced Person
• Temporary employment for displaced individuals
• Preparedness, mitigation, relief, rehabilitation or risk
reduction projects and activities
Recovery and Reintegration Program for
Trafficked Persons (RRTP)
• Provision of livelihood assistance

52
Government Internship Program • Internship program for both out-of-school youth and in-
school youths
Comprehensive Program for Street Children,
Street Families and Ips Especially Bajaus
• Educational Assistance
• Provide psycho-social services for healing and
development
• Livelihood Assistance
Kapit-Bisig Laban sa Kahirapan-Comprehensive
and Integrated Delivery of Social Services
(Kalahi-CIDSSS)
• Enhancing community and LGU capacity
• Provide seed funding for community implementation of
projects
Completed Projects
Job Network Services • Job matching
• Occupational guidance and counseling
• Granting of cash assistance
Youth Productivity Service • Technical/vocational training for out-of-school youth, in
partnership with local government units,
corporations, industries and other concerned
agencies.
Tindahan Natin • Livelihood assistance program
C. DEPARTMENT OF TOURISM
Completed Program
Grassroots Entrepreneurship
for Eco Tourism (GREET) program
• Financing for tourism-related livelihood/ micro-
enterprise projects
D. DEPARTMENT OF AGRARIAN REFORM
On-Going Projects
Agrarian Reform Infrastructure Support Project
III (ARISP III)
• Provision of support services like infrastructure, credit,
training, technology and community organizing in
land reform areas
Agrarian Reform Communities Project II (Phase
II)
• Provision of support services like infrastructure, credit,
training, technology and community organizing in
land reform areas
Tulay ng Pangulo Para sa Kaunlarang Pang-
Agraryo (TPKP)
• Provision of support services like infrastructure, credit,
training, technology and community organizing in
land reform areas
Italian Assistance to Agrarian Reform
Communities Development Support Program
(IARCDSP)
• Provision of support services like infrastructure, credit,
training, technology and community organizing in
land reform areas
Mindanao Sustainable Agrarian and Agriculture
Development Project (MinSAAD)
• Provision of support services like infrastructure, credit,
training, technology and community organizing in
land reform areas
Bridge Construction Project for Expanded ARCs
Dev. (Umiray Bridge)
• Provision of support services like infrastructure, credit,
training, technology and community organizing in
land reform areas
Completed Projects
Agrarian Reform Infrastructure Support Project
(ARISP)
• Provision of support services like infrastructure, credit,
training, technology and community organizing in
land reform areas
Agrarian Reform Support Project (ARSP) • Provision of support services like infrastructure, credit,
training, technology and community organizing in
land reform areas

53
Poverty Alleviation Program for Social Reform
Agenda (PAPSRA): Support to Selected
Indigenous Cultural Communities (ICCs) and
Agrarian Reform Communities in Mindanao
• Provision of support services like infrastructure, credit,
training, technology and community organizing in
land reform areas
Agrarian Reform Communities Development
Project (ARCDP)
• Provision of support services like infrastructure, credit,
training, technology and community organizing in
land reform areas
Belgian Integrated Agrarian Reform Support
Project (BIARSP)
• Provision of support services like infrastructure, credit,
training, technology and community organizing in
land reform areas
Development of Agrarian Reform Communities
in Marginal Areas (DARCMA)
• Provision of support services like infrastructure, credit,
training, technology and community organizing in
land reform areas
Solar Power Technology Support Project to
Agrarian Reform Community Initiatives and
Resource Management Project (SPOTS I)
• Provision of support services like infrastructure, credit,
training, technology and community organizing in
land reform areas
Agrarian Reform Infrastructure Support Project
II (ARISP II)
• Provision of support services like infrastructure, credit,
training, technology and community organizing in
land reform areas
Belgian Integrated Agrarian Reform Support
Project (BIARSP) III
• Provision of support services like infrastructure, credit,
training, technology and community organizing in
land reform areas
Agrarian Reform Communities Project (ARCP) • Provision of support services like infrastructure, credit,
training, technology and community organizing in
land reform areas
Western Minandanao Community Initiatives
Proejct (WMCIP)
• Provision of support services like infrastructure, credit,
training, technology and community organizing in
land reform areas
Support to Agrarian Reform in Central
Mindanao (STARCM)
• Provision of support services like infrastructure, credit,
training, technology and community organizing in
land reform areas
Solar Power Technology Support Project to
Agrarian Reform
• Provision of support services like infrastructure, credit,
training, technology and community organizing in
land reform areas
Mindanao Sustainable Settlement Area Dev't
Project(MINSSAD)
• Provision of support services like infrastructure, credit,
training, technology and community organizing in
land reform areas
Northern Mindanao Community Initiatives and
Resource Management Proejct (NMICIREMP)
(SOP Grant)
• Provision of support services like infrastructure, credit,
training, technology and community organizing in
land reform areas
Project for Bridge Construction for Expanded
ARCs Development (Basal)
• Provision of support services like infrastructure, credit,
training, technology and community organizing in
land reform areas
Second Agrarian Reform Communities
Development Project
• Provision of support services like infrastructure, credit,
training, technology and community organizing in
land reform areas
E. DEPARTMENT OF LABOR AND EMPLOYMENT
On-Going Projects
Special Program for Employment of Students
(SPES)
• On the job training

54
Kasanayan at Hanapbuhay (KasH) Program
• Training for new graduates and young workers
DOLE Integrated Livelihood Program • Develop sustainable enterprises in community groups
Self-Reliant Organization for Comprehensive
Agrarian Reform Program (SRO-CARP)
• Provides organizational and technical assistance and
other support services to agrarian reform farm
workers/beneficiaries turned farm-
owners/managers
Workers Organization and Development
Program (WODP)
• Provides training, education, information and
entrepreneurship development assistance
Reintegration Program for OFWs • Training on financial literacy and entrepreneurial
development training
• Provision of credit facility for those who may wish to
start their business
TULAY 2000 (Tulong Alalay sa mga Taong may
Kapansanan)
• Skills training programs suited to their interests,
potentials and circumstances;
• Facilitates placement to wage employment
• Provides technical and financial livelihood support
assistance either as individual or group
Katulong at Gabay sa mga Manggagawang may
Kapansanan (KAGABAY)
• Integration of occupational disabled workers into the
economic mainstream
DOLE –Adjustment Measures Program (DOLE-
AMP)
• Livelihood assistance
• Training/retraining services
Worktrep Program (Unlad Kabuhayan Laban sa
Kahirapan)
• Improve socio-economic well-being of the poor IS-
Worktreps
Promotion of Rural Employ-ment and Self-
Employment and Entrepreneurship
Development (PRESEED)
• Provides access to a package of integrated services,
from human and institutional development to a
more comprehensive entrepreneurial development
support system
Women Workers Employment and
Entrepreneurship Development (WEED)
• Provides Entrepreneurship Development Training (EDT)
and the Appropriate Skills training (AST).
Completed Projects
Classroom Galing sa Mamamayang Pilipino
Abroad (CGMA)
• Generate employment through construction of
classrooms
OFW Groceria Project
• Financing program (in the form of P50 thousand worth
of grocery items and goods) for OFW Family Circles
OFW Enterprise Development • Provision of technical and financial assistance to OFWs
and their families
Poverty-Free Zone (PFZ) Program (Aksyon ng
Sambayanan Laban sa Kahirapan)
• Delivers a package of organizational, entrepreneurship
and training interventions to identified
communities
Working Youth Center (WYC) Program
• Setting up of and provision of assistance to WYCs
(upliftment of their socio-economic well-being)
• Organization and strengthening of working youth
associations/ organizations
• Facilitation of the delivery of existing programs to the
young workers such as (training, employment and
other programs)
• Enlightenment of the young workers on government
laws, rules and regulations and on other issues
relating to their employment; and
• Mobilization of all sectors and available resources in

55
undertaking programs, services and activities
F. DEPARTMENT OF AGRICULTURE
On-going Projects
Agricultural and Fisheries Modernization Act
(AFMA)
• Job creation through SME Development
Credit Programs of Landbank • Job creation through SME Development
Office of the One Million Jobs Program • Job creation through DA programs
Medium-Term Philippine Development Plan
Related Employment (2004-2010)
• Job creation through DA programs
G. DEPARTMENT OF PUBLIC WORKS AND HIGHWAYS
On-going Projects
President's Roadside Maintenance Program
(Kalsada Natin, Alagaan Natin)
• Public Works
Job Creation KNAN on Roadside Maintenance • Public Works
Out of School Youth Toward Economic Recovery
(OYSTER)
• Public Works-Community Roads
Job Fairs • Job placement in private sector (contractors)
H. DEPARTMENT OF TRANSPORTATION AND COMMUNICATION
On-going Projects
Comprehensive Livelihood and Emergence
Employment Program (LRTA)
• Public works
Mactan-Cebu International Airport Authority
(MCIAA)
• Livelihood financing support
Manila International Airport Authority (MIAA) • Job placement in janitorial services
Philippine Aerospace Development Corporation
(PADC)
• Job placement in maintenance
• On the job training
Philippine Coast Guard (PCG) • On the job training
Philippine Merchant Marine Academy (PMMA) • Job placement
Philippine National Railways (PNR) • Job placement in railways
Philippine Ports Authority (PPA) • Job placement in ports
Source: Agency Reports
Table 17. Methodology for determining jobs generated, Selected Departments

56
AGENCY KEY PROGRAMS/SPECIFIC
ACTIVITIES METHOD OF COMPUTATION
Department of
Public Works and
Highways
Infrastructure Projects Assumptions:
1 job = 4 months employed @ 22
days a month (88 days)
Ave. labor rate (skilled and
unskilled) = Php 550/day
Factor (% of labor cost) = 20%
(low), 25% (medium), 30% (high)
Project Cost = Effective CO budget
to generate labor out of the total
proposed FY 2012 DPWH
infrastructure budget( less ROW,
Contractual Obligations, PDE and
EAO, etc.)
Formula:
Number of jobs= Total Project Cost
x 20%
550 x 88
Department of
Tourism
Tourism promotion
Development planning and
regulation
Based on Tourism Gross Value
Added
Department of
Labor and
Employment
BWSC, ROs Capacity Building
Services
Calculated beneficiaries of
programs and projects
BLE, BWSC,
TESDA, ROs,
PESO
Job Search
Assistance
Services
Department of
Trade and Industry
PEZA Investment
facilitation and
promotion
services
Direct employment. Projections
based on 10 % growth rate year-
on-year
BOI Investment
facilitation and
promotion
services
Direct and indirect employment.
Projections based on a 6 year
average annual growth rate of
10.11 % (2005-2010)
Regional
Operations
MSME
development and
promotion
services
Direct Employment
SB Corp MSME Financing 1 job supported = Php 80,000 loan
Department of Infrastructure Projects Assumptions:

57
Agrarian Reform
Average Daily Wage= P243.00
(Skilled and Unskilled)
Average Construction Period
(ACP):
FMR=144 days
Bridge=144 days
Irrigation=216 days
Other infra=120 days
Working Days per Month = 24
Formula:
Labor Cost = 85% x 20% x Total
Project Cost (TPC)
Person Days Factor (PDF)= Labor
Cost/Average Daily Wage
Estimated Jobs = ((TPC/1M) x
PDF)/ACP
Department of
Agriculture
Construction of Farm-to-Market
Roads
Construction of Small Water
Impounding Projects
1 job = 4 mos. employed@22
days/mon.= 88 days. Average
Labor Rate (Skilled and Unskilled) =
Php 550/day
1 job = 90 days employed. Average
Labor Rate (Unskilled at Rural
Area) = Php 550/day
Department of
Social Welfare and
Development
Livelihood Actual number of direct
beneficiaries
Department of
Transportation and
Communication
No. of jobs generated:
% share of labor cost to total
project cost/ average cost of one
job
Where:
Average cost of one job = Average
daily wage per job x project
duration
Project duration = Number of

58
months x 22 days per month
Source: DOLE-Community Based Employment Program

Table 18. Jobs generated by Programs Enrolled in CBEP by Department, 2012
Program/Project
Jobs Generated Financial
Cost per Job
(Obligation/Actual
No. of Jobs) Target Actual % Accomplishment Allocation Obligation % Utilization
Department of Trade and Industry
A. Infrastructure 10,400 15,831 152.00 103,672,500 138,230,000 75 8,732.00
1. Rural Micro Enterprise Promotion Program (RUMEPP) 10,400 15,831 152.00 103,672,500 138,230,000 75 8,732.00
Department of Social Welfare and Development
A. Infrastructure 64,801 64,801 100.00 95,986,485 95,986,485 100.00 1,481.25
1. Kapit-Bisig Laban sa Kahirapan Comprehensive and
Integrated Delivery of Social Services (KALAHI-CIDSS) 64,801 64,801 100.00 95,986,485 95,986,485 100.00 1,481.25
B. Non-Infrastructure 409,876 289,783 70.70 1,473,293,691 1,710,350,654 116.09 5,902.18
1. Sustainable Livelihood Program (Self-Employment
Assistance Kaunlaran-Pantawid Pamilya Beneficiaries) 209,745 60,308 28.75 241,546,851 465,298,003 192.63 7,715.36
2. Sustainable Livelihood Program (Self-Employment
Assistance Kaunlaran-Non-Pantawid Pamilya Beneficiaries) - 27,157 - - 237,514,757 - 8,745.99
3. Recovery and Reintegration Program for Trafficked Persons
(RRPTP) 400 520 130.00 4,000,000 4,733,004 118.33 9,101.93
4. Comprehensive Program for Street Children, Street
Families, and Indigenous Peoples, especially the Badjaus 530 553 104.34 23,700,820 18,950,110 79.96 34,267.83
5. Cash-for-Work (CFW) as a support component of PAMANA-
Shelter Assistance Project 4,000 - - 6,960,000 - - -
6.Government Internship Program (GIP) (Regular) 340 340 100.00 1,870,000 1,870,000 100.00 5,500.00

60
7.Government Internship Program (GIP) (Expanded) 24,492 24,492 100.00 309,862,920 309,862,920 100.00 12,651.60
8. Cash for Work for Pag-asa Youth Association of the
Philippines (PYAP) Members 3,400 - - 2,159,100 - - -
9. Cash for Work for Internally Displaced Persons (IDPs) 166,869 176,310 105.64 881,219,000 670,394,958 76.08 3,802.36
10. National Youth Commission (NYC) 100 103 103.00 1,975,000 1,726,902 87.44 16,766.04
C. Total 474,707 354,584 74.70 1,569,280,176 1,806,337,139 115 5,094.24
Department of Agrarian Reform
A. Infrastructure 10,095 4,884 48.38 2,095,115,482 905,903,611 43.24 185,483.95
1. Agrarian Reform Infrastructure Support Project III (ARISP III) 7,302 3,578 49.00 1,523,059,242 686,364,800 45.06 191,829.18
2. Agrarian Reform Communities Project II (ARCP II) 1,242 392 31.56 252,714,404 81,801,899 32.37 208,678.31
3. Tulay ng Pangulo para sa Kaunlarang Pang-Agraryo (TPKP) 1,551 914 58.93 319,341,837 137,736,913 43.13 150,696.84
B. Non-Infrastructure 2,235 1,617 72.35 14,174,889 8,522,471 60.12 5,270.54
1. Agrarian Reform Infrastructure Support Project III (ARISP III) 2,235 1,162 51.99 14,174,889 8,522,471 60.12 7,334.31
2. Margeting Assistance Program (MAP) - 350 - - - - -
3. Village Level Processing Center Enhancement Project
(VLPCEP I, II, I) - - - - - - -
4. National Technology Commercialization Program (NTCP) - 25 - - - - -
5. DAR-Catholic Relief Services (CRS) Partnership Project on
Linkin Agrarian Reform Beneficiaries to Corporate Supply Chain - - - - - - -
6. Community-Managed Potable Water Supply, Sanitation and
Hygiene (CPWASH) Project - 80 - - - - -
C. Total 12,330 6,501 52.73 2,095,115,482 905,903,611 43.24 139,348.35

61
Department of Tourism
A. DOT Main Office
- Hiring of Contract Service 832 878 105.53 32,711,602 37,306,869 114.05 42,490.74
B. Intramuros Administration (IA) 312 292 93.59 9,586,031 9,000,000 93.89 30,821.92
C. Tourism Infrastructure and Enterprise Zone Authority (TIEZA) 2,096 2,130 101.62 68,852,910 68,852,910 100.00 32,325.31
D. National Parks and Development Committee (NPDC) 684 676 98.83 3,532,900 2,610,470 73.89 3,861.64
Total 3,924 3,976 101.33 114,683,443 117,770,249 102.59 29,620.28
Department of Agriculture
A. Infrastructure 213,778 123,690 57.86 15,148,634,000 7,243,577,508 47.82 58,562.35
1. Construction of Farm-to-Market Roads Project 19,055 9,620 50.49 6,147,193,000 3,117,111,478 50.71 324,024.06
a. Regular GAA 15,503 8,837 57 5,000,940,000 2,827,995,058 56.55 320,017.55
b. Locally Funded Projects 2,896 521 17.99 211,660,000 120,741,000 57.04 231,748.56
c. Foreign-Assisted Projects 656 262 39.94 934,593,000 168,375,420 18.02 642,654.27
2. Construction/Rehabilitation of Irrigation Systems 192,541 113,729 59.07 8,801,441,000 3,836,466,030 43.59 33,733.40
3. Construction of Small Water Impounding Projects 2,182 341 15.63 200,000,000 290,000,000 145 850,439.88
B. Non-Infrastructure 177,635 168,426 94.82 864,498,646 478,875,834 55.39 2,843.24
1. Integrated Farming, Other Income Generating Project 11,056 4,647 42.03 246,636,646 115,285,834 46.74 24,808.66
2. Accelerated Coconut Planting & Replanting Program 138,125 131,205 94.99 502,310,000 262,360,000 52.23 1,999.62
3. Fishing Paraphernalia Distribution 27,530 32,277 117.24 106,312,000 94,260,000 88.66 2,920.35
4. Agrikultura: Kaagapay ng Bayang Pinoy Program 924 297 32.14 9,240,000 2,970,000 32.14 10,000.00
C. Total 391,413 292,116 74.63 16,013,132,646 7,718,453,342 48.2 26,422.56
Department of Public Works and Highways
A. Infrastructure 442,626 279,057 63.05 187,101,030,120 38,650,102,300 20.66 138,502.54
1. Infrastructure Program (2011 Funds, Continuing) 162,158 198,557 122.45 94,160,000,000 - - -

62
Capital Outlay/Preventive Maintenance 162,158 81,429 50.22 94,160,000,000 - - -
Routine Maintenance (MOOE) - - - - - - -
Priority Development Assistance Fund (PDAF) - 116,799 - - - - -
Routine Maintenance (Motor Vehicles Users Charge or
MVUC) - - - - - - -
Trabahong Lansangan (MVUC) - - - - - - -
Road Safety (Anti-Overloading) (MVUC) - - - - - - -
Preventive Maintenance (MVUC) - 329 - - - - -
Project Management Office (PMO) - - - - - - -
2. Infrastructure Program (2012 Funds, Current) 280,468 80,500 28.7 92,941,030,121 38,650,102,300 41.59 480,125.49
Capital Outlay/Preventive Maintenance 243,733 38,886 15.95 78,644,483,000 36,327,152,300 46.19 934,196.17
Routine Maintenance (MOOE) 12,397 5,286 42.64 4,000,000,000 750,000,000 18.75 141,884.22
Priority Development Assistance Fund (PDAF) 7,031 22,222 316.06 - - - -
Routine Maintenance (MVUC) 8,706 8,668 99.56 3,086,688,000 900,000,000 29.16 103,830.18
Trabahong Lansangan (MVUC) 2,077 1,695 81.61 - - - -
Road Safety (Anti-Overloading) (MVUC) 304 304 100 1,188,859,120 - - -
Preventive Maintenance (MVUC) 6,220 - - 6,021,000,000 672,950,000 11.18 -
Project Management Office (PMO) - 3,439 - - - - -
B. Non-Infrastructure - - - - - - -
C. Total 442,626 279,057 63.05 187,101,030,120 38,650,102,300 20.66 138,502.54
Department of Transportation and Communications
A. Infrastructure 26,747 20,963 78.38 1,254,970,332 472,840,000 37.68 22,555.93
Cebu Port Authority (CPA) 21,138 16,978 80.32 633,320,000 188,060,000 29.69 11,076.69
Clark International Airport Authority (CIAC) 47 47 100 2,532,100 1,735,050 68.52 36,915.96
Land Transportation Office 1,684 - - 301,400,000 - - -
Light Rail Transit Authority 180 164 91.11 8,316,000 8,316,000 100 50,707.32
Philippine National Railways (source of fund: GAA(LFP)) 360 360 100 - - - -

63
Philippine Ports Authority 3,338 3,414 102.28 309,402,232 274,728,950 88.79 80,471.28
B. Non-Infrastructure 4,070 2,698 66.29 249,584,500 139,171,000 55.76 51,583.02
DOTC Central Office 17 - - 17,218,000 - - -
Mactan-Cebu International Airport Authority 322 322 100 67,919,600 54,983,800 80.95 170,757.14
Office Transportation Security 388 388 100 48,000,000 3,600,000 7.5 9,278.35
Clark International Airport Authority (CIAC) 99 99 100 15,576,900 10,597,200 68.03 107,042.42
Philippine National Railways (source of fund: COS) 3,244 1,889 58.23 100,870,000 69,990,000 69.39 37,051.35
C. Total 30,817 23,661 76.78 1,504,554,832 612,011,000 40.68 25,865.81
Department of Labor and Employment
A. Bureau of Workers and Special Concern (BWSC)
Special Program for Employment of Students (SPES) 140,000 138,635 99.03 340,582,000 - - -
DOLE Integrated Livelihood Program (DILP) 58,000 84,207 145.18 294,588,000 36,040,912 12.23 428
B. Total 198,000 222,842 112.55 635,440,000 36,040,912 5.67 161.73
Source: DOLE-CBEP
Notes:
- : no data
Cost per Job: based on total budget allocated

64
Table 19. Recipients of Community-Based Tourism Assistance (GREET), DOT
Region Category (Amount Approved-PhP)
Total Homestay Outdoor Recreation Souvenir Shop F&B Others
1 202,190 172,000 45,000 50,000 - 469,190
2 - 460,326 293,200 79,405 166,400 999,331
4 - 100,000 - 85,000 6,439,200 6,624,200
5 - 2,191,380 397,000 100,000 515,180 3,203,560
6 88,088 320,500 - - - 408,588
7 - 1,598,550 350,000 - 300,000 2,248,550
8 - 100,000 - 330,000 300,000 730,000
9 - 141,000 - - - 141,000
10 - 84,000 45,000 - 142,200 271,200
11 - 357,341 100,000 - 142,000 599,341
12 - 138,000 627,500 - - 765,500
13 - 357,000 - 50,000 100,000 507,000
CAR 186,772 376,541 728,953 256,405 223,020 1,771,691
Total 477,050 6,396,638 2,586,653 950,810 8,328,000 18,739,151

65
Table 20. Investments Generated under OTOP Programs
In Million Pesos
Region 2007 2008 2009 2010 2011 2012 Total Average Investment
Total 2007-2009 2010-2012
CAR 46.15 60.18 81.65 39.89 109.62 92.02 429.51 71.59 62.66 80.51
I 15.27 15.01 24.77 155.50 71.13 123.69 405.37 67.56 18.35 116.77
II 118.61 90.78 131.09 56.08 129.00 72.48 598.03 99.67 113.49 85.85
III 222.25 251.47 198.63 52.23 116.14 146.73 987.43 164.57 224.11 105.03
IVA 53.82 102.00 80.00 62.25 60.05 157.03 515.15 85.86 78.61 93.11
IVB 12.23 34.81 31.67 73.75 15.20 31.75 199.42 33.24 26.24 40.24
V 67.87 79.93 119.71 54.44 193.94 174.14 690.03 115.01 89.17 140.84
NCR - - - - 185.00 1.34 186.34 31.06 - 62.11
VI 70.22 114.32 92.63 68.66 53.49 53.05 452.37 75.39 92.39 58.40
VII 2.92 0.61 100.00 50.00 268.00 27.00 448.53 74.75 34.51 115.00
VIII 24.22 32.56 54.07 32.35 25.21 27.00 195.41 32.57 36.95 28.19
IX 529.14 697.60 244.66 183.41 277.20 258.62 2,190.63 365.11 490.47 239.74
X 48.80 176.18 155.89 51.51 102.38 127.26 662.02 110.34 126.96 93.72
XI 26.72 113.68 58.19 88.16 127.04 198.89 612.68 102.11 66.20 138.03
XII 965.10 651.00 169.00 42.35 385.69 220.00 2,433.14 405.52 595.03 216.01
CARAGA 127.18 197.99 121.28 65.99 52.61 56.50 621.56 103.59 148.82 58.37
Philippines 2,330.49 2,618.12 1,663.23 1,076.57 2,171.69 1,767.53 11,627.62 1,937.94 2,203.94 1,671.93
Source: DTI

66
Table 21. Number of MSMEs Assisted by OTOP
Region 2007 2008 2009 2010 2011 2012 All
Years %
Share
CAR 253 672 850 443 259 482 2,959 5.8%
I 438 616 759 468 148 407 2,836 5.5%
II 768 858 510 560 520 484 3,700 7.2%
III 767 661 750 351 765 899 4,193 8.2%
IVA 664 1,792 1,870 759 305 576 5,966 11.6%
IVB 127 220 179 238 136 254 1,154 2.2%
V 583 653 967 765 1,478 1,860 6,306 12.3%
NCR - 944 26 83 - - 1,053 2.0%
VI 776 1,641 1,216 725 557 538 5,453 10.6%
VII 160 5,660 310 514 590 563 7,797 15.2%
VIII 1,060 445 418 462 99 117 2,601 5.1%
IX 122 151 230 181 245 96 1,025 2.0%
X 232 285 600 325 345 160 1,947 3.8%
XI 73 177 117 306 129 732 1,534 3.0%
XII 455 181 362 55 145 95 1,293 2.5%
CARAGA 307 319 220 198 104 410 1,558 3.0%
Total 6,785 15,275 9,384 6,433 5,825 7,673 51,375 100.0%
Source: DTI

67
Table 22. Average Investment per MSME Assisted
In Pesos
Region 2007 2008 2009 2010 2011 2012 All Years
CAR 182,411 89,555 96,055 90,052 423,247 190,919 145,155
I 34,856 24,372 32,633 332,267 480,588 303,914 142,937
II 154,440 105,802 257,033 100,139 248,079 149,752 161,631
III 289,759 380,431 264,833 148,803 151,810 163,216 235,495
IVA 81,054 56,920 42,781 82,016 196,885 272,628 86,348
IVB 96,299 158,245 176,899 309,887 111,794 125,016 172,808
V 116,415 122,404 123,794 71,166 131,215 93,625 109,424
NCR - - - 176,961
VI 90,492 69,665 76,176 94,703 96,027 98,606 82,958
VII 18,219 108 322,581 97,276 454,237 47,957 57,526
VIII 22,848 73,162 129,364 70,022 254,636 230,769 75,128
IX 4,337,221 4,619,841 1,063,748 1,013,309 1,131,429 2,694,000 2,137,202
X 210,345 618,161 259,817 158,483 296,751 795,394 340,018
XI 366,027 642,260 497,350 288,095 984,767 271,712 399,397
XII 2,121,099 3,596,685 466,851 770,000 2,659,931 2,315,789 1,881,779
CARAGA 414,261 620,668 551,286 333,298 505,885 137,805 398,947
Philippines 343,476 171,399 177,241 167,352 372,822 230,357 226,328 Source: DTI

68
Table 23. New Jobs Created under OTOP Program
Region 2007 2008 2009 2010 2011 2012 Average Jobs
Total 2007-2009 2010-2012
CAR 3,485 4,269 4,026 2,831 3,432 3,590 3,606 3,927 3,284
I 1,363 1,296 2,455 1,616 2,275 2,794 1,967 1,705 2,228
II 2,904 4,720 4,013 2,387 1,168 1,741 2,822 3,879 1,765
III 26,365 22,335 20,313 2,013 4,445 8,001 13,912 23,004 4,820
IVA 2,897 8,503 7,044 18,746 2,738 2,499 7,071 6,148 7,994
IVB 423 2,194 2,016 2,057 1,557 2,043 1,715 1,544 1,886
V 2,479 2,411 2,669 1,313 2,497 2,706 2,346 2,520 2,172
NCR - 76 52 10 100 225 77 43 112
VI 6,216 5,948 11,331 11,399 3,093 3,183 6,862 7,832 5,892
VII 799 3,290 3,124 1,689 17,221 18,616 7,457 2,404 12,509
VIII 4,558 4,227 3,916 3,472 1,435 1,405 3,169 4,234 2,104
IX 7,357 10,837 4,948 2,936 6,204 2,582 5,811 7,714 3,907
X 1,611 5,114 10,699 1,651 2,232 6,923 4,705 5,808 3,602
XI 1,391 3,662 3,465 4,146 5,979 10,580 4,871 2,839 6,902
XII 3,732 3,745 1,863 476 1,125 2,801 2,290 3,113 1,467
CARAGA 5,153 2,792 2,294 1,528 1,650 1,381 2,466 3,413 1,520
Philippines 70,733 85,419 84,228 58,270 57,151 71,070 71,145 80,127 62,164
Source: DTI

69
Table 24. Domestic Sales under OTOP Program
In Million Pesos
2007 2008 2009 2010 2011 2012 Total Average Sales
Total 2007-2009 2010-2012
CAR 53.62 78.25 102.21 59.11 168.86 155.30 617.36 102.89 78.03 127.76
I 105.56 113.69 87.27 155.68 211.93 223.67 897.80 149.63 102.17 197.09
II 644.90 547.07 689.87 436.24 446.83 324.98 3,089.88 514.98 627.28 402.68
III 647.10 649.71 719.50 174.16 337.44 387.37 2,915.28 485.88 672.10 299.66
IVA 54.00 149.00 201.00 234.05 428.00 462.43 1,528.48 254.75 134.67 374.83
IVB 17.77 61.95 62.56 97.23 100.28 159.88 499.67 83.28 47.43 119.13
V 92.79 102.21 115.11 94.69 199.62 236.91 841.33 140.22 103.37 177.07
NCR - 0.82 0.26 0.38 15.25 33.18 49.89 8.31 0.36 16.27
VI 140.42 301.43 425.64 332.18 241.79 301.44 1,742.88 290.48 289.16 291.80
VII 103.81 114.31 113.00 236.00 474.00 241.00 1,282.12 213.69 110.37 317.00
VIII 31.51 31.90 52.18 36.39 31.83 21.78 205.58 34.26 38.53 30.00
IX 617.29 706.99 325.40 499.65 1,055.60 1,297.46 4,502.39 750.40 549.89 950.90
X 128.70 168.39 207.34 300.59 276.97 565.52 1,647.51 274.59 168.14 381.03
XI 34.28 196.34 215.66 218.01 338.95 419.12 1,422.36 237.06 148.76 325.36
XII 75.43 197.00 164.00 48.50 137.34 246.00 868.27 144.71 145.48 143.95
CARAGA 26.62 146.16 133.04 41.86 52.13 108.36 508.17 84.70 101.94 67.45
Philippines 2,773.79 3,565.22 3,614.04 2,964.70 4,516.82 5,184.40 22,618.97 3,769.83 3,317.68 4,221.97
Source: DTI

70
Table 25. Domestic Sales per MSME Assisted under OTOP Program
In Pesos
Region 2007 2008 2009 2010 2011 2012 All Years
CAR 211,929 116,449 120,252 133,429 651,985 322,203 208,638
I 241,000 184,563 114,982 332,652 1,431,959 549,565 316,574
II 839,711 637,613 1,352,678 778,995 859,288 671,446 835,104
III 843,682 982,912 959,329 496,192 441,098 430,893 695,274
IVA 81,325 83,147 107,487 308,366 1,403,279 802,823 256,198
IVB 139,890 281,605 349,503 408,508 737,368 629,441 432,985
V 159,156 156,528 119,042 123,780 135,059 127,368 133,417
NCR 868 10,018 4,518 47,376
VI 180,948 183,686 350,030 458,177 434,084 560,288 319,618
VII 648,794 20,197 364,516 459,144 803,390 428,064 164,438
VIII 29,726 71,688 124,828 78,755 321,525 186,128 79,040
IX 5,059,770 4,682,053 1,414,778 2,760,470 4,308,588 13,515,177 4,392,573
X 554,741 590,828 345,572 924,886 802,823 3,534,519 846,181
XI 469,589 1,109,277 1,843,248 712,451 2,627,481 572,572 927,223
XII 165,785 1,088,398 453,039 881,818 947,172 2,589,474 671,517
CARAGA 86,717 458,166 604,723 211,429 501,250 264,302 326,170
Philippines 408,812 233,402 385,128 460,858 775,420 675,668 440,272 Source: DTI

71
Table 26. OTOP Program Correlation Results
Jobs Generated
Corr t-stat
Investment 0.9034 0.0000
Investment per
MSME
-0.0476 0.6402
No. of MSMEs
Assisted*
0.8482 0.0000
*includes developed & assisted

72
Table 27. Number of MSMEs Developed and Assisted, 2007-2009
Year MSMEs Developed MSMEs Assisted % MSMEs Developed
2007 2,506 6,785 27.0
2008 2,869 10,175 22.0
2009 2,121 9,198 18.7
Total 7,496 26,158 22.3
Source: Table generated from DAP (2011). A Study on the Socio-Economic Impact Assessment of DTI’s ONE TOWN,
ONE PRODUCT Program
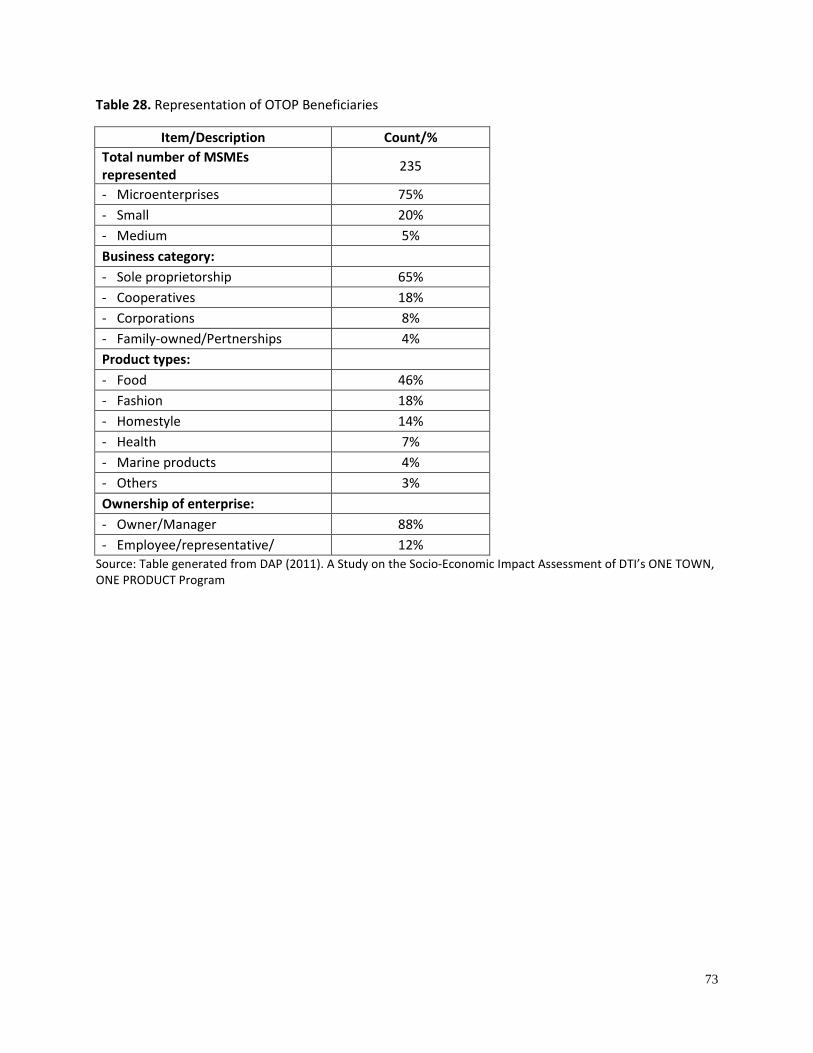
73
Table 28. Representation of OTOP Beneficiaries
Item/Description Count/%
Total number of MSMEs
represented 235
- Microenterprises 75%
- Small 20%
- Medium 5%
Business category:
- Sole proprietorship 65%
- Cooperatives 18%
- Corporations 8%
- Family-owned/Pertnerships 4%
Product types:
- Food 46%
- Fashion 18%
- Homestyle 14%
- Health 7%
- Marine products 4%
- Others 3%
Ownership of enterprise:
- Owner/Manager 88%
- Employee/representative/ 12%
Source: Table generated from DAP (2011). A Study on the Socio-Economic Impact Assessment of DTI’s ONE TOWN,
ONE PRODUCT Program

74
Table 29. Number of new jobs generated and direct jobs sustained, 2006-2009
Year Direct Jobs Sustained New Jobs Generated % of Jobs Sustained
2006 43,441 70,599 38.1
2007 42,345 70,733 37.4
2008 53,579 85,419 38.5
2009 65,132 84,268 43.6
Total 161,056 240,420 40.1
Source: Table generated from DAP (2011). A Study on the Socio-Economic Impact Assessment of DTI’s ONE TOWN,
ONE PRODUCT Program

75
Table 30. Main Findings: Study on the Socio-Economic Impact Assessment of DTI’s ONE TOWN, ONE
PRODUCT Program
Item % of OTOP Beneficiaries
Intervention
Usefulness of Product Design and Development 27%
Usefulness of Skills, entrepreneurial and business trainings 25%
Attributed Credit Access through OTOP 7%
Income
Increase in Income 90%
Upgraded quality of life
Purchased vehicles 26%
Enjoyed travels 19%
Acquired Gadgets 18%
Purchased land/real estate 23%
Purchased insurance products 16%
Diversified to other business ventures 13%
Placed Additional Capital in current business 30%
Savings 67%
Upgraded business facilities
Renovated existing facilities 55%
Purchased land/Built new production area 30%
Purchased new and modern equipment 71%
Expanded sales to other country 57%
Added international clients 14%
OTOP Effects to MSMEs
Access to wider market and resources for expansion 59%
Product Improvement 12%
Contributed additional employment 6%
Source of Pride 5%
Easy access to loans 4%
Easy access to LGU support 3%
Community Effects
Increased employment 26%
Improved standard of living 12%
Increase in infrastructure 3%
Strengthened Private-Public Partnership 4%
Awareness in the use of technology for businesses 4%
Quality of products are associated with towns of origin 20% Source: Table generated from DAP (2011). A Study on the Socio-Economic Impact Assessment of DTI’s ONE TOWN,
ONE PRODUCT Program
Note:
Response of 235 Discussants

76
Table 31. Constraints and Challenges: Study on the Socio-Economic Impact Assessment of DTI’s ONE
TOWN, ONE PRODUCT Program
Item % of OTOP
Beneficiaries
Constraints
Lack of access to additional capital 21%
Unavailability/inaccessibility of raw materials 19%
Difficulty in complying with requirements to obtain permits from
FDA and requirement to penetrate larger markets 10%
Lack of financial capacity 7%
Decrease of skilled labor force 5%
Negative working habits of workers 4%
Lower priced competitors 5%
Lack of LGU support 7%
High taxes and unclear policies on payment of fees for permits 5%
Challenges
Difficulty in responding to collateral and documentary requirements
needed to access loans, even from GFIs 19%
Looking for a more comprehensive marketing strategy from OTOP
aside from the tried and tested 9%
LGUS are not taking a more proactive role in implementing the
OTOP Program 11%
Weak business support by LGUs 10% Source: Table generated from DAP (2011). A Study on the Socio-Economic Impact Assessment of DTI’s ONE TOWN,
ONE PRODUCT Program
Note:
Response of 235 Discussants

77
Table 32. Result of Evaluation: Rapid Assessment of SEA-K
Item SEA-K SEA-Kababayan Challenges
Ability to Pay Monthly Amortization 99.6% 90.0% • Sustainability of
the projects of the
participants
• Cooperation
among members of
the association
• Good leadership
among association
officers
• Excellent and
supportive
implementers
• Some members
do not pay on time
Increase in Income 95.8% 96.6%
Generated Employment 24.8% 30.6%
Improvement in Health Management 55.3% 62.2%
Increase in Number of Meals eaten 65.5% 71.8%
Increase in House Ownership 92.0% 94.8%
Housing Improvement 75.0% 94.0%
Improvement in Access to Water 36.5% 50.3%
Improvement in Education
(allowance & transport fare) 86.0% 88.0%
Involvement in Project 94.0% 98.0%
Source: Gervacio, Juvy (2007). Self-Employment Assistance Kaunlaran (An Assessment). DSWD and NCPAG. Note: Responses of 529 members

78
Table 33. Sustainable Livelihood Program-Track 1: Microenterprise Development (January 2011-June
2013)
Region
Total Served
(DSWD/MFIs
/NGA/LGU)
DSWD (Pantawid and Non-Pantawid) MFIs NGAs/LGU
s
No. of HH
Served
No. of HH
Served
Capital Seed Fund
Provided
Cost
per HH
No. of HH
Served
No. of HH
Served
NCR 4,495 4,495 27,786,100 6,182 - -
CAR 7,873 5,563 44,815,500 8,056 2,078 232
I 9,668 6,573 43,556,000 6,627 3,021 74
II 8,133 8,095 63,489,007 7,843 2 36
III 9,574 9,574 61,453,500 6,419 - -
IV-A 5,042 3,792 32,382,000 8,540 1,250 -
IV-B 13,571 11,868 100,821,200 8,495 1,668 35
V 8,259 8,001 65,296,500 8,161 258 -
VI 7,277 6,590 44,176,650 6,704 600 87
VII 11,926 7,859 49,501,000 6,299 4,067 -
VIII 5,656 5,599 54,264,910 9,692 57 -
IX 24,817 19,230 179,712,853 9,345 5,587 -
X 31,163 30,836 167,886,500 5,444 327 -
XI 7,118 7,118 53,633,000 7,535 - -
XII 7,144 6,505 63,325,000 9,735 434 205
CARAG
A 32,138 18,515 143,862,000 7,770 13,468 155
ARMM 21,845 21,845 217,826,000 9,971 - -
Total 215,699 182,058 1,413,787,720 7,766 32,817 824
Source: DSWD-Sustainable Livelihood Program Note: Job lasts up to 6 months

79
Table 34. Repayment Status of DSWD Funded Pantawid Households (January 2011-June 2013)
Field Office No. of HH Served Capital Seed Fund Provided Cost/HH Repayment Rate
NCR 4,002 24,860,500 6,212 68.75%
CAR 4,598 38,306,500 8,331 55.32%
I 4,422 32,493,000 7,348 76.42%
II 5,315 45,292,750 8,522 Submitted repayment
has yet to be reviewed III 4,392 25,232,000 5,745
IV-A 2,315 20,955,000 9,052 82.34%
IV-B 10,760 93,328,700 8,674 100.00%
V 7,420 61,206,500 8,249 74.71%
VI 4,502 32,727,900 7,270 70.41%
VII 7,052 45,361,000 6,432 640.04%
VIII 5,189 50,932,910 9,816 64.20%
IX 18,955 177,970,853 9,389 100.00%
X 25,896 140,789,500 5,437 100.00%
XI 6,397 49,246,000 7,698 100.00%
XII 6,465 63,125,000 9,764 22.59%
CARAGA 18,465 143,512,000 7,772 100.00%
ARMM 3,645 35,826,000 9,829 55.32%
Total 139,790 1,081,166,113 135,539 82.93%
Source: DSWD-Sustainable Livelihood Program
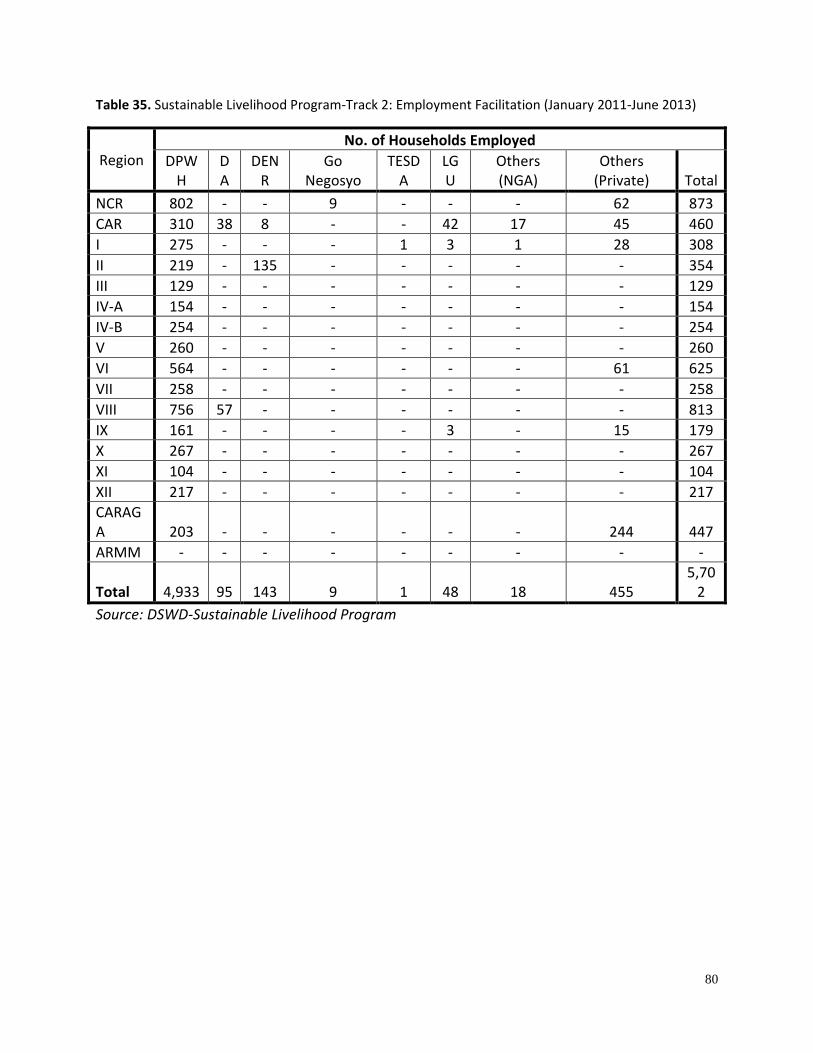
80
Table 35. Sustainable Livelihood Program-Track 2: Employment Facilitation (January 2011-June 2013)
Region
No. of Households Employed
DPW
H
D
A
DEN
R
Go
Negosyo
TESD
A
LG
U
Others
(NGA)
Others
(Private) Total
NCR 802 - - 9 - - - 62 873
CAR 310 38 8 - - 42 17 45 460
I 275 - - - 1 3 1 28 308
II 219 - 135 - - - - - 354
III 129 - - - - - - - 129
IV-A 154 - - - - - - - 154
IV-B 254 - - - - - - - 254
V 260 - - - - - - - 260
VI 564 - - - - - - 61 625
VII 258 - - - - - - - 258
VIII 756 57 - - - - - - 813
IX 161 - - - - 3 - 15 179
X 267 - - - - - - - 267
XI 104 - - - - - - - 104
XII 217 - - - - - - - 217
CARAG
A 203 - - - - - - 244 447
ARMM - - - - - - - - -
Total 4,933 95 143 9 1 48 18 455
5,70
2
Source: DSWD-Sustainable Livelihood Program

81
Table 36. Assistance to Workers during the Global Financial Crisis Under the Comprehensive Livelihood
and Emergency Employment Program (CLEEP), 2009
Region Total
No. of Beneficiaries
Tulong
Panghanapbuhay sa
Ating Disadvantaged
Workers (TUPAD)
Integrated
Services for
Livelihood
Advancement of
Fisherfolks (ISLA)
1.5% MOOE
(EO 782)
Emergency
Employment
to Victims of
Typhoon
Ondoy and
Pepeng
NCR 5,699 3,191 245 18 2,245
CAR 1,876 1,296 - 5 575
1 2,264 461 1,183 21 599
2 1,128 645 170 16 297
3 3,185 1,688 989 8 500
4A 2,370 1,220 216 - 934
4B 2,331 1,948 377 6 -
5 1,079 850 228 1 -
6 1,587 1,010 565 12 -
7 284 158 114 12 -
8 1,982 882 1,091 9 -
9 826 388 425 13 -
10 1,543 977 558 8 -
11 1,164 846 300 18 -
12 207 50 145 12 -
CARAGA 1,365 911 419 35 -
Total 28,890 16,521 7,025 194 5,150
Note: The figures under the 1.5 % MOOE column indicates each department’s allocated budget
for the temporary hiring of qualified DOLE registered displaced workers and dependents in
compliance with EO 782: Instituting Measures to Assist Workers Affected by the Global
Financial Crisis and Temporary Filling-Up of Vacant Positions in the Government.
Source of data: DOLE
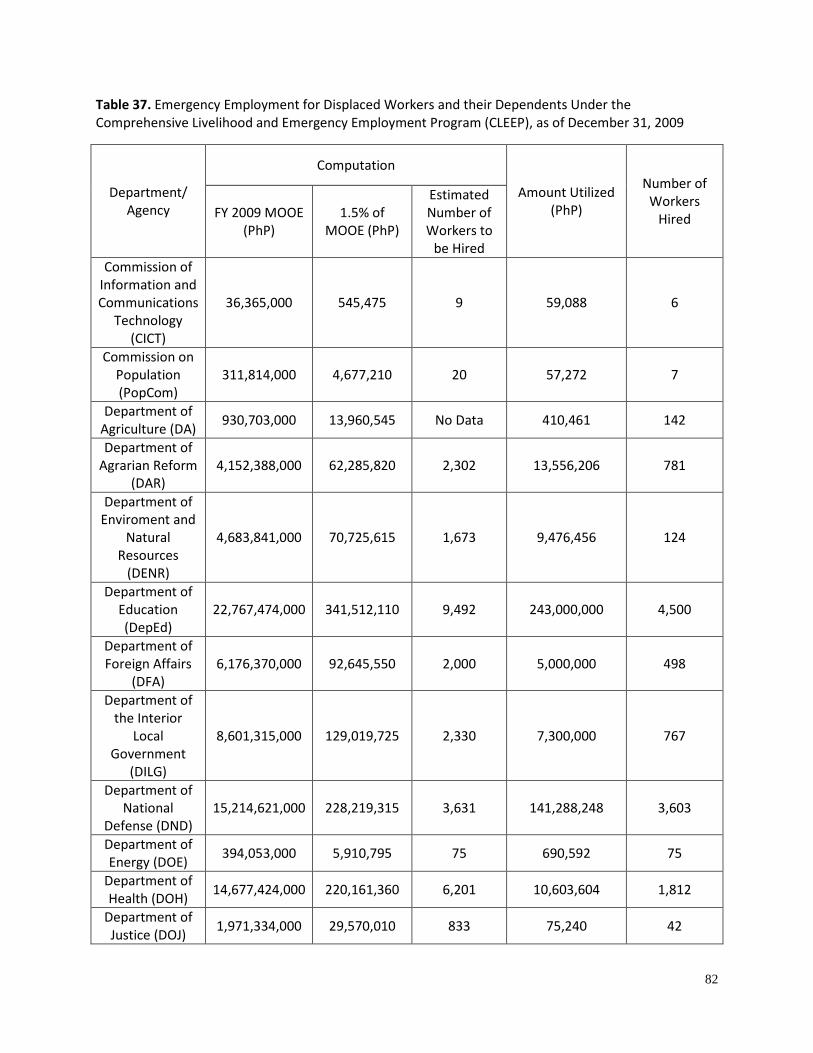
82
Table 37. Emergency Employment for Displaced Workers and their Dependents Under the
Comprehensive Livelihood and Emergency Employment Program (CLEEP), as of December 31, 2009
Department/
Agency
Computation
Amount Utilized
(PhP)
Number of
Workers
Hired FY 2009 MOOE
(PhP)
1.5% of
MOOE (PhP)
Estimated
Number of
Workers to
be Hired
Commission of
Information and
Communications
Technology
(CICT)
36,365,000 545,475 9 59,088 6
Commission on
Population
(PopCom)
311,814,000 4,677,210 20 57,272 7
Department of
Agriculture (DA) 930,703,000 13,960,545 No Data 410,461 142
Department of
Agrarian Reform
(DAR) 4,152,388,000 62,285,820 2,302 13,556,206 781
Department of
Enviroment and
Natural
Resources
(DENR)
4,683,841,000 70,725,615 1,673 9,476,456 124
Department of
Education
(DepEd)
22,767,474,000 341,512,110 9,492 243,000,000 4,500
Department of
Foreign Affairs
(DFA)
6,176,370,000 92,645,550 2,000 5,000,000 498
Department of
the Interior
Local
Government
(DILG)
8,601,315,000 129,019,725 2,330 7,300,000 767
Department of
National
Defense (DND)
15,214,621,000 228,219,315 3,631 141,288,248 3,603
Department of
Energy (DOE) 394,053,000 5,910,795 75 690,592 75
Department of
Health (DOH) 14,677,424,000 220,161,360 6,201 10,603,604 1,812
Department of
Justice (DOJ) 1,971,334,000 29,570,010 833 75,240 42

83
Department of
Labor and
Employment
(DOLE)
3,878,026,000 29,096,111 789 13,668,800 821
Department of
Tourism (DOT) 1,017,595,000 20,205,450 111 14,565,099 118
Department of
Social Welfare
and
Development
(DSWD)
No Data No Data 17,018 732,029,656 17,018
Department of
Trade and
Industry (DTI)
1,719,375,000 25,790,625 1,710 36,085,539 1,699
Housing and
Urban
Development
Coordinating
Council (HUDCC)
62,215,000 933,225 16 933,225 16
Home
Development
Mutual Fund
(HDMF)
2,759,913,154 41,398,697 51 7,500,000 51
Home Guaranty
Corporation
(HGC) 230,306,048 3,459,045 No Data 2,337,603 56
Light Rail Transit
Authority (LRTA) 85,764,000 1,286,460 20 1,166,011 20
Metro Rail
Transit (MRT) 521,011,000 7,815,165 35 196,881 23
National
Computer
Center (NCC)
23,508,000 352,620 13 110,276 8
National
Economic and
Development
Authority
(NEDA)
1,141,238,000 17,118,570 30 90,221 21
National
Historical
Institute (NHI)
41,165,000 617,475 11 178,825 10
National Youth
Commission
(NYC)
No Data No Data No Data 23,430 3
Office of the
Press Secretary 388,139,000 5,822,085 162 14,339,000 77
Philippine No Data No Data No Data 2,582,356 24

84
International
Trading
Corporation
(PITC)
Presidential
Management
Staff (PMS)
119,395,000 1,790,925 No Data 13,200,000 88
Total 91,905,352,202 1,347,919,984 48,532 1,270,524,089 32,410
Source of data: DOLE

85
Table 38. Physical Accomplishment, Financial Utilization, and Amount Utilized per Person of Emergency
Employment for Displaced Workers and their Dependents Under the Comprehensive Livelihood and
Emergency Employment Program (CLEEP), as of December 31, 2009
Department/Agency
% Physical
Accomplishment
(Number of Persons
Hired/Estimated
Number of Persons to
be Hired)
% Financial Utilization
(Amount
Utilized/1.5%MOOE)
Amount Utilized per
Person Hired
Commission of
Information and
Communications
Technology (CICT)
66.67 10.83 9,848.00
Commission on
Population (PopCom) 35.00 1.22 8,181.71
Department of
Agriculture (DA) No Data 2.94 2,890.57
Department of
Agrarian Reform
(DAR)
33.93 21.76 17,357.50
Department of
Enviroment and
Natural Resources
(DENR)
7.41 13.40 76,423.03
Department of
Education (DepEd) 47.41 71.15 54,000.00
Department of
Foreign Affairs (DFA) 24.90 5.40 10,040.16
Department of the
Interior Local
Government (DILG)
32.92 5.66 9,517.60
Department of
National Defense
(DND)
99.23 61.91 39,214.06
Department of Energy
(DOE) 100.00 11.68 9,207.89
Department of Health
(DOH) 29.22 4.82 5,851.88
Department of Justice
(DOJ) 5.04 0.25 1,791.43
Department of Labor
and Employment
(DOLE)
104.06 46.98 16,648.96
Department of 106.31 72.09 123,433.04

86
Tourism (DOT)
Department of Social
Welfare and
Development (DSWD) 100.00 No Data 43,015.02
Department of Trade
and Industry (DTI) 99.36 139.92 21,239.28
Housing and Urban
Development
Coordinating Council
(HUDCC)
100.00 100.00 58,326.56
Home Development
Mutual Fund (HDMF) 100.00 18.12 147,058.82
Home Guaranty
Corporation (HGC) No Data 67.58 41,742.91
Light Rail Transit
Authority (LRTA) 100.00 90.64 58,300.55
Metro Rail Transit
(MRT) 65.71 2.52 8,560.04
National Computer
Center (NCC) 61.54 31.27 13,784.50
National Economic
and Development
Authority (NEDA)
70.00 0.53 4,296.24
National Historical
Institute (NHI) 90.91 28.96 17,882.50
National Youth
Commission (NYC) No Data No Data 7,810.00
Office of the Press
Secretary 47.53 246.29 186,220.78
Philippine
International Trading
Corporation (PITC)
No Data No Data 107,598.17
Presidential
Management Staff
(PMS) No Data 737.05 150,000.00
Total 66.78 94.26 39,201.61
Source of data: Table 5
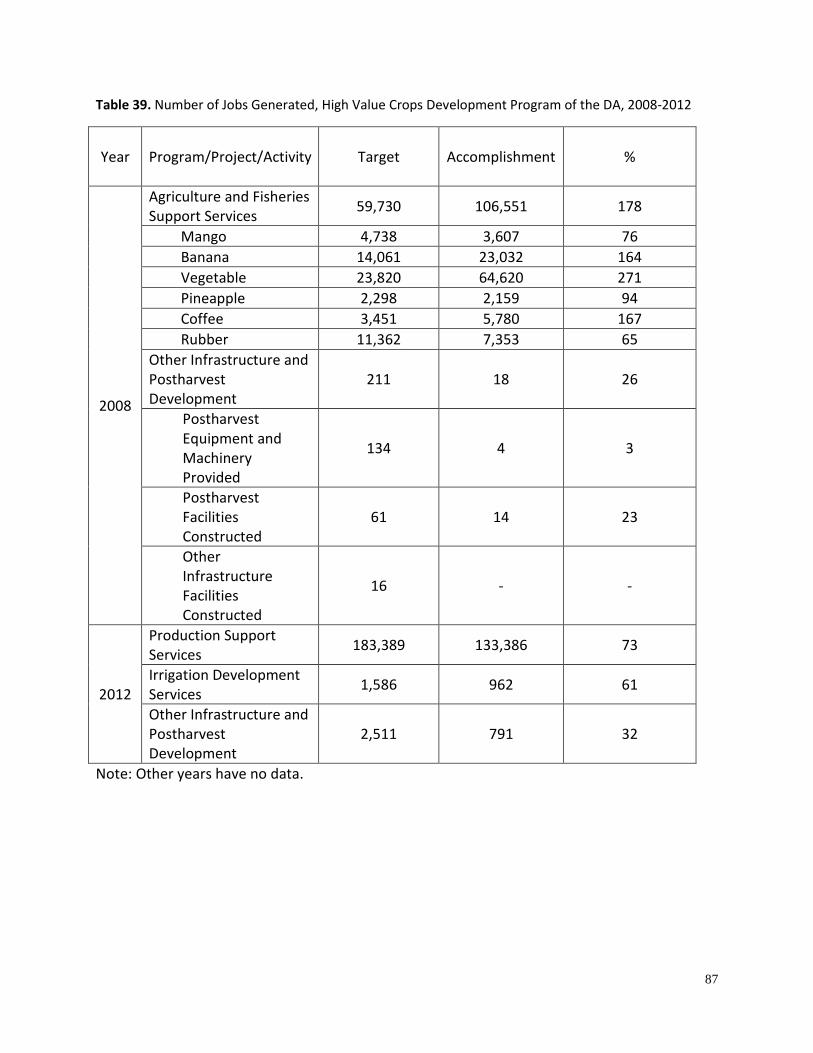
87
Table 39. Number of Jobs Generated, High Value Crops Development Program of the DA, 2008-2012
Year
Program/Project/Activity Target Accomplishment %
2008
Agriculture and Fisheries
Support Services 59,730 106,551 178
Mango 4,738 3,607 76
Banana 14,061 23,032 164
Vegetable 23,820 64,620 271
Pineapple 2,298 2,159 94
Coffee 3,451 5,780 167
Rubber 11,362 7,353 65
Other Infrastructure and
Postharvest
Development
211 18 26
Postharvest
Equipment and
Machinery
Provided
134 4 3
Postharvest
Facilities
Constructed
61 14 23
Other
Infrastructure
Facilities
Constructed
16 - -
2012
Production Support
Services 183,389 133,386 73
Irrigation Development
Services 1,586 962 61
Other Infrastructure and
Postharvest
Development
2,511 791 32
Note: Other years have no data.

88
Table 40. Status of the Accelerated Hunger Mitigation Program (AHMP) Projects Implemented by the DENR, 2005-2009
Year Program Total Target Amount (PM) On-going Completed % Accomplished Employment Generated
Man-Days No. of Workers
FY 2005
Farm-to-Market Road 37 80.00 - 37 100.00 59,859 1,251
Roadside Maintenance 26,867 1,000.00 - 26,867 100.00 426,072 5,928
Water Supply 652 416.63 - 652 100.00 59,859.00 1,251
Total 27,556 1,496.63 0 27,556 100.00 545,790 8,430
FY 2006
Farm-to-Market Road 100 165.20 - 100 100.00 70,002 3,155
Roadside Maintenance 22,137 1,565.00 - 22,137 100.00 5,528,968 222,648
Water Supply 324 289.90 2 322 99.38 223,636 3,635
Total 22,561 2,020.10 2 22,559 99.99 5,822,606 229,438
FY 2007
Farm-to-Market Road 63 169.00 6 58 92.06 49,371 1,601
Roadside Maintenance 27,144 1,841,014.00 - 27,144 100.00 6,880,771 26,847
Water Supply 279 253.02 8 269 96.49 134,623 3,233
Total 27,486 1,841,436.02 14 27,471 99.95 7,064,765 31,681
FY 2008
Farm-to-Market Road 389 1,053.30 51 325 83.55 141,317 1,804
Roadside Maintenance 27,222 1,850.00 - 22,621 83.10 6,783,982 27,501
Water Supply 322 240.32 53 157 48.76 59,399 2,852
Total 27,933 3,143.62 104 23,103 82.71 6,984,698 32,157
FY 2009
Farm-to-Market Road 735 2,016.30 614 121 16.46 201,630 3,360
Roadside Maintenance 27,302 2,020.00 - 12,914 47.30 4,135,273 23,298
Total 28,037 4,036.30 614 13,035 46.49 4,336,903 26,658
TOTAL 133,573 1,852,132.67 734 113,724 85.14 24,754,762 328,364 Note: Data is as of August 31, 2009.
Source of data: DPWH

89
References
Abrahart, A., I. Kaur and Z.Tzannatos. (2000). Government Employment and Active Labor
Market Policies in MENA in Comparative International Context. Paper Presented at MDF3, Cairo, Egypt. 24 p.
Aldaba, R. (2013). New Industrial Policy, Inclusive growth to reduce poverty. Philippine Daily
Inquirer 18 May 2013. Aldaba, R. (2013). The Philippine Manufacturing Industry Roadmap: Agenda for New Industrial
Policy, High Productivity Jobs and Inclusive Growth. Makati City: Philippine Institute for Development Studies
Betcherman, G., A. Dar, A. Luinstra and M. Ogawa. (1999). Active Labor Market Policies:
Policy Issues for East Asia. Social Protection Unit, The World Bank, Second Draft, December 1999. 46 p.
Betcherman, G., K. Olivas, and A. Dar. (2003). Impacts of Active Labor Market Programs: New
Evidence from Evaluations with Particular Attention to Developing and Transition Countries. Social Protection Unit, World Bank, Preliminary Draft. 62 p.
Brown, Alessio J. G. and J. Kottl. (2012). Active Labor Market Programs employment gain or
fiscal drain. Kiel Working Paper, No. 1785, http://hdl.handle.net/10419/60332 Congressional Budget Office (2011). Policies for Increasing Economic Growth and Employment
in 2012 and 2013. Washington, D.C.: Congressional Budget Office DAP (2011). A Study on the Socio-Economic Impact Assessment of DTI’s ONE TOWN, ONE
PRODUCT Program. Pasig City: Development Academy of the Philippines Dar, A. and Z. Tzannatos. 1999. Active Labor Market Programs: A Review of the Evidence from
Evaluations. Social Protection Department, Human Development Network, The World Bank. 75 p.
Department of Agrarian Reform. 2000-2011 Annual Reports Department of Agriculture. 2001-2011. Annual Accomplishment Report. Department of Labor and Employment. 2001-2011. Annual Report. Department of Labor and Employment. 2011. The Philippine Labor and Employment Plan 2011-
2016: Inclusive Growth Through Decent and Productive Work. 66 p. Department of Public Works and Highways. 2001-2011. Annual Report.

90
Department of Social Welfare and Development. 2007-2011 Annual Reports Department of Trade and Industry. 2000-2011 Annual Reports Department of Transportation and Communications. 2001-2011. Annual Report. DOT (2010). Grassroots Entrepreneurship and Employment in Tourism Turn-Over Report.
Manila: Department of Tourism DSWD (2013). Sustainable Livelihood Program Updates as of July 2013. Quezon City:
Department of Social Welfare and Development Gervacio, Juvy (2007). Self-Employment Assistance Kaunlaran (An Assessment). Quezon City:
Department of Social Welfare and Development and National College of Public Administration and Governance.
Hull, K. (2009). Understanding the Relationship between Economic Growth, Employment and
Poverty Reduction. Islam, R., J. Krishnamurty and Shivani Puri. (2001). Active Labour Market Policies in East and
South-East Asia: What has been done and what can be done? Paper prepared for the World Bank-ILO-JMOL-PDOLE Seminar on Labour Market Policies: their implications for East and South East Asia to be held in Manila on 1-2 March 2001. 38 p.
Lal, R., S. Miller, M. Liew-Kie-Song and D. Kostzer. (2010). Public Works and Employment
Programmes: Towards a Long-Term Development Approach. Working Paper Number 66, International Policy Center for Inclusive Growth and the Poverty Group, United Nations Development Programme. 48 p.
Martinez-Fernandez, C. and M. Powell. (2009). Employment and Skills Strategies in Southeast
Asia: Setting the Scene. Organisation for Economic Cooperation and Development (OECD) and Local Economic and Employment Development (LEED). 112 p.
Morrison, N. (2006). Active Labor Market Programs Evidence from Evaluations. World Bank
Employment Policy Primer No. 7, World Bank. 6 p. National Economic and Development Authority. 2011. Philippine Development Plan 2011-2016.
411 p. Organization for Economic Cooperation and Development. 1993. Employment Outlook . Page, J. and Soderbom, M. (2012). "Is Small Beautiful? Small Enterprise, Aid and Employment
in Africa," Working Papers UNU-WIDER Research Paper , World Institute for Development Economic Research (UNU-WIDER)

91
Tamangan, R., Josef, F. and Habito, C. (2004). Small and Medium Enterprise Development Experience and Policy in Japan and the Philippines: Lessons and Policy Implications. Philippine Institute for Development Studies Discussion Paper No. 2004-30.
World Bank (n.d.) Guide to Growth, Employment and Productivity Analysis

92
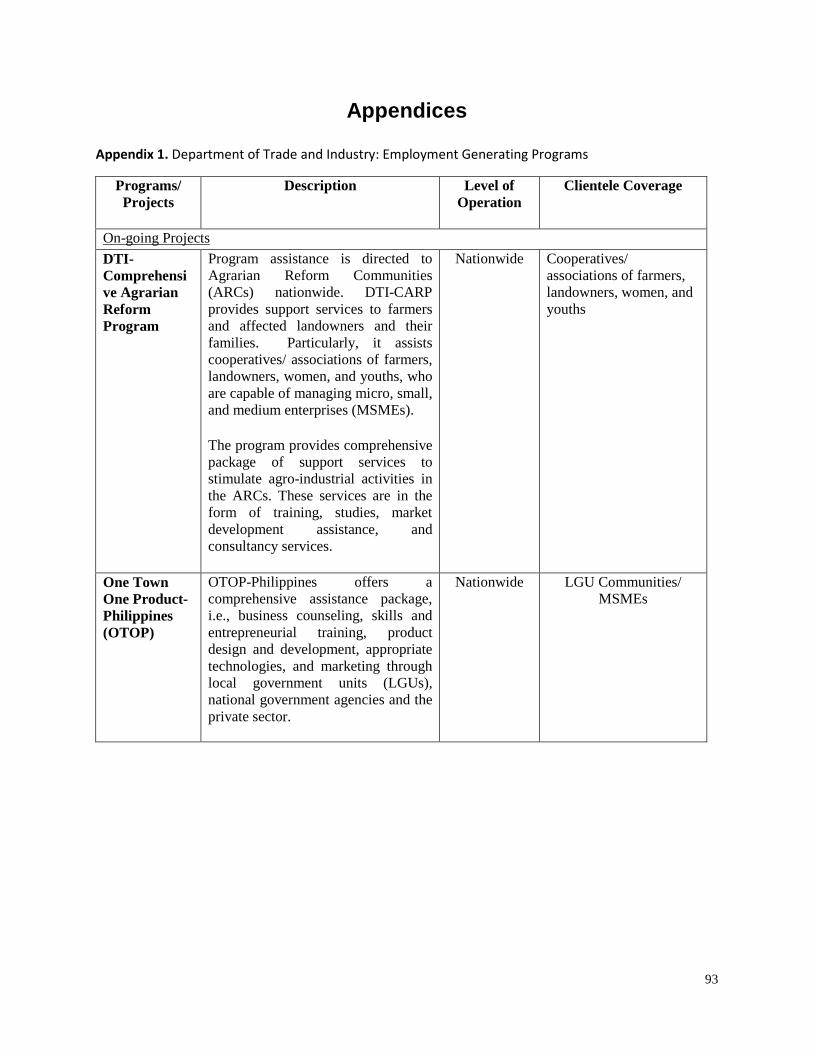
93
Appendices Appendix 1. Department of Trade and Industry: Employment Generating Programs
Programs/ Projects
Description Level of Operation
Clientele Coverage
On-going Projects DTI-Comprehensive Agrarian Reform Program
Program assistance is directed to Agrarian Reform Communities (ARCs) nationwide. DTI-CARP provides support services to farmers and affected landowners and their families. Particularly, it assists cooperatives/ associations of farmers, landowners, women, and youths, who are capable of managing micro, small, and medium enterprises (MSMEs). The program provides comprehensive package of support services to stimulate agro-industrial activities in the ARCs. These services are in the form of training, studies, market development assistance, and consultancy services.
Nationwide Cooperatives/ associations of farmers, landowners, women, and youths
One Town One Product-Philippines (OTOP)
OTOP-Philippines offers a comprehensive assistance package, i.e., business counseling, skills and entrepreneurial training, product design and development, appropriate technologies, and marketing through local government units (LGUs), national government agencies and the private sector.
Nationwide
LGU Communities/ MSMEs

94
Rural Microenterprise Promotion Program (RuMEPP)
RUMEPP is a 7-year Program assisted by the International Fund for Agricultural Development (IFAD) which aims to enable poor households and entrepreneurs to get technical and financial support for micro-enterprises, which can, in turn, benefit other poor families through new job opportunities. Also, the Programme will assist the Small Business Guarantee and Finance Corporation (SBGFC) and microfinance institutions (MFIs) to strengthen their operations and expand their reach to more poor families.
Nationwide Poor Rural Households
Export Pathways Programs (EPP)/ Regional Interactive Platform for Philippine Exports (RIPPLES)
A program that aims to expand Philippine exports by increasing the number of suppliers/exporters of quality export products and services to enable the Philippines to meet global demand and contribute to employment generation. The EPP is a systematic approach designed to provide interventions at every stage of an exporter’s growth. The RIPPLES, a partner program of EPP, enables the regional and provincial staff to handhold potential exporters thru capacity building and provision of direct interventions (e.g. product design, market info seminar, compliance with market requirements, export marketing activities) to potential and existing exporters enrolled under the EPP.
Nationwide Suppliers/Exporters
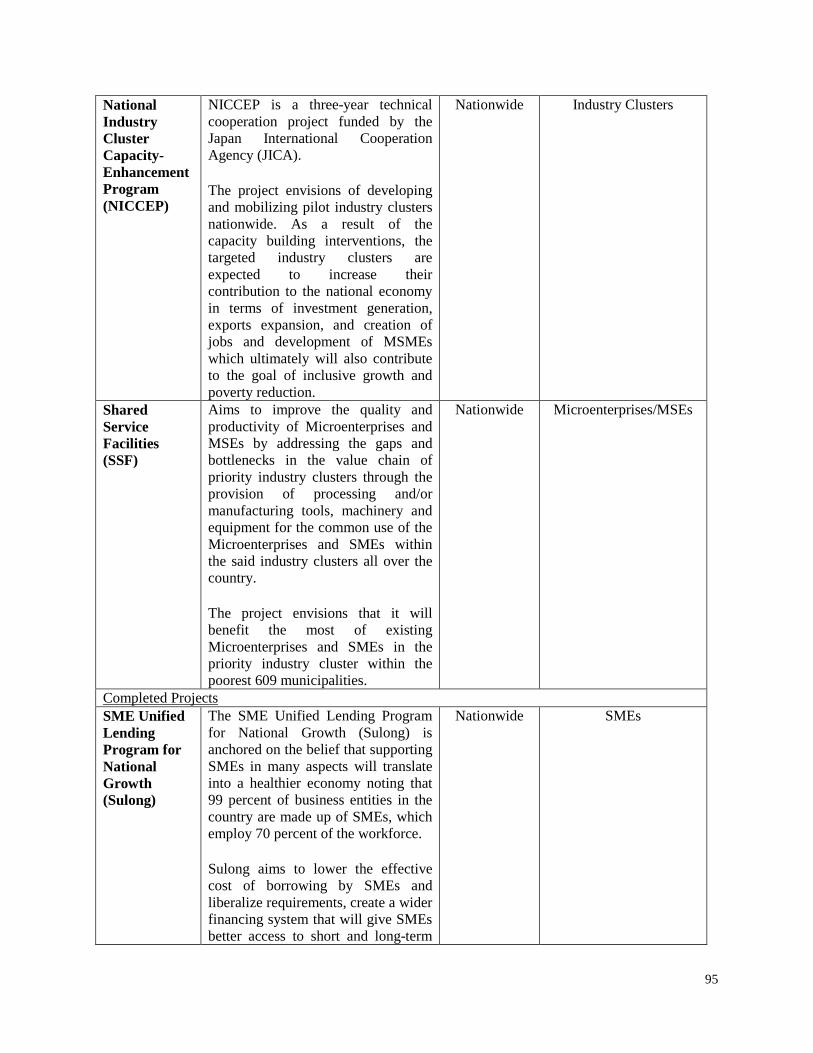
95
National Industry Cluster Capacity-Enhancement Program (NICCEP)
NICCEP is a three-year technical cooperation project funded by the Japan International Cooperation Agency (JICA). The project envisions of developing and mobilizing pilot industry clusters nationwide. As a result of the capacity building interventions, the targeted industry clusters are expected to increase their contribution to the national economy in terms of investment generation, exports expansion, and creation of jobs and development of MSMEs which ultimately will also contribute to the goal of inclusive growth and poverty reduction.
Nationwide Industry Clusters
Shared Service Facilities (SSF)
Aims to improve the quality and productivity of Microenterprises and MSEs by addressing the gaps and bottlenecks in the value chain of priority industry clusters through the provision of processing and/or manufacturing tools, machinery and equipment for the common use of the Microenterprises and SMEs within the said industry clusters all over the country. The project envisions that it will benefit the most of existing Microenterprises and SMEs in the priority industry cluster within the poorest 609 municipalities.
Nationwide Microenterprises/MSEs
Completed Projects SME Unified Lending Program for National Growth (Sulong)
The SME Unified Lending Program for National Growth (Sulong) is anchored on the belief that supporting SMEs in many aspects will translate into a healthier economy noting that 99 percent of business entities in the country are made up of SMEs, which employ 70 percent of the workforce. Sulong aims to lower the effective cost of borrowing by SMEs and liberalize requirements, create a wider financing system that will give SMEs better access to short and long-term
Nationwide SMEs

96
funds and standardize lending procedures. Under the program, SMEs get the necessary assistance not only in terms of financing but likewise through market exposure, human resource training and product development.
Small and Medium Enterprise Development for Sustainable Employment Program (SMEDSEP): Enhancing Businesses in the Visayas (thru GTZ)
SMEDSEP is a cooperation development project between the Republic of the Philippines and the Federal Republic of Germany that aims to improve the business and investment climate for MSMEs in the country, focusing on the Visayas region. It contributes to the efforts of the Philippine government to improve the framework conditions for private sector development in the country.
Visayas SMEs
Small Business Guarantee and Finance Corporation (SBGFC)
To help the SME sector offset some of the effects of the Asian financial crisis, the DTI, through this project, intervened to address the dearth in funds.
Nationwide SMEs
Tulong sa Tao Microfinancing Program
This program seeks to address the credit needs of existing and potential micro-entrepreneurs through the extensive use of NGOs as conduits for lending and technical assistance.
Nationwide Micro-entrepreneurs
Self-Employment Loan Assistance (SELA) II
This is a financing program which assists entrepreneurs through NGOs.
Nationwide Entrepreneurs
Credit Program for the Poorest of the Poor (CPPP)
This is a financing program which assists entrepreneurs/rural workers through NGOs.
Entrepreneurs/Rural workers
Techno-managerial and Regular Trainings Livelihood and Skills Development
Training Programs for SMEs/ Entrepreneurial training for communities.
Nationwide SMEs and LGU Communities

97
Source: DTI Office of Operational Planning

98
Appendix 2. Department of Social Welfare and Development: Employment Generating Programs
Programs/Projects
Description Level of Operation
Clientele Coverage
On-going Projects Self-Employment Assistance-Kaunlaran I & II (SEA-K)/ Sustainable Livelihood Program
The Sustainable Livelihood Programs is a community-based capacity building program implemented through the Community Driven Enterprises Development approach, which equips program participants to actively contribute to production and labor markets by looking at available resources and accessible markets. It relies on multi-stakeholder partnerships and participatory community planning, implementation and monitoring. The capacity building of the SLP is implemented through a two-track program. The first track, the Micro-Enterprise Development Track, supports micro-enterprise in becoming organizationally and economically viable. Meanwhile, the second track, the Employment Facilitation, assists the participants to access appropriate employment opportunities. SLP implementation highlights five stages such as Pre-implementation, Social Preparation, Capacity Building, Resource Mobilization and Management and Sustainability.
Nationwide Pantawid and Non-Pantawid Beneficiaries
Cash/Food for Work Project for Internally Displaced Person
A short-term intervention to provide temporary employment to distressed/displaced individuals by participating in or undertaking preparedness, mitigation, relief, rehabilitation or risk reduction projects and activities in their communities or in evacuation centers.
Nationwide Distressed/Displaced Individuals

99
Recovery and Reintegration Program for Trafficked Persons (RRTP)
A comprehensive program that will ensure that adequate recovery and reintegration services will be provided to trafficked persons. Utilizing a multi-sectoral approach, it will deliver a complete package of services that will enhance the psychosocial, social and economic needs of the clients It will enhance the awareness, skills and capabilities of the clients, the families and the communities where the trafficked persons will eventually return to. It will also improve community-based systems and mechanisms that will ensure the recovery of the victims-survivors, and prevent other family and community members from being victims of trafficking.
Nationwide Trafficked Persons
Government Internship Program
This program is part of the Kabataan 200 program of the government and has been implemented in DSWD since 1996. It was developed with the end goal of providing opportunity for both out-of-school youth and in-school youths as hands-on experience of working in various government agencies at the same time earn money to augment for their school needs, hence this program is usually implemented during summertime.
Nationwide Out-of-school and In-school youths
Comprehensive Program for Street Children, Street Families and Ips Especially Bajaus
The program is an integrated approach in responding to the needs of street children, their families and Bajaus, with an ultimate goal of reducing the number of children, families and indigenous people in the streets. Through this Program, the Department will send the street children to schools by providing them with educational assistance, strengthen the operation of activity centers for children for their literacy and recreational activities, and
Nationwide Street children and Bajaus
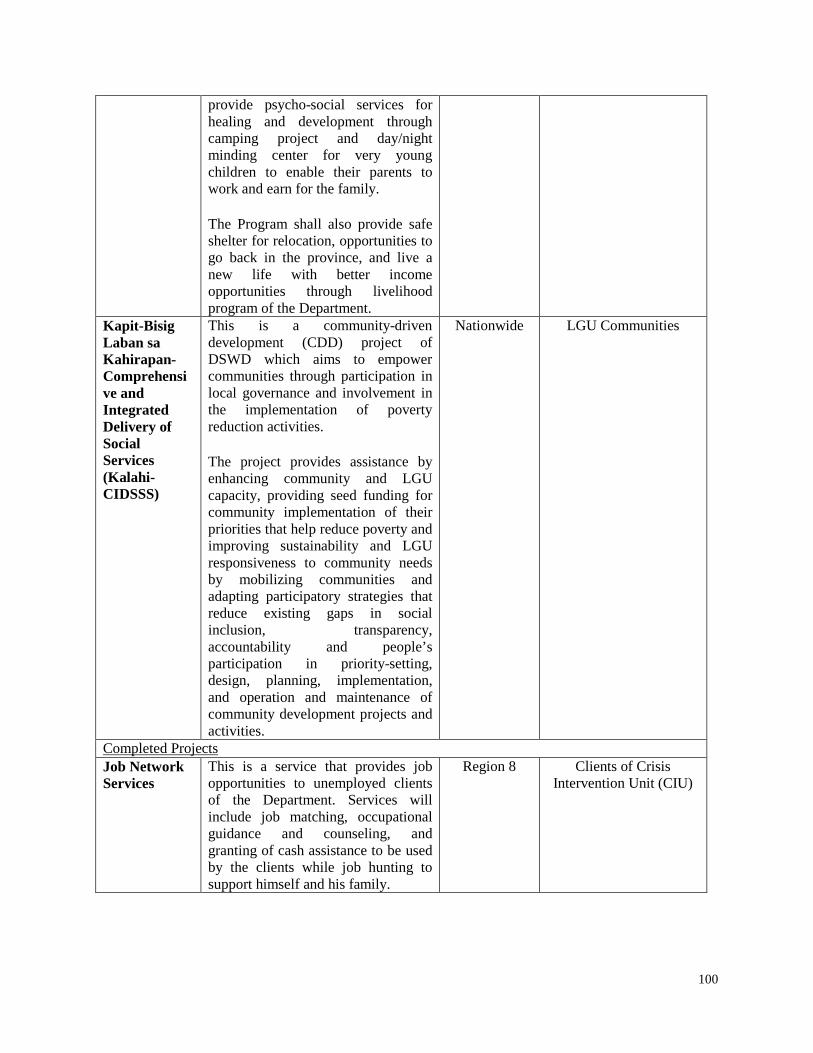
100
provide psycho-social services for healing and development through camping project and day/night minding center for very young children to enable their parents to work and earn for the family. The Program shall also provide safe shelter for relocation, opportunities to go back in the province, and live a new life with better income opportunities through livelihood program of the Department.
Kapit-Bisig Laban sa Kahirapan-Comprehensive and Integrated Delivery of Social Services (Kalahi-CIDSSS)
This is a community-driven development (CDD) project of DSWD which aims to empower communities through participation in local governance and involvement in the implementation of poverty reduction activities. The project provides assistance by enhancing community and LGU capacity, providing seed funding for community implementation of their priorities that help reduce poverty and improving sustainability and LGU responsiveness to community needs by mobilizing communities and adapting participatory strategies that reduce existing gaps in social inclusion, transparency, accountability and people’s participation in priority-setting, design, planning, implementation, and operation and maintenance of community development projects and activities.
Nationwide LGU Communities
Completed Projects Job Network Services
This is a service that provides job opportunities to unemployed clients of the Department. Services will include job matching, occupational guidance and counseling, and granting of cash assistance to be used by the clients while job hunting to support himself and his family.
Region 8 Clients of Crisis Intervention Unit (CIU)

101
Youth Productivity Service
This is an integrated skills and job placement program. It aims to improve education and employment opportunities for out-of-school youth through technical/vocational training in partnership with local government units, corporations, industries and other concerned agencies.
Region 10 Out-of-school youths
Tindahan Natin
The Tindahan Natin Project, which started in 2006, is a national government initiative for food security, job generation and livelihood. It is part of the Hunger Mitigation Program of the Arroyo Administration.
Nationwide LGU Communities
Source: DSWD Policy Development and Planning Bureau

102
Appendix 3. Department of Agrarian Reform: Employment Generating Programs
Programs/Projects
Description Level of Operation
Clientele Coverage
ARC Development
The ARC development strategy aims to increase farm production, improve household income and promote sustainable rural development through the provision of support services like infrastructure, credit, training, technology and community organizing in land reform areas.
Nationwide Agrarian Reform Communities
DAR-Local Credit Assistance Program
A lending program wherein accredited program partners or conduits re-lend the funds to end-beneficiaries for livelihood micro-projects in the ARCs (i.e. livestock and poultry production; vegetable and root crop production; dried and smoked fish processing, sari-sari store, handicrafts making).
Nationwide Agrarian Reform Beneficiaries
Credit Assistance Program for Program Beneficiaries Development (CAP-PBD)
This is a special lending window specifically for ARB cooperatives and farmers’ organizations in ARCs. This program makes available credit for agricultural production inputs, pre- and post-harvest facilities and fixed assets.
Nationwide Agrarian Reform Beneficiaries-Cooperatives
DAR-KMI Peasant Development Fund
This was established in 1993 as a source of non-traditional credit for organized farmers, fisherfolks and rural women for agro-industrial development. This fund is primarily provided to enable the peasantry to participate in agro-industrial development.
Nationwide Organized farmers, Fisher folks and Rural
women
DAR-Technology and Livelihood Resource Center Partnership Program for Non-Rice
The program aims to uplift the economic condition of ARBs in the ARCs through the timely provision of credit for viable non-rice livelihood projects. Eligible projects under this program include processing, manufacturing, crop production (except rice) and other technology and livelihood projects.
Nationwide Agrarian Reform Beneficiaries

103
Livelihood Projects
Microfinance Innovations in Cooperatives (MICOOP)
The MICOOP was established by the National Confederation of Cooperatives (NATCCO) in 2006. It was launched as a special project that intends to extend the reach of cooperatives’ microfinance services to the poorest of the poor who desire to engage in micro, small and medium enterprises but have no access to formal lending institutions.
Nationwide Potential Entrepreneurs in LGU Communities
Micro-Agri Loan Product (MALP)
The MALP is a multi-platform approach in micro finance delivery. The program, which started in December 2008, seeks to provide sustainable credit access to ARBs by developing various micro-agri loan products channeled through ARC cooperatives, bank–assisted cooperatives and countryside financial institutions.
Nationwide Agrarian Reform Beneficiaries
DAR-Center for Agriculture and Rural Development, Inc. (DAR-CARD)
In June 2008, DAR forged partnership with the Center for Agriculture and Rural Development (CARD), Inc. to implement the Microfinance Capacity Development Program for 12 Partner Organizations.
Nationwide Agrarian Reform Beneficiaries
ARBs Training/Farmer-Beneficiaries Training
The Department is pursuing an intensive ARB-driven education and training program geared towards program awareness, capability building and self-reliance among ARBs. The training programs are on: 1) land tenure improvement (LTI); 2) social infrastructure and local capability building (SILCAB); 3) sustainable area-based enterprise development (SARED); and 4) basic social services development (BSSD).
Nationwide Agrarian Reform Beneficiaries

104
Sustainable Agribusiness and Rural Enterprise Development (SARED)
Interventions provided to ARBs are geared at enabling them to eventually own, operate and manage their farm, non-farm and off-farm enterprises.
Nationwide Agrarian Reform Beneficiaries
Source: DAR Annual Reports

105
Appendix 4. Department of Labor and Employment: Employment Generating Programs
Programs/Projects Description Level of
Operation
Clientele
Coverage
Lead
Agency
Ongoing Programs/Projects
1. Special Program
for Employment of
Students (SPES)
The SPES is mandated under Republic Act No. 7323 otherwise known as
“An Act To Help Poor But Deserving Students Pursue Their Education By
Encouraging Their Employment During Summer and/or Christmas
Vacations, Through Incentives Granted to Employers, Allowing Them to
Pay Only Sixty Per Centum (60%) of Their Salaries or Wages and The
Forty Per Centum (40%) Through Education Vouchers To Be Paid By the
Government, Prohibiting and Penalizing The Filing of Fraudulent and
Fictitious Claims, and For Other Purpose.” In partnership with the private
sector and other government offices, qualified students, who are also
soon-to-be entrants to the workforce, are afforded opportunity to earn
while they acquire work experience and positive ethics during summer
and Christmas vacations.
* DOLE Program enrolled under the Community-Based Employment
Program (CBEP)
Nationwide Students/Employers
(Government or
Private)
Bureau of
Local
Employment
(BLE)
2. Kasanayan at
Hanapbuhay
(KasH) Program
KasH affords new graduates and young workers with the opportunity to
acquire the six-month work experience and entry-level requirement of
the industry. Under this bridging mechanism, workers are trained as
apprentices for four (4) to Six (6) months and paid 75% of the minimum
wage or 100% if employers avail of tax incentives.
Nationwide
Youth/New
graduates
Technical
Education
and Skills
Development
Authority
(TESDA)
3. DOLE Integrated
Livelihood
Program
DOLE Integrated Livelihood Program is designed to assist community
groups in developing sustainable enterprises or undertakings right in
their communities thereby providing opportunities for generation
incomes through wage and self-employment. It aims to enhance and
transform existing livelihood projects in the barangays into community
enterprises to be managed by community groups.
Nationwide
Ambulant vendors/
Drivers and
operators of pedicab
and tricycles/
Homebased and
home service
Bureau of
Workers with
Special
Concerns
(BWSC)

106
Programs/Projects Description Level of
Operation Clientele Coverage
Lead Agency
* DOLE Program enrolled under the Community-Based Employment
Program (CBEP)
workers/Scrap
collector workers/
Landless farmers/
Mariginal Fishery
Workers/Others
deemed necessary to
be covered by the
DOLE and LGU
4. Self-Reliant
Organization for
Comprehensive
Agrarian Reform
Program (SRO-
CARP)
The program provides organizational and technical assistance and other
support services to agrarian reform farm workers/beneficiaries turned
farm-owners/managers to help them transform into self-reliant
organizations in three (3) to five (5) years’ time that are politically,
socially and economically viable.
It involves capability building among agrarian reform beneficiaries in
selected commercial or plantation farms leading to their competencies
in collectively managing their farms in order to further and promote
and/or generate income and employment opportunities in their
respective communities
Regions 9,
10 & 11
Farm workers/
beneficiaries turned
owners/ managers
Bureau of
Workers with
Special
Concerns
(BWSC)
5. Workers
Organization and
Development
Program (WODP)
The program promotes and strengthens workers’ organizations as the
mechanism for workers empowerment by providing them with training,
education, information and entrepreneurship development assistance.
Its components are: workers capability development training; creation of
upgrading of libraries; and provision of scholarship for officers and
members of workers organizations.
Nationwide
Trade union centers,
labor federations,
national unions,
locals/chapters and
independent unions;
Women workers’
organizations, and
Workers’
cooperatives
Bureau of
Labor
Relations
(BLR)

107
Programs/Projects Description Level of
Operation Clientele Coverage
Lead Agency
6. Reintegration
Program for OFWs
The program aims to maximize the gains of overseas employment,
mitigate the social cost of migration and cushion the impact of forced
repatriation due to unexpected events.
The program involves the preparation of the OFW and their families for
their eventual return in the country.
This involves the organization of families left behind and the conduct of
various training on financial literacy and entrepreneurial development
training as well as the provision of credit facility for those who may wish
to start their business.
On June 7, 2011, the loan program was launched during the celebration
of the 1st
National Congress of OFWs and Families, with Development of
Bank of the Philippines and the Landbank of the Philippines contributing
P500-million each, thereby increasing the reintegration fund to P2
billion.
Nationwide
Member-OFWs and
their dependents
Overseas
Workers
Welfare
Administratio
n (OWWA),
Philippine
Overseas
Employment
Administratio
n (POEA)
7. TULAY 2000
(Tulong Alalay sa
mga Taong may
Kapansanan)
TULAY 2000 is a program to assist the integration of persons with
disability in the mainstream of society by enhancing their employability
through skills training programs suited to their interests, potentials and
circumstances; facilitating their placement to wage employment; and
providing them technical and financial livelihood support assistance
either as individual or group.
Nationwide
Persons with
disabilities
Bureau of
Local
Employment
(BLE)
8. Katulong at Gabay
sa mga
Manggagawang
may Kapansanan
(KAGABAY)
KAGABAY is a special assistance program to workers and their families in
the event of major accidents or outbreak of occupational diseases. It
aims to facilitate the integration of occupational disabled workers into
the economic mainstream and make them once again productive
members of society.
Nationwide
Occupationally
disabled workers and
families
Employees’
Compensatio
n Commission
(ECC)

108
Programs/Projects Description Level of
Operation Clientele Coverage
Lead Agency
9. DOLE –Adjustment
Measures
Program (DOLE-
AMP)
A special package of interventions purposely directed to prevent job
losses by assisting displaced workers affected by globalization and the
financial crisis in their search for alternative employment opportunities.
This is done thru the Quick Response Teams (QRTs) in all Regional
Offices. The components of this package include livelihood assistance,
training/retraining services.
Nationwide
Retrenched/Displace
d Workers
Bureau of
Local
Employment
(BLE)
10. Worktrep Program
(Unlad Kabuhayan
Laban sa
Kahirapan)
This is a DOLE initiated program to make the businesses of the Workers
in the informal sector, termed as the IS-Worktreps, grow. It is a program
intended to bring about improved socio-economic well-being of the poor
IS-Worktreps, thus, contributing to the Government’s Goal of reducing
poverty
Nationwide
Informal Sector-
Worktreps
Bureau of
Workers with
Special
Concerns
(BWSC),
Regional
Offices (ROs)
11. Promotion of Rural
Employ-ment and
Self-Employment
and
Entrepreneurship
Development
(PRESEED)
PRESEED promotes self-employment among rural workers and their
families who have entrepreneurial potentials by providing them access
to a package of integrated services, from human and institutional
development to a more comprehensive entrepreneurial development
support system
Nationwide
Rural Workers
Bureau of
Workers with
Special
Concerns
(BWSC)
12. Women Workers
Employment and
Entrepreneurship
Development
The WEED program is an affirmative action to improve the plight of
Filipino Women, especially those in the informal sector. It seeks to
strengthen the role pf women as partner in economic development by
supporting them in the areas of entrepreneurship and income-
Nationwide
Working women in
the informal sector,
specifically
underemployed and
Bureau of
Workers with
Special
Concerns

109
Programs/Projects Description Level of
Operation Clientele Coverage
Lead Agency
(WEED) generating concerns, primarily utilizing the “Training-Cum-Production
Scheme” which consists of the Entrepreneurship Development Training
(EDT) and the Appropriate Skills training (AST).
home-based workers (BWSC)
Completed Programs and Projects
1. Classroom Galing
sa Mamamayang
Pilipino Abroad
(CGMA)
The CGMA is a donate-a-classroom project tapping primarily the
resources of overseas Filipino community groups overseas, in
partnership with the Dept. of Education (DepEd), Department of Foreign
Affairs (DFA), and the Filipino-Chinese Chamber of Commerce and
Industry (FCCCI).
The project is in support of the President’s thrust of reducing the
shortage of classrooms. Each classroom, sized 7 x 7 meters with
washroom facilities, benefits at least 50 students, the actual construction
of which generates employment for about 20 Filipino laborers.
Nationwide
Schools/Unemployed
Persons
DOLE
2. OFW Groceria
Project
The OFW Groceria Project grants interest-free loan to qualified OFW
Family Circles in the form of P50 thousand worth of grocery items and
goods.
Nationwide
OFWs and their
families
Overseas
Workers
Welfare
Administratio
n (OWWA)
3. OFW Enterprise
Development
This program involves the provision of technical and financial assistance
to develop OFWs and their families as entrepreneurs.
Nationwide
FWs and their
families
Overseas
Workers
Welfare
Administratio
n (OWWA)
4. Poverty-Free Zone
The PFZP is a convergence strategy, which aims to deliver a package of
Nationwide
Informal and rural
Bureau of

110
Programs/Projects Description Level of
Operation Clientele Coverage
Lead Agency
(PFZ) Program
(Aksyon ng
Sambayanan
Laban sa
Kahirapan)
organizational, entrepreneurship and training interventions to identified
communities toward the development of core and support enterprises
that take advantage of local resources.
workers in poor
communities
Workers with
Special
Concerns
(BWSC)
5. Working Youth
Center (WYC)
Program
The WYC Program aims to develop the Filipino young workers into
effective leaders, self-reliant and productive citizens. It involves the
following:
– Setting up of and provision of assistance to WYCs which are designed
basically to promote total development of working young women
and men through the upliftment of their socio-economic well-being;
– Organization and strengthening of working youth associations/
organizations for their own collective protection and benefit and for
facilitating the delivery of program's services to them;
– Facilitation of the delivery of existing programs to the young workers
such as training, employment and other programs that will ensure
the fullest development of the young workers' potential and
productivity;
– Enlightenment of the young workers on government laws, rules and
regulations and on other issues relating to their employment; and
– Mobilization of all sectors and available resources in undertaking
programs, services and activities for the full attainment of the young
workers' participation in labor and development.
Nationwide
Working youth ages
15-30 who are
employed, self-
employed and
underemployed:
Bureau of
Workers with
Special
Concerns
(BWSC)
Source: DOLE
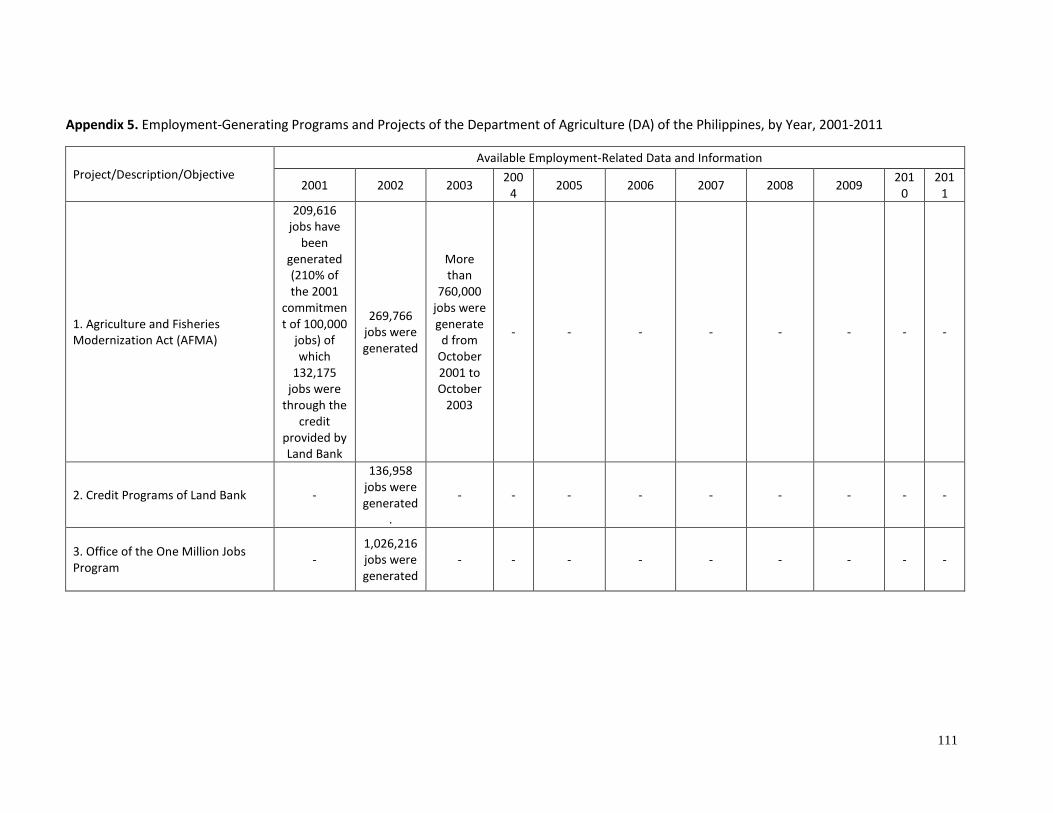
111
Appendix 5. Employment-Generating Programs and Projects of the Department of Agriculture (DA) of the Philippines, by Year, 2001-2011
Project/Description/Objective
Available Employment-Related Data and Information
2001 2002 2003 200
4 2005 2006 2007 2008 2009
201
0
201
1
1. Agriculture and Fisheries
Modernization Act (AFMA)
209,616
jobs have
been
generated
(210% of
the 2001
commitmen
t of 100,000
jobs) of
which
132,175
jobs were
through the
credit
provided by
Land Bank
269,766
jobs were
generated
More
than
760,000
jobs were
generate
d from
October
2001 to
October
2003
- - - - - - - -
2. Credit Programs of Land Bank -
136,958
jobs were
generated
.
- - - - - - - - -
3. Office of the One Million Jobs
Program -
1,026,216
jobs were
generated
- - - - - - - - -

112
4. Medium-Term Philippine
Development Plan 2004-2010
(MTPDP) Related Employment
- - - -
686,143
jobs were
generated
invalidate
d areas
and
313,291
jobs were
generated
in
developed
areas
532,646
jobs were
generated
.
393,557
jobs were
generated
.
509,206
jobs were
generate
d
2,615,079
jobs were
generated
.
- -
Sources of data: DA Annual Reports and/or Annual Accomplishment Reports
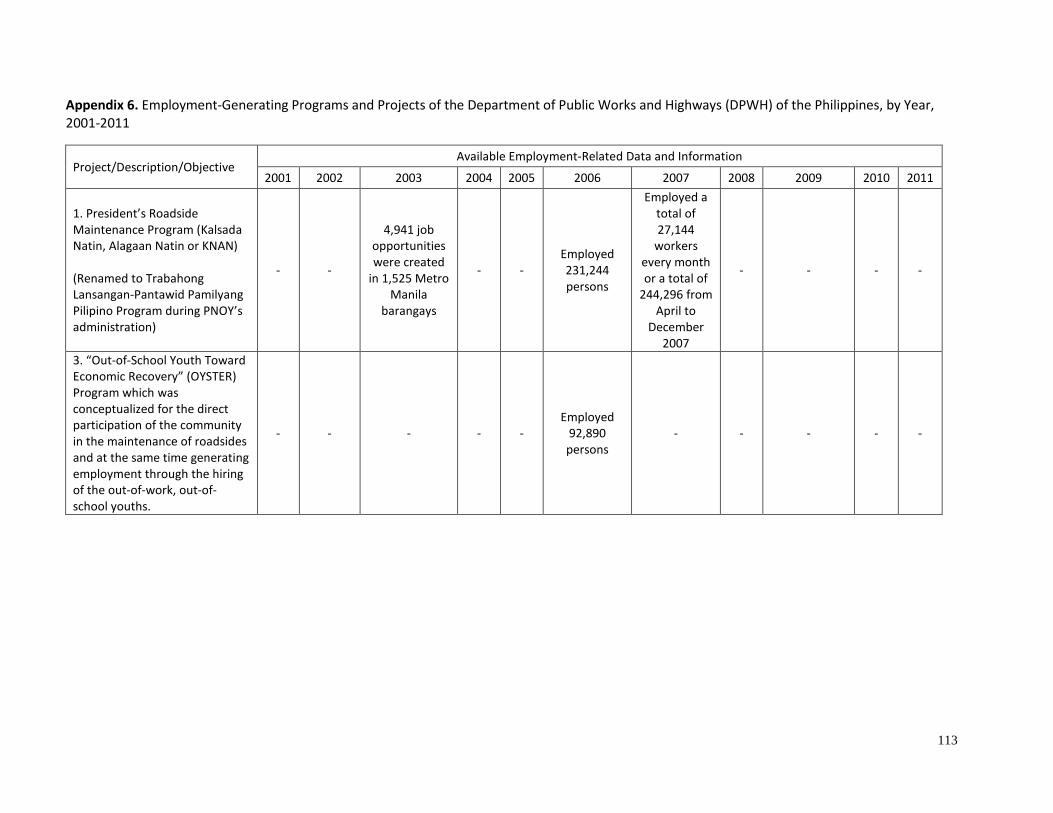
113
Appendix 6. Employment-Generating Programs and Projects of the Department of Public Works and Highways (DPWH) of the Philippines, by Year,
2001-2011
Project/Description/Objective Available Employment-Related Data and Information
2001 2002 2003 2004 2005 2006 2007 2008 2009 2010 2011
1. President’s Roadside
Maintenance Program (Kalsada
Natin, Alagaan Natin or KNAN)
(Renamed to Trabahong
Lansangan-Pantawid Pamilyang
Pilipino Program during PNOY’s
administration)
- -
4,941 job
opportunities
were created
in 1,525 Metro
Manila
barangays
- -
Employed
231,244
persons
Employed a
total of
27,144
workers
every month
or a total of
244,296 from
April to
December
2007
- - - -
3. “Out-of-School Youth Toward
Economic Recovery” (OYSTER)
Program which was
conceptualized for the direct
participation of the community
in the maintenance of roadsides
and at the same time generating
employment through the hiring
of the out-of-work, out-of-
school youths.
- - - - -
Employed
92,890
persons
- - - - -

114
4. Nationwide jobs’ Fair which
was aimed to provide gainful
employment to workers
displaced or affected by the
global recession.
- - - - - - - -
About 57,713
applicants
were hired by
the
participating
827
contractors
nationwide.
Also, with
thousands of
government
infrastructure
projects being
implemented
nationwide, a
total of
653,496 jobs
were
generated for
infrastructure
- -
Sources of data: DPWH Annual Reports and/or Annual Accomplishment Reports

115
Appendix 7. Employment-Generating Programs and Projects of the Department of Transportation and Communication (DOTC) of the Philippines,
by Year, 2001-2011
Project/Description/Objective Available Employment-Related Data and Information
2001 2002 2003 2004 2005 2006 2007 2008 2009 2010 2011
1. Comprehensive Livelihood
and Emergency Employment
Program (Light Railway Transit
Authority or LRTA)
- - - - - - - - - - 19 workers were
employed
2. Mactan-Cebu International
Airport Authority (MCIAA) - - - - - - - - - -
provided livelihood
opportunities to 40
visually impaired persons
3. Manila International Airport
Authority (MIAA) - - - - - - - - - -
provided employment to
1,899 individuals in
janitorial services and
similar jobs
4. Philippine Aerospace
Development Corporation
(PADC)
- - - - - - - - - -
utilized 17 job orders and
28 on-the-job trainees in
its maintenance activities
5. Philippine Coast Guard
(PCG) - - - - - - - - - -
500 applicants were
accepted as trainees
6. Philippine Merchant Marine
Academy (PMMA) - - - - - - - - - -
PMMA graduates
comprised 10 percent of
the 50,000 Filipino deck
and engine officers
7. Philippine National Railways
(PNR) - - - - - - - - - -
A total of 214 personnel of
PNR were recorded and
1,200 workers with job
order status was recorded
8. Philippine Ports Authority
(PPA) - - - - - - - - - -
Granted employment to
1,468 people in ports
nationwide.
Sources of data: DOTC Annual Reports and/or Annual Accomplishment Reports

116
Appendix 8. Status on the collection of data on completed government projects which are related to
employment generation
Other than those generated from the annual reports and/or accomplishment reports of the individual government departments, additional data and information were solicited from the departments relevant to the study, either through DBM itself or through the initiative of the PIDS study team. Below, these additional data and information and the process of generating them are explained by individual department. a. Department of Agriculture
The DA has designated the following focal person in the department to coordinate with the DBM and the study team on data gathering matters.
Carlos Magnaye, OIC Planning Service Tel. No.: 920 1921 Email: [email protected]
Through the efforts of the aforementioned focal point and the study team, a focused group discussion (FGD) was conducted at the DA on July 9, 2013 attended by the following DA personnel: Jallyne Remoquitto- Technical Staff/HVCDP Marie Flor Aquino- Technical Staff/HVCDP Email: [email protected] Angelita Martin- PDO II/DA-SPCMAD Adamar Estrad- PDO II/DA-SPCMAD Email: [email protected] Roan Nuelan- Project Assistant II/FMRDP Email: [email protected] Eduardo Sanguyo- Statistician III/BAS Email: [email protected] Vincent Chua- Agriculturist II/Livestock Dev’t Council Freido Prado- Senior Agriculturist/Livestock Dev’t Council Email: [email protected] Representative from the Rice Program Email: [email protected]
The aforementioned personnel at the DA explained that at present, the main functions of the department do not include generating jobs/employment. They explained that it was only during the time of President Arroyo that the DA projects and programs were aimed specifically

117
to create jobs. However, the department also reports incidental jobs created by projects and programs at present.
The incidental jobs reported by the DA are computed based on a list of coefficients and therefore are only derived and not actual figures. A coefficient which is usually different per subsector (e.g. 1 job/ha) is used to compute for the jobs created per project or program. The list of coefficients of each sector will be provided by the DA through email based on which the study team can compute the incidental jobs generated. As of this writing, however, only the high value crops development program (HVCDP) of the DA has provided the study team with some data and information.
Since job generation is not a main function of the DA, current monitoring and evaluation of the projects and programs is not concerned on the number of jobs created per project or program. The DA has two monitoring reports, one of which is strategic which monitors projects/programs based on the set objectives and the other is operational which checks the day to day progress of projects/programs. A recent monitoring report is promised to be sent through to the study tram but this has not been received yet.
Aside from the comprehensive annual reports uploaded in the DA website, each subsector of agriculture has its own annual report in the DA. This is a detailed subsector report where the figures in the final DA annual reports are sourced. The DA said that each sector will also provide its own annual report to the study team through email. As of this writing, only the HVCCP has e-mailed its annual physical accomplishment reports for 2008 to 2012. Only data for 2008 and 2012 are relatively enough for use by the study team.
Aside from the results of the FGD, a letter document was forwarded to the study team by
the DBM. This letter from Hon. DA Secretary Proceso J. Alcala to Hon. DOLE Secretary Rosalinda Baldoz showed the accomplishment of the DA on the jobs generated under the Community-Based Employment Program (CBEP) as of December 31, 2012.
b. Department of Labor and Employment
The DOLE has designated the following focal person in the department to coordinate with the DBM and the study team on data gathering matters. Analee delos Santos, Div. Chief Planning Service Arlene Marasigan, Planning Service Tel. No.: 527 3000 local 612/615 Email: [email protected]
The Planning Service Department of the DOLE, however, is currently busy with its post-assessment of projects. The staff will be available for interview or FGD by the second week of August (As of this writing, an appointment has not been set yet). Aside from this development, the following documents have been received by the study team:

118
1) A copy of a letter from Hon. DOLE Acting Secretary Rebecca Chato to Hon. DBM Undersecretary Laura B. Pascua which forwarded the following documents:
- DOLE Employment Generation Programs and Projects with brief profile of each program
and project that were implemented from 2000 to 2013;
- Infrastructure and Non-infrastructure Programs and Projects enrolled/implemented under the Community-Based Employment Program (CBEP) by different national government agencies, GFis and GOCCs from 2011 to 2012; and
- Programs and Projects which were implemented under the Comprehensive
Livelihood & Emergency Employment Program (CLEEP) by different national government agencies, GFIs and GOCCs in 2009 to assist workers affected by the global crisis.
c. Department of Public Works and Highways
The DPWH has designated the following focal person in the department to coordinate with the DBM and the study team on data gathering matters. Engr. Richard Estanislao Tel. No.: 304 3091 Email: [email protected]
The study team has not scheduled an interview yet at the DPWH as this depends on the availability of Engr. Estanislao. Aside from this development, the following documents have been received by the study team:
1) A copy of the letter from Hon. DPWH Secretary Rogelio Singson to Hon. DBM
Undersecretary Hon. Laura B. Pascua forwarding the following documents:
- Print Materials to be published in various broadsheets and tabloids during the information campaign on nutrition and awareness about Accelerated Hunger Mitigation Program (AHMP) with summary report on status/update, as of 31 October 2009 for the period from CYs 2005 to 2009 and list of completed projects and at various stages of implementation --- Annex "A"
- Status Report of the Farm-to-Market Road (FMR) Projects, funded under the FY 2008
Budget of the Department of Agriculture of the DPWH Region IX, Zamboanga City, under the AHMP --- Annex “B”
- Status Report, as of 31 August 2009 of the AHMP for the DPWH implemented
projects (FMR; Roadside Maintenance; and Water Supply Projects)--- Annex "C"
- Status Report of the AHMP, as of 30 June 2009, Accomplishment below 80% of the FMR projects, FY 2008 DA funded program --- Annex "D"

119
d. Department of Transportation and Communication
The DOTC has designated only the following focal office but not a focal person in the department to coordinate with the DBM and the project team on data gathering matters. Office of Usec. Rene Limcaoco, Planning Service Dir. Creus’ office Tel. No.: 727 1703/725 0204 Email: [email protected]
No date for an interview has been set yet with the DOTC staff because of the busy schedule at the department. Aside from this development, the study team received a copy of a letter from Hon. Ricardo C. Diaz, Director, Program Monitoring and Evaluation Service, to Hon. DBM Undersecretary Hon. Laura B. Pascua forwarding a listing DOTC implemented (airport and port) projects from CY 2000 to the present.
e. Department of Trade and Industry
The DTI has designated the following focal person in the department to coordinate with
the study team on data gathering matters.
Eng. Robert Alvin Arceo, Office of Operational Planning Tel. No.: 8904954 Email: [email protected]
Through the efforts of the aforementioned focal point and the study team, a focused group discussion (FGD) was conducted at the DTI on August 6, 2013 attended by the following DTI personnel:
Ms. Mary Jean Pacheco- Director/OOP Email:[email protected]
Mr. Nonoy Blanco-Program Director/Regional Operations and Development Group Ms. Elma Viray- Technical Staff/RODG Email: [email protected] Ms. Elvira Tan-Chief/Program Development & Coordination/BMSMED Email: [email protected] Mr. Manuel Abad-Program Manager/ DTI-Comprehensive Agrarian Reform Program (CARP) It was explained by OOP that The DTI may not have programs/projects -- the likes of DOLE's Public Employment Service Office (PESO) or Job Fairs -- that specifically aim to generate employment, but they do have industry/SME development programs that assist

120
enterprises to grow and generate jobs in the process. It is a tricky business because enterprises are hesitant to report growth and job generation information. There are also programs, such as the Export Pathways Program (EPP) that provide assistance at every stage of an SME's growth (and thereby creation of jobs), but that just aren't geared to report jobs. Also, the conduct of entrepreneurship briefings that may lead to the development of enterprises but alas, they do not count job generation from these programs as well (more cost to monitor than briefing itself). Data provided by the department are the following:
1. List of on-going projects related with job generation (Description, Year started, Jobs generated (if available))
2. OTOP’s Monitoring Statistics (Regional) 3. DTI-CARP’s Monitoring Statistics (Regional)
Data to be still provided by the department are the following:
1. RUMEPP’s Monitoring Statistics (Regional) 2. RIFFLE’s Monitoring Statistics (Regional)
f. Department of Social Welfare and Development
The DSWD has designated the following focal person in the department to coordinate
with the study team on data gathering matters.
Mr. Joven Valenzuela, Planning and Monitoring Division Policy Development and Planning Bureau Tel. No.: 9318130 Email: [email protected]
Through the efforts of the aforementioned focal point and the study team, an interview was conducted with Ms. Amada Dimaculangan of Sustainable Livelihood Program on August 5, 2013.
Data provided by the department are the following:
1. List of on-going projects related with job generation (Description, Year started, Jobs generated (if available))
2. SLP’s Monitoring Statistics (Regional) Data will still be provided and interview to be conducted for the following projects:
1. Cash/Food for Work Project for Internally Displaced Person 2. Recovery and Reintegration Program for Trafficked Persons (RRTP) 3. Government Internship Program 4. Comprehensive Program for Street Children, Street Families and Ips Especially
Bajaus
121
5. Kapit-Bisig Laban sa Kahirapan-Comprehensive and Integrated Delivery of Social Services (Kalahi-CIDSSS)
g. Department of Tourism
The DOT has designated the following focal person in the department to coordinate with
the study team on data gathering matters.
Mr. Christian Lingat, Data Controller/Tourism Development Planning Tel. No.: 5252928 Email: [email protected]
Through the efforts of the aforementioned focal point and the study team, an interview was conducted with the Office of Product Research & Development headed by Mr. Warner Andrada on August 6, 2013.
Data provided by the department are the following:
1. Data and Program Report on Grassroots Entrepreneurship for Eco Tourism (GREET) program 2. Reports on Eco-Tourism Projects of the Department
h. Department of Agrarian Reform
The DOT has designated the following focal person in the department to coordinate with
the study team on data gathering matters.
Ms. Purita Reynacido, Policy and Planning Service Tel. No.: 4821377 Email: [email protected]
The department has provide a list of List of on-going and completed projects related to employment generation (Description, Year started, Jobs generated (if available)). The list consists of foreign assisted infrastructure projects. Interview will still be conducted with the department.
End