stu budden treasury & investment seminar working capital investment strategies june 14, 2008...
TRANSCRIPT
Stu Budden Treasury & Investment Seminar
Working Capital Investment Strategies
June 14, 2008
Panelists:
Helen Choy – Manager, Trust Accounting & Treasury, University of Toronto
Stu Finlayson – Treasurer, University of Western Ontario
Ron Ritter – Associate Director & Treasurer, University of Alberta
Moderator:
Colin Spinney, Treasurer, Dalhousie University
Working Capital Investment Strategies
Many Canadian universities experience significant accumulation of cash balances as a result of the irregular cash inflows of tuition revenues, operating grants and research funding. This leaves university treasurers with the challenge of determining the optimal investment strategies - where to invest this cash, in what amounts and for what term. This panel discussion will explore the approaches that three universities (University of Alberta, University of Western Ontario, University of Toronto) have used, and share their experiences, challenges and lessons learned.
AGENDA
1. Objectives & Policies
2. Risks & Constraints
3. Approach
4. Challenges
5. Results
6. Lessons Learned
CAUBO Stu Budden Treasury & Investment Seminar
June 14, 2008
Working Capital Investment StrategiesAt the University of Western Ontario
– Stu Finlayson, Treasurer– [email protected]– http://www.uwo.ca/finance/treasury/endowfund.pdf
Objectives and Policies
• Hired Pension Finance Associates (Keith Ambachtsheer) in 1984 to review investment policies
• Categorized investments as:– Endowment funds – Operating funds
• Core non–endowed funds• Operating fund temporary cash surpluses (changes daily)
• Endowments and core non-endowed funds – Invested in the “Operating and Endowed portfolio”
• Temporary cash surpluses– Invested in money market liquid funds or short term bonds
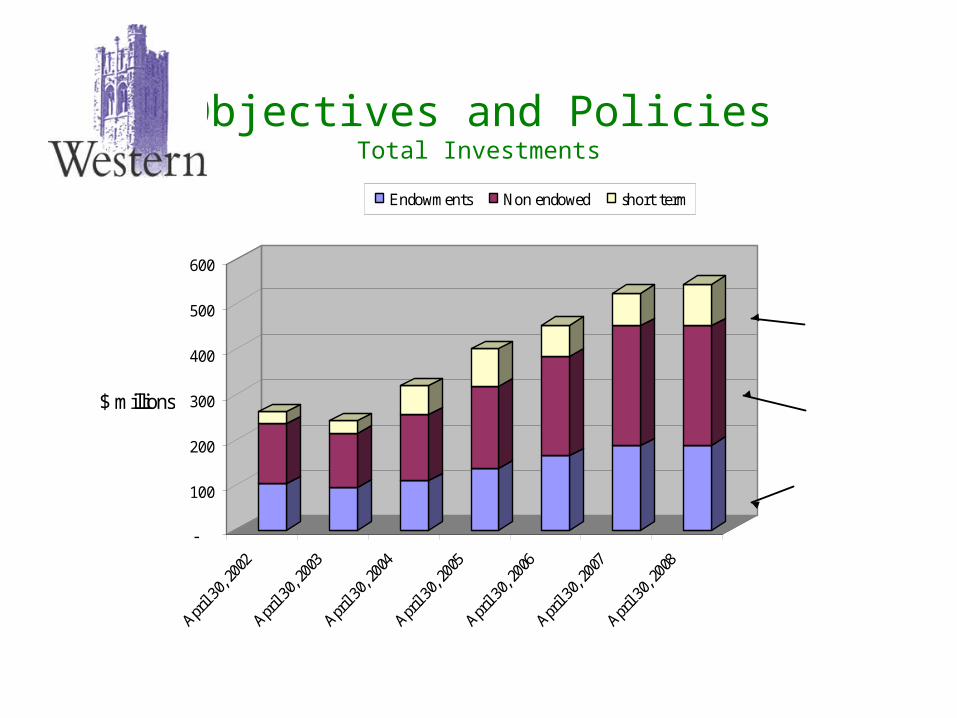
Objectives and PoliciesTotal Investments
-
100
200
300
400
500
600
$ millions
Endowments Non endowed short term
Operating and endowment portfolio
short terminvestmentporfolio
Risks and Constraints
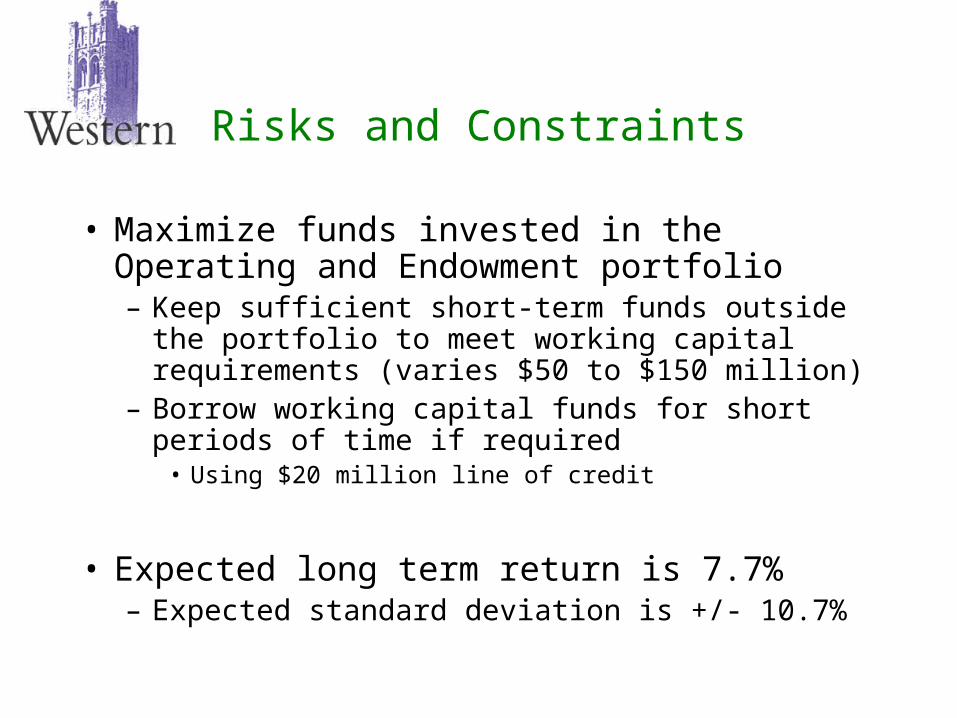
• Maximize funds invested in the Operating and Endowment portfolio– Keep sufficient short-term funds outside the
portfolio to meet working capital requirements (varies $50 to $150 million)
– Borrow working capital funds for short periods of time if required
• Using $20 million line of credit
• Expected long term return is 7.7%– Expected standard deviation is +/- 10.7%
Risks and Constraints
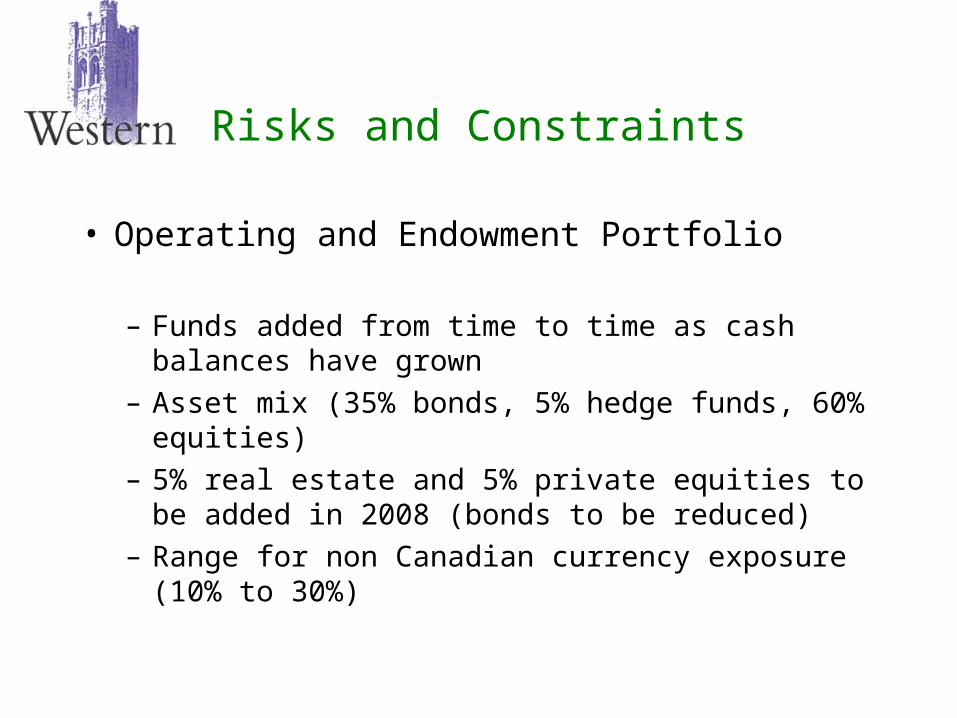
• Operating and Endowment Portfolio
– Funds added from time to time as cash balances have grown
– Asset mix (35% bonds, 5% hedge funds, 60% equities)
– 5% real estate and 5% private equities to be added in 2008 (bonds to be reduced)
– Range for non Canadian currency exposure (10% to 30%)
Approach
• Treasury activity is a profit centre
– Operates like a “bank”– Treated as an ancillary activity– Not part of basic operating budget– Accumulates all investment returns– Allocates short term interest to some funds (limited)– Allocates “profits” to operating budget each year
• “Negotiated” with Planning department– Separate carry forward reserve
• part of unrestricted net assets• reserve may be negative• target reserve level is about 8% of non endowed investments• if reserve is below target level allocations are suspended
Approach
• Deliberate mismatch of investments to liabilities– Some excess funds invested in t bills
• Enough to pay the bills• Complete liquidity• Low volatility• Low long term returns
– Core of excess funds invested in risky portfolio• Long term nature • Low liquidity needs• Added volatility• Potential for value added higher long term returns
3.2%
-50%
0%
50%
100%
150%
200%
250%19
71
1973
1975
1977
1979
1981
1983
1985
1987
1989
1991
1993
1995
1997
1999
2001
2003
2005
2007
ANNUAL CUMULATIVE ANNUALIZED SINCE INCEPTION
4 YEAR ANNUALIZED
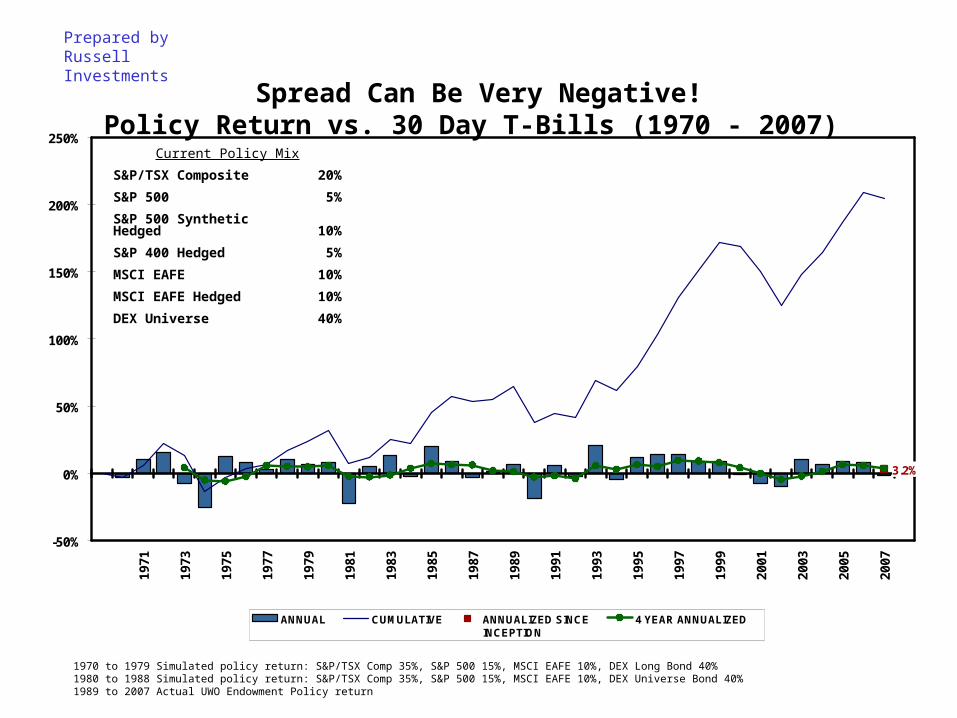
Spread Can Be Very Negative!Policy Return vs. 30 Day T-Bills (1970 - 2007)
Current Policy Mix
S&P/TSX Composite 20%
S&P 500 5%
S&P 500 Synthetic Hedged 10%
S&P 400 Hedged 5%
MSCI EAFE 10%
MSCI EAFE Hedged 10%
DEX Universe 40%
1970 to 1979 Simulated policy return: S&P/TSX Comp 35%, S&P 500 15%, MSCI EAFE 10%, DEX Long Bond 40%1980 to 1988 Simulated policy return: S&P/TSX Comp 35%, S&P 500 15%, MSCI EAFE 10%, DEX Universe Bond 40%1989 to 2007 Actual UWO Endowment Policy return
Prepared by Russell Investments
Challenges
• Need to ensure that the Board of Governors continues to be aware of the investment risks for non endowed funds
• Periods of high market volatility are not pleasant– Test the ability to maintain an aggressive investment policy– Could lead to criticism from major stakeholders (Faculty, Students, Donors,
Board, Government)
• Predicting cash requirements is difficult– Want to avoid selling long term investments when market is low
• New investments (real estate, private equities) are illiquid– Difficult to manage asset mix
• Planning Department– appreciates the long term value added – finds it difficult to deal with unpredictable returns from year to year
Results
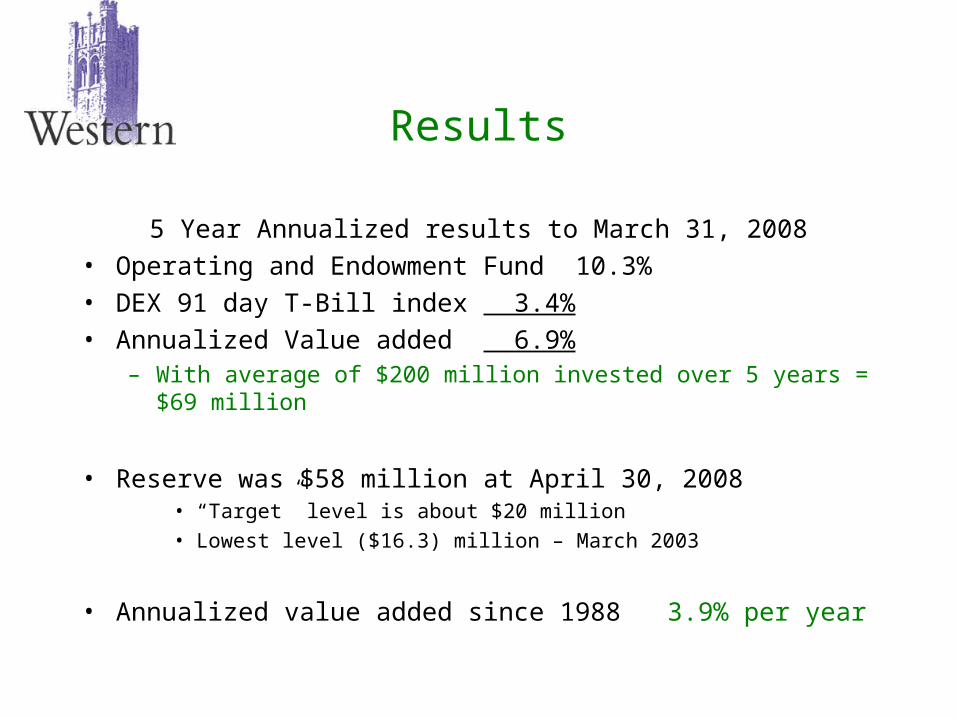
5 Year Annualized results to March 31, 2008• Operating and Endowment Fund 10.3%• DEX 91 day T-Bill index 3.4%• Annualized Value added 6.9%
– With average of $200 million invested over 5 years = $69 million
• Reserve was $58 million at April 30, 2008 • “Target” level is about $20 million• Lowest level ($16.3) million – March 2003
• Annualized value added since 1988 3.9% per year
Lessons Learned
• Investment policy statement– Supported and approved by Board of Governors– Include risks and returns assumptions– Describe strategy re non endowed investments – Support from Senior Administration is critical
• Reputational risk for individual Investment Committee members
• Volatility is challenging– Bear markets can arrive quickly & can be long– Difficult to assess the risk tolerance for an institution
• Regular reporting of results and reserve levels to Board of Governors
• Do not hesitate to get help from others

Objectives and Policies• Prior to 1998 all non-endowed funds were invested
primarily in short-term money market instruments• Cash flow analysis demonstrated that this amount of
liquidity was not required• A premium was being paid for this liquidity• The objective was to maximize return while protecting the
underlying capital• Investment policy revised to allocate maximum of 1/3 to
each of the long-term and mid-term strategies• Policy can be found at:
https://www.conman.ualberta.ca/stellent/groups/public/@finance/documents/policy/pp_cmp_057040.hcsp
Objectives and Policies
-
50
100
150
200
250
300
350
400
450
500
550
600
650
700
Ap
r-9
5
Ap
r-9
6
Ap
r-9
7
Ap
r-9
8
Ap
r-9
9
Ap
r-0
0
Ap
r-0
1
Ap
r-0
2
Ap
r-0
3
Ap
r-0
4
Ap
r-0
5
Ap
r-0
6
Ap
r-0
7
Ap
r-0
8
Ap
r-0
9
Ap
r-1
0
Actual Forecast
Risks and Constraints
• Up to 1/3 of non-endowed funds can be allocated to the long term strategy (endowment fund)
• Expected long-term return of 7.25% with an expected standard deviation of 10%
• Market risk addressed through the creation of a reserve
• Up to 1/3 of the non-endowed funds can be allocated to the mid-term bond portfolio with a maximum term to maturity of 5 years
• Credit risk addressed by investing primarily in government issued fixed income
• Interest rate risk
Approach
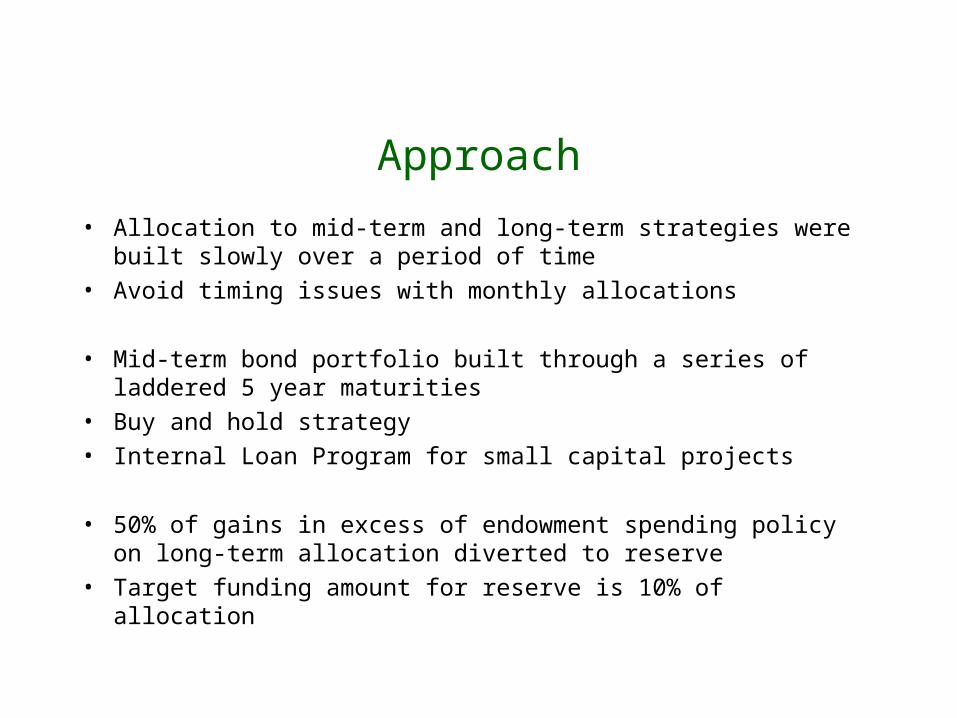
• Allocation to mid-term and long-term strategies were built slowly over a period of time
• Avoid timing issues with monthly allocations
• Mid-term bond portfolio built through a series of laddered 5 year maturities
• Buy and hold strategy• Internal Loan Program for small capital projects
• 50% of gains in excess of endowment spending policy on long-term allocation diverted to reserve
• Target funding amount for reserve is 10% of allocation
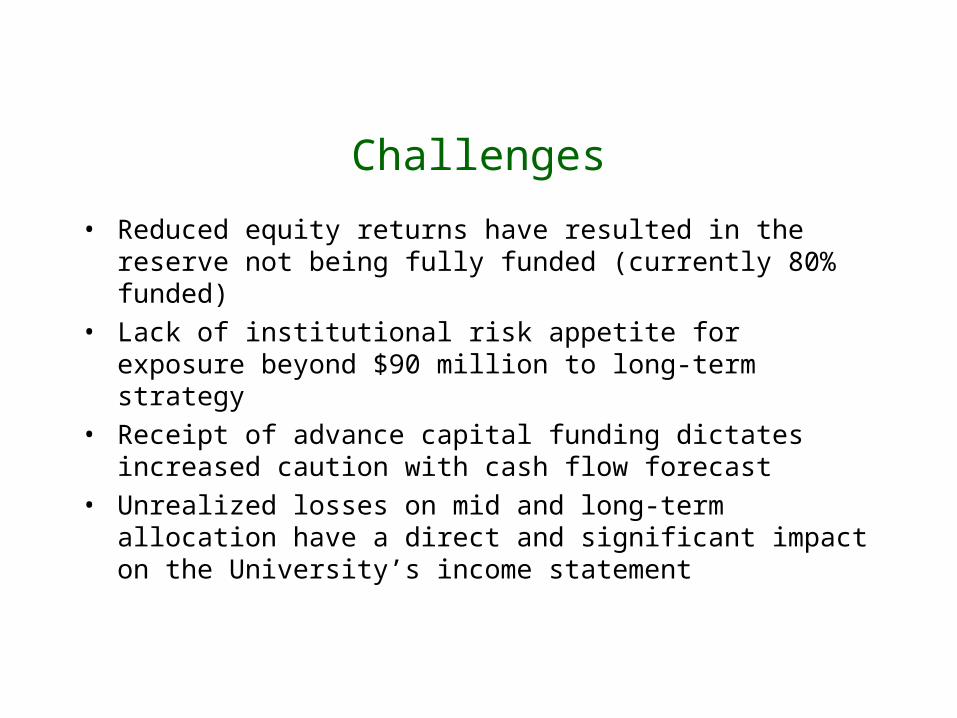
Challenges
• Reduced equity returns have resulted in the reserve not being fully funded (currently 80% funded)
• Lack of institutional risk appetite for exposure beyond $90 million to long-term strategy
• Receipt of advance capital funding dictates increased caution with cash flow forecast
• Unrealized losses on mid and long-term allocation have a direct and significant impact on the University’s income statement
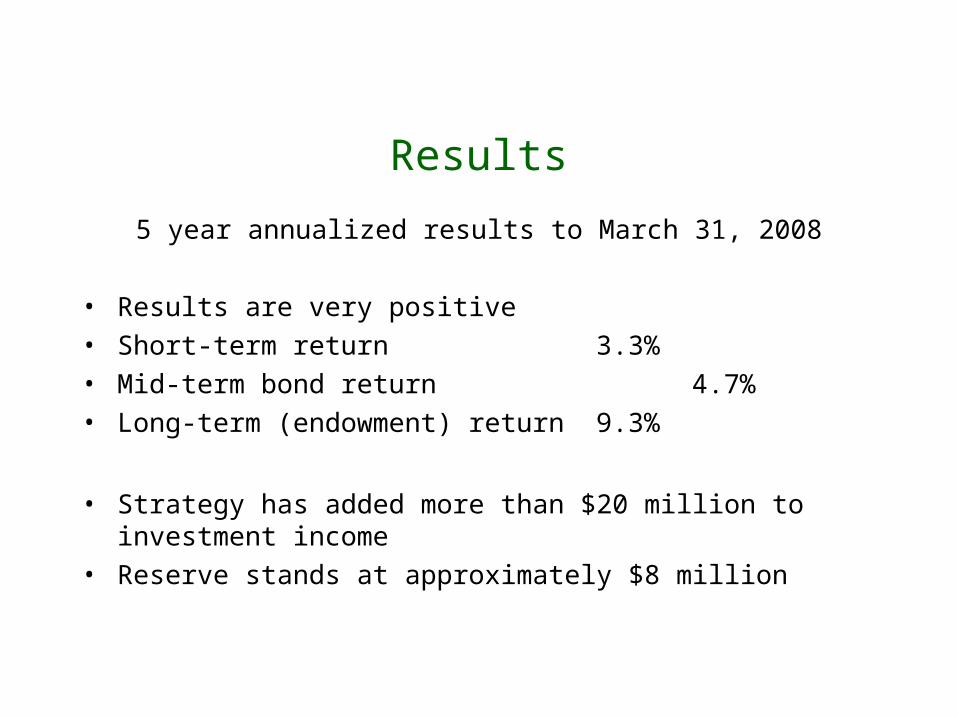
Results
5 year annualized results to March 31, 2008
• Results are very positive• Short-term return 3.3%• Mid-term bond return 4.7%• Long-term (endowment) return 9.3%
• Strategy has added more than $20 million to investment income
• Reserve stands at approximately $8 million
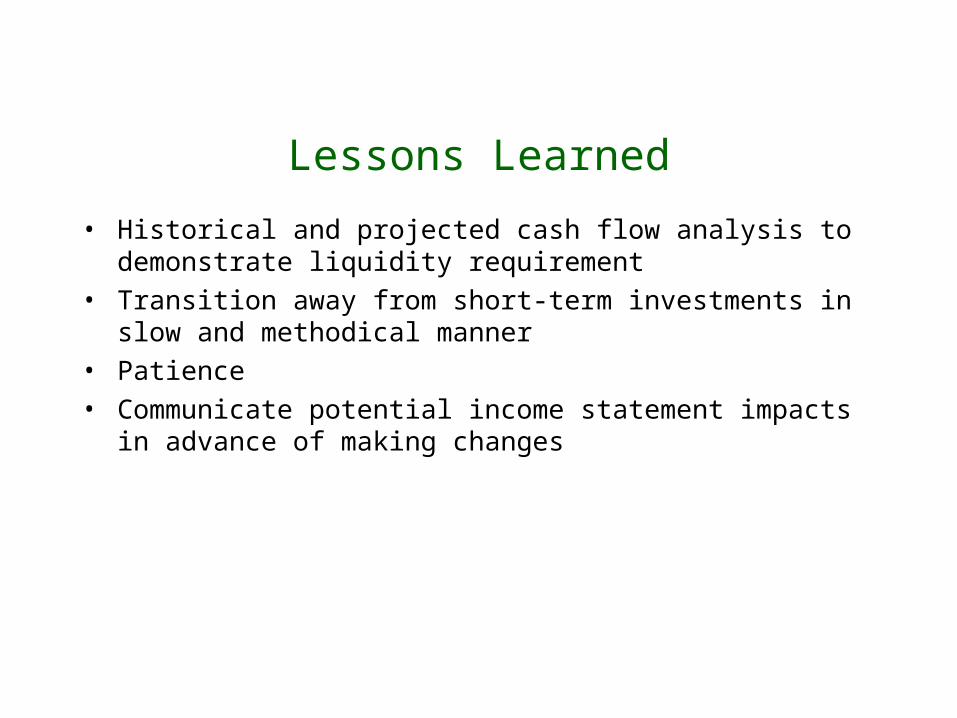
Lessons Learned
• Historical and projected cash flow analysis to demonstrate liquidity requirement
• Transition away from short-term investments in slow and methodical manner
• Patience• Communicate potential income statement impacts in
advance of making changes
Working Capital – Investment Strategies
CAUBO June 2008
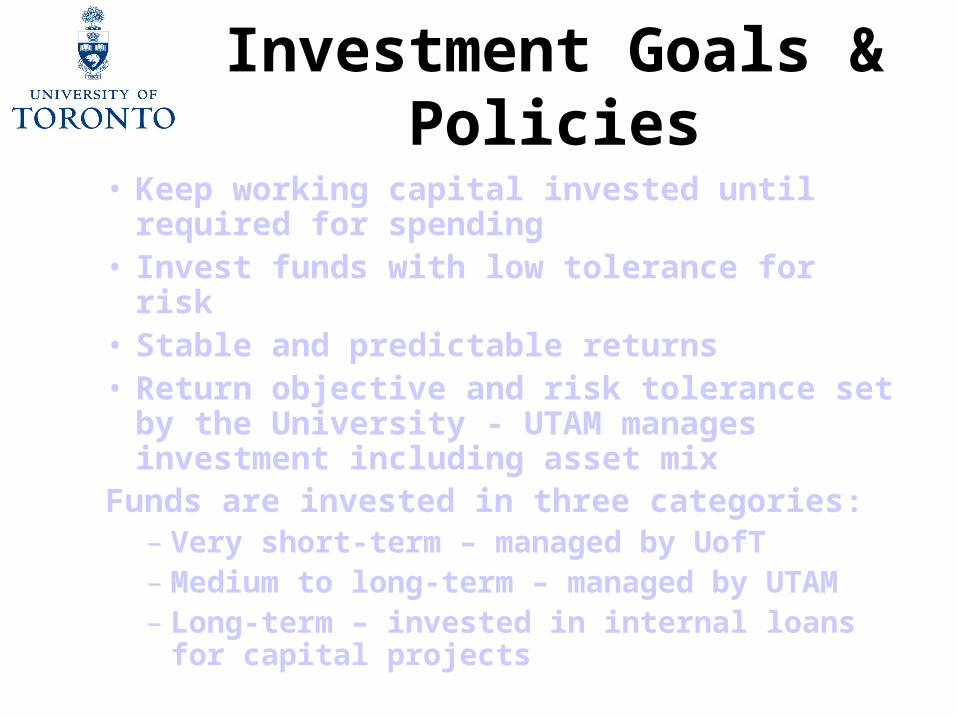
Investment Goals & Policies
• Keep working capital invested until required for spending
• Invest funds with low tolerance for risk• Stable and predictable returns• Return objective and risk tolerance set
by the University - UTAM manages investment including asset mix
Funds are invested in three categories:– Very short-term – managed by UofT– Medium to long-term – managed by
UTAM– Long-term – invested in internal loans
for capital projects
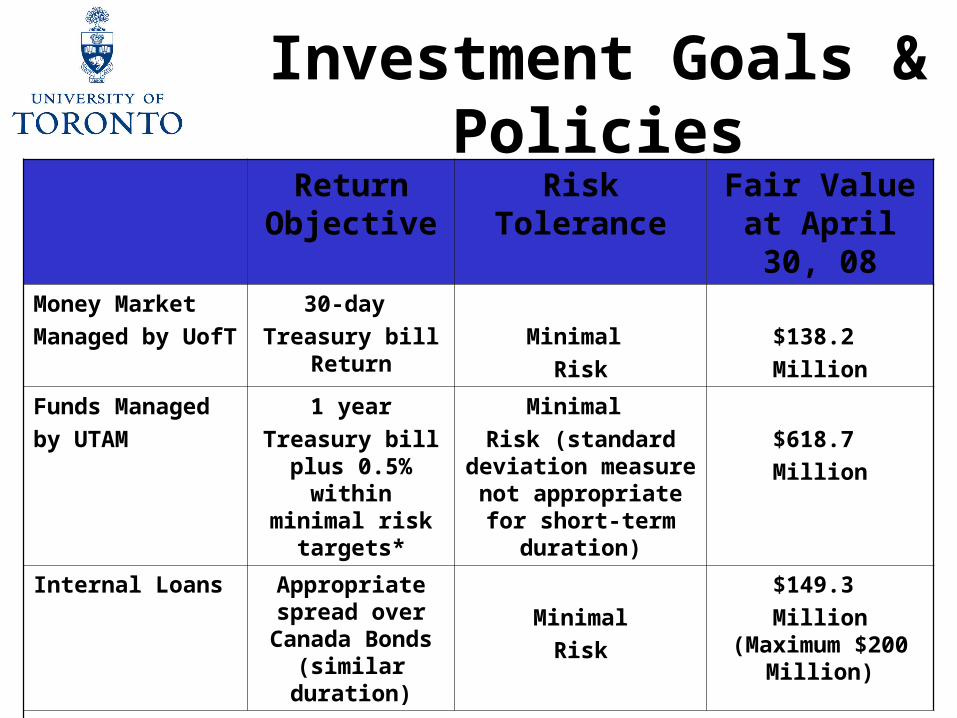
Investment Goals & Policies
Return Objective
Risk Tolerance Fair Value at April 30, 08
Money Market
Managed by UofT
30-day
Treasury bill Return
Minimal
Risk
$138.2
Million
Funds Managed
by UTAM
1 year
Treasury bill plus 0.5% within minimal risk
targets*
Minimal
Risk (standard deviation measure not appropriate for short-
term duration)
$618.7
Million
Internal Loans Appropriate spread over
Canada Bonds (similar duration)
Minimal
Risk
$149.3
Million (Maximum $200 Million)
* Objective set based on a study done in 2004 which looked at various fixed income portfolios, including bonds of various duration
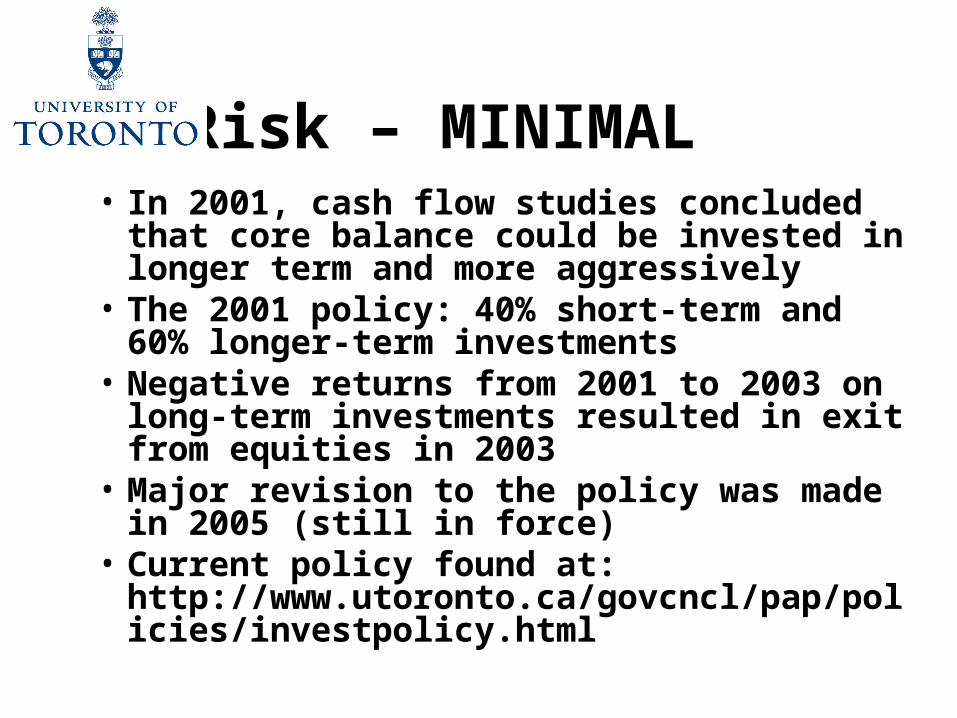
Risk – MINIMAL • In 2001, cash flow studies concluded
that core balance could be invested in longer term and more aggressively
• The 2001 policy: 40% short-term and 60% longer-term investments
• Negative returns from 2001 to 2003 on long-term investments resulted in exit from equities in 2003
• Major revision to the policy was made in 2005 (still in force)
• Current policy found at: http://www.utoronto.ca/govcncl/pap/policies/investpolicy.html
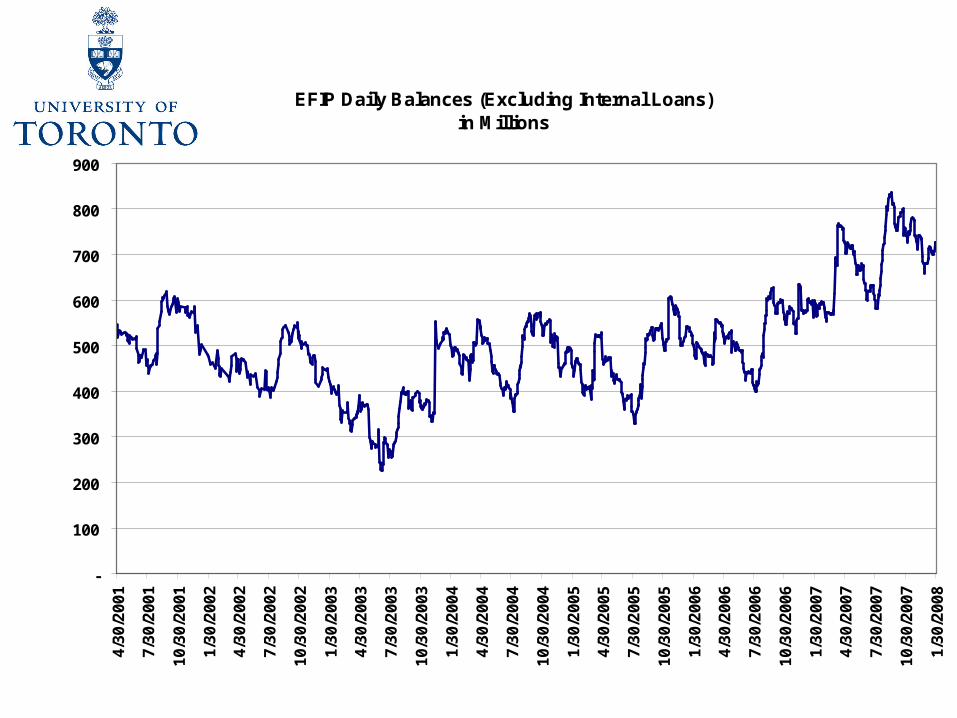
EFIP Daily Balances (Excluding Internal Loans)in Millions
-
100
200
300
400
500
600
700
800
900
4/3
0/2
00
1
7/3
0/2
00
1
10
/30
/20
01
1/3
0/2
00
2
4/3
0/2
00
2
7/3
0/2
00
2
10
/30
/20
02
1/3
0/2
00
3
4/3
0/2
00
3
7/3
0/2
00
3
10
/30
/20
03
1/3
0/2
00
4
4/3
0/2
00
4
7/3
0/2
00
4
10
/30
/20
04
1/3
0/2
00
5
4/3
0/2
00
5
7/3
0/2
00
5
10
/30
/20
05
1/3
0/2
00
6
4/3
0/2
00
6
7/3
0/2
00
6
10
/30
/20
06
1/3
0/2
00
7
4/3
0/2
00
7
7/3
0/2
00
7
10
/30
/20
07
1/3
0/2
00
8
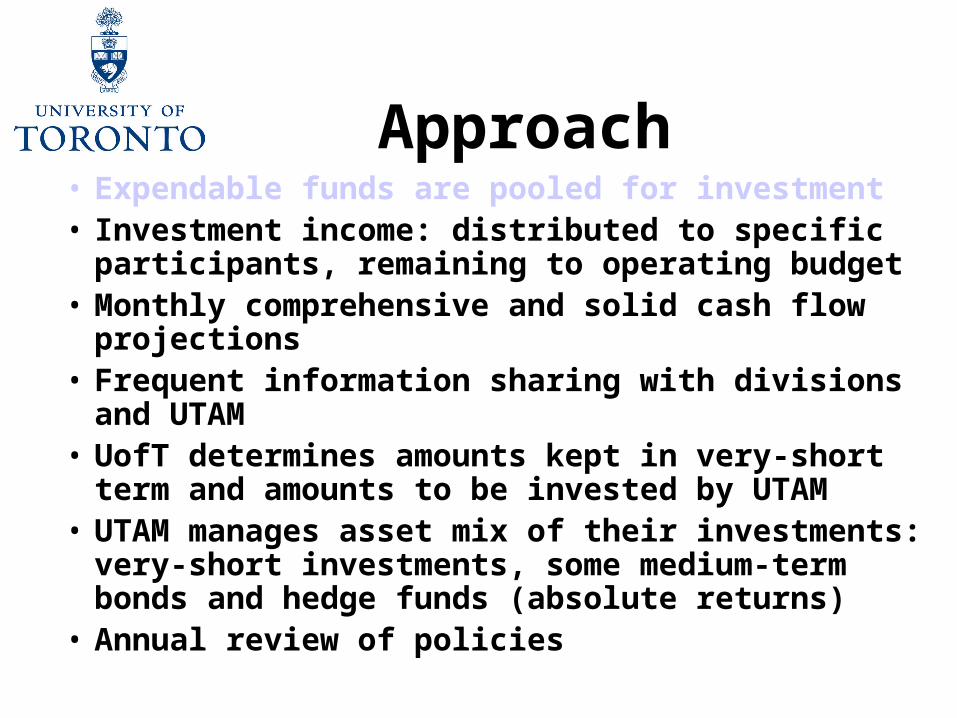
Approach • Expendable funds are pooled for investment• Investment income: distributed to specific
participants, remaining to operating budget• Monthly comprehensive and solid cash flow
projections • Frequent information sharing with divisions
and UTAM• UofT determines amounts kept in very-short
term and amounts to be invested by UTAM • UTAM manages asset mix of their investments:
very-short investments, some medium-term bonds and hedge funds (absolute returns)
• Annual review of policies
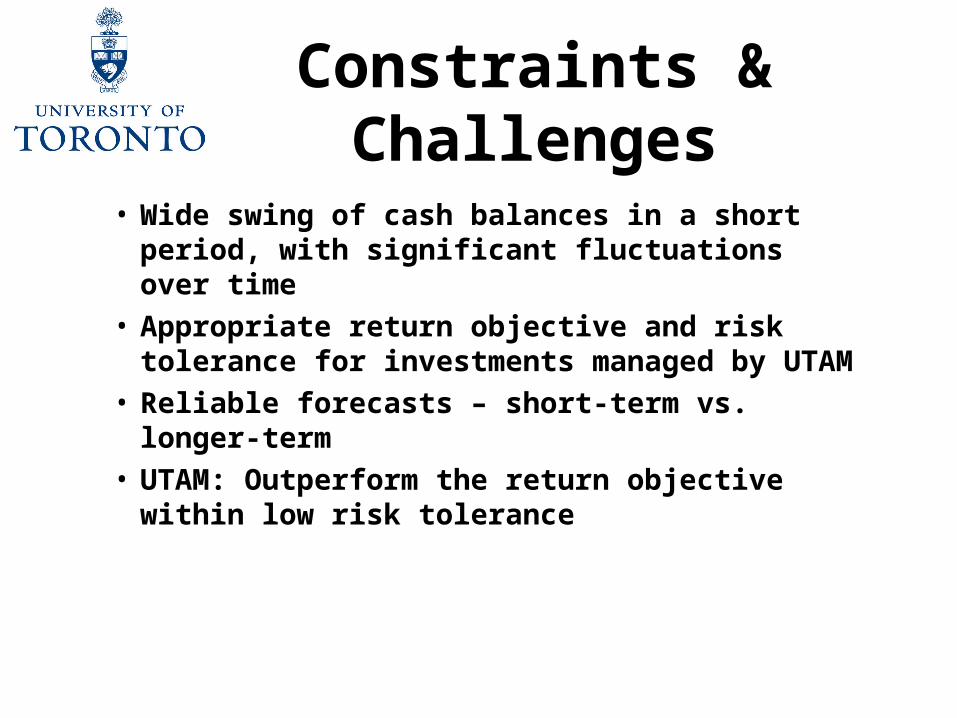
Constraints & Challenges
• Wide swing of cash balances in a short period, with significant fluctuations over time
• Appropriate return objective and risk tolerance for investments managed by UTAM
• Reliable forecasts – short-term vs. longer-term
• UTAM: Outperform the return objective within low risk tolerance
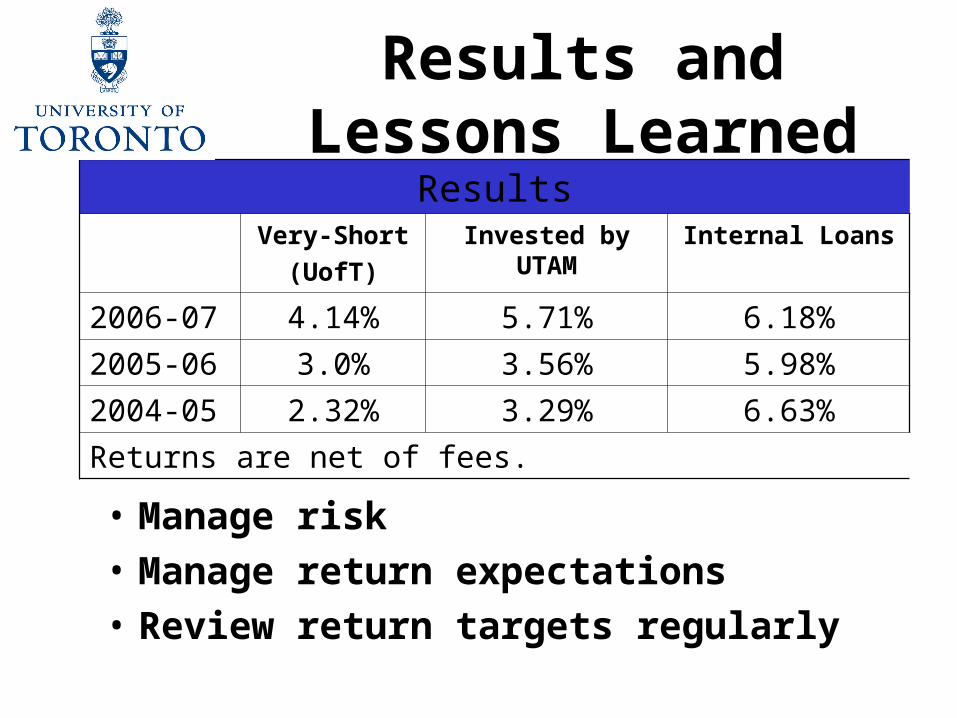
Results and Lessons Learned
ResultsVery-Short
(UofT)
Invested by UTAM Internal Loans
2006-07 4.14% 5.71% 6.18%
2005-06 3.0% 3.56% 5.98%
2004-05 2.32% 3.29% 6.63%
Returns are net of fees.
• Manage risk• Manage return expectations• Review return targets regularly