capital, investment and treasury strategies 2019/20 to 2022/23
TRANSCRIPT

Capital, Investment and Treasury Strategies2019/20 to 2022/23
Capital Strategy1 Introduction
1.1 This Strategy sets out South Somerset District Council’s approach to capital investment and sets out the long-term context in which both capital expenditure and investment decisions are made and gives due consideration to both risk and reward and impact on the achievement of priority outcomes.
1.2 It provides an overview of how the associated risk is managed, the implications for future financial sustainability and information on how stewardship, value for money, prudence, sustainability and affordability will be secured.
1.3 The investment and treasury management strategies are fundamentally linked to the capital strategy and are therefore included here to provide a holistic view of capital, investment and borrowing requirements.
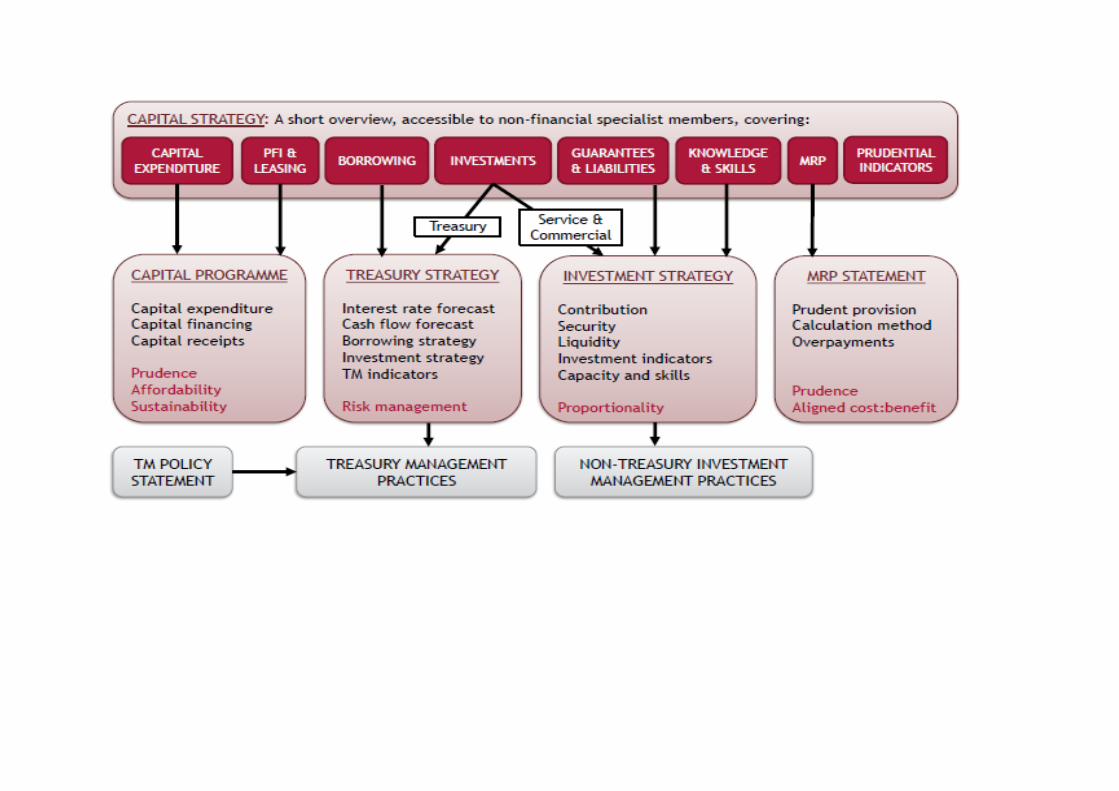
1.4 The flowchart below provides information on the requirements and the contents of the various strategies that are required on an annual basis, and how the strategies are inter-related.
2 Capital Expenditure
Capital Expenditure Estimates
1.5 Capital expenditure is incurred where the Council spends money on constructing or acquiring assets such as land and buildings, vehicles, plant and equipment, which will be used for more than one year, as well as larger scale maintenance works that maintain or enhance the Councils existing assets. In local government capital expenditure can also include spending on assets owned by other bodies, and loans and grants to other bodies enabling them to buy assets. The Council has some limited discretion on what counts as capital expenditure. For example, assets costing below £10,000 are not capitalised and are charged as revenue expenditure in the year. This discretion is reflected in the Council’s accounting policies which are set out within the Statement of Accounts each year.
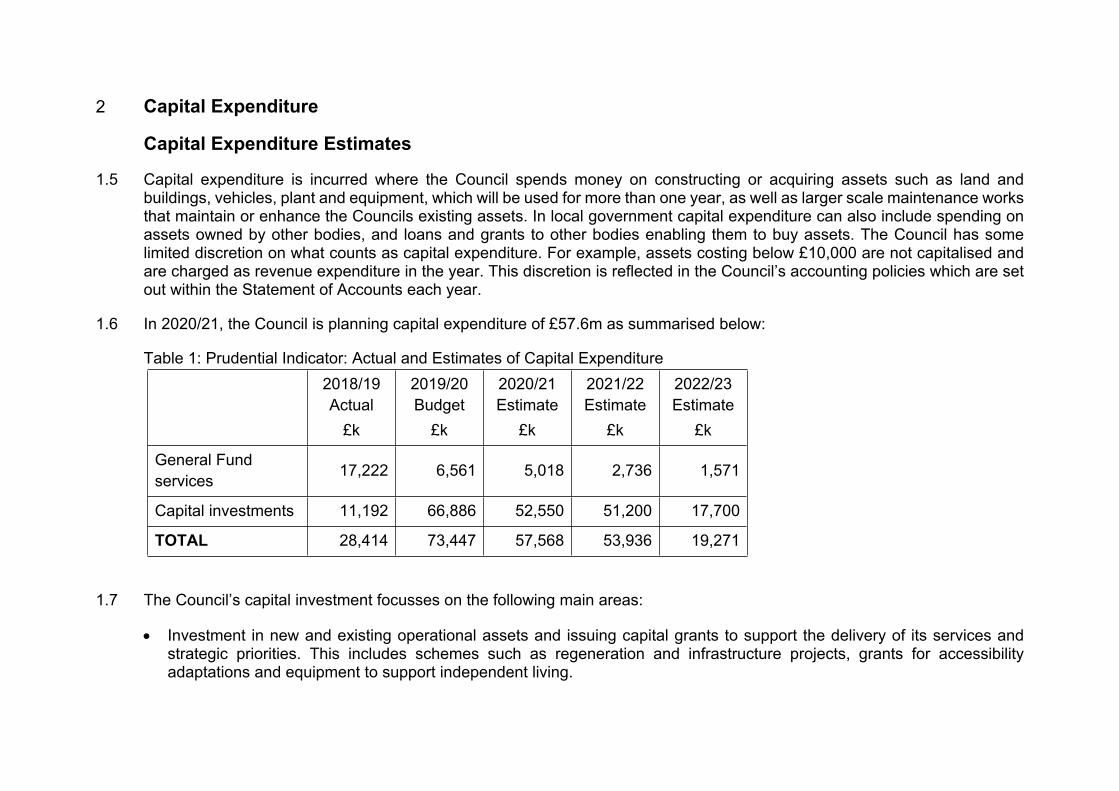
1.6 In 2020/21, the Council is planning capital expenditure of £57.6m as summarised below:
Table 1: Prudential Indicator: Actual and Estimates of Capital Expenditure2018/19 Actual
£k
2019/20 Budget
£k
2020/21 Estimate
£k
2021/22 Estimate
£k
2022/23 Estimate
£k
General Fund services 17,222 6,561 5,018 2,736 1,571
Capital investments 11,192 66,886 52,550 51,200 17,700
TOTAL 28,414 73,447 57,568 53,936 19,271
1.7 The Council’s capital investment focusses on the following main areas:
Investment in new and existing operational assets and issuing capital grants to support the delivery of its services and strategic priorities. This includes schemes such as regeneration and infrastructure projects, grants for accessibility adaptations and equipment to support independent living.
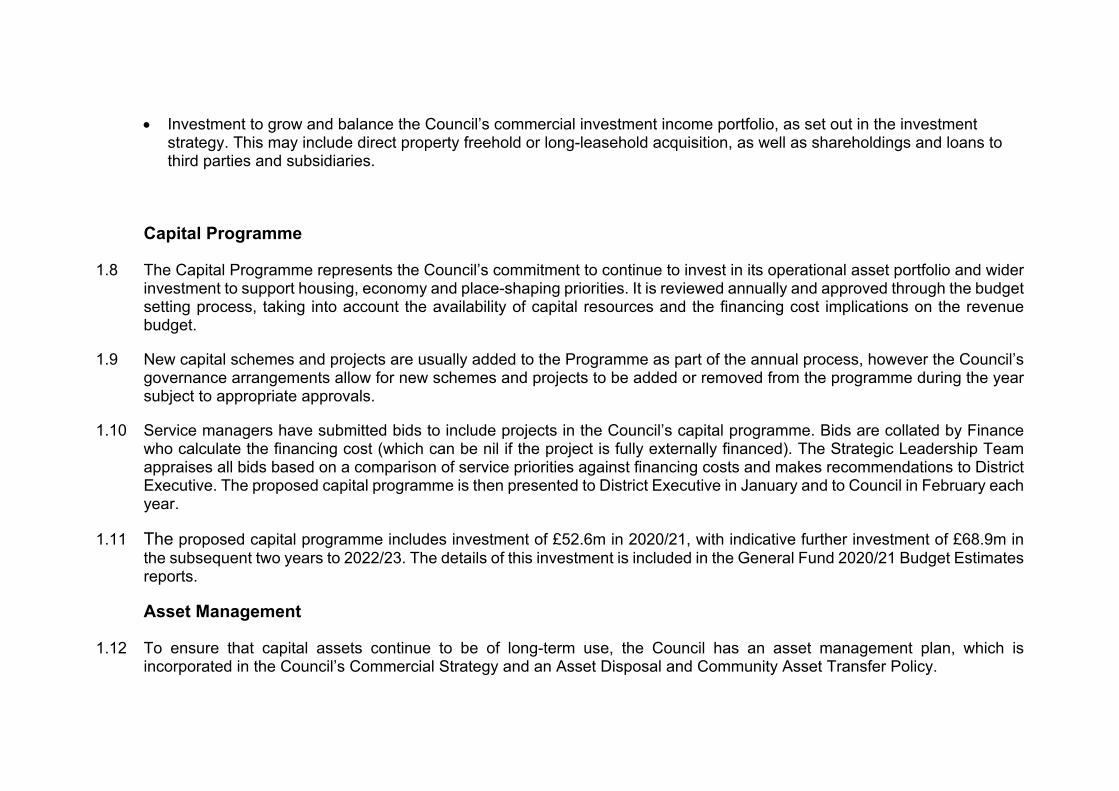
Investment to grow and balance the Council’s commercial investment income portfolio, as set out in the investment strategy. This may include direct property freehold or long-leasehold acquisition, as well as shareholdings and loans to third parties and subsidiaries.
Capital Programme
1.8 The Capital Programme represents the Council’s commitment to continue to invest in its operational asset portfolio and wider investment to support housing, economy and place-shaping priorities. It is reviewed annually and approved through the budget setting process, taking into account the availability of capital resources and the financing cost implications on the revenue budget.
1.9 New capital schemes and projects are usually added to the Programme as part of the annual process, however the Council’s governance arrangements allow for new schemes and projects to be added or removed from the programme during the year subject to appropriate approvals.
1.10 Service managers have submitted bids to include projects in the Council’s capital programme. Bids are collated by Finance who calculate the financing cost (which can be nil if the project is fully externally financed). The Strategic Leadership Team appraises all bids based on a comparison of service priorities against financing costs and makes recommendations to District Executive. The proposed capital programme is then presented to District Executive in January and to Council in February each year.
1.11 The proposed capital programme includes investment of £52.6m in 2020/21, with indicative further investment of £68.9m in the subsequent two years to 2022/23. The details of this investment is included in the General Fund 2020/21 Budget Estimates reports.
Asset Management
1.12 To ensure that capital assets continue to be of long-term use, the Council has an asset management plan, which is incorporated in the Council’s Commercial Strategy and an Asset Disposal and Community Asset Transfer Policy.
1.13 This Asset Disposal and Community Asset Transfer Policy provides a transparent, robust and strategic framework to enable Asset Disposal and Community Asset Transfer decisions to be made, together with a clear process for both SSDC and community organisations to progress with transfers/disposals, with long term sustainable benefits both to the Council and the community.
1.14 The Disposals element of the policy refers to Council owned assets that are sold on the open market for a financial consideration or otherwise transferred out of Council ownership. The aim is to enable SSDC to retain only sound assets that support the effective and efficient delivery of services, achieve corporate priorities or produce a healthy financial return each year in accordance with the Commercial Land and Property Strategy.
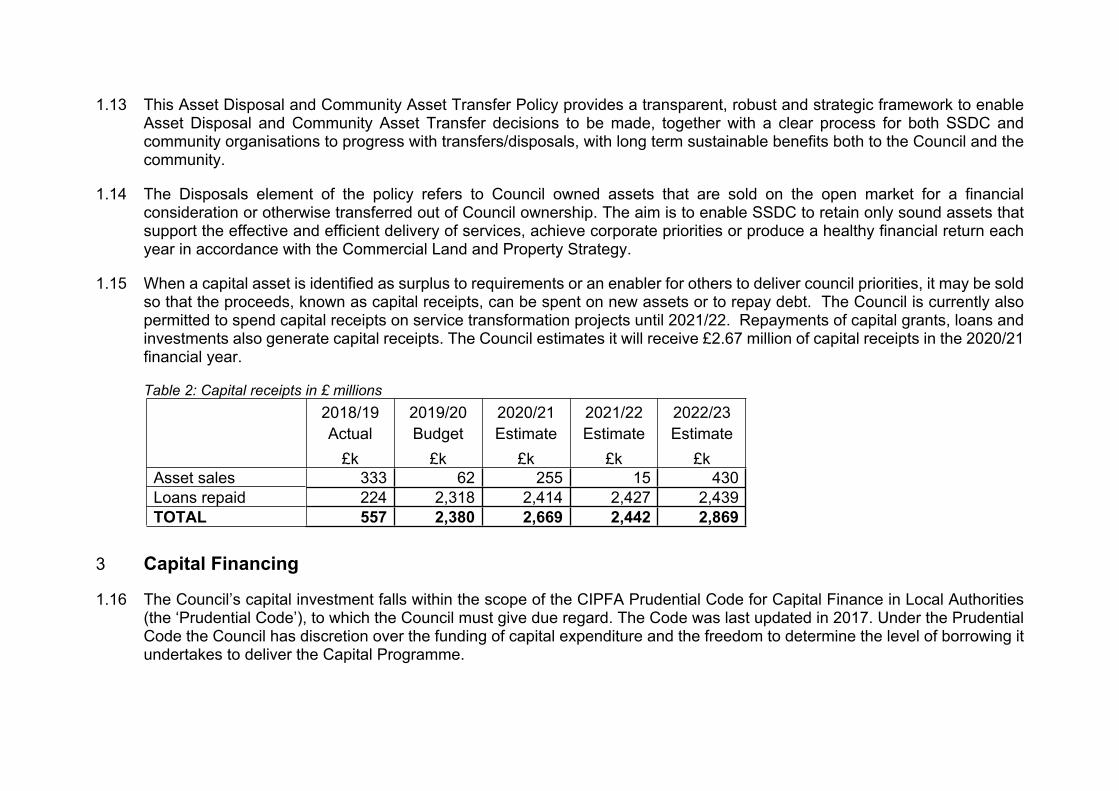
1.15 When a capital asset is identified as surplus to requirements or an enabler for others to deliver council priorities, it may be sold so that the proceeds, known as capital receipts, can be spent on new assets or to repay debt. The Council is currently also permitted to spend capital receipts on service transformation projects until 2021/22. Repayments of capital grants, loans and investments also generate capital receipts. The Council estimates it will receive £2.67 million of capital receipts in the 2020/21 financial year.
Table 2: Capital receipts in £ millions2018/19 Actual
£k
2019/20 Budget
£k
2020/21 Estimate
£k
2021/22 Estimate
£k
2022/23 Estimate
£kAsset sales 333 62 255 15 430Loans repaid 224 2,318 2,414 2,427 2,439TOTAL 557 2,380 2,669 2,442 2,869
3 Capital Financing
1.16 The Council’s capital investment falls within the scope of the CIPFA Prudential Code for Capital Finance in Local Authorities (the ‘Prudential Code’), to which the Council must give due regard. The Code was last updated in 2017. Under the Prudential Code the Council has discretion over the funding of capital expenditure and the freedom to determine the level of borrowing it undertakes to deliver the Capital Programme.
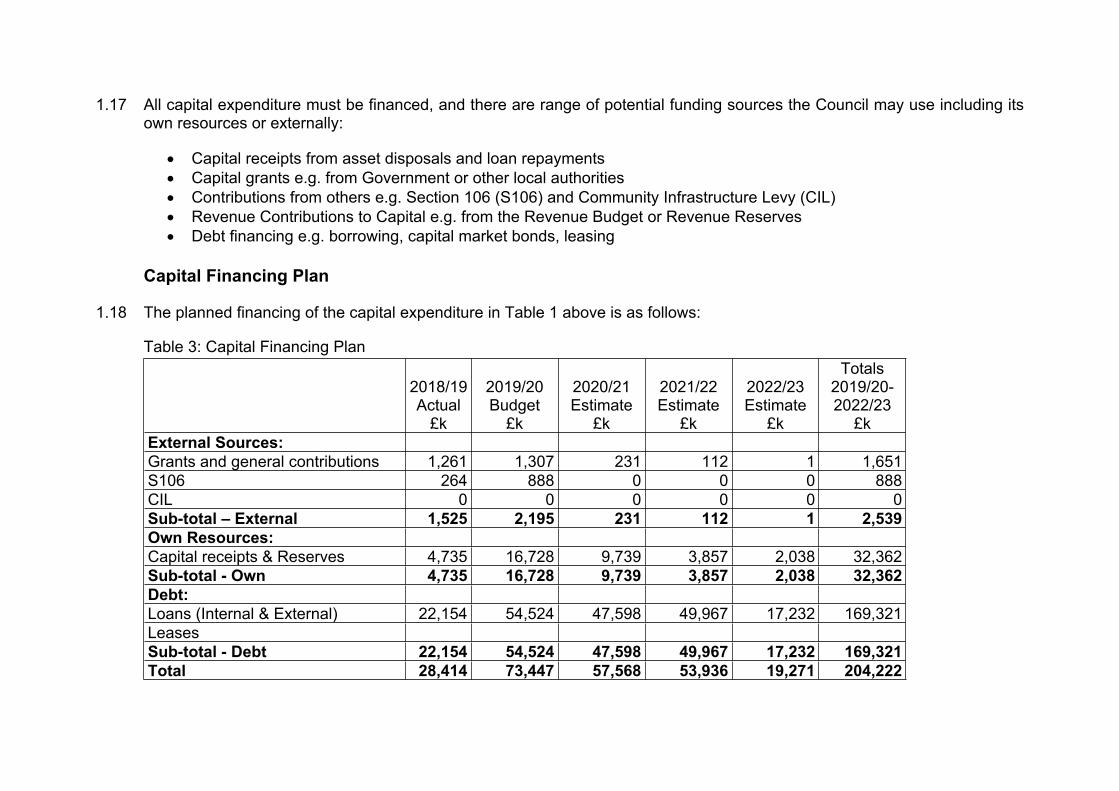
1.17 All capital expenditure must be financed, and there are range of potential funding sources the Council may use including its own resources or externally:
Capital receipts from asset disposals and loan repayments Capital grants e.g. from Government or other local authorities Contributions from others e.g. Section 106 (S106) and Community Infrastructure Levy (CIL) Revenue Contributions to Capital e.g. from the Revenue Budget or Revenue Reserves Debt financing e.g. borrowing, capital market bonds, leasing
Capital Financing Plan
1.18 The planned financing of the capital expenditure in Table 1 above is as follows:
Table 3: Capital Financing Plan
2018/19Actual
£k
2019/20Budget
£k
2020/21Estimate
£k
2021/22Estimate
£k
2022/23Estimate
£k
Totals 2019/20-2022/23
£kExternal Sources:Grants and general contributions 1,261 1,307 231 112 1 1,651S106 264 888 0 0 0 888CIL 0 0 0 0 0 0Sub-total – External 1,525 2,195 231 112 1 2,539Own Resources:Capital receipts & Reserves 4,735 16,728 9,739 3,857 2,038 32,362Sub-total - Own 4,735 16,728 9,739 3,857 2,038 32,362Debt:Loans (Internal & External) 22,154 54,524 47,598 49,967 17,232 169,321LeasesSub-total - Debt 22,154 54,524 47,598 49,967 17,232 169,321Total 28,414 73,447 57,568 53,936 19,271 204,222

1.19 The allocation of resources may vary over time, for example, where additional income is achieved through asset sales or obtaining external funding. The plan is therefore dynamic, and is overseen by the Council’s S151 Officer to optimise financing arrangements on an ongoing basis. The estimates will not commit the Council to particular methods of financing. The S151 Officer will determine the actual financing of capital expenditure incurred at the end of the financial year.
1.20 The implications of financing capital expenditure from borrowing is that the expenditure is not funded immediately but charged to the revenue budget over a number of years. The Council may defer the timing of external borrowing on a short to medium term by using temporary cash resources held in reserves and balances. This practice, which is referred to as ‘internal borrowing’, does not reduce the magnitude of borrowing required or the level of funds held in reserves and balances; the funds are merely being utilised in the short term until they are required for their intended purpose. The timing of external borrowing and the balance of external / internal borrowing is determined by market conditions and the Council’s cash flow position. Officers manage this position on a day to day basis in line with the overall Treasury Management Strategy.
1.21 Debt is only a temporary source of finance, since loans and leases must be repaid and this is, therefore, replaced over time by other financing, usually from revenue which is known as minimum revenue provision (MRP). Alternatively, capital receipts may be used to replace debt finance.
Capital Financing Requirement
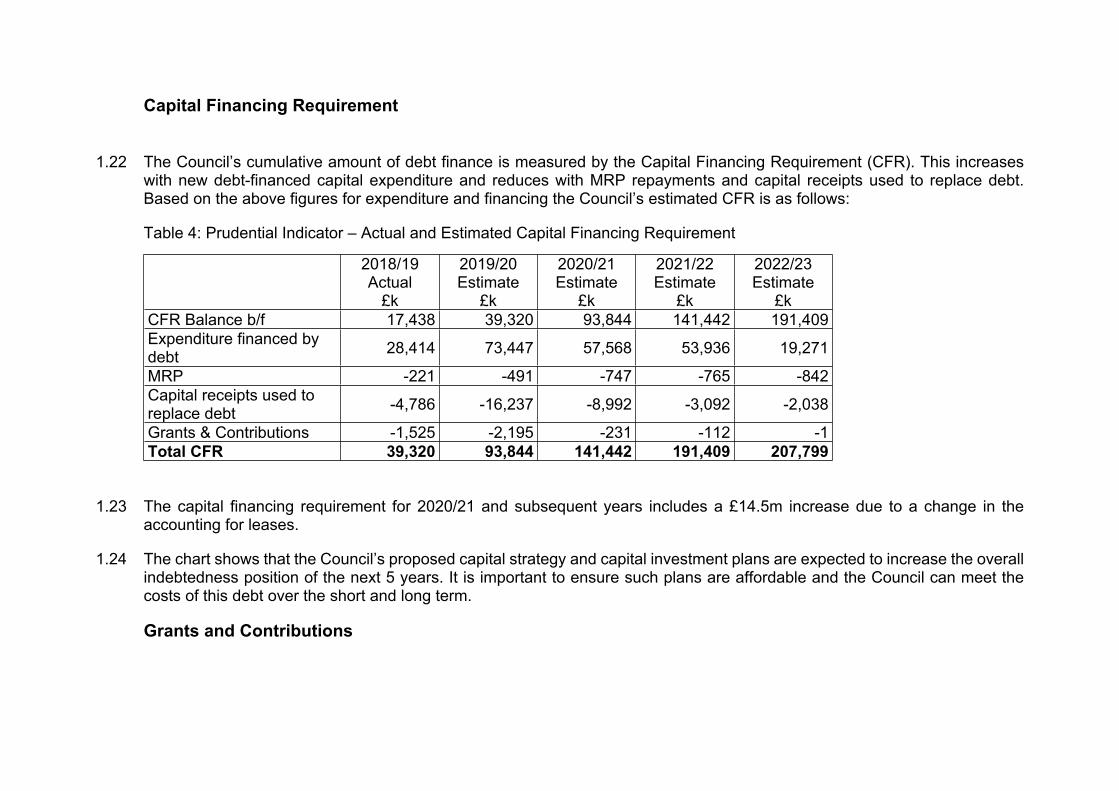
1.22 The Council’s cumulative amount of debt finance is measured by the Capital Financing Requirement (CFR). This increases with new debt-financed capital expenditure and reduces with MRP repayments and capital receipts used to replace debt. Based on the above figures for expenditure and financing the Council’s estimated CFR is as follows:
Table 4: Prudential Indicator – Actual and Estimated Capital Financing Requirement
2018/19Actual
£k
2019/20Estimate
£k
2020/21Estimate
£k
2021/22Estimate
£k
2022/23Estimate
£kCFR Balance b/f 17,438 39,320 93,844 141,442 191,409Expenditure financed by debt 28,414 73,447 57,568 53,936 19,271
MRP -221 -491 -747 -765 -842Capital receipts used to replace debt -4,786 -16,237 -8,992 -3,092 -2,038
Grants & Contributions -1,525 -2,195 -231 -112 -1Total CFR 39,320 93,844 141,442 191,409 207,799
1.23 The capital financing requirement for 2020/21 and subsequent years includes a £14.5m increase due to a change in the accounting for leases.
1.24 The chart shows that the Council’s proposed capital strategy and capital investment plans are expected to increase the overall indebtedness position of the next 5 years. It is important to ensure such plans are affordable and the Council can meet the costs of this debt over the short and long term.
Grants and Contributions
1.25 The Council will seek to access external funding towards its capital investment plans where funds are available and our schemes are within scope. Examples of grants may include Government schemes such Housing Infrastructure Fund, Future High Streets Fund and so on. We also receive contributions from other bodies such as developers in the form of S106 planning obligations contributions and Community Infrastructure Levy (see below). It is often the case that the Council will need to put some of its own resources towards a scheme in order to attract the external funding. However, this can be effective in levering in funds to enable larger infrastructure investments to progress and mitigate marginal viability schemes.
S106 Contributions
1.26 S106 contributions are received in respect of certain obligations that have been agreed through planning approvals. Contributions that are in respect of district council services within SSDC are paid to the Council, there are usually restrictions on the nature of costs that S106 monies can fund. Expenditure on items such as public art, play areas and equipment and affordable housing provision are examples service expenditure that S106 contributions can fund. S106 contributions can be used to fund both revenue and capital expenditure and are allocated to the relevant capital and revenue budget accordingly.
1.27 All S106 funds over £10,000 will be included if appropriate in the capital programme once received and included within a quarterly monitoring statement for reporting to District Executive.
Community Infrastructure Levy (CIL)
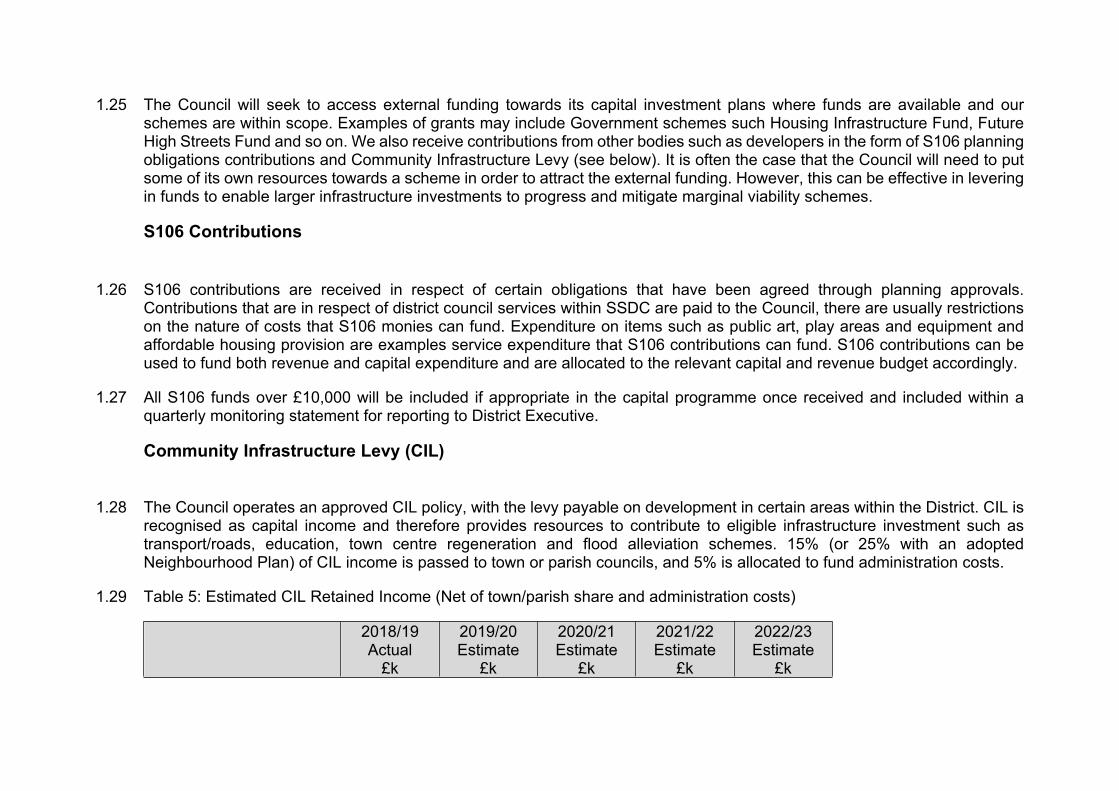
1.28 The Council operates an approved CIL policy, with the levy payable on development in certain areas within the District. CIL is recognised as capital income and therefore provides resources to contribute to eligible infrastructure investment such as transport/roads, education, town centre regeneration and flood alleviation schemes. 15% (or 25% with an adopted Neighbourhood Plan) of CIL income is passed to town or parish councils, and 5% is allocated to fund administration costs.
1.29 Table 5: Estimated CIL Retained Income (Net of town/parish share and administration costs)
2018/19Actual
£k
2019/20Estimate
£k
2020/21Estimate
£k
2021/22Estimate
£k
2022/23Estimate
£k
2018/19Actual
£k
2019/20Estimate
£k
2020/21Estimate
£k
2021/22Estimate
£k
2022/23Estimate
£kNet CIL Income 59 267 347 451 587
Capital Receipts
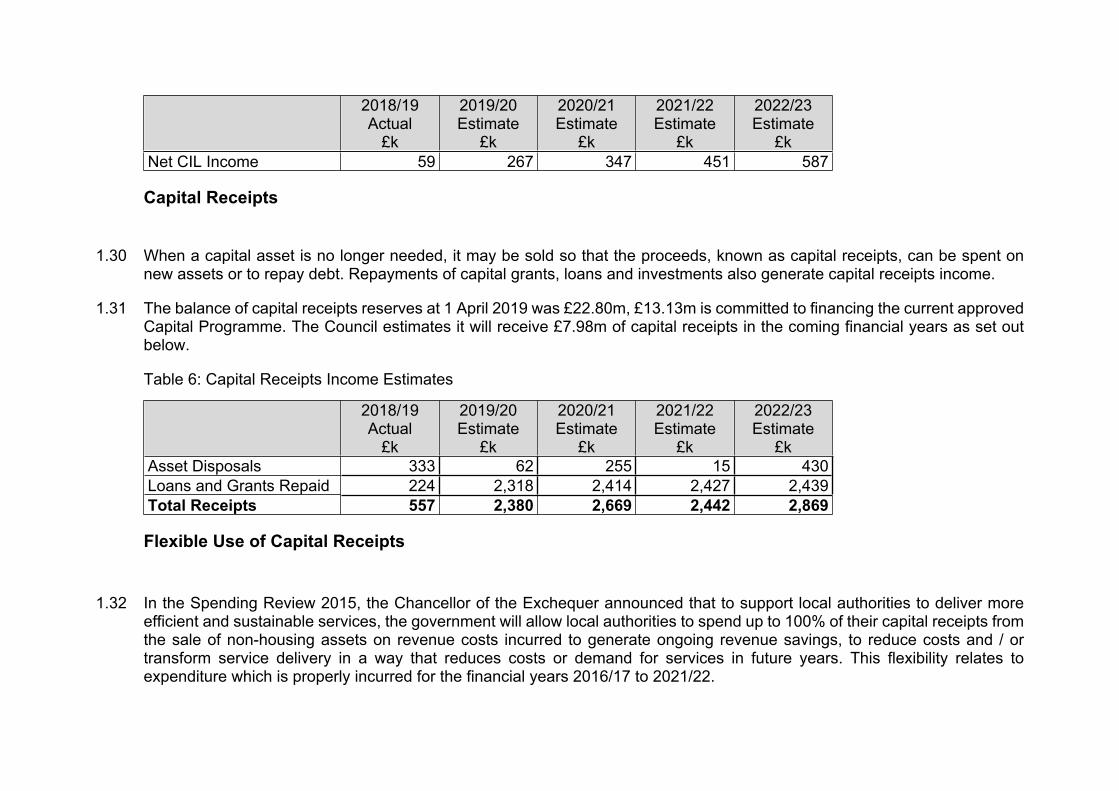
1.30 When a capital asset is no longer needed, it may be sold so that the proceeds, known as capital receipts, can be spent on new assets or to repay debt. Repayments of capital grants, loans and investments also generate capital receipts income.
1.31 The balance of capital receipts reserves at 1 April 2019 was £22.80m, £13.13m is committed to financing the current approved Capital Programme. The Council estimates it will receive £7.98m of capital receipts in the coming financial years as set out below.
Table 6: Capital Receipts Income Estimates
2018/19Actual
£k
2019/20Estimate
£k
2020/21Estimate
£k
2021/22Estimate
£k
2022/23Estimate
£kAsset Disposals 333 62 255 15 430Loans and Grants Repaid 224 2,318 2,414 2,427 2,439Total Receipts 557 2,380 2,669 2,442 2,869
Flexible Use of Capital Receipts
1.32 In the Spending Review 2015, the Chancellor of the Exchequer announced that to support local authorities to deliver more efficient and sustainable services, the government will allow local authorities to spend up to 100% of their capital receipts from the sale of non-housing assets on revenue costs incurred to generate ongoing revenue savings, to reduce costs and / or transform service delivery in a way that reduces costs or demand for services in future years. This flexibility relates to expenditure which is properly incurred for the financial years 2016/17 to 2021/22.
1.33 Local authorities are only able to use capital receipts in the years in which this flexibility is offered. In using the flexibility, the Council will have due regard to the requirements of the Prudential Code, the CIPFA Local Authority Accounting Code of Practice and the current edition of the Treasury Management in Public Services Code of Practice.
Table 7: Flexible Use of Capital Receipts
2016/17-2018/19
£k
2019/20Estimate
£k
2020/21Estimate
£k
2021/22Estimate
£k
2022/23Estimate
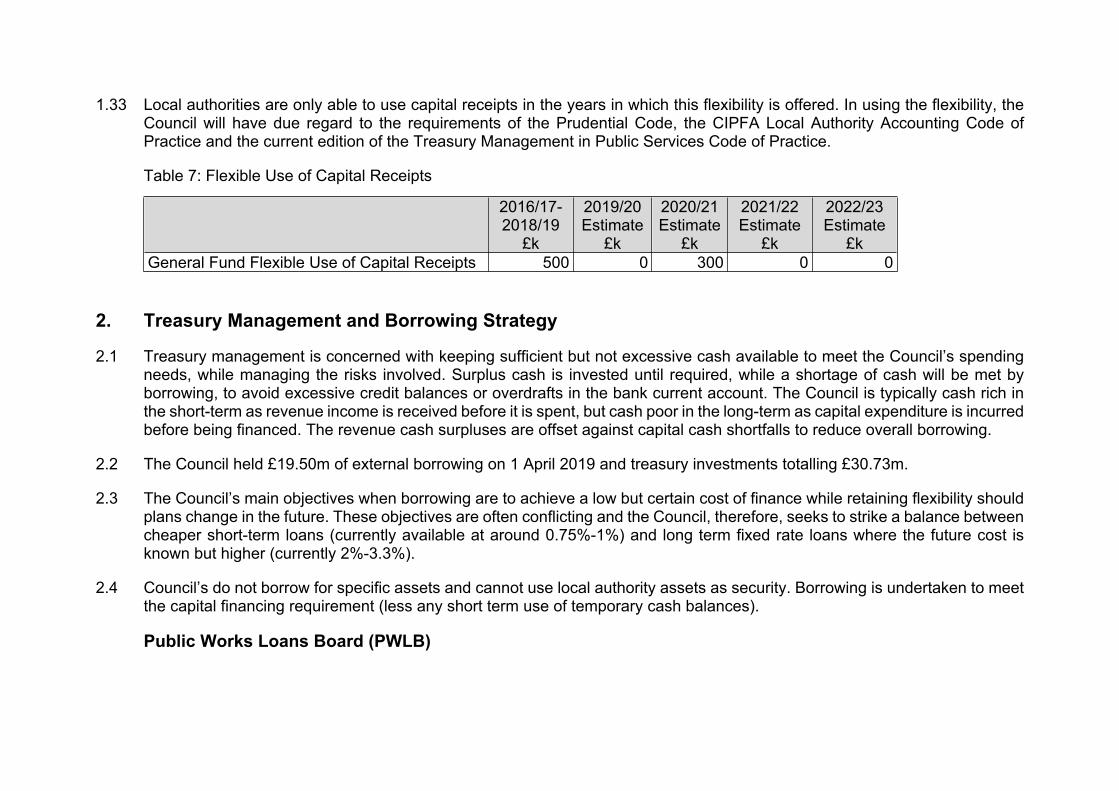
£kGeneral Fund Flexible Use of Capital Receipts 500 0 300 0 0
2. Treasury Management and Borrowing Strategy
2.1 Treasury management is concerned with keeping sufficient but not excessive cash available to meet the Council’s spending needs, while managing the risks involved. Surplus cash is invested until required, while a shortage of cash will be met by borrowing, to avoid excessive credit balances or overdrafts in the bank current account. The Council is typically cash rich in the short-term as revenue income is received before it is spent, but cash poor in the long-term as capital expenditure is incurred before being financed. The revenue cash surpluses are offset against capital cash shortfalls to reduce overall borrowing.
2.2 The Council held £19.50m of external borrowing on 1 April 2019 and treasury investments totalling £30.73m.
2.3 The Council’s main objectives when borrowing are to achieve a low but certain cost of finance while retaining flexibility should plans change in the future. These objectives are often conflicting and the Council, therefore, seeks to strike a balance between cheaper short-term loans (currently available at around 0.75%-1%) and long term fixed rate loans where the future cost is known but higher (currently 2%-3.3%).
2.4 Council’s do not borrow for specific assets and cannot use local authority assets as security. Borrowing is undertaken to meet the capital financing requirement (less any short term use of temporary cash balances).
Public Works Loans Board (PWLB)

2.5 A common source of borrowing for local authorities is the Treasury, through the Debt Management Office, which took over the responsibilities of the previous Public Works Loans Board (although the term PWLB is still commonly used). There are a number of advantages to using the PWLB as a source of borrowing, such as
Funds can be accessed quickly – usually within 2-3 days of notice It is simple to arrange with limited time and effort required The Council does not require a credit rating Borrowing is not linked to any specific asset, but can provide the resources need to meet the overall capital financing
requirement.
2.6 The PWLB currently offers a discounted ‘certainty rate’ at 0.2% below its standard rates, triggered by the Council completing an annual return to Government. It also offers a discounted ‘infrastructure rate’ which is 0.4% below its standard rate, which is subject to a competitive bidding process.
2.7 In October, in response to the Treasury’s concern about growing total debt balances for local government, the PWLB standard and certainty rates were increased by 1% without notice. As a consequence, the Council is working on identifying alternative sources of long term finance such as issuing bonds to the capital markets (typically pension funds and insurance companies).
Total Debt Position
2.8 Projected levels of the Council’s total outstanding debt are shown below, compared with the CFR (as detailed above). Statutory guidance is that actual debt should remain below the CFR, except in the short-term. As can be seen from the table the Council expects to comply with this in the medium term.
Table 8: Prudential Indicator – Gross Debt and the CFR
2018/19Actual
£k
2019/20Budget
£k
2020/21Estimate
£k
2021/22Estimate
£k
2022/23Estimate
£kDebt 19,500 79,097 126,197 177,397 195,097CFR 39,320 93,844 141,442 191,409 207,799
Liability Benchmark
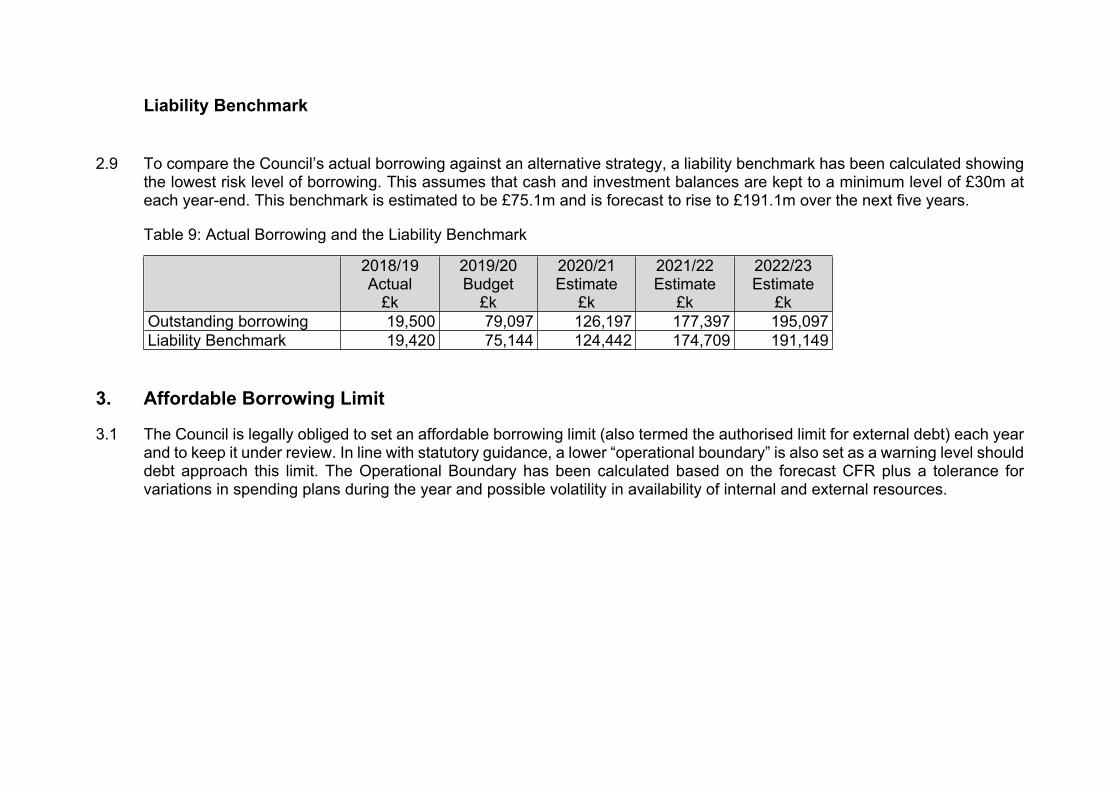
2.9 To compare the Council’s actual borrowing against an alternative strategy, a liability benchmark has been calculated showing the lowest risk level of borrowing. This assumes that cash and investment balances are kept to a minimum level of £30m at each year-end. This benchmark is estimated to be £75.1m and is forecast to rise to £191.1m over the next five years.
Table 9: Actual Borrowing and the Liability Benchmark
2018/19Actual
£k
2019/20Budget
£k
2020/21Estimate
£k
2021/22Estimate
£k
2022/23Estimate
£kOutstanding borrowing 19,500 79,097 126,197 177,397 195,097Liability Benchmark 19,420 75,144 124,442 174,709 191,149
3. Affordable Borrowing Limit
3.1 The Council is legally obliged to set an affordable borrowing limit (also termed the authorised limit for external debt) each year and to keep it under review. In line with statutory guidance, a lower “operational boundary” is also set as a warning level should debt approach this limit. The Operational Boundary has been calculated based on the forecast CFR plus a tolerance for variations in spending plans during the year and possible volatility in availability of internal and external resources.

Table 10: Prudential Indicators – Authorised Limit and Operational Boundary for external debt
2018/19Actual
£k
2019/20Budget
£k
2020/21Estimate
£k
2021/22Estimate
£k
2022/23Estimate
£kOperational Boundary:Borrowing 19,500 100,000 120,000 170,000 190,000Leases 82 1,000 15,000 20,000 20,000Total Operational Boundary 19,582 101,000 135,000 190,000 210,000
Authorised Limit:Borrowing 124,000 124,000 140,000 180,000 210,000Leases 1,000 1,000 20,000 25,000 25,000Total Authorised Limit 125,000 125,000 165,000 205,000 235,000
3.2 Further details of existing borrowing can be found in the Treasury Management Strategy Statement.
4. Treasury Investment Strategy
4.1 Treasury investments arise from receiving cash before it is paid out again. Investments made for service reasons or for pure financial gain are not generally considered to be part of treasury management.
4.2 The Council’s policy on treasury investments is to prioritise security and liquidity over yield, therefore to focus on minimising risk rather than maximising returns. Cash that is likely to be spent in the near term is invested securely, for example with the government, other local authorities or selected high quality banks to minimise the risk of loss. Money that will be held for longer terms is invested more widely, including in bonds, shares and property, to balance the risk of loss against the risk of receiving returns below inflation. Both near-term and longer-term investments may be held in pooled funds, where an external fund manager makes decisions on which particular investments to buy and the Council may request its money back at short notice.
4.3 As part of the Council’s financial strategy, the aim is to grow the balance within the investment portfolio to improve the net income available through treasury management to fund services, whilst maintaining a prudent balance between security, liquidity and yield. Subject to long term cash flow forecasts, it is anticipated that funds held in longer term investments will be maintained at current levels.
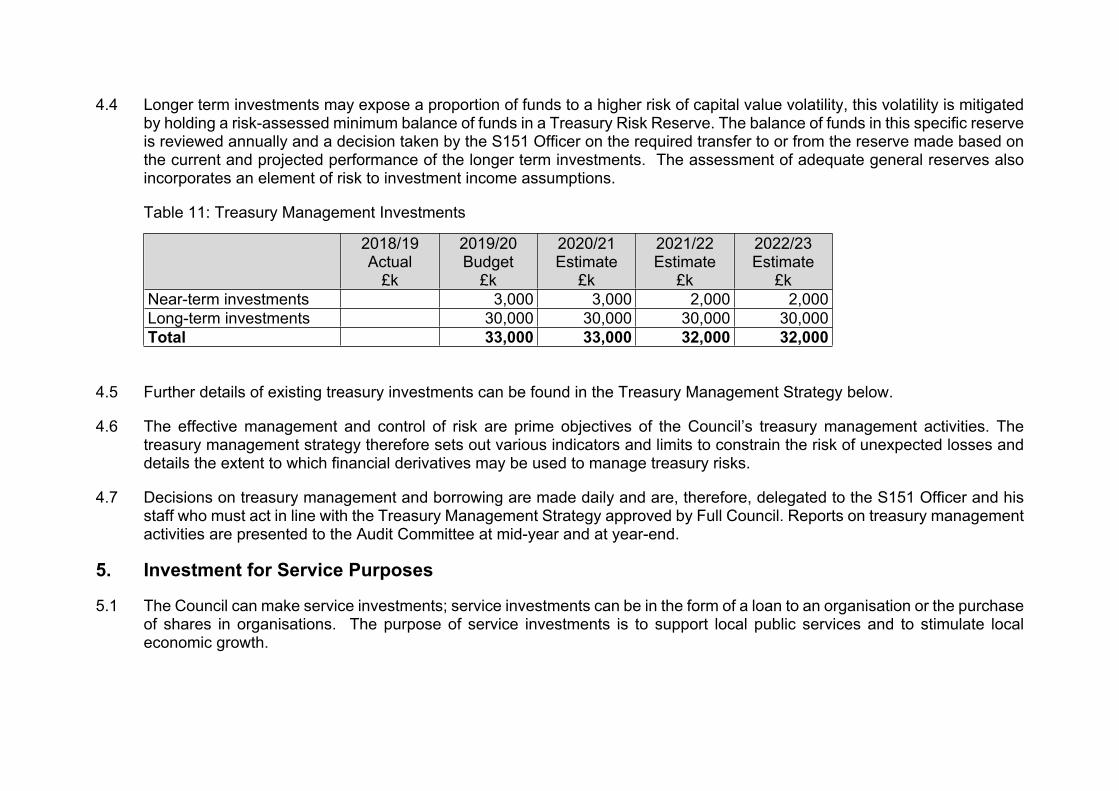
4.4 Longer term investments may expose a proportion of funds to a higher risk of capital value volatility, this volatility is mitigated by holding a risk-assessed minimum balance of funds in a Treasury Risk Reserve. The balance of funds in this specific reserve is reviewed annually and a decision taken by the S151 Officer on the required transfer to or from the reserve made based on the current and projected performance of the longer term investments. The assessment of adequate general reserves also incorporates an element of risk to investment income assumptions.
Table 11: Treasury Management Investments
2018/19Actual
£k
2019/20Budget
£k
2020/21Estimate
£k
2021/22Estimate
£k
2022/23Estimate
£kNear-term investments 3,000 3,000 2,000 2,000Long-term investments 30,000 30,000 30,000 30,000Total 33,000 33,000 32,000 32,000
4.5 Further details of existing treasury investments can be found in the Treasury Management Strategy below.
4.6 The effective management and control of risk are prime objectives of the Council’s treasury management activities. The treasury management strategy therefore sets out various indicators and limits to constrain the risk of unexpected losses and details the extent to which financial derivatives may be used to manage treasury risks.
4.7 Decisions on treasury management and borrowing are made daily and are, therefore, delegated to the S151 Officer and his staff who must act in line with the Treasury Management Strategy approved by Full Council. Reports on treasury management activities are presented to the Audit Committee at mid-year and at year-end.
5. Investment for Service Purposes
5.1 The Council can make service investments; service investments can be in the form of a loan to an organisation or the purchase of shares in organisations. The purpose of service investments is to support local public services and to stimulate local economic growth.
5.2 In light of the public service objective, the Council is willing to take more risk than with treasury investments, however it still plans for such investments to break even after all costs.
5.3 Decisions on service investments are presented to Strategic Leadership Team, which includes the Section 151 Officer. Investments must meet the criteria and limits laid down in the investment strategy. Most loans and shares are capital expenditure and purchases will therefore also be approved as part of the capital programme.
5.4 Further details on service investments are contained in the Investment Strategy.
6. Commercial Investment Activities
6.1 The commercial property investment portfolio is an integral part of the Council’s medium term financial plan and contributes towards the overall income generation target that is needed to mitigate the significant reduction in government funding, enable the Council to maintain and improve services and service standards, and meet our priorities and objectives. The Commercial Strategy details the Council’s approach to commercialisation. One of the aims of the strategy is to align with and support the Council Plan and ensure that the Council is the partner of choice for the community and commercial sectors by demonstrating its commercial awareness and effective delivery of services.
6.2 The value of the property held for investment purposes was £26.1m as at 31 March 2019 and is anticipated to be £85.7m at 31 March 2020, the forecast rate of return net of financing costs is anticipated to be in the region of 3.98%.
6.3 With financial return being the main objective, and as with investments for service purposes, the Council accepts a higher risk on commercial investment than with treasury investments. It has a robust risk assessment process in place which includes assessing the risk of loss before entering into and whilst holding service investments.
6.4 This increased risk is balanced with an efficient and proportional regard to governance, policy, management, processes and systems to ensure robust decision-making, performance and success of new commercial enterprises, contracts and partnerships. All of which will continue to evolve and be refined over time to ensure that the Council adheres to its statutory responsibilities and that public money continues to be appropriately invested, used and accounted for.
6.5 In considering investment opportunities, a predetermined set of assessment criteria for each proposed investment is used and a business case is completed to ensure transparency, due diligence, governance and consistency to aid achievement of the investment objectives.
6.6 In order that commercial investments remain proportionate to the size of the authority, these are subject to an overall maximum investment limit of £150m.
6.7 If the returns on investments are not maintained at the required levels contingency plans to continue to provide services are in place. The contingency plan includes holding adequate general reserves and a specific investment risk reserves such as the Treasury Risk Reserve and the Investment Property Risk Reserve.
6.8 Decisions on commercial investments are made in line with the criteria and limits approved by council in the 2020/21 investment strategy. Property and most other commercial investments are also capital expenditure and purchases will therefore also be approved as part of the capital programme.
6.9 Further details on commercial investments and limits are included in the investment strategy.
7. Liabilities
7.1 In addition to capital debt as detailed above the Council is committed to making future payments to cover its pension deficit, which was valued at £73.83m on 1 April 2019. This balance is due to be paid over a 20 year period, and the deficit and annual contributions are revalued every three years. It has also set aside funds to cover provisions for probable costs. The Council is also at risk of having to pay for contingent liabilities but has not put aside any money because payment is contingent on, as yet, unknown events occurring which may crystallise possible amounts due.
7.2 Decisions on incurring new discretionary liabilities are taken by senior managers and service managers in consultation with the S151 Officer. The risk of liabilities crystallising and requiring payment is monitored by the finance team and reported to the S151 officer.
7.3 Further details on liabilities and guarantees can be found in the 2018/19 Statements of Accounts.
8. Revenue Budget Implications
8.1 Although capital expenditure is not charged directly to the revenue budget, interest payable on loans/leases and capital debt repayment provisions are charged to revenue, offset by any investment income receivable. The net annual charge is known as financing costs; this is compared to the net revenue stream i.e. the amount funded from Council Tax, business rates and general government grants.
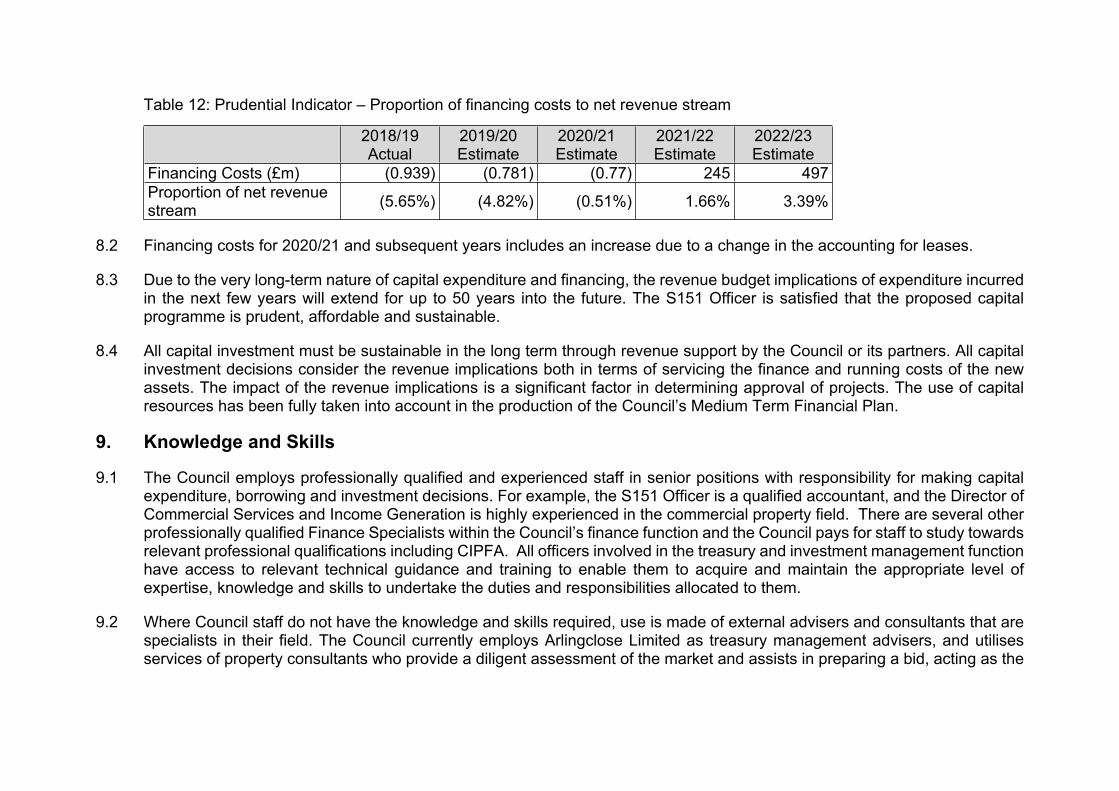
Table 12: Prudential Indicator – Proportion of financing costs to net revenue stream
2018/19Actual
2019/20Estimate
2020/21Estimate
2021/22Estimate
2022/23Estimate
Financing Costs (£m) (0.939) (0.781) (0.77) 245 497Proportion of net revenue stream (5.65%) (4.82%) (0.51%) 1.66% 3.39%
8.2 Financing costs for 2020/21 and subsequent years includes an increase due to a change in the accounting for leases.
8.3 Due to the very long-term nature of capital expenditure and financing, the revenue budget implications of expenditure incurred in the next few years will extend for up to 50 years into the future. The S151 Officer is satisfied that the proposed capital programme is prudent, affordable and sustainable.
8.4 All capital investment must be sustainable in the long term through revenue support by the Council or its partners. All capital investment decisions consider the revenue implications both in terms of servicing the finance and running costs of the new assets. The impact of the revenue implications is a significant factor in determining approval of projects. The use of capital resources has been fully taken into account in the production of the Council’s Medium Term Financial Plan.
9. Knowledge and Skills
9.1 The Council employs professionally qualified and experienced staff in senior positions with responsibility for making capital expenditure, borrowing and investment decisions. For example, the S151 Officer is a qualified accountant, and the Director of Commercial Services and Income Generation is highly experienced in the commercial property field. There are several other professionally qualified Finance Specialists within the Council’s finance function and the Council pays for staff to study towards relevant professional qualifications including CIPFA. All officers involved in the treasury and investment management function have access to relevant technical guidance and training to enable them to acquire and maintain the appropriate level of expertise, knowledge and skills to undertake the duties and responsibilities allocated to them.
9.2 Where Council staff do not have the knowledge and skills required, use is made of external advisers and consultants that are specialists in their field. The Council currently employs Arlingclose Limited as treasury management advisers, and utilises services of property consultants who provide a diligent assessment of the market and assists in preparing a bid, acting as the
sounding board for the in house Investment Surveyor. This approach is more cost effective than employing such staff directly, and ensures that the Council has access to knowledge and skills commensurate with its risk appetite.
9.3 Those charged with governance (Members of the Audit Governance and the District Executive) recognise their individual responsibility to ensure that they have the necessary skills to complete their role effectively. The S151 Officer will ensure that elected members tasked with treasury management responsibilities, including those responsible for scrutiny, have access to training relevant to their needs and responsibilities.

Investment Strategy1 Introduction
1.1 The Council invests funds that it holds for three broad purposes:
i) because it has surplus cash as a result of its day-to-day activities, for example when income is received in advance of expenditure (known as treasury management investments),
ii) to support local public services by lending to or buying shares in other organisations (service investments), and
iii) to earn investment income (known as commercial investments where this is the main purpose)
1.2 This investment strategy meets the requirements of statutory guidance issued by the government in January 2018, and focuses on the second and third of these categories.
2 Treasury Management Investments
2.1 The Council typically receives its income in cash (e.g. from taxes and grants) before it pays for its expenditure in cash (e.g. through payroll and invoices). It also holds reserves for future expenditure and collects local taxes on behalf of other local authorities and central government. These activities, plus the timing of borrowing decisions, lead to a cash surplus which is invested in accordance with guidance from the Chartered Institute of Public Finance and Accountancy (CIPFA). The balance of treasury management investments is expected to fluctuate between £30m and £60m during the 2020/21 financial year.
2.2 The contribution that these investments make to the objectives of the Council is to support effective treasury management activities.
2.3 Full details of the Council’s policies and its plan for 2020/21 for treasury management investments are covered in the treasury management strategy later in this document.
3 Service Investments – Loans
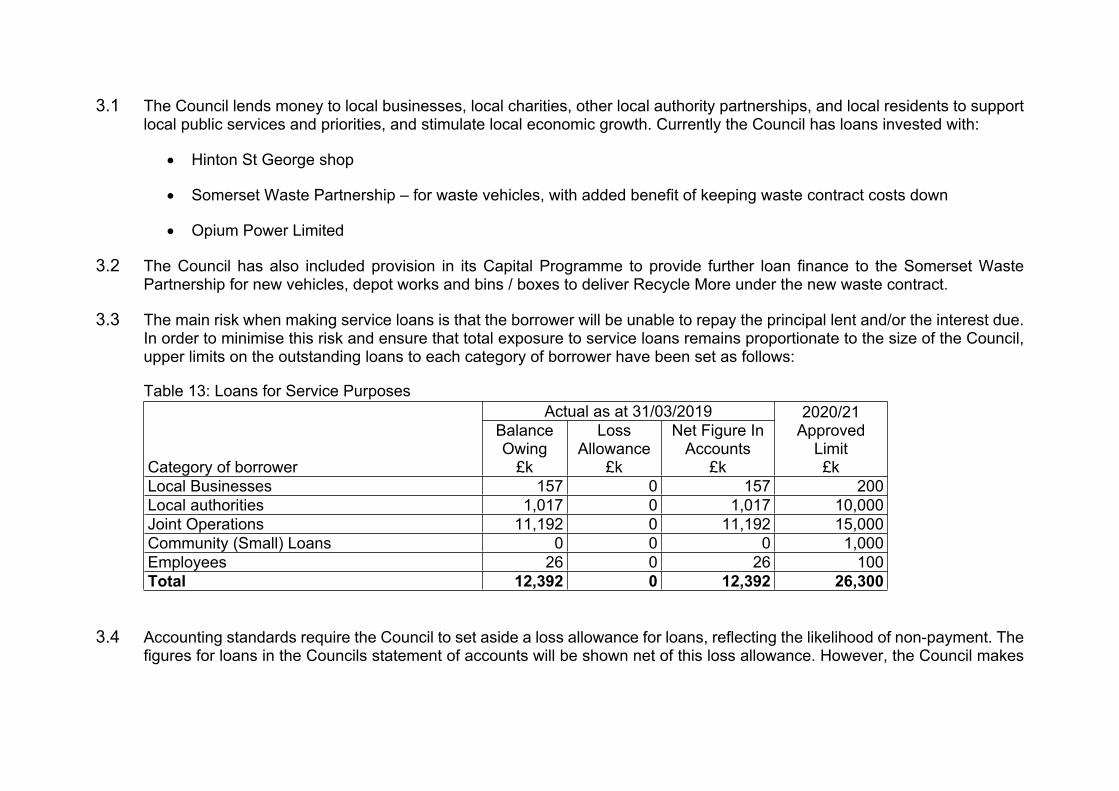
3.1 The Council lends money to local businesses, local charities, other local authority partnerships, and local residents to support local public services and priorities, and stimulate local economic growth. Currently the Council has loans invested with:
Hinton St George shop
Somerset Waste Partnership – for waste vehicles, with added benefit of keeping waste contract costs down
Opium Power Limited
3.2 The Council has also included provision in its Capital Programme to provide further loan finance to the Somerset Waste Partnership for new vehicles, depot works and bins / boxes to deliver Recycle More under the new waste contract.
3.3 The main risk when making service loans is that the borrower will be unable to repay the principal lent and/or the interest due. In order to minimise this risk and ensure that total exposure to service loans remains proportionate to the size of the Council, upper limits on the outstanding loans to each category of borrower have been set as follows:
Table 13: Loans for Service PurposesActual as at 31/03/2019
Category of borrower
Balance Owing
£k
Loss Allowance
£k
Net Figure In Accounts
£k
2020/21Approved
Limit£k
Local Businesses 157 0 157 200Local authorities 1,017 0 1,017 10,000Joint Operations 11,192 0 11,192 15,000Community (Small) Loans 0 0 0 1,000Employees 26 0 26 100Total 12,392 0 12,392 26,300
3.4 Accounting standards require the Council to set aside a loss allowance for loans, reflecting the likelihood of non-payment. The figures for loans in the Councils statement of accounts will be shown net of this loss allowance. However, the Council makes
every reasonable effort to collect the full sum lent and has appropriate credit control arrangements in place to recover overdue repayments.
3.5 No loss allowance is set aside for the current loans made for service purposes. In the case of the loan to the local business and the loan to the joint operation, the Council has a charge over the asset. The asset values are currently higher than the value of the balance owing on the respective loans, therefore no loss allowance is currently required. Assets are revalued in line with the accounting policies and the loss allowance will be revised if asset value reduces to a level below the balance outstanding on the loan.
3.6 The Council assesses the risk of loss before entering into and whilst holding service loans by working up a robust business case and applying due diligence to all requests for service loans, and proportionate monitoring of credit risk of borrowers. For example, with loans to key businesses the Council’s finance specialist team (qualified accountants) will review financial statements and service officers will maintain communication with the borrower in order that emerging risks are identified promptly. The Council will use credit rating information where available, and will use external specialist advisors if appropriate.
4 Service Investments – Shares
4.1 The Council does not currently hold any direct investment in the shares of subsidiaries, its suppliers or local businesses. As part of the Council’s commercialisation agenda, the Council may explore opportunities to establish wholly-owned or partly-owned trading companies. In any such case, appropriate business cases, due diligence, risk assessment and governance proposals will be developed for consideration of Full Council. In addition, relevant provisions would be added to the Investment Strategy including the expected contribution to the Council’s strategies and priorities, and the security and liquidity of investments.
5 Commercial Investments – Property
5.1 The Council invests in a diverse investment property portfolio both locally and nationally with the intention of generating surplus income that will be spent on local public services delivered within the district. This is an essential response to significant reductions in government funding over recent years, in order to meet service delivery objectives and the place making role of the Council, and avoid service cuts. The council plans to increase its investment by up to £85m over the next 2-3 years.

5.2 The Council holds a number of assets that were initially acquired for service purposes such as benefitting the local economy but have since been reclassified as investment properties. These are now established and the main purpose for holding the assets is for rental income. The following table summarises the investment properties as at 1 April 2019.
Table 14: Property held for investment purposes31st March 2019 (Actual) 31st March 2020 (Expected)
Sector ActualPurchase cost
£k
Valuation Gains or (-) losses
£k
Value in accounts
£k
Valuation Gains or (-) losses
£k
Value in accounts
£kOffices 11,761 -901 10,860Retail 11,300 -1,200 10,100Industrial 3,361 -261 3,100Small Business Units 1,153 -53 1,100Historic Buildings 419 -39 380Nursery 284 -44 240Commercial 187 33 220Garages 65 -6 59Warehouse 38 -3 35
TBC TBC
Totals 28,568 -2,474 26,094 TBC TBC
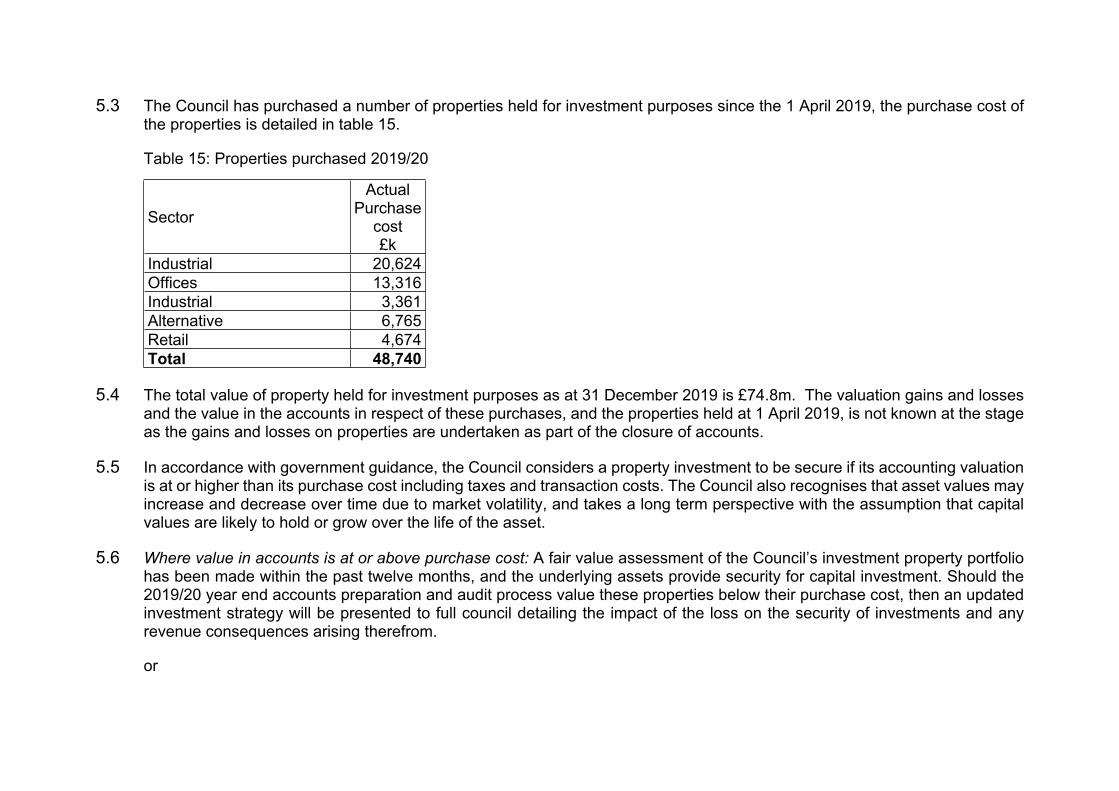
5.3 The Council has purchased a number of properties held for investment purposes since the 1 April 2019, the purchase cost of the properties is detailed in table 15.
Table 15: Properties purchased 2019/20
Sector
ActualPurchase
cost£k
Industrial 20,624Offices 13,316Industrial 3,361Alternative 6,765Retail 4,674Total 48,740
5.4 The total value of property held for investment purposes as at 31 December 2019 is £74.8m. The valuation gains and losses and the value in the accounts in respect of these purchases, and the properties held at 1 April 2019, is not known at the stage as the gains and losses on properties are undertaken as part of the closure of accounts.
5.5 In accordance with government guidance, the Council considers a property investment to be secure if its accounting valuation is at or higher than its purchase cost including taxes and transaction costs. The Council also recognises that asset values may increase and decrease over time due to market volatility, and takes a long term perspective with the assumption that capital values are likely to hold or grow over the life of the asset.
5.6 Where value in accounts is at or above purchase cost: A fair value assessment of the Council’s investment property portfolio has been made within the past twelve months, and the underlying assets provide security for capital investment. Should the 2019/20 year end accounts preparation and audit process value these properties below their purchase cost, then an updated investment strategy will be presented to full council detailing the impact of the loss on the security of investments and any revenue consequences arising therefrom.
or
5.7 Where value in accounts is below purchase cost: The fair value of the Council’s investment property portfolio is no longer sufficient to provide security against loss, and the Council is therefore taking mitigating actions to protect the capital invested. These actions include: planning to hold the assets for the long term; maintaining assets to appropriate quality; mitigating risk of realised losses through maintaining adequate funds in an Investment Risk Reserve, and reducing capital borrowing through its MRP policy.
5.8 The Council assesses the risk of loss before entering into and whilst holding property investments by undertaking appropriate due diligence including full valuation surveys and operating an asset management plan. The Council also considers strength of local market conditions to give confidence on future re-letting and also considers possible alternative uses if appropriate, and actively monitors the portfolio to ensure tenant obligations for maintaining assets are fulfilled.
5.9 Compared with other investment types, property is relatively difficult to sell and convert to cash at short notice, and can take a considerable period to sell in certain market conditions. To ensure that the invested funds can be accessed when they are needed, for example to repay capital borrowed, the Council actively manages cash flow through its treasury management arrangements and plans to under-borrow against its CFR so that it can temporarily borrow at short notice if required.
5.10 The Council’s asset disposal policy includes the approved process for asset disposal and performance indicators (property management indicators) which provide the information on the performance of each property. The performance indicators provide information on assets which are not yielding the level of return required by the Commercial Strategy.
5.11 The Council uses industry standard software, to track the performance of its investment portfolio. The software is capable of monitoring running yields asset by asset and across the portfolio, and adopting multiple scenarios. By continually reviewing the market, the tenant covenant and unexpired lease term of each property, the Council is able to find the optimum time to dispose of assets.
6 Other Categories of Investment
6.1 Special Purpose Vehicles - The Council has setup a special purpose vehicle (SSDC Opium Power Ltd) which will to deliver a renewable energy project. This is the Council’s first step into ownership and development of renewable energy which will provide essential support to the National Grid for balancing power demand and storing renewable energy. The company is 50:50 owned between the Council and Opium Power Limited, with the Council providing a secured term loan facility to the
SPV. The agreed rate of interest on the loan is 5% per annum. A repayment schedule has been agreed with the SPV as part of the loan conditions.
6.2 Renewable energy investments – This type of investment not only assist with the Council's income generation needs and contributes towards the objectives of the commercial strategy, they also meet the Council Plan commitment to promote the use of green technology. Renewable energy measures and investments are continually sought to ensure that the Council’s existing and future energy costs and requirements on our own operational property are considered.
6.3 Community Benefit - Other investments that do not meet the internal rate of return target, but do provide some financial return and also bring collective benefit to the community in accordance with the wider Corporate Plan objectives are considered with a different form of assessment criteria but similar decision making process. The primary objective may not be to generate income but to deliver a service of community benefit i.e. economic development, jobs, health, welfare, leisure, housing need etc.
6.4 Regeneration Schemes - Major investment in Regeneration Schemes are planned or are in progress, such as the Chard Regeneration Scheme and the Yeovil Refresh, and these are projects with their own strategies and plans for delivery, but they link to the Commercial Strategy objectives in the longer term and the same principles apply in executing these projects.
6.5 Therefore, the council will progress, consider and assess Regeneration proposals, using an investment based approach that seeks to create viable regeneration schemes that not only pay for themselves but generate a return on the investment over the longer term where possible. Regeneration delivers both tangible commercial and community objectives resulting in income generation for the wider district in the medium to long-term, as well as directly to the Council through business rates or council tax, for example.
7 Financial Guarantees
7.1 Although not strictly counted as investments, since no money has exchanged hands yet, financial guarantees carry similar risks to the Council and are included here for completeness.
7.2 The Council had the following guarantees on 1 April 2019, as reported in the Council’s Statement of Accounts for 2018/19:
Environmental risk in the Birchfield Park - £311k
Somerset Waste Partnership (SWP) pension liability - £275k
South West Audit Partnership Limited Pension Liability - £149k
Mama Bears Nursery Pension Liability - £36k
8 Proportionality
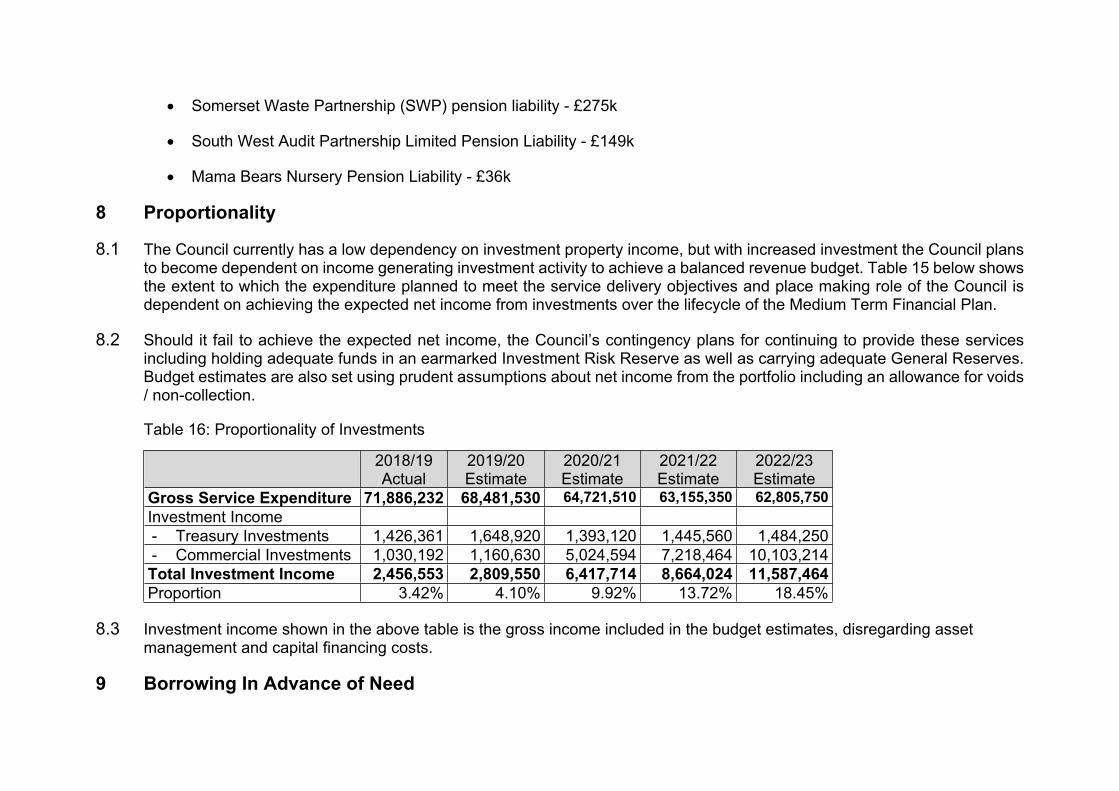
8.1 The Council currently has a low dependency on investment property income, but with increased investment the Council plans to become dependent on income generating investment activity to achieve a balanced revenue budget. Table 15 below shows the extent to which the expenditure planned to meet the service delivery objectives and place making role of the Council is dependent on achieving the expected net income from investments over the lifecycle of the Medium Term Financial Plan.
8.2 Should it fail to achieve the expected net income, the Council’s contingency plans for continuing to provide these services including holding adequate funds in an earmarked Investment Risk Reserve as well as carrying adequate General Reserves. Budget estimates are also set using prudent assumptions about net income from the portfolio including an allowance for voids / non-collection.
Table 16: Proportionality of Investments
2018/19Actual
2019/20Estimate
2020/21Estimate
2021/22Estimate
2022/23Estimate
Gross Service Expenditure 71,886,232 68,481,530 64,721,510 63,155,350 62,805,750Investment Income- Treasury Investments 1,426,361 1,648,920 1,393,120 1,445,560 1,484,250- Commercial Investments 1,030,192 1,160,630 5,024,594 7,218,464 10,103,214Total Investment Income 2,456,553 2,809,550 6,417,714 8,664,024 11,587,464Proportion 3.42% 4.10% 9.92% 13.72% 18.45%
8.3 Investment income shown in the above table is the gross income included in the budget estimates, disregarding asset management and capital financing costs.
9 Borrowing In Advance of Need
9.1 Government guidance is that local authorities must not borrow more than or in advance of their needs purely in order to profit from the investment of the extra sums borrowed. The Council has chosen not to follow this guidance and plans to borrow for this purpose because generating investment income is now essential to respond to the large scale reductions in grant funding from Government. The Council (and its predecessors) has already sought to mitigate this reduction through service cost reductions, combining into a single workforce followed by the creation of the single new council entity, and driving further efficiency by transforming how we work and effectively managing demand for services. Increasing income is also part of the strategy to mitigate the significant funding reductions.
10 Capacity, Skills and Culture
10.1 The Council have enterprising staff, partners and members, their skills and ideas need to be clearly and effectively communicated and harnessed to help achieve our Commercial Strategy. The Council have invested in staff training to enhance staff and member skills and raise the level of commercial expertise across the Council. Staff training is a continuing priority in this area with continuing professional development being an integral part of this.
10.2 The Council has recruited a highly experienced commercial director and qualified property specialists, which ensures that the necessary skills and knowledge are in place to achieve the aims of the Commercial Strategy and ensures that the risks involved in commercial investments are fully understood.
10.3 Officers involved in the investment making decision process are governed by internal procedures and processes and external statutory guidance in the form of the CIPFA Treasury Management Code and MHCLG Investment guidance. Internally limits are set in the annual Treasury Management Strategy Statement and the overriding Treasury Management Practices. The Council team dealing with investment assessments and management are professionally qualified and experienced in their field of property, finance and legal, with access to training as required. Specialist advice will also be bought in for non-traditional property investments as required.
10.4 Members on the Investment Assessment Group will have access to relevant commercial property training for example as provided by the LGA or CIPFA as well as being advised by professional specialists.
10.5 Reporting to members on a regular basis on the performance on current investments, and on potential new investments is an integral part of the Commercial Strategy, the continual reporting ensures that elected members have the information needed to assess the risks and rewards that are associated in this area.
10.6 In considering investment opportunities, a predetermined set of assessment criteria for each proposed investment is used and a business case is completed to ensure transparency, due diligence, governance and consistency to aid achievement of the investment objectives.
10.7 Officers who are tasked with negotiating commercial deals have been provided with the necessary training and information and are aware of the core principles of the prudential framework and of the regulatory regime within which local authorities operate.
Briefings and guidance provided to, and discussed with the senior leadership team and officers involved in commercial deals. There is a requirement for continuing professional development for qualified professionals who are part of the decision making
process for commercials deals.
10.8 The Council has robust governance arrangements in place, the Commercial Strategy (2017-2021) sets out the arrangements which:
Sets out the approved budget for the financial years that the strategy covers, the authority to manage the budget of either borrowings or reserves is delegated to the S151 officer in consultation with the Investment Assessment Group.
An Investment Assessment Group established who undertake due diligence, report on performance and recommend investments to acquire, or assets to dispose of, to the CEO that meet required criteria set out in the Commercial Strategy
The IAG comprises of the Property, Land and Development Manager, Director of Commercial Services & Income Generation, S151 Officer, Monitoring Officer, and Portfolio Holder.
Delegation of individual investment / acquisition approvals up to a value of £10 Million for any single transaction to the Chief Executive Officer in consultation with the Leader.
In considering opportunities, a predetermined set of assessment criteria for each proposed investment project is used. A business case is completed in each case to ensure transparency, due diligence, governance and consistency to aid
achievement of the Commercial Strategy and the Corporate Plan objectives. Where the criteria are met, there is a schedule of delegation agreed that enables positive decisions to be made that
respect market requirements for swift action and confidentiality. If a unanimous recommendation to proceed is made by the IAG, the proposal will be recommended to the Chief
Executive Officer for a final decision in consultation with the Council Leader.

There is regular performance monitoring to demonstrate how investments are performing over time, and to enable portfolio review to take place to maximise benefit over time.
11 Investment Indicators
11.1 The Council has set the following quantitative indicators to allow elected measures and the public to assess the Council’s total risk exposure as a result of its investment decisions.
Total investment exposure:
11.2 This indicator shows the Council’s total exposure to potential investment losses. It includes amounts the Council is contractually committed to lend but have yet to draw down and guarantees the Council has issued.
Table 17: Total Investment ExposureActual
1/4/2019£k
Forecast31/3/2020
£k
Forecast31/3/2021
£k
Forecast31/3/2022
£kTreasury Management Investments – Strategic Funds 23,250 30,000 30,000 30,000Treasury Management Investments – Other 7,480 3,000 2,000 2,000Service Investments – Loans 1,174 5,021 715 1,370Commercial Investment – Property 26,109 85,691 120,691 140,116Other investments – SPV 11,192 12,316 11,674 9,884Total Investments 69,205 136,028 142,715 183,370Guarantees Issued on Pension Liabilities 460 460 185 185Total Commitments and Guarantees 460 460 185 185Total Exposure 69,665 136,468 142,900 183,555
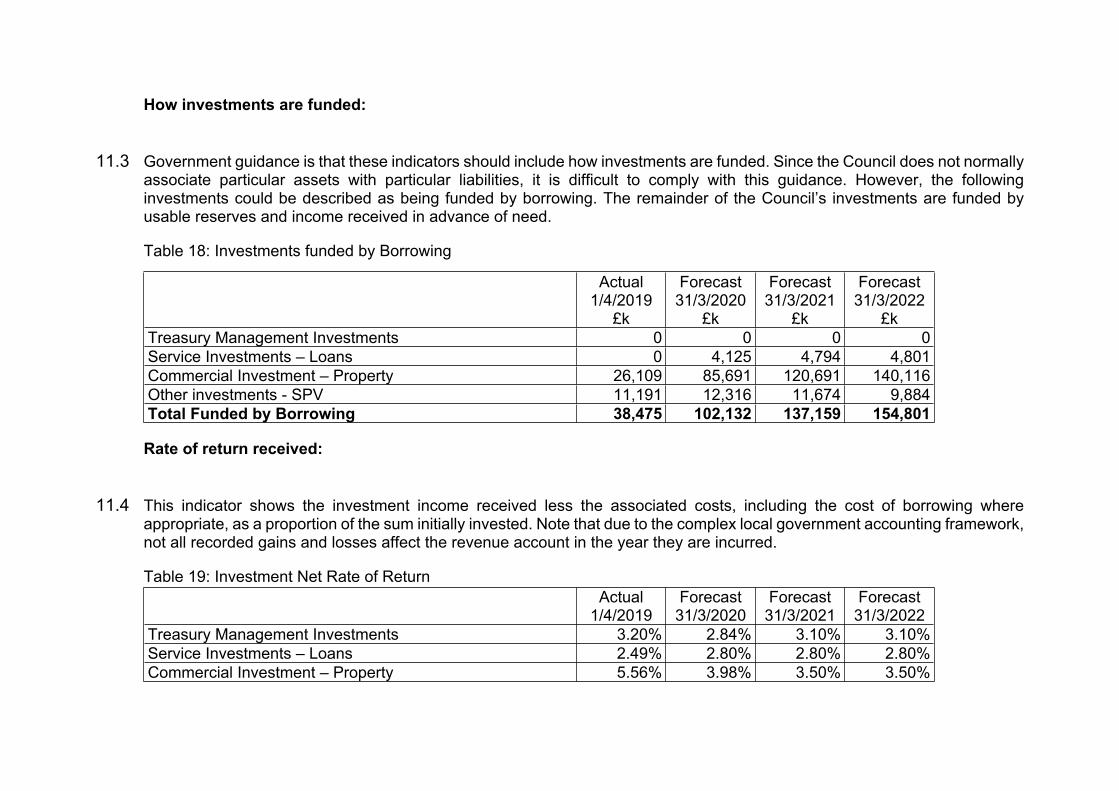
How investments are funded:
11.3 Government guidance is that these indicators should include how investments are funded. Since the Council does not normally associate particular assets with particular liabilities, it is difficult to comply with this guidance. However, the following investments could be described as being funded by borrowing. The remainder of the Council’s investments are funded by usable reserves and income received in advance of need.
Table 18: Investments funded by Borrowing
Actual1/4/2019
£k
Forecast31/3/2020
£k
Forecast31/3/2021
£k
Forecast31/3/2022
£kTreasury Management Investments 0 0 0 0Service Investments – Loans 0 4,125 4,794 4,801Commercial Investment – Property 26,109 85,691 120,691 140,116Other investments - SPV 11,191 12,316 11,674 9,884Total Funded by Borrowing 38,475 102,132 137,159 154,801
Rate of return received:
11.4 This indicator shows the investment income received less the associated costs, including the cost of borrowing where appropriate, as a proportion of the sum initially invested. Note that due to the complex local government accounting framework, not all recorded gains and losses affect the revenue account in the year they are incurred.
Table 19: Investment Net Rate of ReturnActual
1/4/2019Forecast
31/3/2020Forecast
31/3/2021Forecast
31/3/2022Treasury Management Investments 3.20% 2.84% 3.10% 3.10%Service Investments – Loans 2.49% 2.80% 2.80% 2.80%Commercial Investment – Property 5.56% 3.98% 3.50% 3.50%
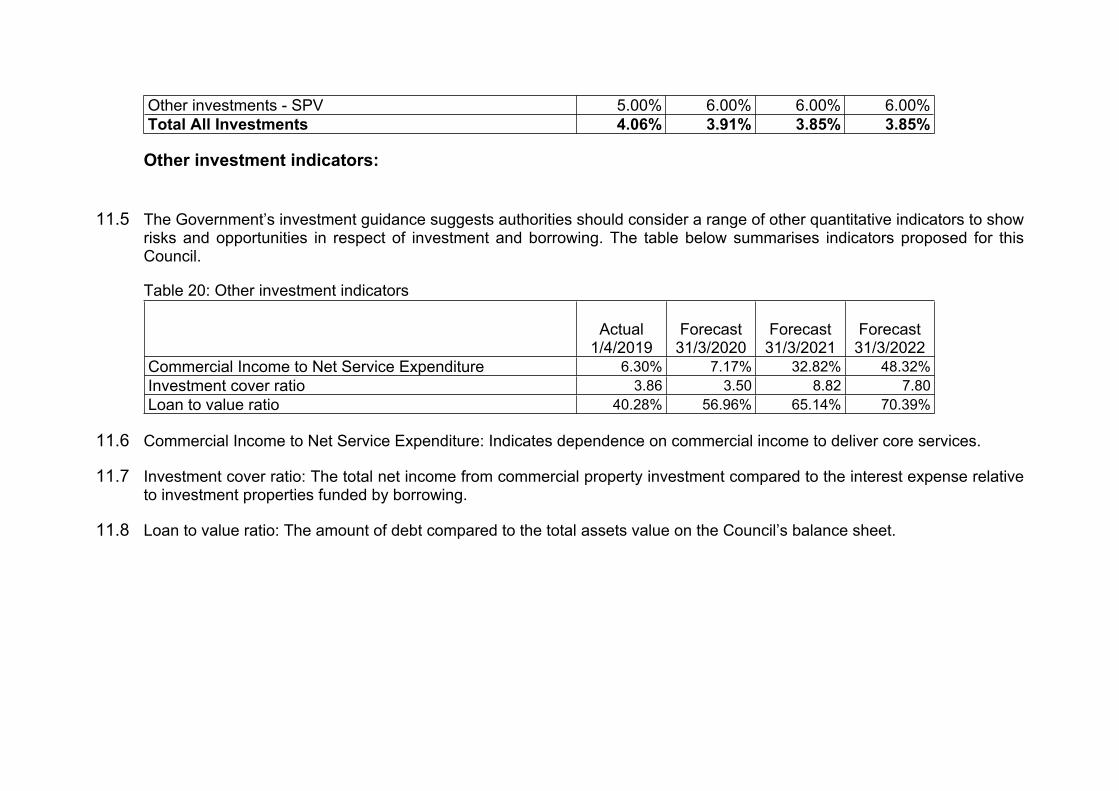
Other investments - SPV 5.00% 6.00% 6.00% 6.00%Total All Investments 4.06% 3.91% 3.85% 3.85%
Other investment indicators:
11.5 The Government’s investment guidance suggests authorities should consider a range of other quantitative indicators to show risks and opportunities in respect of investment and borrowing. The table below summarises indicators proposed for this Council.
Table 20: Other investment indicators
Actual1/4/2019
Forecast31/3/2020
Forecast31/3/2021
Forecast31/3/2022
Commercial Income to Net Service Expenditure 6.30% 7.17% 32.82% 48.32%Investment cover ratio 3.86 3.50 8.82 7.80Loan to value ratio 40.28% 56.96% 65.14% 70.39%
11.6 Commercial Income to Net Service Expenditure: Indicates dependence on commercial income to deliver core services.
11.7 Investment cover ratio: The total net income from commercial property investment compared to the interest expense relative to investment properties funded by borrowing.
11.8 Loan to value ratio: The amount of debt compared to the total assets value on the Council’s balance sheet.
Treasury Management Strategy1 Introduction
1.1 Treasury management is the management of the Council’s cash flows, borrowing and investments and the associated risks. The Council has borrowed and invested substantial sums of money and is, therefore, exposed to financial risks including the loss of invested funds and the revenue effect of changing interest rates. The successful identification, monitoring and control of finical risk are, therefore, central to the Council’s prudent financial management.
1.2 Treasury risk management at the Council is conducted within the framework of the Chartered Institute of Public Finance and Accountancy’s Treasury Management in the Public Services: Code of Practice 2017 Edition (the CIPFA Code) which requires the Council to approve a treasury management strategy before the start of each financial year. This report fulfils the Council’s legal obligation under the Local Government Act 2003 to have regard to the CIPFA Code.
1.3 Investments held for service purposes and for commercial income generation are considered in the Investment Strategy above.
2 External Context
2.1 The treasury strategy appropriately considers the wider economic picture. The Council’s treasury advisor – Arlingclose – has provided a summary commentary on this wider context and their own interest rate forecasts, which is provided in Appendix A.
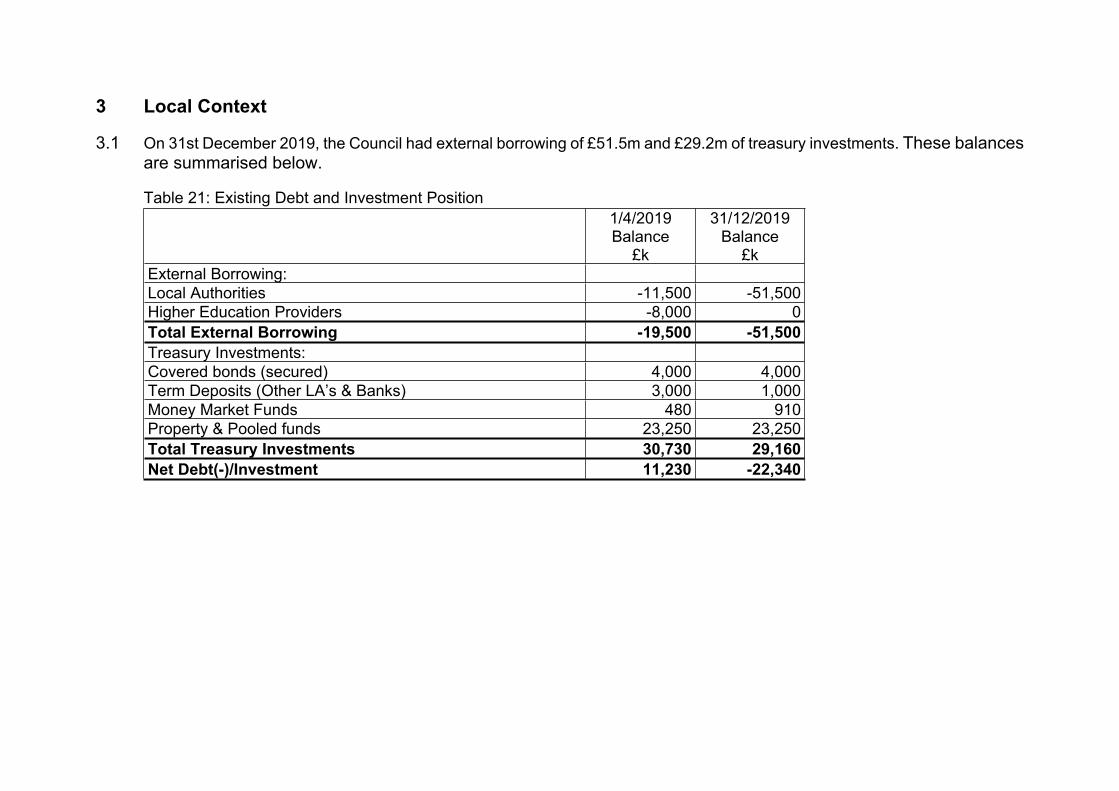
3 Local Context
3.1 On 31st December 2019, the Council had external borrowing of £51.5m and £29.2m of treasury investments. These balances are summarised below.
Table 21: Existing Debt and Investment Position1/4/2019Balance
£k
31/12/2019Balance
£kExternal Borrowing:Local Authorities -11,500 -51,500Higher Education Providers -8,000 0Total External Borrowing -19,500 -51,500Treasury Investments:Covered bonds (secured) 4,000 4,000Term Deposits (Other LA’s & Banks) 3,000 1,000Money Market Funds 480 910Property & Pooled funds 23,250 23,250Total Treasury Investments 30,730 29,160Net Debt(-)/Investment 11,230 -22,340
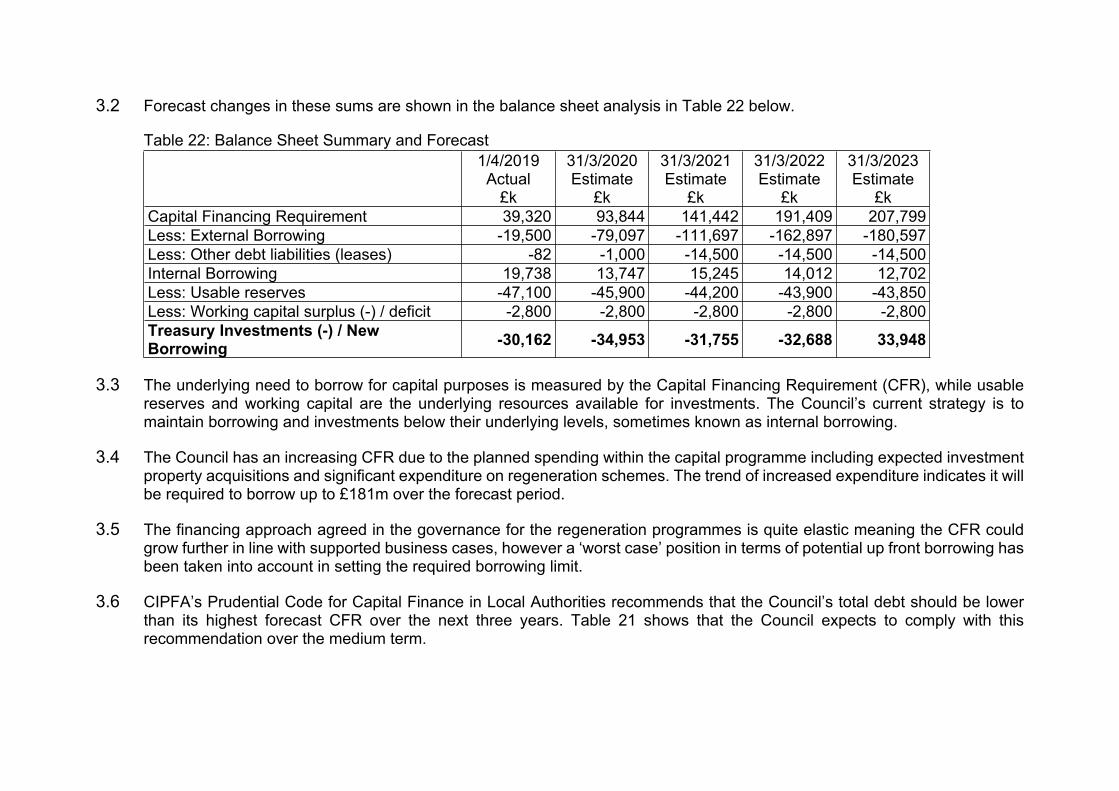
3.2 Forecast changes in these sums are shown in the balance sheet analysis in Table 22 below.
Table 22: Balance Sheet Summary and Forecast1/4/2019
Actual£k
31/3/2020Estimate
£k
31/3/2021Estimate
£k
31/3/2022Estimate
£k
31/3/2023Estimate
£kCapital Financing Requirement 39,320 93,844 141,442 191,409 207,799Less: External Borrowing -19,500 -79,097 -111,697 -162,897 -180,597Less: Other debt liabilities (leases) -82 -1,000 -14,500 -14,500 -14,500Internal Borrowing 19,738 13,747 15,245 14,012 12,702Less: Usable reserves -47,100 -45,900 -44,200 -43,900 -43,850Less: Working capital surplus (-) / deficit -2,800 -2,800 -2,800 -2,800 -2,800Treasury Investments (-) / New Borrowing -30,162 -34,953 -31,755 -32,688 33,948
3.3 The underlying need to borrow for capital purposes is measured by the Capital Financing Requirement (CFR), while usable reserves and working capital are the underlying resources available for investments. The Council’s current strategy is to maintain borrowing and investments below their underlying levels, sometimes known as internal borrowing.
3.4 The Council has an increasing CFR due to the planned spending within the capital programme including expected investment property acquisitions and significant expenditure on regeneration schemes. The trend of increased expenditure indicates it will be required to borrow up to £181m over the forecast period.
3.5 The financing approach agreed in the governance for the regeneration programmes is quite elastic meaning the CFR could grow further in line with supported business cases, however a ‘worst case’ position in terms of potential up front borrowing has been taken into account in setting the required borrowing limit.
3.6 CIPFA’s Prudential Code for Capital Finance in Local Authorities recommends that the Council’s total debt should be lower than its highest forecast CFR over the next three years. Table 21 shows that the Council expects to comply with this recommendation over the medium term.

Liability benchmark:
3.7 To compare the Council’s actual borrowing against an alternative strategy, a liability benchmark has been calculated showing the lowest risk level of borrowing. This assumes the same forecasts as table 21 above, but that cash and investment balances are kept to a minimum level of £30m at each year-end to maintain sufficient liquidity but minimise credit risk.
Table 23: Liability benchmark1/4/2019
Actual£k
31/3/2020Estimate
£k
31/3/2021Estimate
£k
31/3/2022Estimate
£k
31/3/2023Estimate
£kTotal CFR 39,320 93,844 141,442 191,409 207,799Less: Usable reserves -47,100 -45,900 -44,200 -43,900 -43,850Less: Working capital -2,800 -2,800 -2,800 -2,800 -2,800Plus: Minimum investments 30,000 30,000 30,000 30,000 30,000Liability benchmark 19,420 75,144 124,442 174,709 191,149
Borrowing Strategy
3.8 The Council currently holds £51.50m of loans (as at 31 December 2019), compared to £19.50m on 1 April 2019, as part of its strategy for funding previous years’ capital programmes. The balance sheet forecast in table 20 shows that the Council expects to borrow up to £120m in 2020/21. The Council may also borrow additional sums to pre-fund future years’ requirements, providing this does not exceed the authorised limit for borrowing of £165m.
3.9 The Council’s chief objective when borrowing money is to strike an appropriately low risk balance between securing low interest costs and achieving certainty of those costs over the period for which funds are required. The flexibility to renegotiate loans should the Council’s long-term plans change is a secondary objective.
3.10 Given the significant cuts to public expenditure and in particular local government funding, the Council’s borrowing strategy continues to address the key issue of affordability without compromising the longer-term stability of the debt portfolio. With short-term interest rates currently much lower than long-term rates, it is likely to be more cost effective in the short term to either use internal resources, or to borrow short term loans instead.
3.11 By doing so, the Council is able to reduce net borrowing costs (despite foregone investment income) and reduce overall treasury risk. The benefits of internal and short-term borrowing will be monitored regularly against the potential for incurring additional costs by deferring borrowing into future years when long-term borrowing rates are forecast to rise modestly. Arlingclose will assist the Council with this ‘cost of carry’ and breakeven analysis. Its output may determine whether the Council borrows additional sums at long-term fixed rates in 2020/21 with a view to keeping future interest costs low, even if this causes additional cost in the short-term.
3.12 Alternatively, the Council may arrange forward starting loans, where the interest rate is fixed in advance, but the cash is received in later years. This would enable certainty of cost to be achieved without suffering a cost of carry in the intervening period (although forward loan interest rates will usually factor in an allowance for interest rate risk during the intervening period).
3.13 Additionally, the Council may borrow further short term loans to cover unplanned cash flow shortages.
3.14 The approved sources of long-term and short-term borrowing are:
Public Works Loan Board (PWLB) and any successor body Any institution approved for investments (see below) Any other bank or building society authorised to operate in the UK Any other UK public sector body UK public and private pension funds (except Somerset County Pension Fund) Capital market bond investors UK Municipal Bonds Agency plc and other special purpose companies created to enable local authority bond issues
3.15 Other sources of debt finance: In addition, capital finance may be raised by the following methods that are not borrowing, but may be classed as other debt liabilities:
Leasing Hire purchase Private finance initiative Sale and leaseback

3.16 Municipal Bonds Agency: UK Municipal Bonds Agency plc was established in 2014 by the Local Government Association as an alternative to the PWLB. It plans to issue bonds on the capital markets and lend the proceeds to local authorities. This will be a more complicated source of finance than the PWLB for two reasons: borrowing authorities will be required to provide bond investors with a guarantee to refund their investment in the event that the agency is unable to for any reason; and there will be a lead time of several months between committing to borrow and knowing the interest rate payable. Any decision to borrow from the Agency will therefore be the subject of a separate report to full Council.
3.17 Short-term and variable rate loans: These loans leave the Authority exposed to the risk of short-term interest rate rises and are therefore subject to the interest rate exposure limits in the treasury management indicators below. Financial derivatives may be used to manage this interest rate risk (see section below).
3.18 Debt rescheduling: The PWLB allows authorities to repay loans before maturity and either pay a premium or receive a discount according to a set formula based on current interest rates. Other lenders may also be prepared to negotiate premature redemption terms. The Council may take advantage of this and replace some loans with new loans, or repay loans without replacement, where this is expected to lead to an overall cost saving or a reduction in risk.
4 Treasury Investment Strategy
4.1 The Council holds significant invested funds, representing income received in advance of expenditure plus balances and reserves held. In the past 12 months, the Council’s investment balance has ranged between £29m and £46m, and similar levels are expected to be maintained in the forthcoming year.
4.2 The CIPFA Code requires the Council to invest its funds prudently, and to have regard to the security and liquidity of its investments before seeking the highest rate of return, or yield. The Council’s objective when investing money is to strike an appropriate balance between risk and return, minimising the risk of incurring losses from defaults and the risk of receiving unsuitably low investment income. Where balances are expected to be invested for more than one year, the Council will aim to achieve a total return that is equal or higher than the prevailing rate of inflation, in order to maintain the spending power of the sum invested.
4.3 If the UK enters into a recession in 2020/21, there is a small chance that the Bank of England could set its Bank Rate at or below zero, which is likely to feed through to negative interest rates on all low risk, short-term investment options. This situation

already exists in many other European countries. In this event, security will be measured as receiving the contractually agreed amount at maturity, even though this may be less than the amount originally invested.
4.4 Given the increasing risk and very low returns from short-term unsecured bank investments, the Council aims to further diversify into more secure and/or higher yielding asset classes during 2020/21. The Council has increased its strategic (long-term) investments from £23.25m at the start of the financial year to an estimated £27.50m by the 31 March 2020. This diversification will represent a continuation of the strategy adopted in earlier years.
4.5 A proportion of the Council’s surplus cash is currently invested in short-term unsecured bank deposits, money market funds and other local authorities.
4.6 Under the new IFRS 9 standard, the accounting for certain investments depends on the Council’s ‘business model’ for managing them. The Council aims to achieve value for money from its internally managed treasury investments by a business model of collecting the contractual cash flows and, therefore, where other criteria are also met, these investments will continue to be accounted for at amortised cost.
Approved Counterparties
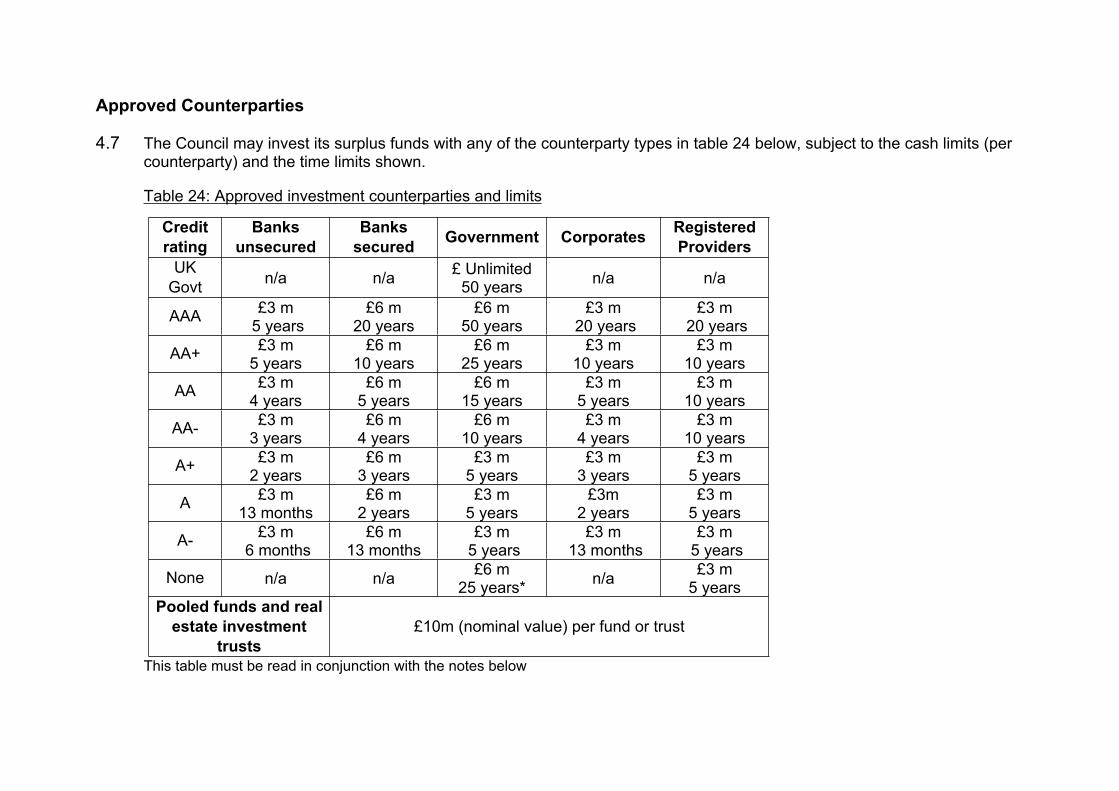
4.7 The Council may invest its surplus funds with any of the counterparty types in table 24 below, subject to the cash limits (per counterparty) and the time limits shown.
Table 24: Approved investment counterparties and limits
Credit rating
Banks unsecured
Bankssecured Government Corporates Registered
ProvidersUK
Govt n/a n/a £ Unlimited50 years n/a n/a
AAA £3 m 5 years
£6 m20 years
£6 m50 years
£3 m 20 years
£3 m 20 years
AA+ £3 m 5 years
£6 m10 years
£6 m25 years
£3 m10 years
£3 m10 years
AA £3 m 4 years
£6 m5 years
£6 m15 years
£3 m5 years
£3 m10 years
AA- £3 m 3 years
£6 m4 years
£6 m10 years
£3 m4 years
£3 m10 years
A+ £3 m 2 years
£6 m3 years
£3 m5 years
£3 m3 years
£3 m5 years
A £3 m 13 months
£6 m2 years
£3 m5 years
£3m2 years
£3 m5 years
A- £3 m 6 months
£6 m13 months
£3 m 5 years
£3 m 13 months
£3 m 5 years
None n/a n/a £6 m25 years* n/a £3 m
5 yearsPooled funds and real
estate investment trusts
£10m (nominal value) per fund or trust
This table must be read in conjunction with the notes below

4.8 Credit rating: Investment limits are set by reference to the lowest published long-term credit rating from a selection of external rating agencies. Where available, the credit rating relevant to the specific investment or class of investment is used, otherwise the counterparty credit rating is used. However, investment decisions are never made solely based on credit ratings, and all other relevant factors including external advice will be taken into account.
4.9 Banks unsecured: Accounts, deposits, certificates of deposit and senior unsecured bonds with banks and building societies, other than multilateral development banks. These investments are subject to the risk of credit loss via a bail-in should the regulator determine that the bank is failing or likely to fail. See below for arrangements relating to operational bank accounts.
4.10 Government: Loans, bonds and bills issued or guaranteed by national governments, regional and local authorities and multilateral development banks. These investments are not subject to bail-in, and there is generally a lower risk of insolvency, although they are not zero risk. Investments with the UK Central Government may be made in unlimited amounts for up to 50 years.
4.11 Corporates: Loans, bonds and commercial paper issued by companies other than banks and registered providers. These investments are not subject to bail-in, but are exposed to the risk of the company going insolvent. Loans to unrated companies will only be made either following an external credit assessment or to a maximum of £2m per company as part of a diversified pool in order to spread the risk widely.
4.12 Registered providers: Loans and bonds issued by, guaranteed by or secured on the assets of registered providers of social housing and registered social landlords, formerly known as housing associations. These bodies are tightly regulated by the Regulator of Social Housing (in England), the Scottish Housing Regulator, the Welsh Government and the Department for Communities (in Northern Ireland). As providers of public services, they retain the likelihood of receiving government support if needed.
4.13 Pooled funds: Shares or units in diversified investment vehicles consisting of the any of the above investment types, plus equity shares and property. These funds have the advantage of providing wide diversification of investment risks, coupled with the services of a professional fund manager in return for a fee. Short-term Money Market Funds that offer same-day liquidity and very low or no volatility will be used as an alternative to instant access bank accounts, while pooled funds whose value changes with market prices and/or have a notice period will be used for longer investment periods.
4.14 Bond, equity and property funds offer enhanced returns over the longer term, but are more volatile in the short term. These allow the Council to diversify into asset classes other than cash without the need to own and manage the underlying
investments. Because these funds have no defined maturity date, but are available for withdrawal after a notice period, their performance and continued suitability in meeting the Council’s investment objectives will be monitored regularly.
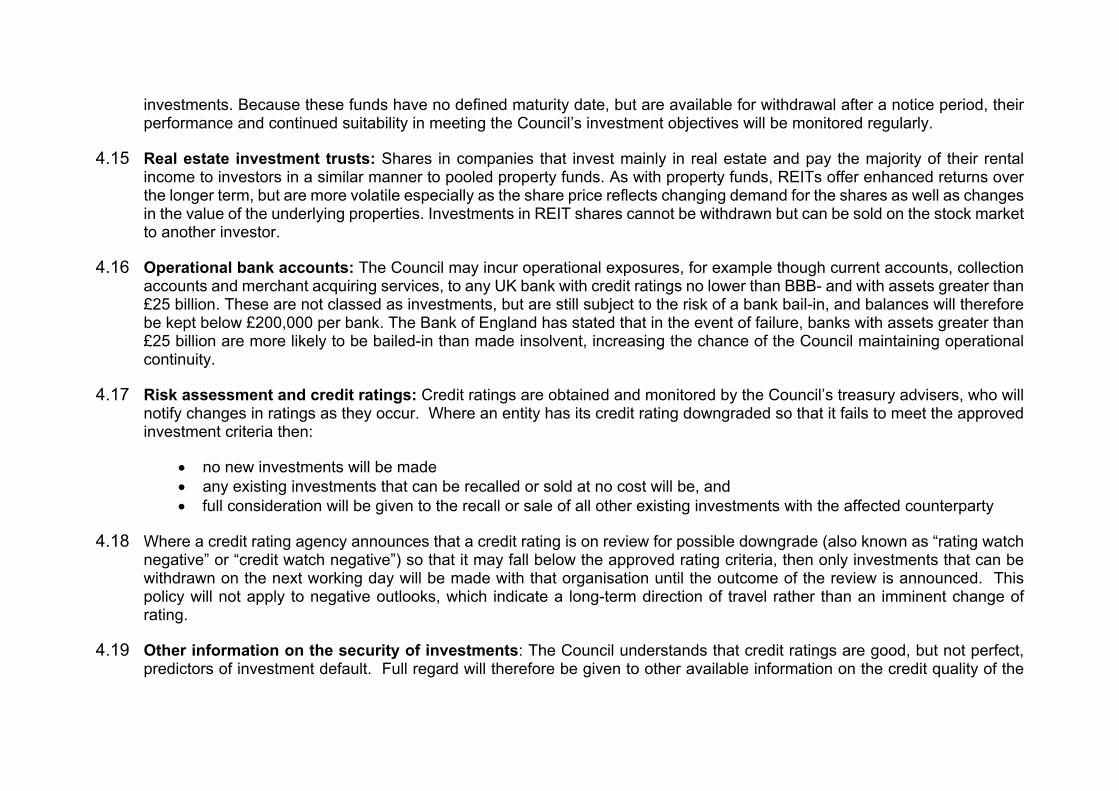
4.15 Real estate investment trusts: Shares in companies that invest mainly in real estate and pay the majority of their rental income to investors in a similar manner to pooled property funds. As with property funds, REITs offer enhanced returns over the longer term, but are more volatile especially as the share price reflects changing demand for the shares as well as changes in the value of the underlying properties. Investments in REIT shares cannot be withdrawn but can be sold on the stock market to another investor.
4.16 Operational bank accounts: The Council may incur operational exposures, for example though current accounts, collection accounts and merchant acquiring services, to any UK bank with credit ratings no lower than BBB- and with assets greater than £25 billion. These are not classed as investments, but are still subject to the risk of a bank bail-in, and balances will therefore be kept below £200,000 per bank. The Bank of England has stated that in the event of failure, banks with assets greater than £25 billion are more likely to be bailed-in than made insolvent, increasing the chance of the Council maintaining operational continuity.
4.17 Risk assessment and credit ratings: Credit ratings are obtained and monitored by the Council’s treasury advisers, who will notify changes in ratings as they occur. Where an entity has its credit rating downgraded so that it fails to meet the approved investment criteria then:
no new investments will be made any existing investments that can be recalled or sold at no cost will be, and full consideration will be given to the recall or sale of all other existing investments with the affected counterparty
4.18 Where a credit rating agency announces that a credit rating is on review for possible downgrade (also known as “rating watch negative” or “credit watch negative”) so that it may fall below the approved rating criteria, then only investments that can be withdrawn on the next working day will be made with that organisation until the outcome of the review is announced. This policy will not apply to negative outlooks, which indicate a long-term direction of travel rather than an imminent change of rating.
4.19 Other information on the security of investments: The Council understands that credit ratings are good, but not perfect, predictors of investment default. Full regard will therefore be given to other available information on the credit quality of the
organisations in which it invests, including credit default swap prices, financial statements, information on potential government support, reports in the quality financial press and analysis and advice from the Council’s treasury management adviser. No investments will be made with an organisation if there are substantive doubts about its credit quality, even though it may otherwise meet the above criteria.
4.20 When deteriorating financial market conditions affect the creditworthiness of all organisations, as happened in 2008 and 2011, this is not generally reflected in credit ratings, but can be seen in other market measures. In these circumstances, the Council will restrict its investments to those organisations of higher credit quality and reduce the maximum duration of its investments to maintain the required level of security. The extent of these restrictions will be in line with prevailing financial market conditions. If these restrictions mean that insufficient commercial organisations of high credit quality are available to invest the Council’s cash balances, then the surplus will be deposited with the UK Government via the Debt Management Office or invested in government treasury bills for example, or with other local authorities. This will cause a reduction in the level of investment income earned but will protect the principal sum invested.
Investment Limits
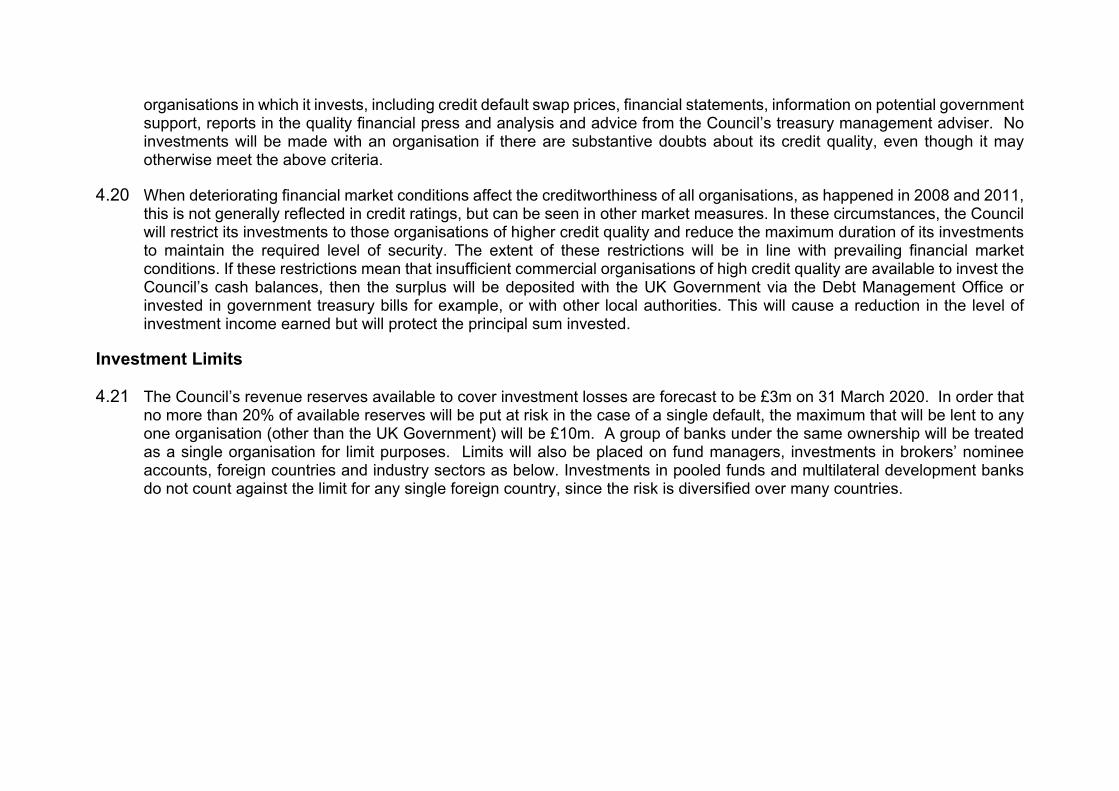
4.21 The Council’s revenue reserves available to cover investment losses are forecast to be £3m on 31 March 2020. In order that no more than 20% of available reserves will be put at risk in the case of a single default, the maximum that will be lent to any one organisation (other than the UK Government) will be £10m. A group of banks under the same ownership will be treated as a single organisation for limit purposes. Limits will also be placed on fund managers, investments in brokers’ nominee accounts, foreign countries and industry sectors as below. Investments in pooled funds and multilateral development banks do not count against the limit for any single foreign country, since the risk is diversified over many countries.
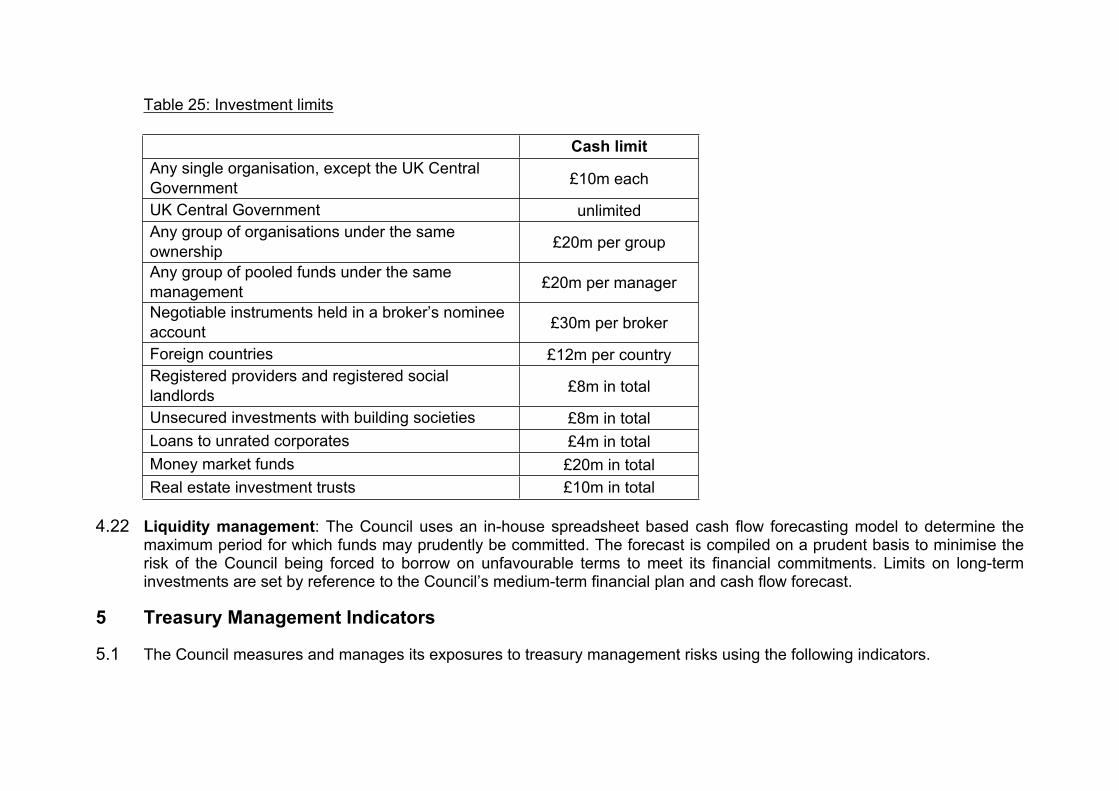
Table 25: Investment limits
Cash limitAny single organisation, except the UK Central Government £10m each
UK Central Government unlimitedAny group of organisations under the same ownership £20m per group
Any group of pooled funds under the same management £20m per manager
Negotiable instruments held in a broker’s nominee account £30m per broker
Foreign countries £12m per countryRegistered providers and registered social landlords £8m in total
Unsecured investments with building societies £8m in totalLoans to unrated corporates £4m in totalMoney market funds £20m in totalReal estate investment trusts £10m in total
4.22 Liquidity management: The Council uses an in-house spreadsheet based cash flow forecasting model to determine the maximum period for which funds may prudently be committed. The forecast is compiled on a prudent basis to minimise the risk of the Council being forced to borrow on unfavourable terms to meet its financial commitments. Limits on long-term investments are set by reference to the Council’s medium-term financial plan and cash flow forecast.
5 Treasury Management Indicators
5.1 The Council measures and manages its exposures to treasury management risks using the following indicators.
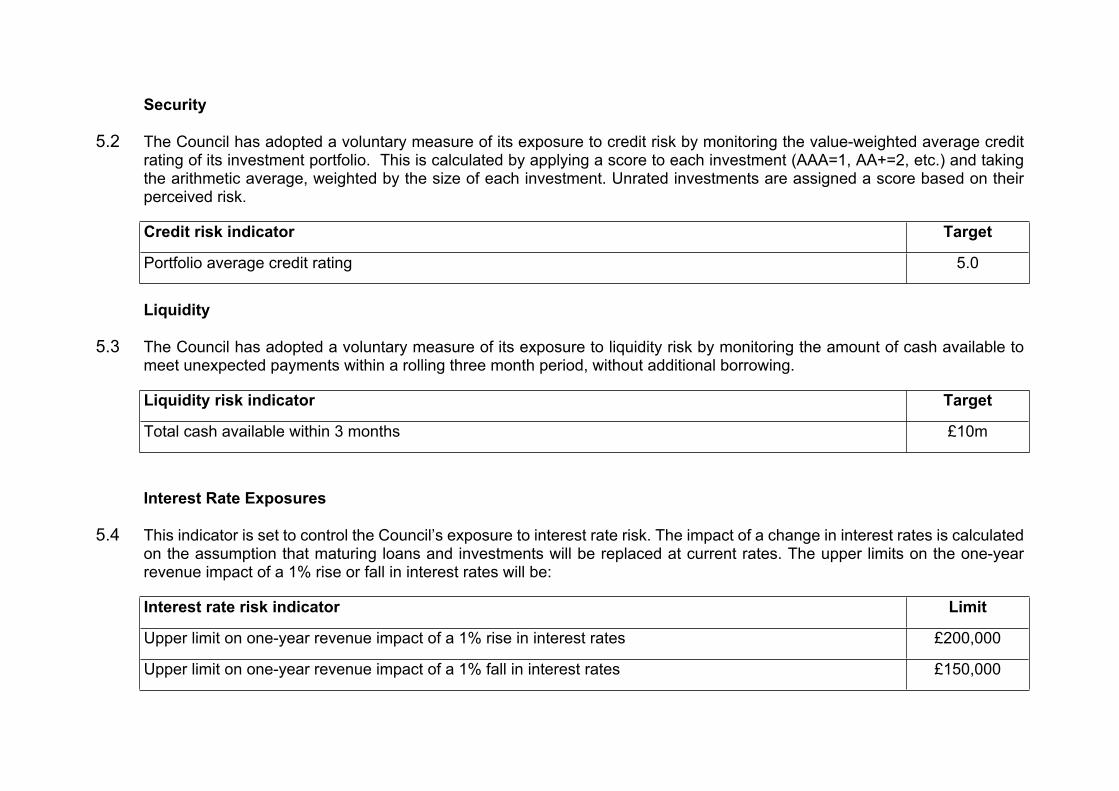
Security
5.2 The Council has adopted a voluntary measure of its exposure to credit risk by monitoring the value-weighted average credit rating of its investment portfolio. This is calculated by applying a score to each investment (AAA=1, AA+=2, etc.) and taking the arithmetic average, weighted by the size of each investment. Unrated investments are assigned a score based on their perceived risk.
Credit risk indicator Target
Portfolio average credit rating 5.0
Liquidity
5.3 The Council has adopted a voluntary measure of its exposure to liquidity risk by monitoring the amount of cash available to meet unexpected payments within a rolling three month period, without additional borrowing.
Liquidity risk indicator Target
Total cash available within 3 months £10m
Interest Rate Exposures
5.4 This indicator is set to control the Council’s exposure to interest rate risk. The impact of a change in interest rates is calculated on the assumption that maturing loans and investments will be replaced at current rates. The upper limits on the one-year revenue impact of a 1% rise or fall in interest rates will be:
Interest rate risk indicator Limit
Upper limit on one-year revenue impact of a 1% rise in interest rates £200,000
Upper limit on one-year revenue impact of a 1% fall in interest rates £150,000
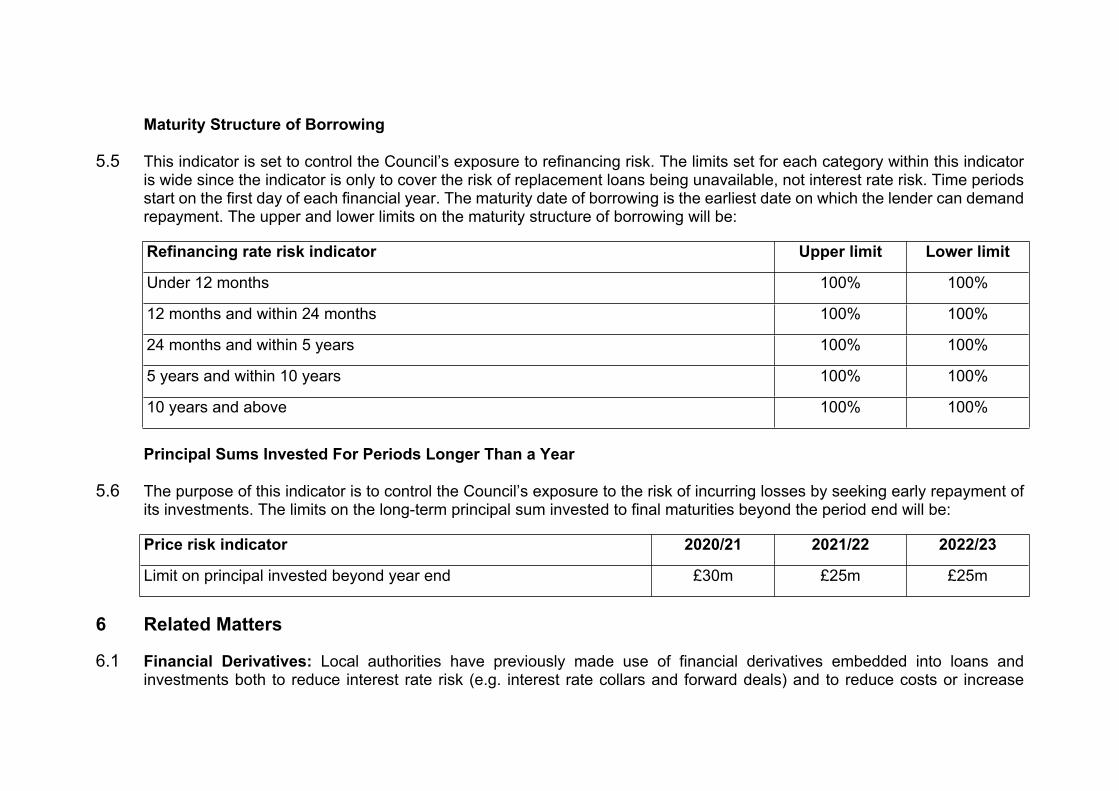
Maturity Structure of Borrowing
5.5 This indicator is set to control the Council’s exposure to refinancing risk. The limits set for each category within this indicator is wide since the indicator is only to cover the risk of replacement loans being unavailable, not interest rate risk. Time periods start on the first day of each financial year. The maturity date of borrowing is the earliest date on which the lender can demand repayment. The upper and lower limits on the maturity structure of borrowing will be:
Refinancing rate risk indicator Upper limit Lower limit
Under 12 months 100% 100%
12 months and within 24 months 100% 100%
24 months and within 5 years 100% 100%
5 years and within 10 years 100% 100%
10 years and above 100% 100%
Principal Sums Invested For Periods Longer Than a Year
5.6 The purpose of this indicator is to control the Council’s exposure to the risk of incurring losses by seeking early repayment of its investments. The limits on the long-term principal sum invested to final maturities beyond the period end will be:
Price risk indicator 2020/21 2021/22 2022/23
Limit on principal invested beyond year end £30m £25m £25m
6 Related Matters
6.1 Financial Derivatives: Local authorities have previously made use of financial derivatives embedded into loans and investments both to reduce interest rate risk (e.g. interest rate collars and forward deals) and to reduce costs or increase
income at the expense of greater risk (e.g. LOBO loans and callable deposits). The general power of competence in Section 1 of the Localism Act 2011 removes much of the uncertainty over local authorities’ use of standalone financial derivatives (i.e. those that are not embedded into a loan or investment).
6.2 The Council will only use standalone financial derivatives (such as swaps, forwards, futures and options) where they can be clearly demonstrated to reduce the overall level of the financial risks that the Council is exposed to. Additional risks presented, such as credit exposure to derivative counterparties, will be taken into account when determining the overall level of risk. Embedded derivatives, including those present in pooled funds and forward starting transactions, will not be subject to this policy, although the risks they present will be managed in line with the overall treasury risk management strategy.
6.3 Financial derivative transactions may be arranged with any organisation that meets the approved investment criteria. The current value of any amount due from a derivative counterparty will count against the counterparty credit limit and the relevant foreign country limit.
6.4 In line with the CIPFA Code, the Council will seek external advice and will consider that advice before entering into financial derivatives to ensure that it fully understands the implications.
6.5 Markets in Financial Instruments Directive: The Council has opted up to professional client status with its providers of financial services, including advisers, banks, brokers and fund managers, allowing it access to a greater range of services but without the greater regulatory protections afforded to individuals and small companies. Given the size and range of the Council’s treasury management activities, the S151 Officer believes this to be the most appropriate status.
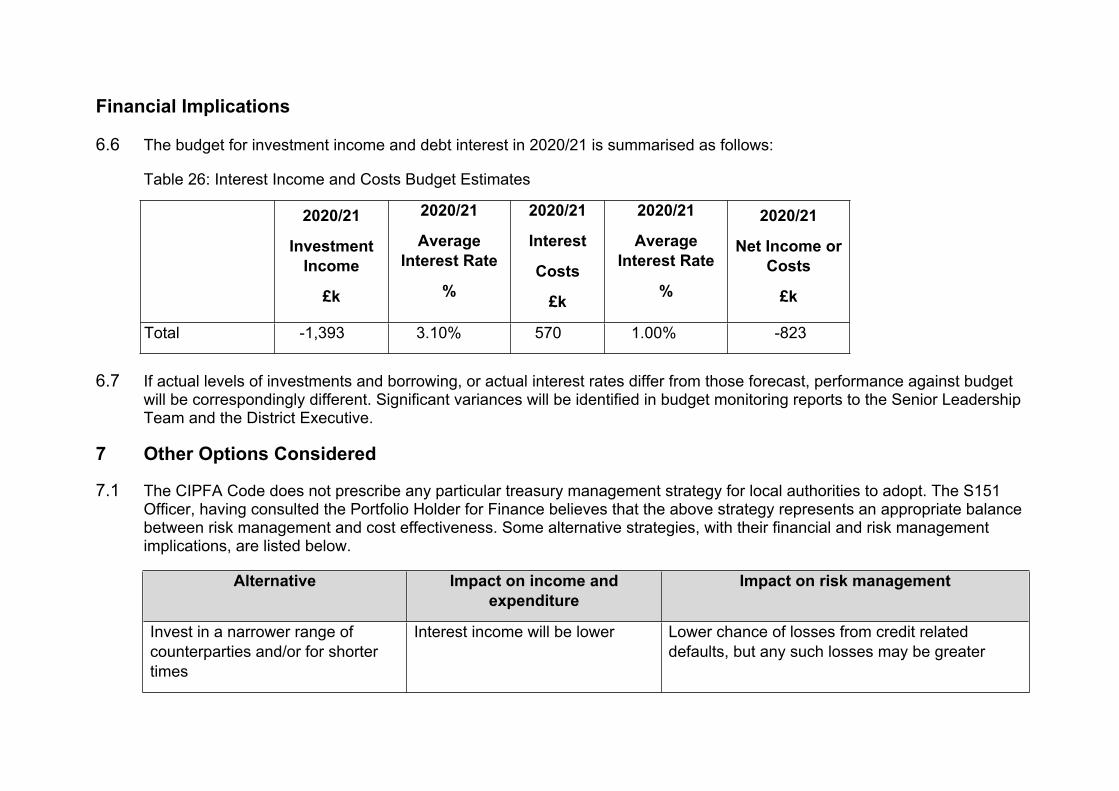
Financial Implications
6.6 The budget for investment income and debt interest in 2020/21 is summarised as follows:
Table 26: Interest Income and Costs Budget Estimates
2020/21
Investment Income
£k
2020/21
Average Interest Rate
%
2020/21
Interest
Costs
£k
2020/21
Average Interest Rate
%
2020/21
Net Income or Costs
£k
Total -1,393 3.10% 570 1.00% -823
6.7 If actual levels of investments and borrowing, or actual interest rates differ from those forecast, performance against budget will be correspondingly different. Significant variances will be identified in budget monitoring reports to the Senior Leadership Team and the District Executive.
7 Other Options Considered
7.1 The CIPFA Code does not prescribe any particular treasury management strategy for local authorities to adopt. The S151 Officer, having consulted the Portfolio Holder for Finance believes that the above strategy represents an appropriate balance between risk management and cost effectiveness. Some alternative strategies, with their financial and risk management implications, are listed below.
Alternative Impact on income and expenditure
Impact on risk management
Invest in a narrower range of counterparties and/or for shorter times
Interest income will be lower Lower chance of losses from credit related defaults, but any such losses may be greater
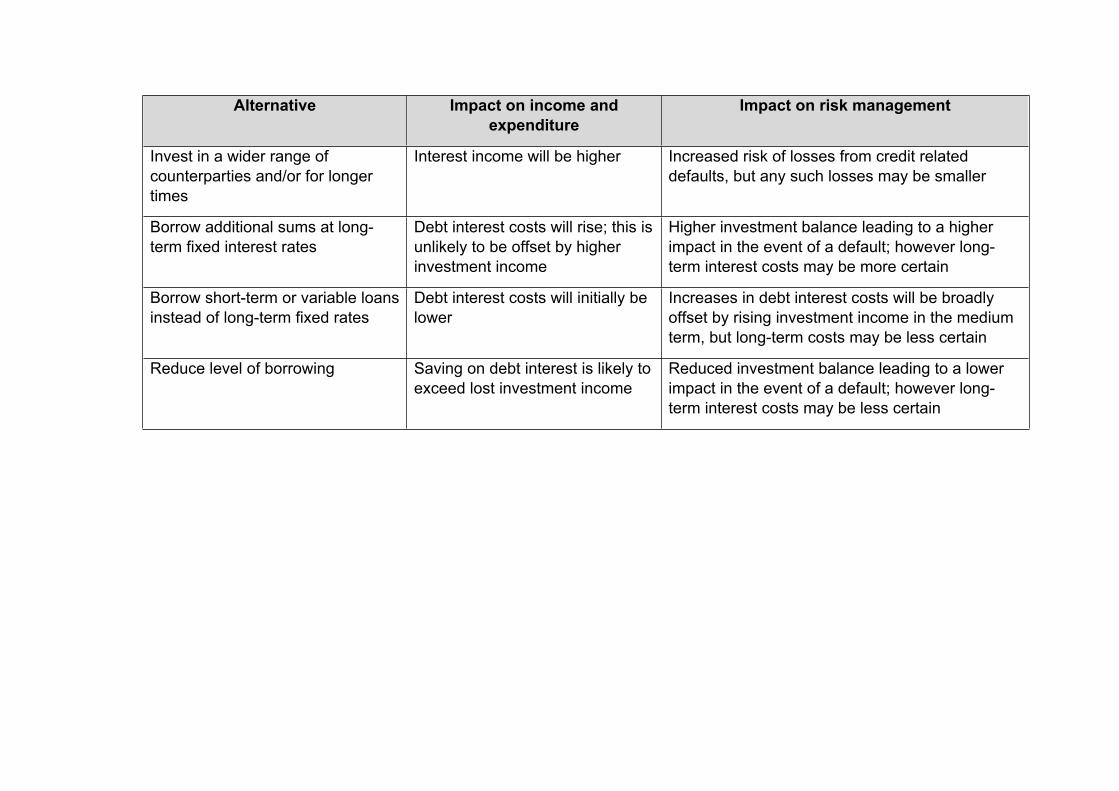
Alternative Impact on income and expenditure
Impact on risk management
Invest in a wider range of counterparties and/or for longer times
Interest income will be higher Increased risk of losses from credit related defaults, but any such losses may be smaller
Borrow additional sums at long-term fixed interest rates
Debt interest costs will rise; this is unlikely to be offset by higher investment income
Higher investment balance leading to a higher impact in the event of a default; however long-term interest costs may be more certain
Borrow short-term or variable loans instead of long-term fixed rates
Debt interest costs will initially be lower
Increases in debt interest costs will be broadly offset by rising investment income in the medium term, but long-term costs may be less certain
Reduce level of borrowing Saving on debt interest is likely to exceed lost investment income
Reduced investment balance leading to a lower impact in the event of a default; however long-term interest costs may be less certain
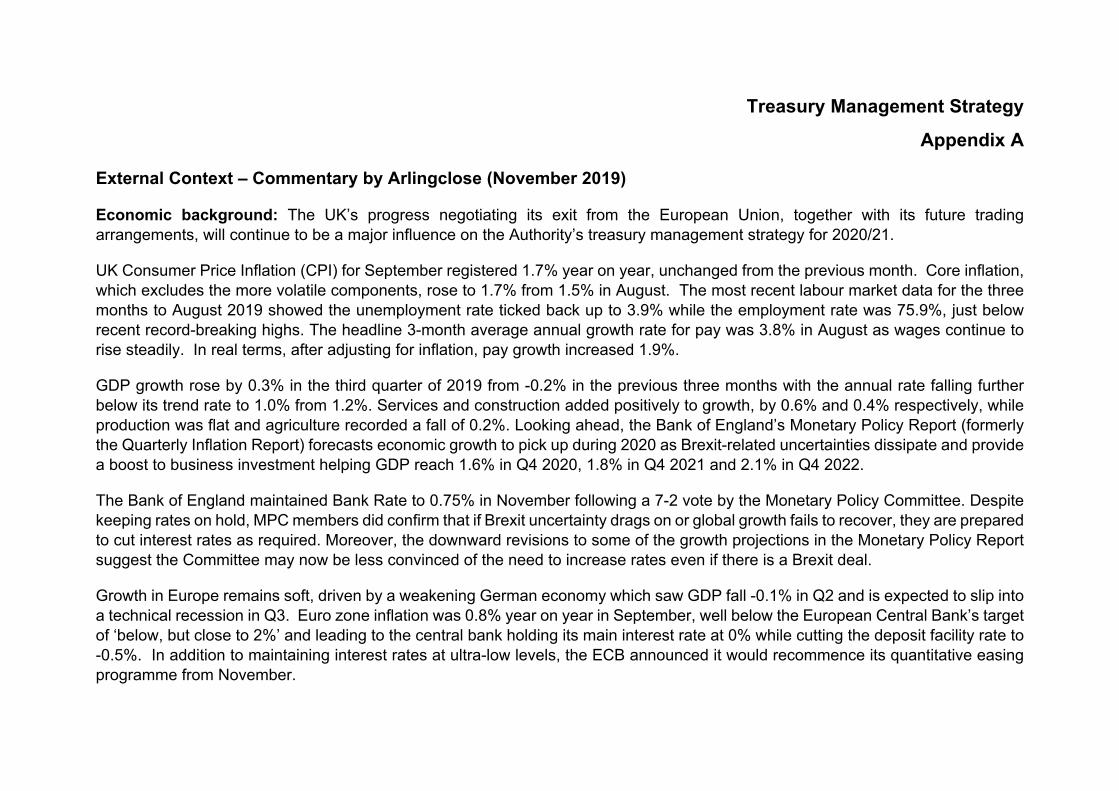
Treasury Management Strategy
Appendix A
External Context – Commentary by Arlingclose (November 2019)
Economic background: The UK’s progress negotiating its exit from the European Union, together with its future trading arrangements, will continue to be a major influence on the Authority’s treasury management strategy for 2020/21.
UK Consumer Price Inflation (CPI) for September registered 1.7% year on year, unchanged from the previous month. Core inflation, which excludes the more volatile components, rose to 1.7% from 1.5% in August. The most recent labour market data for the three months to August 2019 showed the unemployment rate ticked back up to 3.9% while the employment rate was 75.9%, just below recent record-breaking highs. The headline 3-month average annual growth rate for pay was 3.8% in August as wages continue to rise steadily. In real terms, after adjusting for inflation, pay growth increased 1.9%.
GDP growth rose by 0.3% in the third quarter of 2019 from -0.2% in the previous three months with the annual rate falling further below its trend rate to 1.0% from 1.2%. Services and construction added positively to growth, by 0.6% and 0.4% respectively, while production was flat and agriculture recorded a fall of 0.2%. Looking ahead, the Bank of England’s Monetary Policy Report (formerly the Quarterly Inflation Report) forecasts economic growth to pick up during 2020 as Brexit-related uncertainties dissipate and provide a boost to business investment helping GDP reach 1.6% in Q4 2020, 1.8% in Q4 2021 and 2.1% in Q4 2022.
The Bank of England maintained Bank Rate to 0.75% in November following a 7-2 vote by the Monetary Policy Committee. Despite keeping rates on hold, MPC members did confirm that if Brexit uncertainty drags on or global growth fails to recover, they are prepared to cut interest rates as required. Moreover, the downward revisions to some of the growth projections in the Monetary Policy Report suggest the Committee may now be less convinced of the need to increase rates even if there is a Brexit deal.
Growth in Europe remains soft, driven by a weakening German economy which saw GDP fall -0.1% in Q2 and is expected to slip into a technical recession in Q3. Euro zone inflation was 0.8% year on year in September, well below the European Central Bank’s target of ‘below, but close to 2%’ and leading to the central bank holding its main interest rate at 0% while cutting the deposit facility rate to -0.5%. In addition to maintaining interest rates at ultra-low levels, the ECB announced it would recommence its quantitative easing programme from November.
In the US, the Federal Reserve began easing monetary policy again in 2019 as a pre-emptive strike against slowing global and US economic growth on the back on of the ongoing trade war with China. At its last meeting the Fed cut rates to the range of 1.50-1.75% and financial markets expect further loosening of monetary policy in 2020. US GDP growth slowed to 1.9% annualised in Q3 from 2.0% in Q2.
Credit outlook: Credit conditions for larger UK banks have remained relatively benign over the past year. The UK’s departure from the European Union was delayed three times in 2019 and while there remains some concern over a global economic slowdown, this has yet to manifest in any credit issues for banks. Meanwhile, the post financial crisis banking reform is now largely complete, with the new ringfenced banks embedded in the market.
Challenger banks hit the news headlines in 2019 with Metro Bank and TSB Bank both suffering adverse publicity and falling customer numbers.
Looking forward, the potential for a “no-deal” Brexit and/or a global recession remain the major risks facing banks and building societies in 2020/21 and a cautious approach to bank deposits remains advisable.
Interest rate forecast: The Authority’s treasury management adviser Arlingclose is forecasting that Bank Rate will remain at 0.75% until the end of 2022. The risks to this forecast are deemed to be significantly weighted to the downside, particularly given the upcoming general election, the need for greater clarity on Brexit and the continuing global economic slowdown. The Bank of England, having previously indicated interest rates may need to rise if a Brexit agreement was reached, stated in its November Monetary Policy Report and its Bank Rate decision (7-2 vote to hold rates) that the MPC now believe this is less likely even in the event of a deal.
Gilt yields have risen but remain at low levels and only some very modest upward movement from current levels are expected based on Arlingclose’s interest rate projections. The central case is for 10-year and 20-year gilt yields to rise to around 1.00% and 1.40% respectively over the time horizon, with broadly balanced risks to both the upside and downside. However, short-term volatility arising from both economic and political events over the period is a near certainty.
Arlingclose Economic & Interest Rate Forecast November 2019
Underlying assumptions:
The global economy is entering a period of slower growth in response to political issues, primarily the trade policy stance of the US. The UK economy has displayed a marked slowdown in growth due to both Brexit uncertainty and the downturn in global activity. In response, global and UK interest rate expectations have eased.
Some positivity on the trade negotiations between China and the US has prompted worst case economic scenarios to be pared back. However, information is limited, and upbeat expectations have been wrong before.
Brexit has been delayed until 31 January 2020. While the General Election has maintained economic and political uncertainty, the opinion polls suggest the Conservative position in parliament may be strengthened, which reduces the chance of Brexit being further frustrated. A key concern is the limited transitionary period following a January 2020 exit date, which will maintain and create additional uncertainty over the next few years.
UK economic growth has stalled despite Q3 2019 GDP of 0.3%. Monthly figures indicate growth waned as the quarter progressed and survey data suggest falling household and business confidence. Both main political parties have promised substantial fiscal easing, which should help support growth.
While the potential for divergent paths for UK monetary policy remain in the event of the General Election result, the weaker external environment severely limits potential upside movement in Bank Rate, while the slowing UK economy will place pressure on the MPC to loosen monetary policy. Indeed, two MPC members voted for an immediate cut in November 2019.
Inflation is running below target at 1.7%. While the tight labour market risks medium-term domestically-driven inflationary pressure, slower global growth should reduce the prospect of externally driven pressure, although political turmoil could push up oil prices.
Central bank actions and geopolitical risks will continue to produce significant volatility in financial markets, including bond markets.

Forecast:
Although we have maintained our Bank Rate forecast at 0.75% for the foreseeable future, there are substantial risks to this forecast, dependant on General Election outcomes and the evolution of the global economy.
Arlingclose judges that the risks are weighted to the downside.
Gilt yields have risen but remain low due to the soft UK and global economic outlooks. US monetary policy and UK government spending will be key influences alongside UK monetary policy.
We expect gilt yields to remain at relatively low levels for the foreseeable future and judge the risks to be broadly balanced.
A summary of the forecast rates is included on the next page. Note:
PWLB Certainty Rate (Maturity Loans) = Gilt yield + 1.80%
PWLB Local Infrastructure Rate (Maturity Loans) = Gilt yield + 0.60%
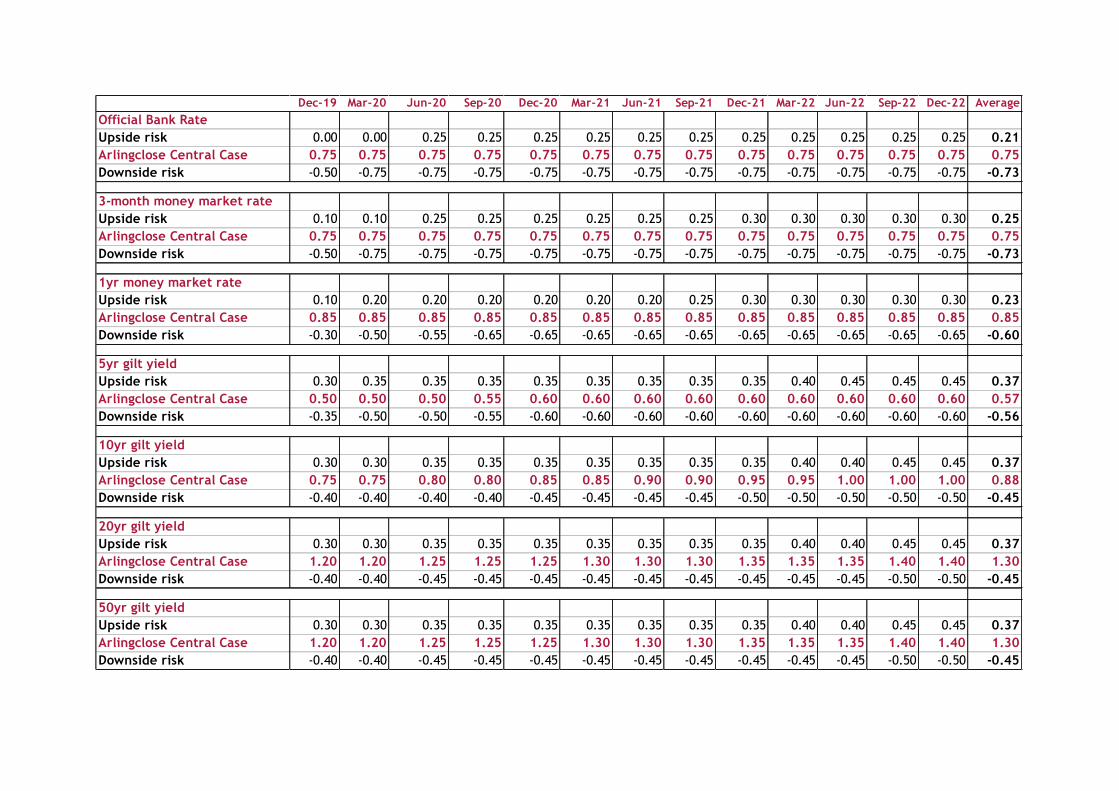
Dec-19 Mar-20 Jun-20 Sep-20 Dec-20 Mar-21 Jun-21 Sep-21 Dec-21 Mar-22 Jun-22 Sep-22 Dec-22 AverageOfficial Bank RateUpside risk 0.00 0.00 0.25 0.25 0.25 0.25 0.25 0.25 0.25 0.25 0.25 0.25 0.25 0.21Arlingclose Central Case 0.75 0.75 0.75 0.75 0.75 0.75 0.75 0.75 0.75 0.75 0.75 0.75 0.75 0.75Downside risk -0.50 -0.75 -0.75 -0.75 -0.75 -0.75 -0.75 -0.75 -0.75 -0.75 -0.75 -0.75 -0.75 -0.73
3-month money market rateUpside risk 0.10 0.10 0.25 0.25 0.25 0.25 0.25 0.25 0.30 0.30 0.30 0.30 0.30 0.25Arlingclose Central Case 0.75 0.75 0.75 0.75 0.75 0.75 0.75 0.75 0.75 0.75 0.75 0.75 0.75 0.75Downside risk -0.50 -0.75 -0.75 -0.75 -0.75 -0.75 -0.75 -0.75 -0.75 -0.75 -0.75 -0.75 -0.75 -0.73
1yr money market rateUpside risk 0.10 0.20 0.20 0.20 0.20 0.20 0.20 0.25 0.30 0.30 0.30 0.30 0.30 0.23Arlingclose Central Case 0.85 0.85 0.85 0.85 0.85 0.85 0.85 0.85 0.85 0.85 0.85 0.85 0.85 0.85Downside risk -0.30 -0.50 -0.55 -0.65 -0.65 -0.65 -0.65 -0.65 -0.65 -0.65 -0.65 -0.65 -0.65 -0.60
5yr gilt yieldUpside risk 0.30 0.35 0.35 0.35 0.35 0.35 0.35 0.35 0.35 0.40 0.45 0.45 0.45 0.37Arlingclose Central Case 0.50 0.50 0.50 0.55 0.60 0.60 0.60 0.60 0.60 0.60 0.60 0.60 0.60 0.57Downside risk -0.35 -0.50 -0.50 -0.55 -0.60 -0.60 -0.60 -0.60 -0.60 -0.60 -0.60 -0.60 -0.60 -0.56
10yr gilt yieldUpside risk 0.30 0.30 0.35 0.35 0.35 0.35 0.35 0.35 0.35 0.40 0.40 0.45 0.45 0.37Arlingclose Central Case 0.75 0.75 0.80 0.80 0.85 0.85 0.90 0.90 0.95 0.95 1.00 1.00 1.00 0.88Downside risk -0.40 -0.40 -0.40 -0.40 -0.45 -0.45 -0.45 -0.45 -0.50 -0.50 -0.50 -0.50 -0.50 -0.45
20yr gilt yieldUpside risk 0.30 0.30 0.35 0.35 0.35 0.35 0.35 0.35 0.35 0.40 0.40 0.45 0.45 0.37Arlingclose Central Case 1.20 1.20 1.25 1.25 1.25 1.30 1.30 1.30 1.35 1.35 1.35 1.40 1.40 1.30Downside risk -0.40 -0.40 -0.45 -0.45 -0.45 -0.45 -0.45 -0.45 -0.45 -0.45 -0.45 -0.50 -0.50 -0.45
50yr gilt yieldUpside risk 0.30 0.30 0.35 0.35 0.35 0.35 0.35 0.35 0.35 0.40 0.40 0.45 0.45 0.37Arlingclose Central Case 1.20 1.20 1.25 1.25 1.25 1.30 1.30 1.30 1.35 1.35 1.35 1.40 1.40 1.30Downside risk -0.40 -0.40 -0.45 -0.45 -0.45 -0.45 -0.45 -0.45 -0.45 -0.45 -0.45 -0.50 -0.50 -0.45
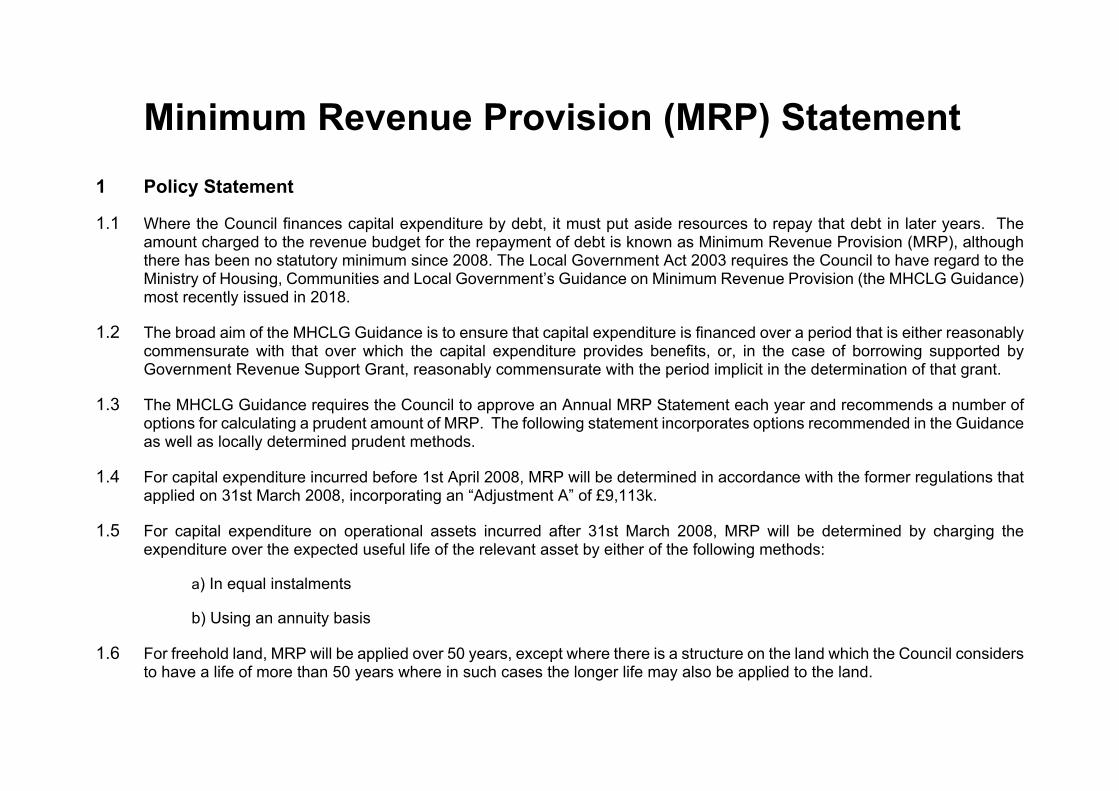
Minimum Revenue Provision (MRP) Statement1 Policy Statement
1.1 Where the Council finances capital expenditure by debt, it must put aside resources to repay that debt in later years. The amount charged to the revenue budget for the repayment of debt is known as Minimum Revenue Provision (MRP), although there has been no statutory minimum since 2008. The Local Government Act 2003 requires the Council to have regard to the Ministry of Housing, Communities and Local Government’s Guidance on Minimum Revenue Provision (the MHCLG Guidance) most recently issued in 2018.
1.2 The broad aim of the MHCLG Guidance is to ensure that capital expenditure is financed over a period that is either reasonably commensurate with that over which the capital expenditure provides benefits, or, in the case of borrowing supported by Government Revenue Support Grant, reasonably commensurate with the period implicit in the determination of that grant.
1.3 The MHCLG Guidance requires the Council to approve an Annual MRP Statement each year and recommends a number of options for calculating a prudent amount of MRP. The following statement incorporates options recommended in the Guidance as well as locally determined prudent methods.
1.4 For capital expenditure incurred before 1st April 2008, MRP will be determined in accordance with the former regulations that applied on 31st March 2008, incorporating an “Adjustment A” of £9,113k.
1.5 For capital expenditure on operational assets incurred after 31st March 2008, MRP will be determined by charging the expenditure over the expected useful life of the relevant asset by either of the following methods:
a) In equal instalments
b) Using an annuity basis
1.6 For freehold land, MRP will be applied over 50 years, except where there is a structure on the land which the Council considers to have a life of more than 50 years where in such cases the longer life may also be applied to the land.

1.7 For capital expenditure not related to council assets but which has been capitalised by regulation or direction (e.g. capital grants to third parties) will be charged in equal instalments over a period of up to 25 years.
1.8 For assets acquired by leases, MRP will be determined as being equal to the element of the rent or charge that goes to write down the balance sheet liability.
1.9 For capital expenditure loans to third parties that are repaid in annual or more frequent instalments of principal, the Council will make nil MRP, but will instead apply the capital receipts arising from principal repayments to reduce the capital financing requirement instead. In years where there is no principal repayment, MRP will be charged in accordance with the MRP policy for the assets funded by the loan, including where appropriate, delaying MRP until the year after the assets become operational. While this is not one of the options in the MHCLG Guidance, it is thought to be a prudent approach since it ensures that the capital expenditure incurred in the loan is fully funded over the life of the assets.
1.10 For investment properties, MRP will be calculated over a period of no more than 50 years, and MRP may be calculated by either of the following methods:
a) In equal instalments
b) Using an annuity basis
c) Weighted to reflect projected net income cash flows over the expected life of investment (up to 50 years)
1.11 MRP will be charged from the start of the financial year after the expenditure is incurred, meaning capital expenditure incurred during 2020/21 will not be subject to a MRP charge until 2021/22.

2 Capital Financing Requirement and MRP Estimates
2.1 Based on the Council’s latest estimate of its capital financing requirement (CFR) on 31 March 2020, the budget estimate for MRP has been set as follows:
Capital Financing Requirement and MRP 31/03/2020Estimated CFR
£k
2020/21Estimated MRP
£kCapital Expenditure before 1 April 2008 9,113 0Unsupported Capital Expenditure since 31 March 2008 84,731 747Voluntary overpayment or use of prior year overpayments 0 0Total 93,844 747
3 MRP Overpayments
3.1 Overpayments: In earlier years, the Council has made no voluntary overpayments of MRP that are available to reduce the revenue charges in later years. It is not planned to make an overpayment in 2020/21, however the S151 Officer may determine such an overpayment during the year and report this through the Outturn Report.
MRP Overpayments £kActual balance 1 April 2019 0Approved overpayment 2019/20 0Expected balance 31 March 2020 0Planned overpayment 2020/21 0Forecast Overpayments Balance 31 March 2021 0