structure of the tsushima warm current in the north ... · structure of the tsushima warm current...
TRANSCRIPT

527
Journal of Oceanography, Vol. 62, pp. 527 to 538, 2006
Keywords:⋅⋅⋅⋅⋅ Tsushima WarmCurrent,
⋅⋅⋅⋅⋅ Japan Sea,⋅⋅⋅⋅⋅ ADCP.
* Corresponding author. E-mail: [email protected]
Copyright©The Oceanographic Society of Japan/TERRAPUB/Springer
Structure of the Tsushima Warm Current in the North-eastern Japan Sea
TATSURO WATANABE*, OSAMU KATOH and HARUYA YAMADA
Japan Sea National Fisheries Research Institute, Fisheries Research Agency,Suido-cho, Niigata 951-8121, Japan
(Received 6 June 2005; in revised form 10 April 2006; accepted 10 April 2006)
By using Acoustic Doppler Current Profiler (ADCP) measurements with the fourround-trips method to remove diurnal/semidiurnal tidal currents, the detailed cur-rent structure and volume transport of the Tsushima Warm Current (TWC) alongthe northwestern Japanese coast in the northeastern Japan Sea were examined in theperiod September–October 2000. The volume transport of the First Branch of theTWC (FBTWC) east of the Noto Peninsula was estimated as approximately 1.0 Sv(106 m3/s), and the FBTWC continued to flow along the Honshu Island to the south ofthe Oga Peninsula. To the north of the Oga Peninsula, the Second Branch of TsushimaWarm Current and the eastward current established by the subarctic front were re-combined with the FBTWC and the total volume transport increased to 1.9 Sv. Thewater properties at each ADCP line strongly suggested that most of the upper portionof the TWC with high temperature and low salinity flowed out to the North Pacific asthe Tsugaru Warm Current. In the north of the Tsugaru Strait, the volume transportof the northward current was observed to be as almost 1 Sv. However, the componentof the TWC water was small (approximately 0.3 Sv).
and the mainstream of the SBTWC existed along the con-tinental shelf break from spring to fall. However, east ofthe Noto Peninsula (at approximately 137°E), because thecontinental shelf becomes quite narrow, the paths of thesetwo branches, especially the SBTWC, are highly com-plex and variable (Nakada and Isoda, 2000; Nakada etal., 2002). On the other hand, after leaving the Koreancoast at about 38°N, the TBTWC merges into the subarcticfront, and then a strong eastward current reaching aroundthe northwestern Japanese coast is formed along approxi-mately 40°N. This current contains both the TWC waterand the subarctic water. Here we name it the EastwardCurrent established by the Subarctic Front (hereafterECSF). As a result, these three branches of the TWC arerecombined in the northeastern Japan Sea (e.g. Suda etal., 1932; Uda, 1934). This has not yet been fully clari-fied, however. After the recombination, more than half ofthe TWC flow out to the North Pacific through the TsugaruStrait as the Tsugaru Warm Current (hereafter TGWC),and the residual northward current, which is the origin ofthe Soya Warm Current, exists along the west coast ofHokkaido (Onishi and Ohtani, 1997; Nakata and Tanaka,2002; Ito et al., 2003). The current structure and the wa-ter mass structure of these currents have not yet been fullyclarified, however.
1. IntroductionThe Tsushima Warm Current (hereafter TWC) is ba-
sically driven by the sea level difference between the EastChina Sea and the Japan Sea (Toba et al., 1982; Ohshima,1994). The TWC carries both the subtropical water origi-nating from the North Pacific and the runoff water fromthe continental self in the East China Sea to the JapanSea through the Tsushima Straits (e.g. Isobe et al., 2002).After passing through the straits, the flow pattern of theTWC is very complicated and it has large variability (e.g.Suda et al., 1932; Uda, 1934; Naganuma, 1977; Kawabe,1982; Katoh, 1994; Lee et al., 2000). According toNaganuma (1977), three branches of the TWC can be seenfrequently: the First Branch of TWC (hereafter FBTWC)existing along Honshu Island; the Second Branch of theTWC (hereafter SBTWC) existing in the offshore areawith large meanders; and the Third Branch of the TWC(hereafter TBTWC), which flows northward along theeastern Korean coast, which is also called the East Ko-rean Warm Current. Hase et al. (1999) examined the dis-tribution of the temperature fronts and suggested that theFBTWC flowed along the isobath shallower than 200 m
528 T. Watanabe et al.
In this study, using shipboard Acoustic Doppler Cur-rent Profiler (ADCP) measurements with the four round-trips method to remove tidal currents, the current struc-tures of the TWC and its branches in the northeastern Ja-pan Sea are examined. The observations and data process-ing are explained in Section 2. The current structure andvolume transport across the ADCP lines are examined inSubsections 3.1 and 3.2. In Subsection 3.3, the TWC wateris divided into two portions, based on the water proper-ties. Finally, the circulations and the water mass balancesof the TWC waters along the Japanese coast are discussedin Section 4.
2. Observations and Data ProcessingThe data used in this paper were collected from Sep-
tember 16 to October 8 in 2000 by R/V Torishima (Tankai
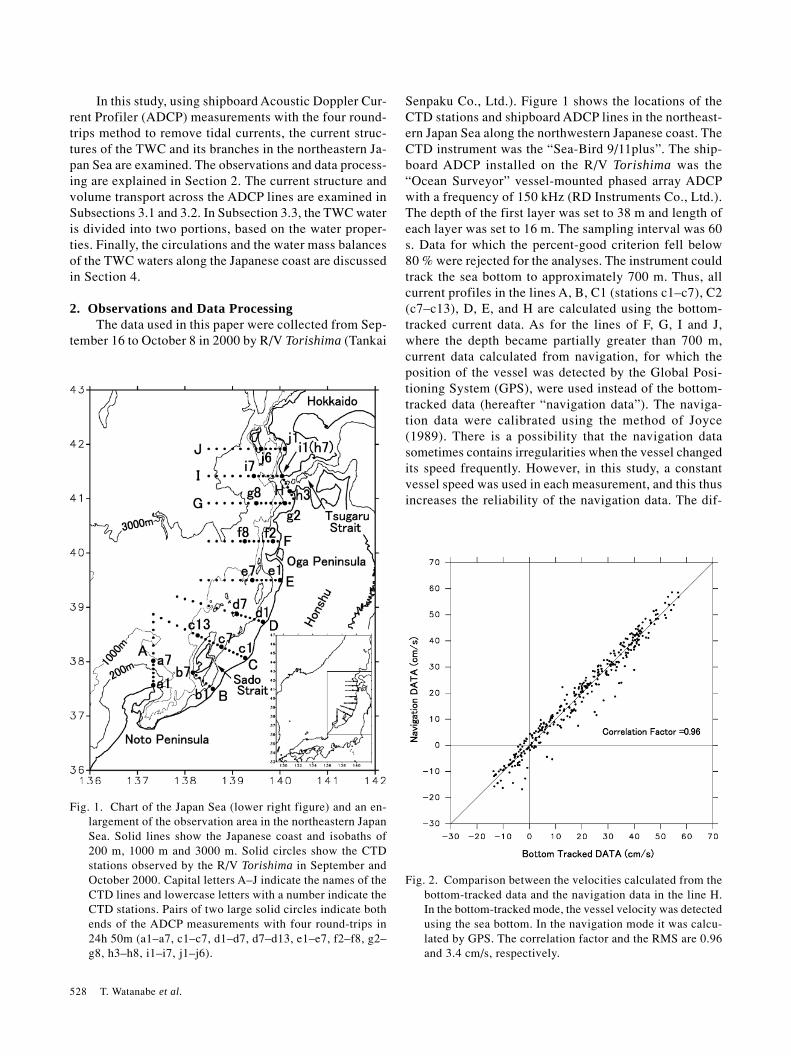
Fig. 1. Chart of the Japan Sea (lower right figure) and an en-largement of the observation area in the northeastern JapanSea. Solid lines show the Japanese coast and isobaths of200 m, 1000 m and 3000 m. Solid circles show the CTDstations observed by the R/V Torishima in September andOctober 2000. Capital letters A–J indicate the names of theCTD lines and lowercase letters with a number indicate theCTD stations. Pairs of two large solid circles indicate bothends of the ADCP measurements with four round-trips in24h 50m (a1–a7, c1–c7, d1–d7, d7–d13, e1–e7, f2–f8, g2–g8, h3–h8, i1–i7, j1–j6).
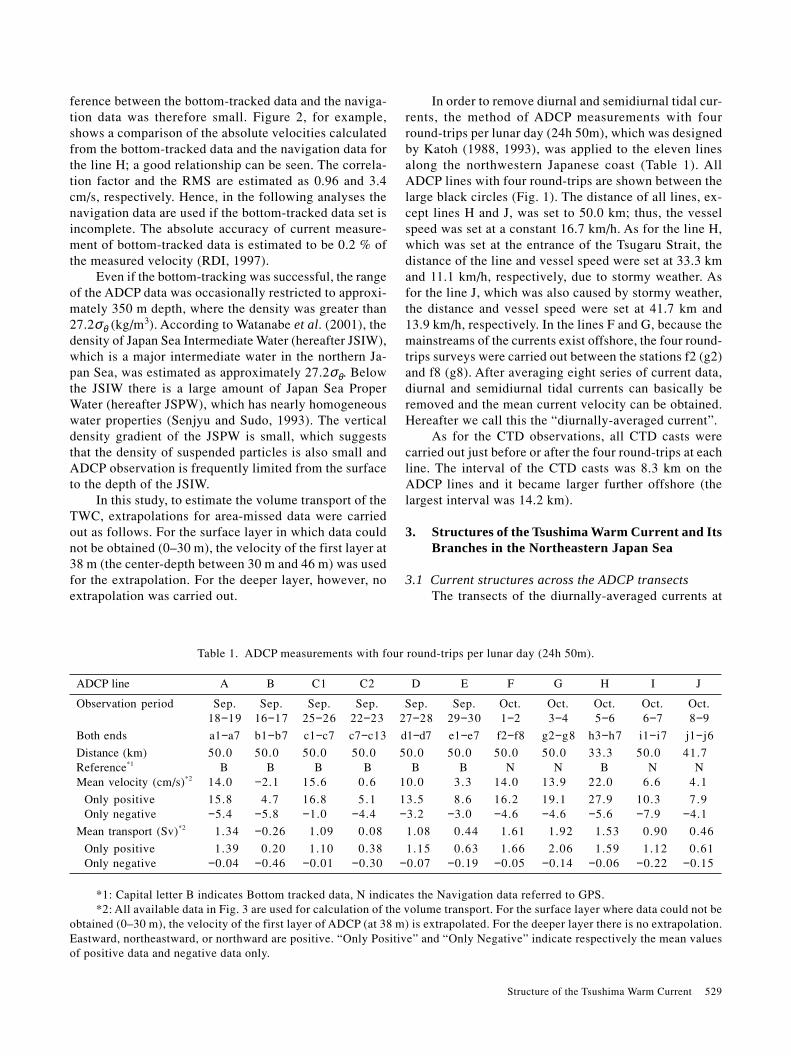
Fig. 2. Comparison between the velocities calculated from thebottom-tracked data and the navigation data in the line H.In the bottom-tracked mode, the vessel velocity was detectedusing the sea bottom. In the navigation mode it was calcu-lated by GPS. The correlation factor and the RMS are 0.96and 3.4 cm/s, respectively.
Senpaku Co., Ltd.). Figure 1 shows the locations of theCTD stations and shipboard ADCP lines in the northeast-ern Japan Sea along the northwestern Japanese coast. TheCTD instrument was the “Sea-Bird 9/11plus”. The ship-board ADCP installed on the R/V Torishima was the“Ocean Surveyor” vessel-mounted phased array ADCPwith a frequency of 150 kHz (RD Instruments Co., Ltd.).The depth of the first layer was set to 38 m and length ofeach layer was set to 16 m. The sampling interval was 60s. Data for which the percent-good criterion fell below80 % were rejected for the analyses. The instrument couldtrack the sea bottom to approximately 700 m. Thus, allcurrent profiles in the lines A, B, C1 (stations c1–c7), C2(c7–c13), D, E, and H are calculated using the bottom-tracked current data. As for the lines of F, G, I and J,where the depth became partially greater than 700 m,current data calculated from navigation, for which theposition of the vessel was detected by the Global Posi-tioning System (GPS), were used instead of the bottom-tracked data (hereafter “navigation data”). The naviga-tion data were calibrated using the method of Joyce(1989). There is a possibility that the navigation datasometimes contains irregularities when the vessel changedits speed frequently. However, in this study, a constantvessel speed was used in each measurement, and this thusincreases the reliability of the navigation data. The dif-
Structure of the Tsushima Warm Current 529
In order to remove diurnal and semidiurnal tidal cur-rents, the method of ADCP measurements with fourround-trips per lunar day (24h 50m), which was designedby Katoh (1988, 1993), was applied to the eleven linesalong the northwestern Japanese coast (Table 1). AllADCP lines with four round-trips are shown between thelarge black circles (Fig. 1). The distance of all lines, ex-cept lines H and J, was set to 50.0 km; thus, the vesselspeed was set at a constant 16.7 km/h. As for the line H,which was set at the entrance of the Tsugaru Strait, thedistance of the line and vessel speed were set at 33.3 kmand 11.1 km/h, respectively, due to stormy weather. Asfor the line J, which was also caused by stormy weather,the distance and vessel speed were set at 41.7 km and13.9 km/h, respectively. In the lines F and G, because themainstreams of the currents exist offshore, the four round-trips surveys were carried out between the stations f2 (g2)and f8 (g8). After averaging eight series of current data,diurnal and semidiurnal tidal currents can basically beremoved and the mean current velocity can be obtained.Hereafter we call this the “diurnally-averaged current”.
As for the CTD observations, all CTD casts werecarried out just before or after the four round-trips at eachline. The interval of the CTD casts was 8.3 km on theADCP lines and it became larger further offshore (thelargest interval was 14.2 km).
3. Structures of the Tsushima Warm Current and ItsBranches in the Northeastern Japan Sea
3.1 Current structures across the ADCP transectsThe transects of the diurnally-averaged currents at
ADCP line A B C1 C2 D E F G H I J
Observation period Sep. Sep. Sep. Sep. Sep. Sep. Oct. Oct. Oct. Oct. Oct.18−19 16−17 25−26 22−23 27−28 29−30 1−2 3−4 5−6 6−7 8−9
Both ends a1−a7 b1−b7 c1−c7 c7−c13 d1−d7 e1−e7 f2−f8 g2−g8 h3−h7 i1−i7 j1−j6
Distance (km) 50.0 50.0 50.0 50.0 50.0 50.0 50.0 50.0 33.3 50.0 41.7Reference*1 B B B B B B N N B N NMean velocity (cm/s)*2 14.0 −2.1 15.6 0.6 10.0 3.3 14.0 13.9 22.0 6.6 4.1
Only positive 15.8 4.7 16.8 5.1 13.5 8.6 16.2 19.1 27.9 10.3 7.9Only negative −5.4 −5.8 −1.0 −4.4 −3.2 −3.0 −4.6 −4.6 −5.6 −7.9 −4.1
Mean transport (Sv)*2 1.34 −0.26 1.09 0.08 1.08 0.44 1.61 1.92 1.53 0.90 0.46
Only positive 1.39 0.20 1.10 0.38 1.15 0.63 1.66 2.06 1.59 1.12 0.61Only negative −0.04 −0.46 −0.01 −0.30 −0.07 −0.19 −0.05 −0.14 −0.06 −0.22 −0.15
Table 1. ADCP measurements with four round-trips per lunar day (24h 50m).
*1: Capital letter B indicates Bottom tracked data, N indicates the Navigation data referred to GPS.*2: All available data in Fig. 3 are used for calculation of the volume transport. For the surface layer where data could not be
obtained (0–30 m), the velocity of the first layer of ADCP (at 38 m) is extrapolated. For the deeper layer there is no extrapolation.Eastward, northeastward, or northward are positive. “Only Positive” and “Only Negative” indicate respectively the mean valuesof positive data and negative data only.
ference between the bottom-tracked data and the naviga-tion data was therefore small. Figure 2, for example,shows a comparison of the absolute velocities calculatedfrom the bottom-tracked data and the navigation data forthe line H; a good relationship can be seen. The correla-tion factor and the RMS are estimated as 0.96 and 3.4cm/s, respectively. Hence, in the following analyses thenavigation data are used if the bottom-tracked data set isincomplete. The absolute accuracy of current measure-ment of bottom-tracked data is estimated to be 0.2 % ofthe measured velocity (RDI, 1997).
Even if the bottom-tracking was successful, the rangeof the ADCP data was occasionally restricted to approxi-mately 350 m depth, where the density was greater than27.2σθ (kg/m3). According to Watanabe et al. (2001), thedensity of Japan Sea Intermediate Water (hereafter JSIW),which is a major intermediate water in the northern Ja-pan Sea, was estimated as approximately 27.2σθ. Belowthe JSIW there is a large amount of Japan Sea ProperWater (hereafter JSPW), which has nearly homogeneouswater properties (Senjyu and Sudo, 1993). The verticaldensity gradient of the JSPW is small, which suggeststhat the density of suspended particles is also small andADCP observation is frequently limited from the surfaceto the depth of the JSIW.
In this study, to estimate the volume transport of theTWC, extrapolations for area-missed data were carriedout as follows. For the surface layer in which data couldnot be obtained (0–30 m), the velocity of the first layer at38 m (the center-depth between 30 m and 46 m) was usedfor the extrapolation. For the deeper layer, however, noextrapolation was carried out.
530 T. Watanabe et al.
Structure of the Tsushima Warm Current 531
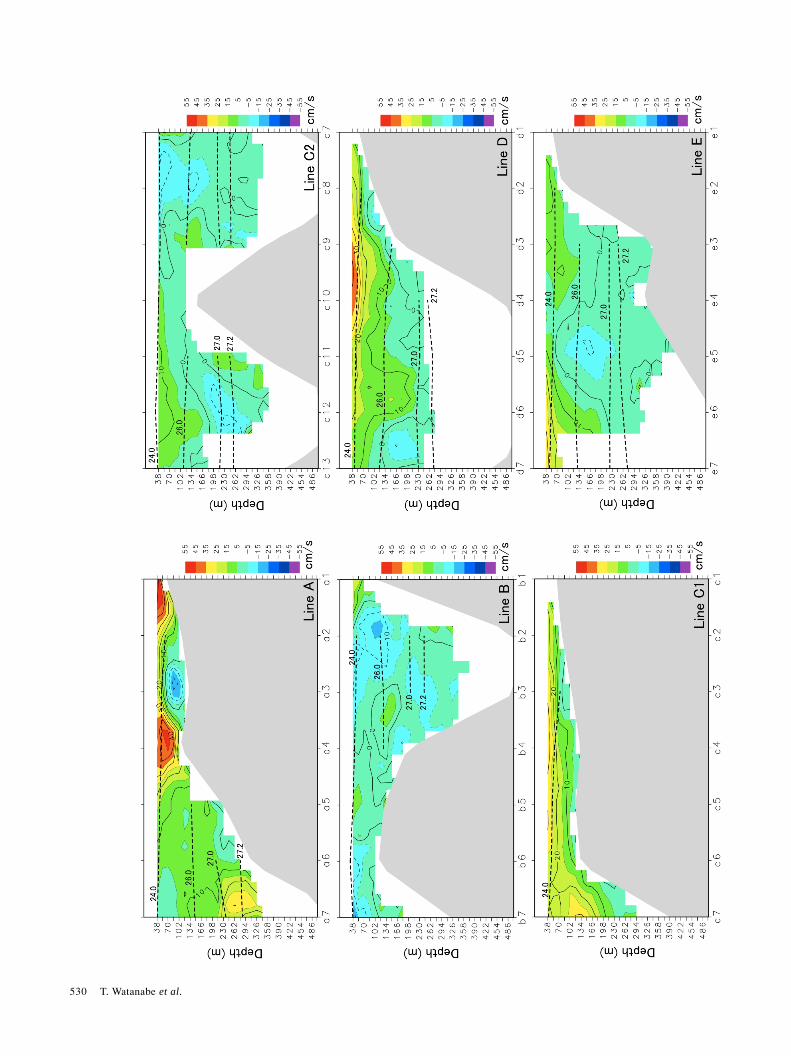
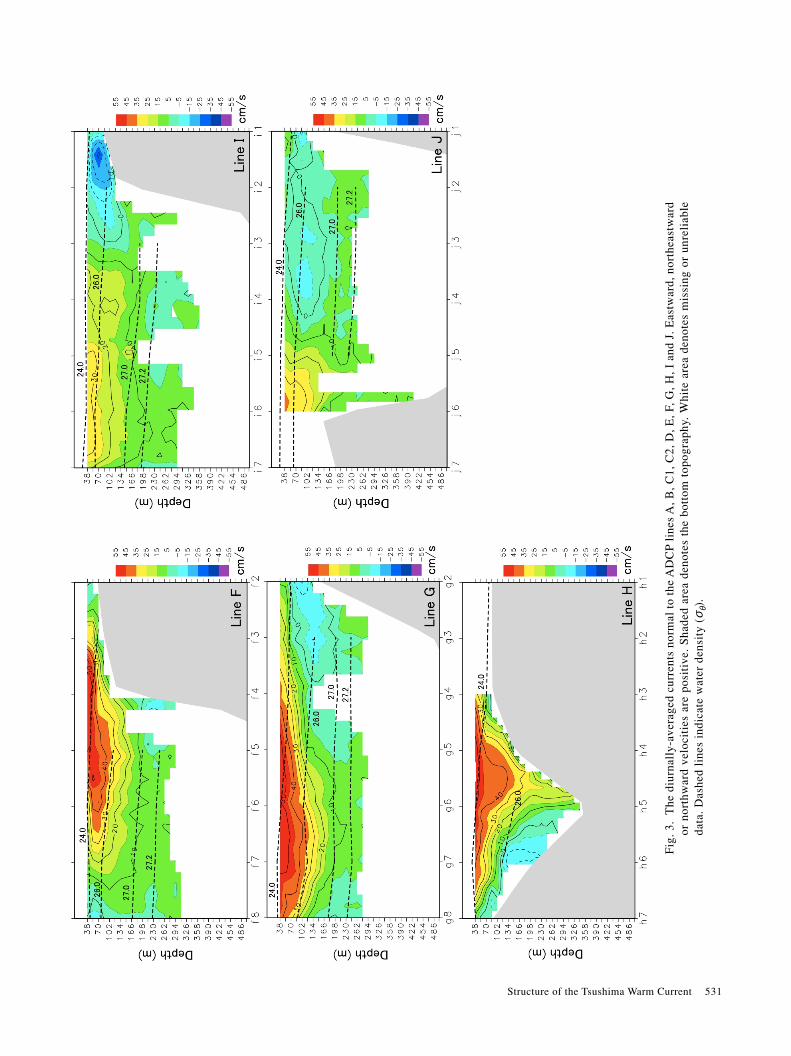
Fig
. 3.
The
diu
rna l
ly-a
vera
ged
c urr
e nts
nor
ma l
to
the
AD
CP
line
s A
, B, C
1, C
2, D
, E, F
, G, H
, I a
nd J
. Ea s
twa r
d, n
orth
e ast
wa r
dor
nor
t hw
ard
vel o
cit i
es a
re p
osi t
i ve.
Sha
ded
area
den
otes
the
bot
t om
top
ogra
phy.
Whi
t e a
rea
deno
t es
mi s
sing
or
unre
l iab
l eda
t a. D
ashe
d l i
nes
i ndi
cat e
wat
er d
ensi
t y (
σ θ).
532 T. Watanabe et al.
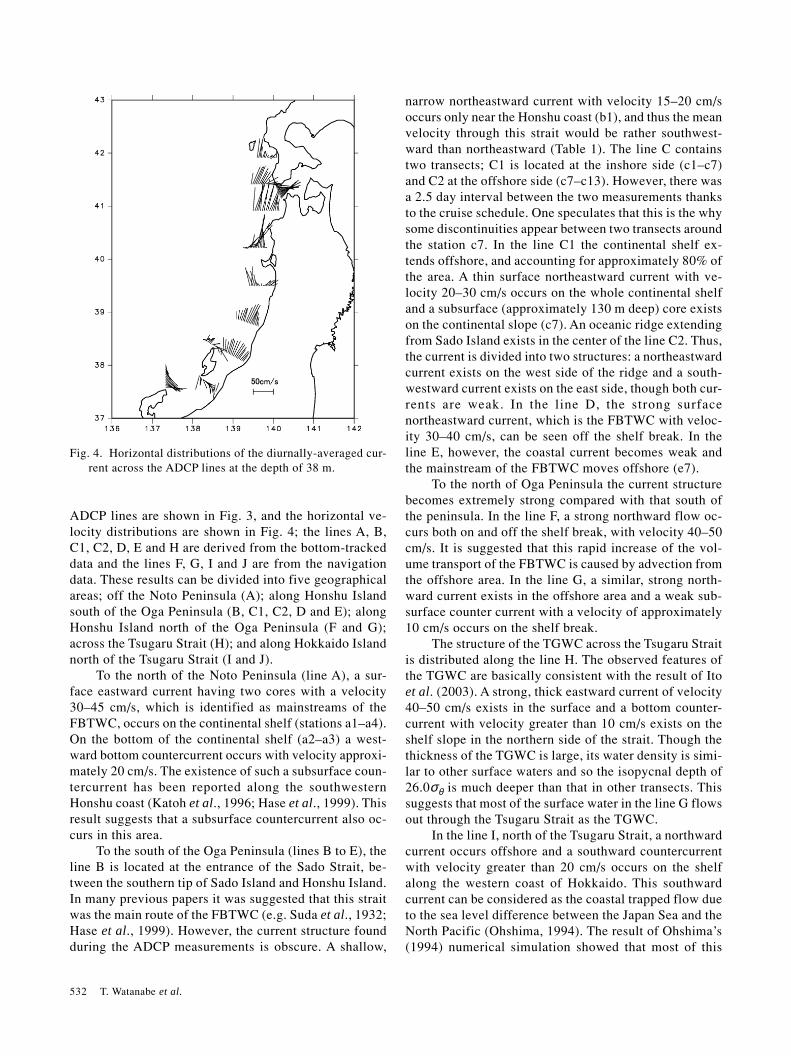
ADCP lines are shown in Fig. 3, and the horizontal ve-locity distributions are shown in Fig. 4; the lines A, B,C1, C2, D, E and H are derived from the bottom-trackeddata and the lines F, G, I and J are from the navigationdata. These results can be divided into five geographicalareas; off the Noto Peninsula (A); along Honshu Islandsouth of the Oga Peninsula (B, C1, C2, D and E); alongHonshu Island north of the Oga Peninsula (F and G);across the Tsugaru Strait (H); and along Hokkaido Islandnorth of the Tsugaru Strait (I and J).
To the north of the Noto Peninsula (line A), a sur-face eastward current having two cores with a velocity30–45 cm/s, which is identified as mainstreams of theFBTWC, occurs on the continental shelf (stations a1–a4).On the bottom of the continental shelf (a2–a3) a west-ward bottom countercurrent occurs with velocity approxi-mately 20 cm/s. The existence of such a subsurface coun-tercurrent has been reported along the southwesternHonshu coast (Katoh et al., 1996; Hase et al., 1999). Thisresult suggests that a subsurface countercurrent also oc-curs in this area.
To the south of the Oga Peninsula (lines B to E), theline B is located at the entrance of the Sado Strait, be-tween the southern tip of Sado Island and Honshu Island.In many previous papers it was suggested that this straitwas the main route of the FBTWC (e.g. Suda et al., 1932;Hase et al., 1999). However, the current structure foundduring the ADCP measurements is obscure. A shallow,
narrow northeastward current with velocity 15–20 cm/soccurs only near the Honshu coast (b1), and thus the meanvelocity through this strait would be rather southwest-ward than northeastward (Table 1). The line C containstwo transects; C1 is located at the inshore side (c1–c7)and C2 at the offshore side (c7–c13). However, there wasa 2.5 day interval between the two measurements thanksto the cruise schedule. One speculates that this is the whysome discontinuities appear between two transects aroundthe station c7. In the line C1 the continental shelf ex-tends offshore, and accounting for approximately 80% ofthe area. A thin surface northeastward current with ve-locity 20–30 cm/s occurs on the whole continental shelfand a subsurface (approximately 130 m deep) core existson the continental slope (c7). An oceanic ridge extendingfrom Sado Island exists in the center of the line C2. Thus,the current is divided into two structures: a northeastwardcurrent exists on the west side of the ridge and a south-westward current exists on the east side, though both cur-rents are weak. In the line D, the strong surfacenortheastward current, which is the FBTWC with veloc-ity 30–40 cm/s, can be seen off the shelf break. In theline E, however, the coastal current becomes weak andthe mainstream of the FBTWC moves offshore (e7).
To the north of Oga Peninsula the current structurebecomes extremely strong compared with that south ofthe peninsula. In the line F, a strong northward flow oc-curs both on and off the shelf break, with velocity 40–50cm/s. It is suggested that this rapid increase of the vol-ume transport of the FBTWC is caused by advection fromthe offshore area. In the line G, a similar, strong north-ward current exists in the offshore area and a weak sub-surface counter current with a velocity of approximately10 cm/s occurs on the shelf break.
The structure of the TGWC across the Tsugaru Straitis distributed along the line H. The observed features ofthe TGWC are basically consistent with the result of Itoet al. (2003). A strong, thick eastward current of velocity40–50 cm/s exists in the surface and a bottom counter-current with velocity greater than 10 cm/s exists on theshelf slope in the northern side of the strait. Though thethickness of the TGWC is large, its water density is simi-lar to other surface waters and so the isopycnal depth of26.0σθ is much deeper than that in other transects. Thissuggests that most of the surface water in the line G flowsout through the Tsugaru Strait as the TGWC.
In the line I, north of the Tsugaru Strait, a northwardcurrent occurs offshore and a southward countercurrentwith velocity greater than 20 cm/s occurs on the shelfalong the western coast of Hokkaido. This southwardcurrent can be considered as the coastal trapped flow dueto the sea level difference between the Japan Sea and theNorth Pacific (Ohshima, 1994). The result of Ohshima’s(1994) numerical simulation showed that most of this
Fig. 4. Horizontal distributions of the diurnally-averaged cur-rent across the ADCP lines at the depth of 38 m.
Structure of the Tsushima Warm Current 533
southward current flowed out through the Tsugaru Strait.This southward coastal current can also be seen in theline J. However, it becomes wider and weaker comparedwith that in the line I. The northward current continuesfrom the line I, but the mainstream moves to the west(j5–j6). However, because the ADCP measurement wasdone between stations j1 and j6, the northward currentcannot be fully observed.
3.2 Volume transport across the ADCP transectsThe volume transport across each ADCP transect is
listed in Table 1. The volume transport off the Noto Pe-ninsula (line A) is estimated as approximately 1.3 Sv (106
m3/s, eastward is positive). It is well known that theFBTWC has its origin in the east channel of the TsushimaStraits and it flows along the Honshu coast (e.g. Suda etal., 1932; Naganuma, 1977; Katoh, 1993; Hase et al.,1999). Recently, the volume transport through the eastchannel of the Tsushima Straits was estimated byTakikawa et al. (2005) as 1.1 Sv, and this is consistentwith the transport across the line A. Hence, although it isdifficult to give a definition of the volume transport of
the FBTWC along the Japanese coast, here we proposethat the volume transport across each ADCP transect isdefined as the transport of the FBTWC.
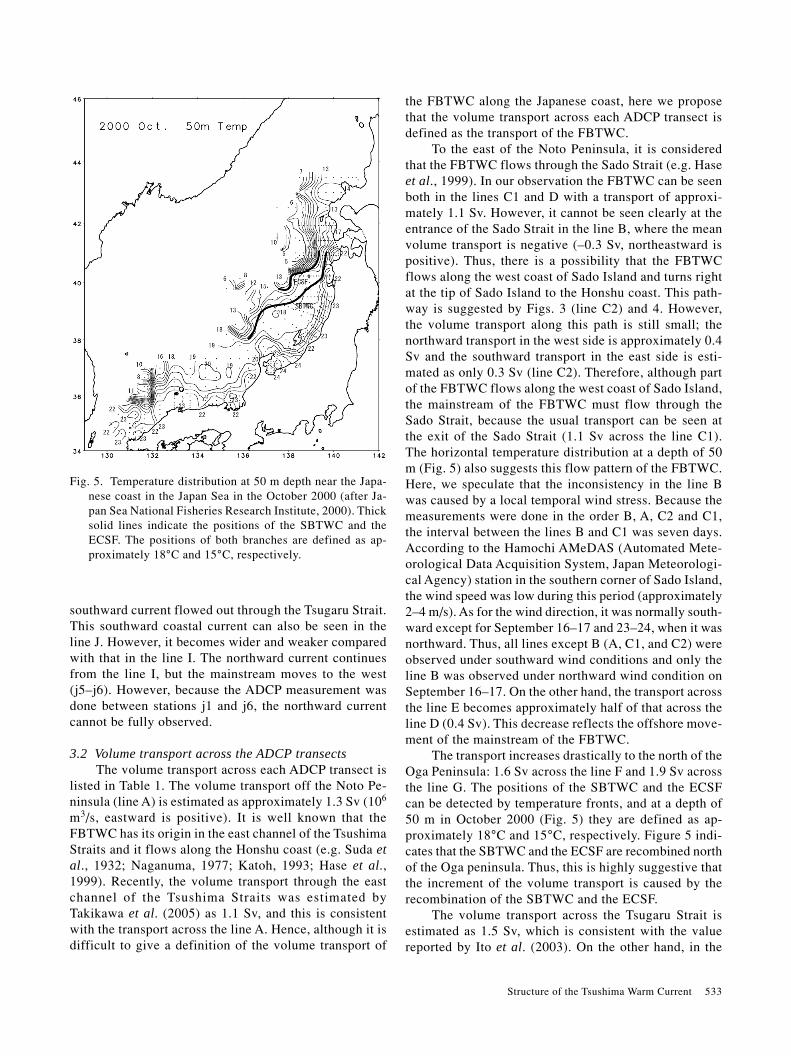
To the east of the Noto Peninsula, it is consideredthat the FBTWC flows through the Sado Strait (e.g. Haseet al., 1999). In our observation the FBTWC can be seenboth in the lines C1 and D with a transport of approxi-mately 1.1 Sv. However, it cannot be seen clearly at theentrance of the Sado Strait in the line B, where the meanvolume transport is negative (–0.3 Sv, northeastward ispositive). Thus, there is a possibility that the FBTWCflows along the west coast of Sado Island and turns rightat the tip of Sado Island to the Honshu coast. This path-way is suggested by Figs. 3 (line C2) and 4. However,the volume transport along this path is still small; thenorthward transport in the west side is approximately 0.4Sv and the southward transport in the east side is esti-mated as only 0.3 Sv (line C2). Therefore, although partof the FBTWC flows along the west coast of Sado Island,the mainstream of the FBTWC must flow through theSado Strait, because the usual transport can be seen atthe exit of the Sado Strait (1.1 Sv across the line C1).The horizontal temperature distribution at a depth of 50m (Fig. 5) also suggests this flow pattern of the FBTWC.Here, we speculate that the inconsistency in the line Bwas caused by a local temporal wind stress. Because themeasurements were done in the order B, A, C2 and C1,the interval between the lines B and C1 was seven days.According to the Hamochi AMeDAS (Automated Mete-orological Data Acquisition System, Japan Meteorologi-cal Agency) station in the southern corner of Sado Island,the wind speed was low during this period (approximately2–4 m/s). As for the wind direction, it was normally south-ward except for September 16–17 and 23–24, when it wasnorthward. Thus, all lines except B (A, C1, and C2) wereobserved under southward wind conditions and only theline B was observed under northward wind condition onSeptember 16–17. On the other hand, the transport acrossthe line E becomes approximately half of that across theline D (0.4 Sv). This decrease reflects the offshore move-ment of the mainstream of the FBTWC.
The transport increases drastically to the north of theOga Peninsula: 1.6 Sv across the line F and 1.9 Sv acrossthe line G. The positions of the SBTWC and the ECSFcan be detected by temperature fronts, and at a depth of50 m in October 2000 (Fig. 5) they are defined as ap-proximately 18°C and 15°C, respectively. Figure 5 indi-cates that the SBTWC and the ECSF are recombined northof the Oga peninsula. Thus, this is highly suggestive thatthe increment of the volume transport is caused by therecombination of the SBTWC and the ECSF.
The volume transport across the Tsugaru Strait isestimated as 1.5 Sv, which is consistent with the valuereported by Ito et al. (2003). On the other hand, in the
Fig. 5. Temperature distribution at 50 m depth near the Japa-nese coast in the Japan Sea in the October 2000 (after Ja-pan Sea National Fisheries Research Institute, 2000). Thicksolid lines indicate the positions of the SBTWC and theECSF. The positions of both branches are defined as ap-proximately 18°C and 15°C, respectively.
534 T. Watanabe et al.
north of the Tsugaru Strait, the component of the south-ward coastal current is estimated as 0.2 Sv and the north-ward component is estimated as approximately 1.0 Sv. Inthe line J, however, because of the offshore movement ofthe mainstream, the volume transport cannot be estimatedcorrectly; it decreases by approximately half comparedwith that in the line I.
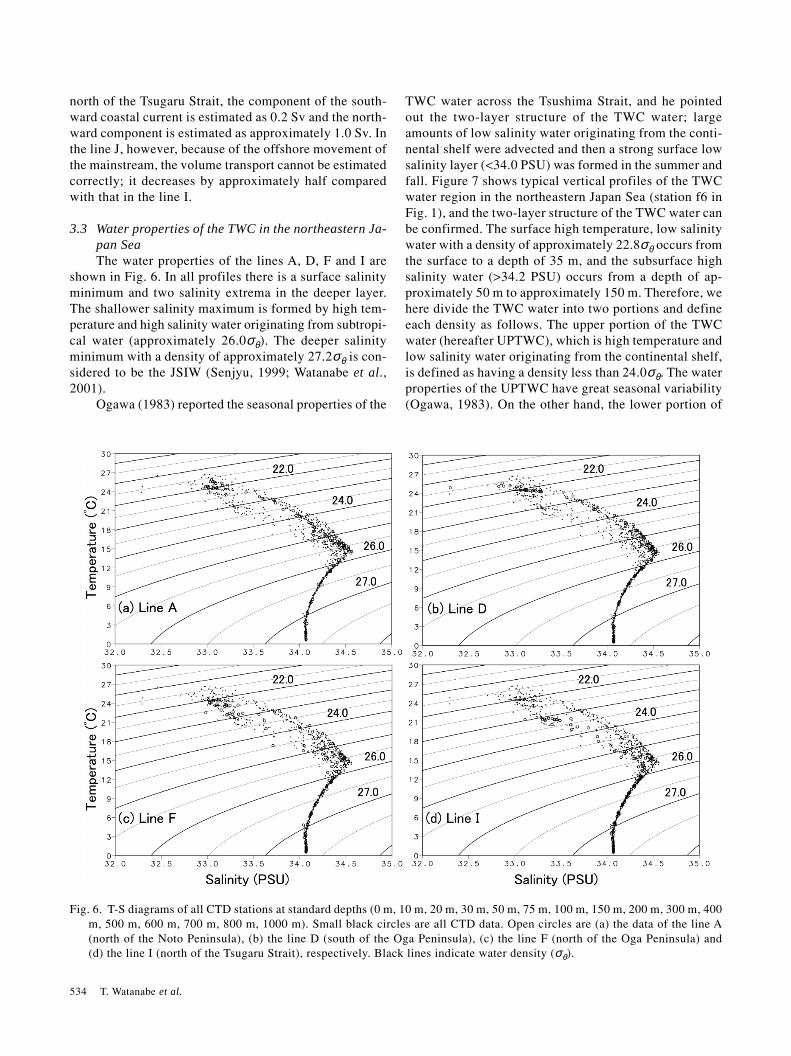
3.3 Water properties of the TWC in the northeastern Ja-pan SeaThe water properties of the lines A, D, F and I are
shown in Fig. 6. In all profiles there is a surface salinityminimum and two salinity extrema in the deeper layer.The shallower salinity maximum is formed by high tem-perature and high salinity water originating from subtropi-cal water (approximately 26.0σθ). The deeper salinityminimum with a density of approximately 27.2σθ is con-sidered to be the JSIW (Senjyu, 1999; Watanabe et al.,2001).
Ogawa (1983) reported the seasonal properties of the
TWC water across the Tsushima Strait, and he pointedout the two-layer structure of the TWC water; largeamounts of low salinity water originating from the conti-nental shelf were advected and then a strong surface lowsalinity layer (<34.0 PSU) was formed in the summer andfall. Figure 7 shows typical vertical profiles of the TWCwater region in the northeastern Japan Sea (station f6 inFig. 1), and the two-layer structure of the TWC water canbe confirmed. The surface high temperature, low salinitywater with a density of approximately 22.8σθ occurs fromthe surface to a depth of 35 m, and the subsurface highsalinity water (>34.2 PSU) occurs from a depth of ap-proximately 50 m to approximately 150 m. Therefore, wehere divide the TWC water into two portions and defineeach density as follows. The upper portion of the TWCwater (hereafter UPTWC), which is high temperature andlow salinity water originating from the continental shelf,is defined as having a density less than 24.0σθ. The waterproperties of the UPTWC have great seasonal variability(Ogawa, 1983). On the other hand, the lower portion of
Fig. 6. T-S diagrams of all CTD stations at standard depths (0 m, 10 m, 20 m, 30 m, 50 m, 75 m, 100 m, 150 m, 200 m, 300 m, 400m, 500 m, 600 m, 700 m, 800 m, 1000 m). Small black circles are all CTD data. Open circles are (a) the data of the line A(north of the Noto Peninsula), (b) the line D (south of the Oga Peninsula), (c) the line F (north of the Oga Peninsula) and(d) the line I (north of the Tsugaru Strait), respectively. Black lines indicate water density (σθ).

Structure of the Tsushima Warm Current 535
water shallower than the salinity maximum has relativelyhigh temperature and high salinity on each isopycnal sur-face (Figs. 6(a) and (b)). On the other hand, to the northof the Oga peninsula, low temperature and low salinitywater begins to appear (Fig. 6(c)), and in the north ofTsugaru Strait it occupies most of the area (Fig. 6(d)).This feature is more remarkable in terms of the densityrange of the UPTWC water; two types of water mass areclearly distinguished.
Figure 8 shows the temperature distribution onisopycnal surfaces. On the 23.5σθ surface, which is thetypical density of the UPTWC water, to the south of theOga Peninsula mostly homogeneous water with high tem-perature (high salinity) greater than 22.0°C occupies theall lines (B, C, D, E). To the north of Oga Peninsula, al-though it still occurs in the east side, low temperature(low salinity) water less than 21.0°C occurs on the westside of each line (F, G). In the north of the Tsugaru Straitthe high temperature water disappears and the low tem-perature water occupies all the lines (I, J). Thus, on the23.5σθ surface two types of water masses can be clearlydistinguished. On the 25.5σθ surface, which is the typi-cal density of the LPTWC water, to the south of the OgaPeninsula, high temperature water of greater than 15.3°Calso occurs. However, the water properties are discon-tinuous to the north of the Oga Peninsula; low tempera-ture water less than 15.0°C is advected from the west andthe water properties in the eastern area are also modified.This suggests that the advected water from the west domi-nates the coastal water.
Fig. 7. Vertical profiles of temperature (°C, thin line), salinity(PSU, thick line) and density (σθ, dashed line) at the sta-tion f6.
Fig. 8. Temperature distributions (°C) along the Japanese coast between the lines B and J on isopycnal surfaces of (a) 23.5σθ and(b) 25.5σθ, respectively. Numbers on the horizontal axis denote the CTD station of each ADCP line. Arrows marked TS andOP indicate the positions of the Tsugaru Strait and the Oga Peninsula, respectively. White areas indicate the outcrop of thetarget densities.
the TWC water (hereafter LPTWC), which has relativelylow temperature and high salinity, originating from thesubtropical North Pacific, is defined as having density24.0–26.0σθ.
To the south of the Oga peninsula most of the TWC
536 T. Watanabe et al.
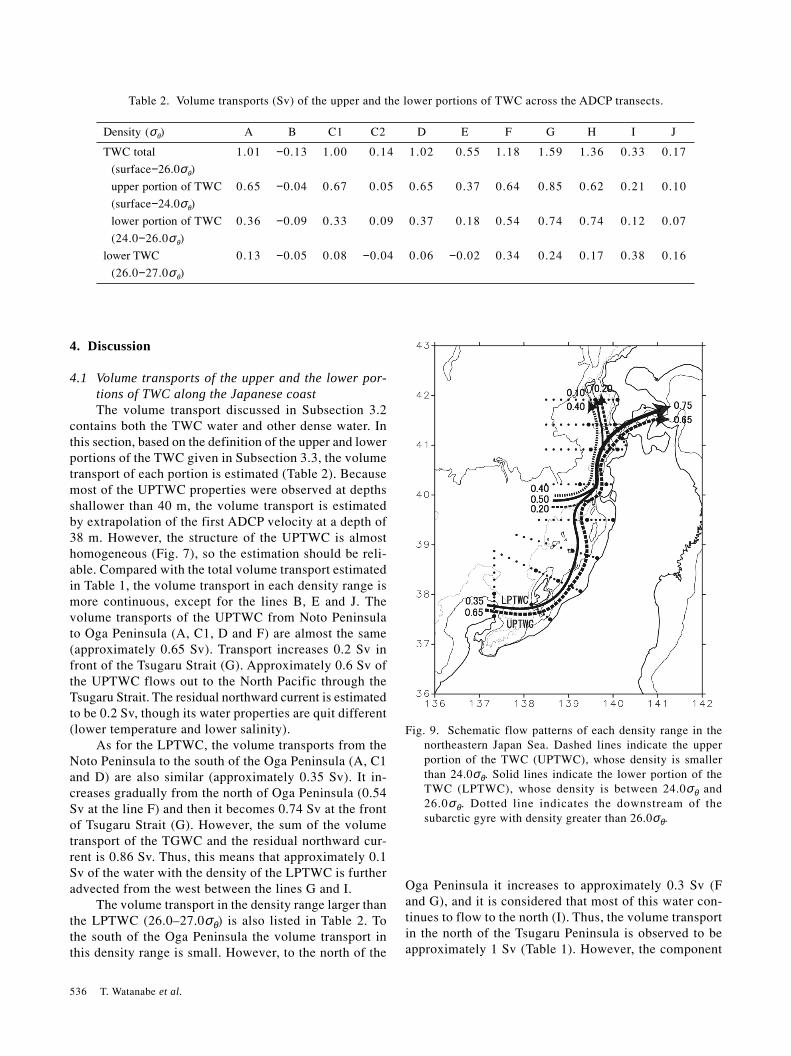
Fig. 9. Schematic flow patterns of each density range in thenortheastern Japan Sea. Dashed lines indicate the upperportion of the TWC (UPTWC), whose density is smallerthan 24.0σθ. Solid lines indicate the lower portion of theTWC (LPTWC), whose density is between 24.0σθ and26.0σθ. Dotted line indicates the downstream of thesubarctic gyre with density greater than 26.0σθ.
4. Discussion
4.1 Volume transports of the upper and the lower por-tions of TWC along the Japanese coastThe volume transport discussed in Subsection 3.2
contains both the TWC water and other dense water. Inthis section, based on the definition of the upper and lowerportions of the TWC given in Subsection 3.3, the volumetransport of each portion is estimated (Table 2). Becausemost of the UPTWC properties were observed at depthsshallower than 40 m, the volume transport is estimatedby extrapolation of the first ADCP velocity at a depth of38 m. However, the structure of the UPTWC is almosthomogeneous (Fig. 7), so the estimation should be reli-able. Compared with the total volume transport estimatedin Table 1, the volume transport in each density range ismore continuous, except for the lines B, E and J. Thevolume transports of the UPTWC from Noto Peninsulato Oga Peninsula (A, C1, D and F) are almost the same(approximately 0.65 Sv). Transport increases 0.2 Sv infront of the Tsugaru Strait (G). Approximately 0.6 Sv ofthe UPTWC flows out to the North Pacific through theTsugaru Strait. The residual northward current is estimatedto be 0.2 Sv, though its water properties are quit different(lower temperature and lower salinity).
As for the LPTWC, the volume transports from theNoto Peninsula to the south of the Oga Peninsula (A, C1and D) are also similar (approximately 0.35 Sv). It in-creases gradually from the north of Oga Peninsula (0.54Sv at the line F) and then it becomes 0.74 Sv at the frontof Tsugaru Strait (G). However, the sum of the volumetransport of the TGWC and the residual northward cur-rent is 0.86 Sv. Thus, this means that approximately 0.1Sv of the water with the density of the LPTWC is furtheradvected from the west between the lines G and I.
The volume transport in the density range larger thanthe LPTWC (26.0–27.0σθ) is also listed in Table 2. Tothe south of the Oga Peninsula the volume transport inthis density range is small. However, to the north of the
Oga Peninsula it increases to approximately 0.3 Sv (Fand G), and it is considered that most of this water con-tinues to flow to the north (I). Thus, the volume transportin the north of the Tsugaru Peninsula is observed to beapproximately 1 Sv (Table 1). However, the component
Table 2. Volume transports (Sv) of the upper and the lower portions of TWC across the ADCP transects.
Density (σθ) A B C1 C2 D E F G H I J
TWC total 1.01 −0.13 1.00 0.14 1.02 0.55 1.18 1.59 1.36 0.33 0.17
(surface−26.0σθ)
upper portion of TWC 0.65 −0.04 0.67 0.05 0.65 0.37 0.64 0.85 0.62 0.21 0.10
(surface−24.0σθ)
lower portion of TWC 0.36 −0.09 0.33 0.09 0.37 0.18 0.54 0.74 0.74 0.12 0.07
(24.0−26.0σθ)
lower TWC 0.13 −0.05 0.08 −0.04 0.06 −0.02 0.34 0.24 0.17 0.38 0.16
(26.0−27.0σθ)
Structure of the Tsushima Warm Current 537
due to the TWC is estimated as only 30% of the value(0.33 Sv in line I). As a result, it is suggested that most ofthe other transport is composed of the subarctic water withdensity greater than 26.0σθ, which is advected by theECSF from the northwestern Japan Sea.
4.2 Flow patterns of the upper and lower portions of theTWC along the northern Japanese coastFinally, based on the volume transport across the
ADCP lines, we propose schematic flow patterns of theUPTWC and the LPTWC (Fig. 9). There are two originsof the TWC distributed along the northern Honshu coast:one is the FBTWC from the Noto Peninsula (approxi-mately 1.0 Sv); and the other is the recombined currentof the SBTWC and the ECSF from the north of the OgaPeninsula (approximately 0.7 Sv).
The UPTWC continues to flow along Honshu Islandwith a volume transport of approximately 0.65 Sv, andmost of the UPTWC flows out through the Tsugaru Strait.The contribution of the recombined current to the vol-ume transport of the density range of the UPTWC is small(0.2 Sv). Furthermore, its water characteristic is quitedifference from that of the FBTWC. On the other hand,as for the LPTWC, the contribution of the FBTWC andthe recombined current are comparable: approximately0.35 Sv comes from the FBTWC and 0.50 Sv from therecombined current. To the north of the Oga Peninsulaboth current waters are mixed and the FBTWC water isthen modified. Most of the modified water also flows outthrough the Tsugaru Strait.
As for the dense water with density between 26.0σθand 27.0σθ, which occurs under the TWC water, the vol-ume transport south of the Oga Peninsula is small. To thenorth of the Oga Peninsula it begins to increase gradu-ally. North of the Tsugaru Strait (I), the volume transportof the dense water (>26.0σθ) is the dominant componentand it becomes double that of the TWC (<26.0σθ).
5. ConclusionsIn September–October 2000 eleven lines of ADCP
four round-trips measurements were conducted along thenorthwestern Japanese coast in the northeastern Japan Seato investigate the current structure of the TWC and itslower branches (FBTWC, SBTWC and ECSF). As a re-sult, accurate volume transports across the ADCP lineswithout tidal components could be estimated. TheFBTWC continued to flow along the Honshu coast andmost of it flowed out through the Tsugaru Strait. TheSBTWC and the ECSF were recombined to the FBTWCnorth of the Oga Peninsula. Based on the water proper-ties, the TWC was divided into two portions: the UPTWCand the LPTWC. Most of the UPTWC was contained inthe FBTWC. On the other hand, the LPTWC originatedfrom both the FBTWC and the recombined current.
AcknowledgementsThe authors would like to express their thanks to
Captain Shimada, officers and crew of R/V Torishima fortheir highly efficient efforts in carrying out the observa-tions.
ReferencesHase, H., J.-H. Yoon and W. Koterayama (1999): The current
structure of the Tsushima Warm Current along the JapanCoast. J. Oceanogr., 55, 217–235.
Isobe, A., M. Ando, T. Watanabe, T. Senjyu, S. Sugihara and A.Manda (2002): Freshwater and temperature transportsthrough the Tsushima-Korea Straits. J. Geophys. Res., 107,doi:10.1029/2000JC000702.
Ito, T., O. Togawa, M. Ohnishi, Y. Isoda, T. Nakayama, S. Shima,H. Kuroda, M. Iwahashi and C. Sato (2003): Variation ofvelocity and volume transport of the Tsugaru Warm Cur-rent in the winter of 1999–2000. Geophys. Res. Lett., 30(13),1678, doi:10.1029/2003GL017522.
Japan Sea National Fisheries Research Institute (2000): Reportof the Fisheries and Oceanographic Conditions in the Ja-pan Sea (Nihonkai Gyojyo-Kaikyo Sokuhou), No. 552.
Joyce, T. M. (1989): On in situ “calibration” of shipboardADCPs. J. Atom. Ocean. Tech., 6, 169–172.
Katoh, O. (1988): Measurement of residual current using theDoppler sonar. Bull. Seikai Reg. Fish. Res. Lab., 66, 59–67(in Japanese with English abstract).
Katoh, O. (1993): Detailed current structures over the conti-nental shelf off the San’in coast in summer. J. Oceanogr.,49, 1–16.
Katoh, O. (1994): Structure of the Tsushima Current in thesouthwestern Japan Sea. J. Oceanogr., 50, 317–338.
Katoh, O., K. Morinaga, K. Miyaji and K. Teshima (1996):Branching and joining of the Tsushima Current around theOki Islands. J. Oceanogr., 52, 747–761.
Kawabe, M. (1982): Branching of the Tsushima Current in theJapan Sea. Part 1. Data analysis. J. Oceanogr. Soc. Japan,38, 95–107.
Lee, D.-K., P. P. Niiler, S.-R. Lee, K. Kim and H.-J. Lie (2000):Energetics of the surface circulation of the Japan/East Sea.J. Geophys. Res., 105, 19561–19573.
Naganuma, K. (1977): The oceanographic fluctuations in theJapan Sea. Kaiyo Kagaku, 9, 139–141 (in Japanese withEnglish abstract).
Nakada, S. and Y. Isoda (2000): Seasonal variation of theTsushima Warm Current off Toyama Bay. Umi to Sora, 76,145–152 (in Japanese with English abstract).
Nakada, S., Y. Isoda and K. Kusahara (2002): Response of thecoastal branch flow to alongshore variation in shelf topogra-phy off Toyama Bay. Oceanography in Japan, 11, 243–258(in Japanese with English abstract).
Nakata, A. and I. Tanaka (2002): Seasonal and year-to-yearvariability of baroclinic volume transport of the TsushimaWarm Current off the west of Hokkaido. Sci. Rep. HokkaidoFish. Exp. Stn., 63, 1–8 (in Japanese with English abstract).
Ogawa, Y. (1983): Seasonal changes in temperature and salin-ity of water flowing into the Japan Sea through the TsushimaStrait. Bull. Jpn. Soc. Fish. Oceanogr., 43, 1–8 (in Japa-nese with English abstract).
538 T. Watanabe et al.
Ohshima, K. I. (1994): The flow system in the Japan Sea causedby a sea level difference through shallow straits. J. Geophys.Res., 99, 9925–9940.
Onishi, M. and K. Ohtani (1997): Volume transport of theTsushima Warm Current, west of Tsugaru Strait bifurcationarea. J. Oceanogr., 53, 27–34.
RDI (1997): Vessel mount technical manual. RD Instruments,San Diego, California, S-3.
Senjyu, T. (1999): The Japan Sea Intermediate Water; Its char-acteristics and circulation. J. Oceanogr., 55, 111–122.
Senjyu, T. and H. Sudo (1993): Interannual variation of theupper portion of the Japan Sea Proper Water. J. Mar. Syst.,4, 349–362.
Suda, K., K. Hidaka, Y. Matsudaira, E. Kurashige, H. Kawasakiand T. Kubo (1932): Results of the third oceanographicalobservations in the main region of the Japan Sea. J.
Oceanogr. Imp. Mar. Observ., 4, 1–173 (in Japanese).Takikawa, T., J.-H. Yoon and K.-D. Cho (2005): The Tsushima
Warm Current through Tsushima Straits estimated from fer-ryboat ADCP data. J. Phys. Oceanogr., 35, 1154–1168.
Toba, Y., K. Tomizawa, Y. Kurasawa and K. Hanawa (1982):Seasonal and year-to-year variability of the Tsushima-Tsugaru current system with its possible cause. La mer, 20,41–51.
Uda, M. (1934): Oceanographic conditions in the Japan Seaand its adjacent waters (the results of simultaneous ocea-nographical investigations in the Japan Sea and its adjacentwaters in May and June, 1932). J. Imp. Fish. Exp. Sta., 5,57–190 (in Japanese with English abstract).
Watanabe, T., M. Hirai and H. Yamada (2001): High-salinityintermediate water of the Japan Sea in the eastern JapanBasin. J. Geophys. Res., 106, 11437–11450.