stream-profile analyses using a step-backwater model for ... · step-backwater model was used to...
TRANSCRIPT

U.S. Department of the InteriorU.S. Geological Survey
Scientific Investigations Report 2011–5024
In cooperation with the Chippewa Subdistrict of the Muskingum Watershed Conservancy District
Stream-Profile Analyses Using a Step-Backwater Model for Selected Reaches in the Chippewa Creek Basin in Medina, Wayne, and Summit Counties, Ohio

Cover photo. Chippewa Creek looking upstream from Shorle Road.

Stream-Profile Analyses Using a Step-Backwater Model for Selected Reaches in the Chippewa Creek Basin in Medina, Wayne, and Summit Counties, Ohio
By David E. Straub and Andrew D. Ebner
In cooperation with the Chippewa Subdistrict of the Muskingum Watershed Conservancy District
Scientific Investigations Report 2011–5024
U.S. Department of the InteriorU.S. Geological Survey

U.S. Department of the InteriorKEN SALAZAR, Secretary
U.S. Geological SurveyMarcia K. McNutt, Director
U.S. Geological Survey, Reston, Virginia: 2011
For more information on the USGS—the Federal source for science about the Earth, its natural and living resources, natural hazards, and the environment, visit http://www.usgs.gov or call 1-888-ASK-USGS
For an overview of USGS information products, including maps, imagery, and publications, visit http://www.usgs.gov/pubprod
To order this and other USGS information products, visit http://store.usgs.gov
Any use of trade, product, or firm names is for descriptive purposes only and does not imply endorsement by the U.S. Government.
Although this report is in the public domain, permission must be secured from the individual copyright owners to reproduce any copyrighted materials contained within this report.
Suggested citation:Straub, D.E., Ebner, A.D., 2010, Stream profile analysis using a step backwater model for selected reaches in the Chippewa Creek basin in Medina, Wayne, and Summit Counties, Ohio: U.S. Geological Survey Scientific Investigations Report 2011-5024, 78p.

iii
Contents
Abstract ...........................................................................................................................................................1Introduction.....................................................................................................................................................1
Description of Study Area ...................................................................................................................4Flood-Control Modifications ...............................................................................................................4Purpose and Scope ..............................................................................................................................4
Study Methods ...............................................................................................................................................6Data Collection ......................................................................................................................................6Hydrology ...............................................................................................................................................7Development of Water-Surface Profiles ...........................................................................................8Analyses of Open Channels ................................................................................................................8Analyses of Hydraulic Structures ....................................................................................................10Reduction of Roughness Coefficient Analysis ...............................................................................10
Results of Hydraulic Analyses ...................................................................................................................10Summary .......................................................................................................................................................11References Cited..........................................................................................................................................11Appendix 1. Descriptions of Benchmarks ............................................................................................13Appendix 2. Selected Hydrologic Engineers Center’s River Analysis System Output
for Chippewa Creek, Westfield Ditch, River Styx, and Little Chippewa Creek .........33Appendix 3. Computed Water-Surface Elevations for Chippewa Creek,
River Styx, and Little Chippewa Creek ............................................................................57
Figures 1. Map depicting selected features of the Chippewa Creek basin
in Medina, Wayne, Stark, and Summit Counties, Ohio. ..........................................................2 2. Chippewa Creek looking upstream from Shorle Road. ..........................................................3 3. Chippewa Creek looking upstream from abandoned railroad near mouth .........................3 4. Map depicting selected features pertaining to the models of the
Chippewa Creek basin in Medina, Wayne, Stark, and Summit Counties, Ohio ..................5 3–1. Computed water-surface profiles for a bank-full discharge with
Manning’s roughness coefficients in the main channel at current values and reduced by 5, 10, 15, and 20 percent on Chippewa Creek in Medina, Wayne, and Summit Counties, Ohio ....................................................................58
3–2. Computed water-surface profiles for a bankfull discharge with Manning’s roughness coefficients in the main channel at current values and reduced by 5, 10, 15, and 20 percent on River Styx in Medina and Wayne Counties, Ohio .....................................................................................70
3–3. Computed water-surface profiles for a bankfull discharge with Manning’s roughness coefficients in the main channel at current values and reduced by 5, 10, 15, and 20 percent on Little Chippewa Creek in Wayne County, Ohio .......................................................................76

iv
Tables 1. Original design characteristics of the Soil Conservation Service
flood-retention structures ...........................................................................................................6 2. Hydraulic model limits for selected streams in the Chippewa Creek basin,
Medina, Wayne, and Summit Counties, Ohio ...........................................................................6 3. Summary of data collected from field surveys used for the step-backwater
models in the Chippewa Creek basin, in Medina, Wayne, Stark, and Summit Counties, Ohio .........................................................................................................7
4. List of benchmarks used to establish a Global Positioning Systemcontrol network for the surveying of the Chippewa Creek basin and the accuracies of those measurements ...................................................................................8
5. Basin characteristics and approximate bankfull flow at various locations for selected streams in the Chippewa Creek basin ................................................................9
6. Average decrease in water-surface elevation, in feet, along the selectedreach after decreasing the Manning’s roughness coefficient (n) for themain channel by 5, 10, 15, and 20 percent from the base values .......................................11
2–1. Selected Hydrologic Engineers Center’s River Analysis System output for Chippewa Creek, Medina, Wayne, and Summit Counties, Ohio. ......................34
2–2. Selected Hydrologic Engineers Center’s River Analysis System output for Westfield Ditch, Medina County, Ohio .................................................................... 46
2–3. Selected Hydrologic Engineers Center’s River Analysis System output for River Styx, Medina and Wayne Counties, Ohio ....................................... 48
2–4. Selected Hydrologic Engineers Center’s River Analysis System output for Little Chippewa Creek , Wayne County, Ohio .................................................................... 54
3–1. Water-surface elevation, in feet, along Chippewa Creek after decreasing the Manning’s roughness coefficient (n) for the main channel by 5, 10, 15, and 20 percent .......................................................................................................59
3–2. Water-surface elevation, in feet, along River Styx after decreasingthe Manning’s roughness coefficient (n) for the main channel by 5, 10, 15, and 20 percent .......................................................................................................71
3–3. Water-surface elevation, in feet, along Little Chippewa Creek after decreasing the Manning’s roughness coefficient (n) for the main channel by 5, 10, 15, and 20 percent ..............................................................................77

v
Conversion Factors and Abbreviations
Multiply By To obtainLength
inch (in.) 2.54 centimeter (cm)centimeter (cm) 0.3937 inch (in.)foot (ft) 0.3048 meter (m)mile (mi) 1.609 kilometer (km)
Areaacre 4,047 square meter (m2)square foot (ft2) 0.09290 square meter (m2)square mile (mi2) 2.590 square kilometer (km2)
Volume per unit time (includes flow)cubic feet per second (ft3/s) 28.32 cubic decimeter per seond (dm3/s)
Volumeacre-foot (acre-ft) 1,233 cubic meter (m3)
Flow ratefoot per second (ft/s) 0.3048 meter per second (m/s)
Vertical coordinate information is referenced to the North American Vertical Datum of 1988 (NAVD 88).
Horizontal coordinate information is referenced to the North American Datum of 1983 (NAD 83).
Other abbreviations
FEMA Federal Emergency Management Agency
FIS Flood Insurance Study
GPS Global Positioning System
HEC-RAS Hydrologic Engineers Center’s River Analysis System
MWCD Muskingum Watershed Conservancy District
SCS Soil Conservation Service
TIN Triangular Irregular Network
USGS U.S. Geological Survey


Stream-Profile Analyses Using a Step-Backwater Model for Selected Reaches in the Chippewa Creek Basin in Medina, Wayne, and Summit Counties, Ohio
By David E. Straub and Andrew D. Ebner
AbstractThe U.S. Geological Survey, in cooperation with the
Chippewa Subdistrict of the Muskingum Watershed Conser-vancy District, performed hydrologic and hydraulic analyses of selected reaches of three streams in the Chippewa Creek basin in Medina, Wayne, and Summit Counties, Ohio to aid in the assessment of alternatives for channel improvements for mitigating flood hazards. Peak flows with a 50-percent annual exceedance probability (the 2-year flood) were estimated from regional regression equations as an approximation of bankfull discharges. Drainage areas of the three stream reaches studied ranged from 29.6 to 188 square miles.
The Hydrologic Engineers Center’s River Analysis System step-backwater model was used to compute water-surface-elevation profiles for the 2-year flood along selected reaches of the streams. The base model was modified to determine the effects of reducing main-channel roughness coefficients (Manning’s n) by 5, 10, 15, and 20 percent on the computed water-surface profiles. Reach-averaged reductions in water-surface elevations ranged from 0.11 to 1.29 feet over the four roughness reduction scenarios.
Introduction The Chippewa Creek valley was a series of swamps until
channel modifications drained it and turned it into a productive agricultural region by 1900. Without a systematic maintenance program, the channels reverted back to their natural condi-tions and flooding became a problem. In June 1956, the Soil Conservation Service (SCS) developed a watershed-protection and flood-control plan (U.S. Department of Agriculture, 1956) that called for 33.2 miles of modified channels and 8 floodwater-retention structures (fig.1). The channel modifica-tions included straightening the channel of selected stream reaches of Chippewa Creek, Westfield Ditch, Little Chippewa Creek, and River Styx. A trapezoidal channel geometry was constructed to increase the efficiency of the channel to convey the floodwater out of the basin. The floodwater-retention
structures were designed to attenuate flood-peak streamflows. The effects of these flood-control features were estimated to reduce the annual average flooded area by approxi-mately 4,210 acres. (Muskingum Watershed Conservancy District, 1961).
After three amendments to the original plan, in which the primary changes were the locations of conservation pools upstream from the floodwater-retention structures, the final version of the Chippewa Subdistrict’s Official Plan (Muskingum Watershed Conservancy District, 1961) was adopted in March 1977. All channel modifications and flood-water-retention structures of this plan were completed by 1980.
The floodwater-retention structures have been maintained by the Chippewa Subdistrict of Muskingum Watershed Con-servancy District (MWCD). Over time, however, the streams have developed significant tree and brush growth along the channel, thus decreasing the ability of the stream to convey floodwaters out of the basin. In 2007, a section of Chippewa Creek between Shorle Road and Miller Road was cleared of debris, trees, and brush (figure 2). The downstream channel reach of Chippewa Creek still (as of 2010, figure 3) has appre-ciable tree and brush growth along the channel banks.
The Chippewa Creek basin is undergoing significant development pressure in several areas of the watershed. Traditionally, communities could make use of Flood Insur-ance Studies (FIS) as an important tool for determining areas that should not be developed. A majority of FIS’s conducted by the Federal Emergency Management Agency (FEMA) in the Medina County portion of the Chippewa Creek basin were completed in the mid-to-late 1980’s. A FIS for Medina County and incorporated areas (Federal Emergency Man-agement Agency, 2008) was released on August 4, 2008, but no new detailed studies were completed as part of this new study. The flood-hazard-inundation areas of the older studies were redelineated over new digital base map informa-tion provided by Medina County. A FIS for Wayne County and incorporated areas (Federal Emergency Management Agency, 2009) was adopted on August 18, 2009, and it included new detailed flood profiles that were developed for Chippewa Creek and River Styx for recurrence intervals of 10, 50, 100, and 500 years.

2 Stream-Profile Analyses Using a Step-Backwater Model for Selected Reaches in the Chippewa Creek Basin in Ohio
MEDINA
SUMMIT
WAYNE STARK
II-A
III-A
VIII-C
IV-A
V-C
V-D
VIII-D
VII-C
03116077
03116200
03116100
Chippewa
Creek
RiverStyx
Chippewa
Little
Creek
WestfieldDitch
ChippewaLake
Buck
Creek
TheInlet
HubbardCreek
FallCreek
E.B.W.B.
Steele
Ditch
Holmes
Brook
Ditch
Whi t man
Tommy
Run
Mill
Creek
Red
Run
Creek
Silver
Tuscar-awasRiver
LandisDitc
Medina
Wayne
Summit
Stark
EXPLANATION
Chippewa Creek basin
County boundary
Selected lake
Soil Conservation Service floodwater-retention structure and identifier
Selected stream
Modified channel section
U.S. Geological Survey streamflow-gaging station and identifier
Discontinued U.S. Geological Survey streamflow-gaging station and identifier
0 5 10 MILES
0 5 10 KILOMETERS
81°40'0"W81°45'0"W81°50'0"W81°55'0"W82°0'0"W41°15'0"N
41°10'0"N
41°5'0"N
41°0'0"N
40°55'0"N
40°50'0"N
40°45'0"N
Base from U.S. Geological Surveydigital data, variously scaledState Plane Ohio North
Figure 1. Map depicting selected features of the Chippewa Creek basin in Medina, Wayne, Stark, and Summit Counties, Ohio.

3
Figure 2. Chippewa Creek looking upstream from Shorle Road.
Figure 3. Chippewa Creek looking upstream from abandoned railroad near mouth.
4 Stream-Profile Analyses Using a Step-Backwater Model for Selected Reaches in the Chippewa Creek Basin in Ohio
The Chippewa Subdistrict is concerned about the impact that existing and future development and channel conditions will have on the hydraulic and hydrologic char-acteristics within the watershed. To aid in the assessment of these impacts and to assist communities making land-use and development decisions, the Chippewa Subdistrict requested that the U.S. Geological Survey (USGS) develop a step-back-water model for selected reaches of Chippewa Creek, Little Chippewa Creek, and River Styx.
Description of Study Area
The Chippewa Creek basin (fig. 1) is located in northeast Ohio, largely in Medina and Wayne Counties but also in small portions of Summit and Stark Counties. The Inlet, which is the headwaters of Chippewa Creek, is a roughly 2-mi reach of stream located west of the city of Medina, and it flows into Chippewa Lake. Chippewa Creek flows out of Chippewa Lake, the largest natural lake in Ohio. Chippewa Creek gener-ally flows south through south-central Medina County, through the village of Seville, and into Wayne County. After flowing through Sterling, Chippewa Creek flows east, passing through the southern edge of the city of Rittman, and eventually flows into the Tuscarawas River in southwestern Summit County (fig. 4). Near the outlet of Chippewa Lake, some of the flow in Chippewa Creek escapes into the headwaters of Westfield Ditch, a tributary of Chippewa Creek, and so Westfield Ditch was modeled as well. Little Chippewa Creek starts in Wayne County near the city of Orrville and generally flows north to join Chippewa Creek at the south side of the city of Rittman (fig. 4). River Styx begins in Medina County near Wadsworth and generally flows south into Wayne county, along the east-ern edge of the city of Rittman, and joins Chippewa Creek at the southeastern side of Rittman (fig. 4). The entire Chippewa Creek basin covers 188 mi2, with Little Chippewa Creek cov-ering 32.2 mi2 and River Styx covering 29.6 mi2.
The Chippewa Creek basin is largely agricultural, and a majority of the basin is used for cultivated crops, pastures, and hay. In cities and villages, a majority of the development is of low intensity or is considered open space (U.S. Geological Survey, 2001). The 2009 population estimates, according to the U.S. Census Bureau, are 174,035 in Medina County and 114,222 in Wayne County.
The USGS currently operates one streamflow-gaging station in the Chippewa Creek basin (fig. 1). That station, Chippewa Creek at Miller Road at Sterling, Ohio (USGS 03116077; fig. 4), was installed in 2002, and data collected by it was used to calibrate the model for Chippewa Creek. Two other streamflow-gaging stations were operated in the Chippewa Creek basin but have been discontinued: Chip-pewa Creek at Easton, Ohio (03116200), operated from 1959 to 1981, and Little Chippewa Creek near Smithville, Ohio (03116100), operated from 1957 to 1972 (fig.1). Data from these stations were not used to calibrate the model because the stage-discharge relationships have changed over the years.
Flood-Control Modifications
The SCS built structures and modified channels to miti-gate the effects of flood flows, as listed in the Chippewa Sub-district’s Official Plan (Muskingum Watershed Conservancy District, 1961). Sections of Chippewa Creek, Westfield Ditch, Little Chippewa Creek, and River Styx were modified to increase conveyance of flood flows by straightening and modi-fying the channels. The modifications called for a trapezoidal cross section, and the dredged materials were removed from the channel and distributed along the tops of the banks. The embankments formed from the dredged materials increased the main-channel cross-sectional area to convey greater flood flows and provided small impoundments behind the embank-ments for temporary storage. Any water storage behind the embankments drained back into the channel through small cul-verts or infiltration through the soil. All of the embankments and structures are within the MWCD jurisdiction.
The plan also called for the construction of eight flood-retention structures. All eight of the SCS flood-retention structures are located on tributaries to Chippewa Creek (fig. 1; table 1). Chippewa Lake is not considered one of the flood-control structures, although it provides some natural storage and flood attenuation. Structures II–A, III–A, IV–A, and V–D have conservation pools above the dam, but VIII–C, VIII–D, V–C, and VII–C are dry dams. The combined flood-storage capacity of all eight flood-control structures, not including the conservation pool storage up to the emergency crest, is 4,987 acre-feet (table 1).
Purpose and Scope
This report presents the methods used for and results of a study to analyze the hydrology and hydraulics of flow within channels of the Chippewa Creek basin to aid in an assess-ment of various flood-mitigation alternatives. The USGS used the Hydrologic Engineers Center’s River Analysis System (HEC-RAS; U.S. Army Corps of Engineers, 2008 a–c) step-backwater model to develop water-surface profiles within selected streams in the basin (table 2) and the reach contain-ing Chippewa Lake (fig. 4). Streamflows determined by use of the USGS Ohio StreamStats program (U.S. Geological Survey, 2008) were used as estimates of bankfull flows in the models; cross-sectional elevation data, hydraulic structure geometries, roughness coefficients (Manning’s n), and peak-discharge estimates also were used as model inputs. Potential modifications to the channel were evaluated to determine their effects on water-surface elevations. The roughness coeffi-cients (Manning’s n) of the main channel were then reduced by 5, 10, 15, and 20 percent to simulate potential effects of channel clearing and/or modifications on the water-surface profiles.

Introduction 5
MEDINA
SUMMIT
WAYNE
STARK
MEDINA
RITTMAN
WADSWORTH
ORRVILLE
SEVILLE
STERLING
Chippewa
Creek
RiverStyx
Chippewa
Little
Creek
WestfieldDitch
ChippewaLake
TheInlet
Tuscar-awasRiver
S M
ain
St
Fric
k Rd
Steiner Rd
Easton RdSR 604 /
Greenwich Rd
I - 71
SR 224 SR 224 / I - 76
SR 3
SR 3
I - 71
Kennard Rd
Chippewa Rd
Wedgewood Rd
Buffham RdBlake Rd
SR 224 / I - 76
Greenwich Rd
Mill
er R
d
Shor
le R
d
Medina
Wayne
Summit
Stark
EXPLANATION
Chippewa Creek basin
County boundary
Selected lake
Selected stream
Modified reach
U.S. Geological Survey streamflow-gaging station and identifier
Municipal area
Selected interstate or state route
Selected county or township road
0 5 10 MILES
0 5 10 KILOMETERS
03116077
81°40'0"W81°45'0"W81°50'0"W81°55'0"W82°0'0"W41°15'0"N
41°10'0"N
41°5'0"N
41°0'0"N
40°55'0"N
40°50'0"N
40°45'0"N
Base from U.S. Geological Surveydigital data, variously scaledState Plane Ohio North
and Summit Counties, Ohio.Figure 4. Map depicting selected features pertaining to the models of the Chippewa Creek basin in Medina, Wayne, Stark,

6 Stream-Profile Analyses Using a Step-Backwater Model for Selected Reaches in the Chippewa Creek Basin in Ohio
Table 1. Original design characteristics of the Soil Conservation Service flood-retention structures.
[From U.S. Department of Agriculture, 1956]
Flood-retention structure
Tributary toChippewa Creek
Storm recurrence interval for
flood-retention structure
(years)
Year of dam
completion
Drainage area above dam
(square miles)
Conservation pool
storage capacity(acre-feet)
Flood storagecapacity up to theemergency crest
(acre-feet)
II–A Buck Creek 25 1969 2.95 77 278III–A Hubbard Creek 50 1980 5.88 124 676IV–A Fall Creek 25 1973 1.51 16 120V–C East Branch Steele Ditch1 25 1971 3.73 None 432V–D West Branch Steele Ditch1 25 1971 1.75 30 156VII–C Little Chippewa Creek 50 1974 14.42 None 2,225VIII–C River Styx 25.7 inches 1976 3.86 None 673VIII–D Holmes Brook3 50 1976 2.02 None 427Totals 36.12 247 4,987
1 East and West Branch Steele Ditch form Steele Ditch, a tributary to Chippewa Creek.2 This dam designed to control a storm runoff of 5.7 inches in 6 hours.3 Holmes Brook is a tributary to River Styx.
Table 2. Hydraulic model limits for selected streams in the Chippewa Creek basin, Medina, Wayne, and Summit Counties, Ohio.
Stream Upstream limit Downstream limitReach length
(miles)
The Inlet1 About 1,200 feet above Wedgewood Road /State Route 162
About 750 feet below Chippewa Road
2.0
Chippewa Creek2 Chippewa Lake Mouth 19.1Little Chippewa Creek Steiner Road Mouth 3.2River Styx Flood Control Structure VII–C Mouth 7.9
1 The Inlet is the head of Chippewa Creek.2 Westfield Ditch was modeled as an overflow channel to Chippewa Creek.
Study Methods
Data Collection
Field visits were made to the Chippewa Creek basin to determine applicable stream-channel roughness coefficients (Manning’s n), cross-section elevations, and geometries of hydraulic structures. Cross sections and geometries were sur-veyed at all structures in each reach. If the distance between structures was more than 1 mi, an open-channel cross section was surveyed by the USGS at a convenient location near the halfway point. By use of a Geographic Information System, a Triangular Irregular Network (TIN) was developed from digital 2-ft contour interval mapping provided by Medina, Wayne, Stark, and Summit Counties to supplement surveyed cross-sectional data. In-channel bottom elevation data for TIN-derived cross sections were estimated by interpolat-ing values between surveyed cross sections. The in-channel
bottom width for each TIN-derived cross section was esti-mated from the “AS-BUILT” plans provided by the MWCD (U.S. Department of Agriculture, 1980) for each stream. The combination of TIN-derived cross sections with interpolated in-channel elevations will be referred to as “synthetic” sec-tions in this report. For this investigation, 246 cross sections were surveyed in the field (table 3) and 484 synthetic sections were developed. Geometries of 56 culverts and bridges and 4 low head dams also were obtained from field surveys.
The initial starting water-surface elevation for each model was determined from a normal-depth calculation in the HEC-RAS model. The initial slope was determined from the minimum channel elevations of surveyed cross sections near the mouth of each stream studied. All models were assumed to be independent of the downstream water-surface conditions. Backwater from the receiving stream was not considered in the beginning of each model. Therefore, the water surface of each model will most likely be lower than the actual water sur-

Study Methods 7
Table 3. Summary of data collected from field surveys used for the step-backwater models in the Chippewa Creek basin, in Medina, Wayne, Stark, and Summit Counties, Ohio.
StreamBaseline reference location1
Number of surveyed
cross sections
Number of synthetic
cross sections derived
from triangular irregular network
Number of hydraulic structures
Slope used for normal
depth calculation
(feet per foot)
Manning’s roughness coefficient (n)2
Lowest value
for main
channel
Highest value
for main
channel
Lowest value
for overbanks
Highest value
for overbanks
Chippewa Creek
Mouth 127 293 32 0.000167 0.010 0.050 0.035 0.085
Westfield Ditch
Mouth 20 28 5 Not applicable3 0.034 0.065 0.045 0.065
River Styx Mouth 84 108 20 0.000387 0.030 0.040 0.028 0.075
Little Chippewa Creek
Mouth 15 55 3 0.000200 0.035 0.039 0.045 0.045
1Downstream limit of the study reach.2 Values in these columns are for the current conditions of the reach and do not reflect scenarios of decreasing the roughness coefficient.3 The starting water surface elevation was determined from the Chippewa Creek model. No normal depth calculation was needed.
face. In addition, because the normal-depth method was used in each model, the lower reach may not be accurate. Each model had a convergence reach that extended from the start of the model upstream to the point where the estimated water-surface profile and the true water-surface profile met.
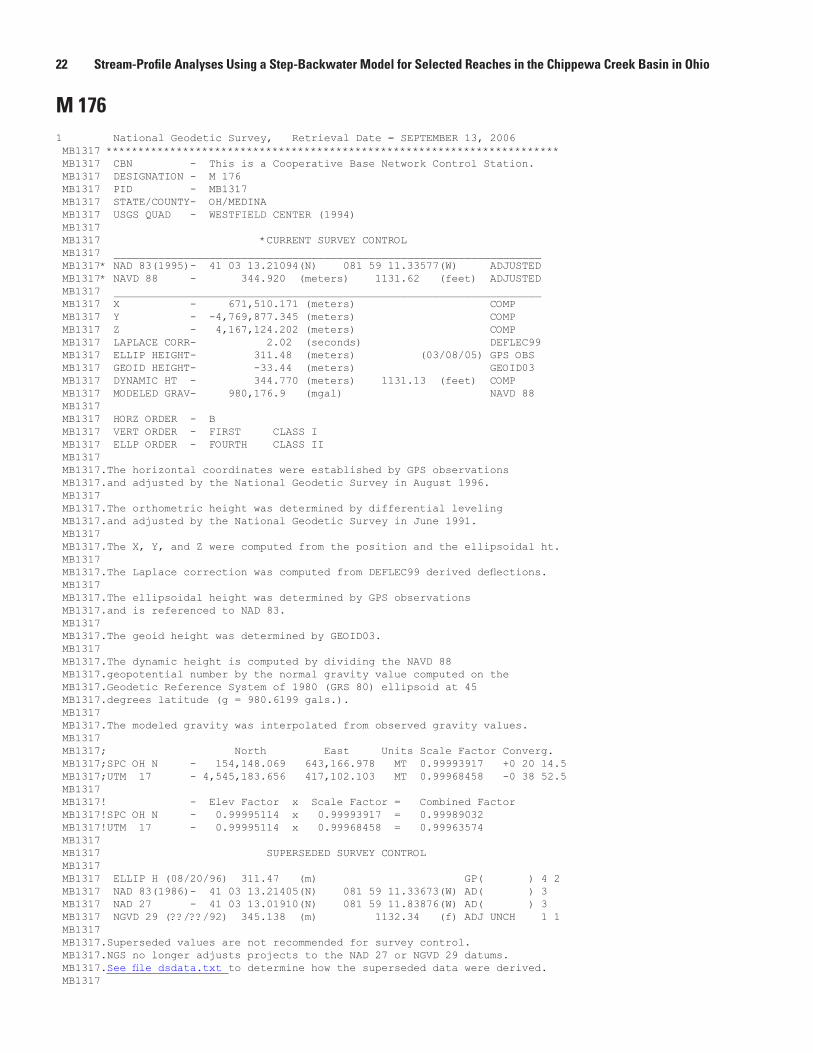
The USGS used Global Positioning System (GPS) static surveys to establish a local control network at pertinent loca-tions near the streams studied. Controls for the surveys were established by means of 10 vertical-control monuments, and 5 of those also were horizontal-control monuments (table 4). The USGS benchmarks (14 CWL and 23 EWB) and the National Geodetic Survey benchmarks (964, F281, H281, R176, M176, E281, CHIP, and N177) are described in Appendix 1. Recommended GPS survey guidelines for establishing local networks (Zilkoski and others, 1997) at accuracies of +/- 5 centimeters were followed, except that no facsimiles/reproductions of monuments (rubbings) were obtained. Real-Time Kinematic GPS survey techniques were used to measure horizontal and vertical data at hydraulic struc-tures and at other pertinent locations. Stream and hydraulic structure geometries were obtained using differential leveling techniques. Third-order accuracy (horizontal and vertical) was maintained for all conventional survey data collected. All surveyed data are horizontally referenced to the North American Datum of 1983 (NAD 83) Ohio State Plane (Ohio North) coordinates and vertically referenced to the North American Vertical Datum of 1988 (NAVD 88).
Selected data collected during the GPS field surveys were used by the USGS to perform quality- control checks of the mapping data provided by Medina, Wayne, Stark, and Summit
Counties. These checks indicate the digital mapping data for this study meet both horizontal and vertical criteria (applicable for digital mapping produced at 1 in. equal to 500 ft with 2-ft contour-interval data) according to the National Standards for Spatial Data Accuracy (Federal Geographic Data Committee, 1998). The radial Root Mean Square Error was 0.11 ft and the vertical Root Mean Square Error was 0.04 ft.
Hydrology
For the streams studied in this investigation (fig. 4), flows were determined from the USGS Ohio StreamStats program (U.S. Geological Survey, 2008). Flows were computed at sev-eral locations on each reach, usually above tributaries along the reach being studied (table 5). StreamStats uses regression equations, based on Koltun and others (2006), with explanato-ry variables of drainage area, main-channel slope, and storage area. The flows associated with the 2-year recurrence interval were used as an estimate of bankfull flows in the models to fa-cilitate comparison of different channel configuration scenari-os. The regression equations used in StreamStats are for rural, unregulated streams and thus are not truly applicable because of the potential influence of the flood-control structures within this basin. Therefore, the 2-year recurrence interval flood-peak flow magnitudes determined with StreamStats may be some-what larger than the actual 2-year recurrence interval flood-peak flows. The computation of reach specific 2-year flood-peak flows in this basin is beyond the scope of this study.

8 Stream-Profile Analyses Using a Step-Backwater Model for Selected Reaches in the Chippewa Creek Basin in Ohio
Table 4. List of benchmarks used to establish a Global Positioning System control network for the surveying of the Chippewa Creek basin and the accuracies of those measurements.
[All monuments are listed in relation to the North American Vertical Datum of 1988 and North American Datum of 1983]
Benchmark name
Published SurveyedDifferences between published and
surveyed values
Easting (feet)Northing
(feet)Elevation
(feet)Easting (feet)
Northing (feet)
Elevation (feet)
Easting (feet)
Northing (feet)
Elevation (feet)
Vertical control monuments
14 CWL1 1006.86 1006.872 -0.01
23 EVB1 1187.54 1187.524 0.02
964 964.78 964.730 0.05
F 281 987.80 987.818 -0.02
H 281 970.38 970.418 -0.04
Vertical and horizontal control monuments
R 176 2127739.740 490818.720 1014.76 2127739.687 490818.642 1014.806 0.05 0.08 -0.05M 176 2110123.661 505734.123 1131.62 2110123.640 505734.135 1131.614 0.02 -0.01 0.01E 281 2167257.306 471404.647 963.30 2167257.345 471404.652 963.302 -0.04 -0.01 0.00CHIP 2172253.527 444678.742 1122.55 2172253.509 444678.658 1122.486 0.02 0.08 0.06N 177 2184737.090 466800.412 958.04 2184737.265 466800.293 957.964 -0.18 0.12 0.08
1 Elevation originally reported in relation to the National Geodetic Vertical Datum of 1929 but converted to the North American Vertical Datum of 1988 with Corpscon software (U.S. Army Corps of Engineers, 2004).
Development of Water-Surface Profiles
The HEC-RAS modeling software (version 4.0.0; U.S. Army Corps of Engineers, 2008a–c) was used to deter-mine water-surface profiles based on approximately bankfull-flow conditions. Hydraulic geometries, flows, and roughness coefficients (Manning’s n) were used as input to the models. All hydraulic analyses in this investigation were based on computations of one-dimensional, steady, gradually varied flow. The analyses were also based on the assumption that flow is unobstructed in all stream channels and through all simulated hydraulic structures. The water-surface profiles for each stream were evaluated independently of the other streams.
Analyses of Open Channels
Abrupt changes in channel cross-section geometry and conveyance from one cross section to the next can result in inaccurate estimation of water-surface profiles because it is difficult to estimate associated energy losses. To help reduce the likelihood of abrupt changes in area and/or conveyance in the hydraulic analyses, the maximum distance between cross sections was limited to no more than 500 ft. Stream channel and overbank roughness coefficients (Manning’s n)
were estimated for all cross sections in the hydraulic mod-els. The HEC-RAS default contraction- and expansion-loss coefficients, 0.1 and 0.3, respectively, were used for most of the cross sections in the models. At select locations, typically upstream and downstream from hydraulic structures and at abrupt changes in the stream channel cross-sectional area, default values for the contraction and expansion-loss coeffi-cients were increased to as much as 0.4 and 0.6, respectively.
In general, the streams studied in the Chippewa Creek basin have a trapezoidal cross-section shape with bottom widths of 6–64 ft and a side slope generally in the range of 2:1–2.5:1. Although small streams frequently exhibit abrupt changes in cross-sectional area and conveyance, due to the channel modifications by the SCS, most reaches in the study area were straight and had gradually varying cross-sectional area.
Starting water-surface elevations for all streams were determined from a normal depth (slope conveyance) calcula-tion in HEC-RAS. The main-channel slope used to compute the normal depth was determined from surveyed cross sections near the downstream limit of each stream reach and assumed to approximate the respective energy-grade-line slopes for the purposes of normal-depth calculations. Values of selected hydraulic parameters used in the hydraulic models are listed in table 3.

Study Methods 9
Table 5. Basin characteristics and approximate bankfull flow at various locations for selected streams in the Chippewa Creek basin.
[ft/mi, feet per mile; mi2, square miles; ft3/s, cubic feet per second]
LocationDrainage area (square miles)
Main-channel slope (feet per mile)
Storage area (percent)
Approximate bankfull flow
(cubic feet per second)
Chippewa Creek
Above State Route 162 / Wedgewood Road1
9.48 37.8 2.39 369
At inlet to Chippewa Lake1 14.8 29.3 2.27 507Above Buck Creek 22.4 23.9 4.76 614Above Westfield Ditch 26.3 20.7 4.31 694Above Hubbard Creek 35.8 14.4 4.11 848Above unnamed tributary 46.1 11.5 3.50 1,020Above Steele Ditch 50.5 9.42 3.58 1,070Above Fall Creek 65.8 8.27 2.85 1,330Above Tommy Run 71.4 7.37 2.72 1,410Above Little Chippewa Creek 80.2 6.42 2.59 1,520Above River Styx 113 6.37 2.05 2,050At Easton Gage (03116200) 146 6.06 2.41 2,440Above Mill Creek 147 5.31 2.42 2,400Above Red Run 155 4.97 2.39 2,490Above Silver Creek 176 4.01 2.31 2,680At mouth 188 3.16 2.48 2,710
River Styx
Above tributary near Blake Road 6.03 70.4 3.68 265Above tributary north of Interstate 76 / State Route 224 9.34 54.1 2.57 379Above Greenwich Road 11.3 44.6 2.73 425Above north tributary 12.3 37.3 2.51 448Above Holmes Brook 14.6 35.5 2.64 506Above Landis Ditch 24.9 25.5 1.95 763At mouth 29.6 23.6 2.63 831
Little Chippewa Creek
Above west tributary 23.4 6.54 0.63 680Above south tributary 26.7 6.00 0.57 751Above Whitman Ditch 28.2 5.50 0.59 772At mouth 32.2 6.37 0.57 875
1 Stream is named The Inlet at this location.

10 Stream-Profile Analyses Using a Step-Backwater Model for Selected Reaches in the Chippewa Creek Basin in Ohio
Analyses of Hydraulic Structures
Four methods for computing losses through bridges are available in HEC-RAS. The energy equation (standard-step method) is applicable to the widest range of hydraulic prob-lems (U.S. Army Corps of Engineers, 2008b). The standard-step method performs computations at bridges basically as open-channel flow, except that adjustments are made to account for the cross-sectional area and wetted perimeter1 within the bridge opening. For most bridges modeled in this study, the energy equation was used to account for energy losses because very few bridges were submerged.
By definition, pressure flow occurs when the water surface on the upstream side of a bridge equals or exceeds the low-chord elevation, a condition that can cause the bridge to function as a pressurized orifice. In these cases, pressure-flow computations are warranted for use in HEC-RAS simulation. The use of this type of solution was checked at all bridges in the hydraulic models where the water-surface elevation derived from the energy equation was found to be within 1.0 ft of the low-chord elevation of a bridge. Review of the HEC-RAS model output indicated that pressure-flow compu-tations were not required.
When road overflow occurs at a culvert, HEC-RAS can use a weir-flow computation to determine the amount of flow passing over the road (U.S. Army Corps of Engineers, 2008c). The validity of the weir-flow computation must be checked by means of a submergence2 test. The model default maxi-mum submergence for weir flow is set to 0.95 (95 percent). For a weir-flow computation to be considered valid, the road embankment must be high enough to cause flow over the road to pass through critical depth3. If a weir flow computation is not valid, computations are based upon contracted open-channel flow. For situations where road grades are submerged, Shearman and others (1986) recommend abandoning culvert and weir hydraulics in favor of composite sections (the com-bination of the road and culvert cross-section geometries) to reflect pseudo-open-channel conditions.
Preliminary HEC-RAS simulation indicated that road overflow would occur at two locations: Chippewa Creek Road at river station 114,595 of the Chippewa Creek model and a private driveway at river station 32,680 of the River Styx model. A check for submergence was done at each location where road overflow occurred to assess the validity of the
weir-flow calculation. The Chippewa Creek Road bridge was modeled by use of the standard step method, and it was sub-merged from backwater from Chippewa Lake; thus, weir flow was not possible. The road grade of the submerged private driveway was not elevated enough to provide sufficient fall for the default weir-flow calculation. The culvert at the private drive was removed and replaced with a composite section.
Reduction of Roughness Coefficient Analysis
To analyze the impact of reducing the roughness in the main channel (for example, as might occur if channels were cleared of vegetation and brush) on the water-surface-eleva-tion profiles, the roughness coefficients for the main channels were reduced by 5, 10, 15, and 20 percent from their base val-ues. These reductions were made along the entire reaches of Chippewa Creek, River Styx, and Little Chippewa Creek, and were applied only to the main channel, not to overbank areas. Table 6 shows the average decrease in the water-surface elevation for each reduction percentage on Chippewa Creek, River Styx, and Little Chippewa Creek. It should be noted that the values in the tables are valid only when all downstream roughness coefficients are similarly reduced. For example, in table 6, a 20-percent reduction in the main channel rough-ness coefficient along Chippewa Creek from Frick Road to State Route 3 will only result in a 0.78-ft decrease in the water-surface elevation if the main-channel roughness is also reduced by 20 percent from the mouth to Frick Road. The water-surface elevation changes shown in these tables are for the discharges used in the models (see table 5).
Results of Hydraulic AnalysesWater-surface profiles corresponding to approximately
bankfull discharges and for selected reductions in roughness coefficients are presented in tabular and graphical formats in Appendix 3. These profiles show the computed water-surface elevations as a function of distance from a reference loca-tion. Reach-averaged reductions in water-surface elevations ranged from 0.11 to 1.29 ft over the four roughness reduction scenarios. Selected results of the final hydraulic analyses done for this study before performance of the decreased roughness-coefficient scenarios are presented in Appendix 2.
The minimum channel elevations at each cross section and the hydraulic structures are shown in figures 3–1, 3–2, and 3–3. All elevations presented in the profile plots are referenced to the NAVD 88. The HEC-RAS model simulations indicated that road overflow would occur at two locations: the Chippewa Creek Road at river station 114,595 of the Chippewa Creek model and a private driveway at river station 32, 680 of the River Styx model (fig. 3–1 and 3–2, respectively). The Chip-pewa Creek Road bridge was submerged from backwater from Chippewa Lake.
1Wetted perimeter is defined as the length of the line of intersection of the channel wetted surface with a cross-section plane normal to the direction flow (Chow, 1959).
2Submergence is defined as the ratio of the depth of water above the minimum weir elevation on the downstream side of a structure divided by the height of the energy grade line above the minimum weir elevation on the upstream side of a structure (U.S. Army Corps of Engineers, 2008c).
3Critical depth is the depth of flow at which the specific energy is a minimum for a given discharge (Chow, 1959).

References Cited 11
Table 6. Average decrease in water-surface elevation, in feet, along the selected reach after decreasing the Manning's roughness coefficient (n) for the main channel by 5, 10, 15, and 20 percent from the base values.
Description of reach
Reach-averaged decrease in water-surface elevation (in feet) for indicated reduction in roughness coefficient (in percent) over the entire length of the main
channel from the base values
5 percent 10 percent 15 percent 20 percent
Chippewa Creek
Mouth to South Main Street 0.32 0.57 0.89 1.29South Main Street to Frick Road 0.31 0.62 0.79 1.13Frick Road to State Route 3 / West Main Street 0.19 0.39 0.55 0.78State Route 3 / West Main Street to Interstate -76 /
State Route 2240.11 0.22 0.32 0.40
Interstate -76 / State Route 224 to Kennard Road 0.13 0.24 0.44 0.60Kennard Road to upper limit 0.18 0.34 0.52 0.71
River Styx
Mouth to low head dam 0.21 0.41 0.54 0.75Low head dam to Interstate -76 / State Route 224 0.11 0.18 0.29 0.39Interstate -76 / State Route 224 to Blake Road 0.11 0.21 0.31 0.39Blake Road to upper limit 0.11 0.20 0.28 0.36
Little Chippewa Creek
Mouth to private road 0.21 0.44 0.57 0.85Private road to State Route 604 / Easton Road 0.23 0.47 0.61 0.89State Route 604 / Easton Road to upper limit 0.23 0.47 0.59 0.85
SummaryThe USGS, in cooperation with the Chippewa Subdistrict
of the Muskingum Watershed Conservancy District, performed hydrologic and hydraulic analyses for selected reaches of three streams in Medina, Wayne, Stark, and Summit Counties in northeast Ohio: Chippewa Creek, Little Chippewa Creek, and River Styx. This study was done to facilitate assessment of various alternatives for mitigating flood hazards in the Chippewa Creek basin.
StreamStats regional regression equations were used to estimate instantaneous peak discharges approximately cor-responding to bankfull flows. Explanatory variables used in the regression equations were drainage area, main-channel slope, and storage area. Hydraulic models were developed to determine water-surface profiles along the three stream reaches studied for the bankfull discharges established in the hydrologic analyses. The HEC-RAS step-backwater hydraulic analysis model was used to determine water-surface profiles for the three streams. Starting water-surface elevations for all streams were established using normal depth computations in the HEC-RAS models. Cross-sectional elevation data, hydraulic-structure geometries, and roughness coefficients were collected in the field and (along with peak-discharge esti-mates) used as input for the models. Reach-averaged reduc-tions in water-surface elevations ranged from 0.11 to 1.29 feet over the four roughness coefficient reduction scenarios.
References CitedChow, V.T., 1959, Open-channel hydraulics: New York,
McGraw-Hill, 680 p.
Federal Emergency Management Agency, 2008, Flood insur-ance study, Medina County, Ohio and incorporated areas: 49 p.
Federal Emergency Management Agency, 2009, Flood insur-ance study, Wayne County, Ohio and incorporated areas: 66 p.
Federal Geographic Data Committee, 1998, National stan-dards for spatial data accuracy, pt. 3 of Geospatial position-ing accuracy standards: Reston, Va., Federal Geographic Data Committee, FGDC–STD–007.3–1998, 25 p., accessed February 22, 2010 at http://www.fgdc.gov/standards/projects/FGDC-standards-projects/accuracy/part3/chapter3.
Koltun, G.F., Kula, S.P., and Puskas, B.M., 2006, A stream-flow statistics (StreamStats) web application for Ohio: U.S. Geological Survey Scientific Investigations Report 2006–5312, 62 p.

12 Stream-Profile Analyses Using a Step-Backwater Model for Selected Reaches in the Chippewa Creek Basin in Ohio
Muskingum Watershed Conservancy District, 1961, Official plan for the Chippewa Subdistrict of Muskingum Watershed Conservancy District: New Philadelphia, Ohio, plan plus 3 amendments added at later dates [variously paged].
Shearman, J.O., Kirby, W.H., Schneider, V.R., and Flippo, H.N., 1986, Bridge waterways analysis model—Research report: Federal Highway Administration Publication FHWA–RD–86–108, 112 p.
U.S. Army Corps of Engineers, 2004, Corpscon, Technical Documentation and Operating Instructions, user’s guide, Version 6.0.1.
U.S. Army Corps of Engineers, 2008a, Hydrologic Engineer-ing Center River Analysis System (HEC-RAS), user’s manual, version 4.0.0: accessed June 5, 2008 at http://www.hec.usace.army.mil/software/hec-ras/hecras-download.html.
U.S. Army Corps of Engineers, 2008b, Hydrologic Engineer-ing Center River Analysis System (HEC-RAS), hydraulic reference manual, version 4.0.0.
U.S. Army Corps of Engineers, 2008c, Hydrologic Engineer-ing Center River Analysis System (HEC-RAS), applications guide, version 4.0.0.
U.S. Bureau of the Census, 2009, County population esti-mates: accessed November 1, 2010, at http://www.census.gov.
U.S. Department of Agriculture, 1956, Work plan for the watershed protection and flood prevention—Chippewa Creek Watershed—Wayne, Medina, Summit, and Stark Counties, Ohio: Soil Conservation Service, [variously paged].
U.S. Department of Agriculture, 1980, Flood hazard study Chippewa Creek, Wayne County, Ohio: Soil Conservation Service, 16 p.
U.S. Geological Survey, 2001, National land cover database: U.S. Geological Survey database, accessed on November 1, 2010, at http://www.mrlc.gov/mrlc2k_ncld.asp.
U.S. Geological Survey, 2008, Ohio StreamStats: accessed November 1, 2010, at http://water.usgs.gov/osw/streamstats/ohio.html.
Zilkoski, D.B., D’Onorfrio, J.D., and Frakes, S.J., 1997, Guidelines for establishing GPS-derived ellipsoid heights (Standards: 2 cm and 5 cm), version 4.3: Silver Spring, Md., National Oceanic and Atmospheric Administration Techni-cal Memorandum NOS NGS–58, 21 p., accessed December 10, 2009 at http://www.ngs.noaa.gov/PUBS_LIB/NGS-58.html.

Appendix 1. Descriptions of Benchmarks
14 CWL
Seville, 2.2 mi NW. of; 0.1 mi SE. of intersection of Interstate Highway 71; 460 ft S. of, and 2 ft lower than centerline of rd. opposite tree line E.; 84 ft N. and 33 ft. E. of centerline of rd. at junction of drive E. to residence of E.S. Paxon 87 ft. ENE. of centerline of B. & O. RR.; 3 ft. NW. of power pole; in concrete post; standard tablet stamped “14 CWL 1952 1008 TT”
Elev 1007.533 (NGVD 29) converted with Corpscon Elevation 1006.86 (NAVD 88)
23 EVB
Poe, 1.6 mi S. of, along State Highway 57; 1.7 mi. N. of Blake; 17 ft N. and 19 ft W. of, and 2 ft lower than centerline of rd opposite fenceline W.; 17 ft N. and 6 ft E. of pole; in W. concrete abutment of culvert; standard tablet stamped “23 EVB 1959 1188”
Elev 1188.186 (NGVD 29) converted with Corpscon Elevation 1187.54 (NAVD 88)

14 Stream-Profile Analyses Using a Step-Backwater Model for Selected Reaches in the Chippewa Creek Basin in Ohio
9641 National Geodetic Survey, Retrieval Date = JULY 14, 2006 KY1726 *********************************************************************** KY1726 DESIGNATION - 964 KY1726 PID - KY1726 KY1726 STATE/COUNTY- OH/WAYNE KY1726 USGS QUAD - RITTMAN (1994) KY1726 KY1726 *CURRENT SURVEY CONTROL KY1726 ___________________________________________________________________ KY1726* NAD 83(1986)- 40 57 56. (N) 081 50 05. (W) SCALED KY1726* NAVD 88 - 294.065 (meters) 964.78 (feet) ADJUSTED KY1726 ___________________________________________________________________ KY1726 GEOID HEIGHT- -33.19 (meters) GEOID03 KY1726 DYNAMIC HT - 293.935 (meters) 964.35 (feet) COMP KY1726 MODELED GRAV- 980,174.9 (mgal) NAVD 88 KY1726 KY1726 VERT ORDER - FIRST CLASS I KY1726 KY1726.The horizontal coordinates were scaled from a topographic map and have KY1726.an estimated accuracy of +/- 6 seconds. KY1726 KY1726.The orthometric height was determined by differential leveling KY1726.and adjusted by the National Geodetic Survey in June 1991. KY1726 KY1726.The geoid height was determined by GEOID03. KY1726 KY1726.The dynamic height is computed by dividing the NAVD 88 KY1726.geopotential number by the normal gravity value computed on the KY1726.Geodetic Reference System of 1980 (GRS 80) ellipsoid at 45 KY1726.degrees latitude (g = 980.6199 gals.). KY1726 KY1726.The modeled gravity was interpolated from observed gravity values. KY1726 KY1726; North East Units Estimated Accuracy KY1726;SPC OH N - 144,450. 656,000. MT (+/- 180 meters Scaled) KY1726 KY1726 SUPERSEDED SURVEY CONTROL KY1726 KY1726 NGVD 29 (??/??/92) 294.273 (m) 965.46 (f) ADJ UNCH 1 1 KY1726 KY1726.Superseded values are not recommended for survey control. KY1726.NGS no longer adjusts projects to the NAD 27 or NGVD 29 datums. KY1726.See file dsdata.txt to determine how the superseded data were derived. KY1726 KY1726_U.S. NATIONAL GRID SPATIAL ADDRESS: 17TMF297352(NAD 83) KY1726_MARKER: DD = SURVEY DISK KY1726_SETTING: 36 = SET IN A MASSIVE STRUCTURE KY1726_SP_SET: BRIDGE KY1726_STAMPING: 964 KY1726_STABILITY: B = PROBABLY HOLD POSITION/ELEVATION WELL KY1726 KY1726 HISTORY - Date Condition Report By KY1726 HISTORY - UNK MONUMENTED USGS KY1726 HISTORY - 1967 GOOD NGS KY1726 HISTORY - 1971 GOOD OHDT KY1726 HISTORY - 1987 GOOD OHDT KY1726 KY1726 STATION DESCRIPTION KY1726 KY1726’DESCRIBED BY NATIONAL GEODETIC SURVEY 1967 KY1726’1.1 MI SE FROM STERLING. KY1726’ABOUT 1.1 MILES SOUTHEAST ALONG THE BALTIMORE AND OHIO RAILROAD KY1726’FROM THE CROSSING OF COUNTY ROAD NO. 60 AT STERLING, IN SECTION KY1726’9, R 12 W, T 18 N, BETWEEN THE BALTIMORE AND OHIO RAILROAD AND KY1726’THE ERIE-LACKAWANNA RAILROAD, NEAR B AND O RAILROAD MILEPOLE KY1726’154-32, 65 FEET WEST OF THE ERIE-LACKAWANNA RAILROAD MILEPOST KY1726’S 223, SET ON TOP OF THE SOUTHEAST END OF THE SOUTHWEST HEADWALL

Appendix 1 15
KY1726’OF A 36-FOOT CONCRETE BRIDGE UNDER THE ERIE-LACKAWANNA RAILROAD, KY1726’46.3 FEET NORTHEAST OF THE NORTHEAST RAIL OF THE B AND O KY1726’RAILROAD, 18 FEET SOUTHWEST OF THE SOUTHWEST RAIL OF THE KY1726’ERIE-LACKAWANNA RAILROAD, 1 FOOT NORTHWEST OF THE SOUTHEAST KY1726’END OF THE HEAD WALL AND ABOUT LEVEL WITH THE ERIE-LACKAWANNA KY1726’RAILROAD. KY1726 KY1726 STATION RECOVERY (1971) KY1726 KY1726’RECOVERY NOTE BY OHIO DEPARTMENT OF TRANSPORTATION 1971 KY1726’RECOVERED IN GOOD CONDITION. KY1726 KY1726 STATION RECOVERY (1987) KY1726 KY1726’RECOVERY NOTE BY OHIO DEPARTMENT OF TRANSPORTATION 1987 (ROS) KY1726’RECOVERED IN GOOD CONDITION.

16 Stream-Profile Analyses Using a Step-Backwater Model for Selected Reaches in the Chippewa Creek Basin in Ohio
F 2811 National Geodetic Survey, Retrieval Date = JULY 14, 2006 KY1827 *********************************************************************** KY1827 DESIGNATION - F 281 KY1827 PID - KY1827 KY1827 STATE/COUNTY- OH/WAYNE KY1827 USGS QUAD - RITTMAN (1994) KY1827 KY1827 *CURRENT SURVEY CONTROL KY1827 ___________________________________________________________________ KY1827* NAD 83(1986)- 40 56 47. (N) 081 47 00. (W) SCALED KY1827* NAVD 88 - 301.082 (meters) 987.80 (feet) ADJUSTED KY1827 ___________________________________________________________________ KY1827 GEOID HEIGHT- -33.14 (meters) GEOID03 KY1827 DYNAMIC HT - 300.950 (meters) 987.37 (feet) COMP KY1827 MODELED GRAV- 980,178.3 (mgal) NAVD 88 KY1827 KY1827 VERT ORDER - SECOND CLASS 0 KY1827 KY1827.The horizontal coordinates were scaled from a topographic map and have KY1827.an estimated accuracy of +/- 6 seconds. KY1827 KY1827.The orthometric height was determined by differential leveling KY1827.and adjusted by the National Geodetic Survey in June 1991. KY1827 KY1827.The geoid height was determined by GEOID03. KY1827 KY1827.The dynamic height is computed by dividing the NAVD 88 KY1827.geopotential number by the normal gravity value computed on the KY1827.Geodetic Reference System of 1980 (GRS 80) ellipsoid at 45 KY1827.degrees latitude (g = 980.6199 gals.). KY1827 KY1827.The modeled gravity was interpolated from observed gravity values. KY1827 KY1827; North East Units Estimated Accuracy KY1827;SPC OH N - 142,360. 660,340. MT (+/- 180 meters Scaled) KY1827 KY1827 SUPERSEDED SURVEY CONTROL KY1827 KY1827 NGVD 29 (??/??/92) 301.338 (m) 988.64 (f) ADJ UNCH 2 0 KY1827 KY1827.Superseded values are not recommended for survey control. KY1827.NGS no longer adjusts projects to the NAD 27 or NGVD 29 datums. KY1827.See file dsdata.txt to determine how the superseded data were derived. KY1827 KY1827_U.S. NATIONAL GRID SPATIAL ADDRESS: 17TMF340331(NAD 83) KY1827_MARKER: DB = BENCH MARK DISK KY1827_SETTING: 30 = SET IN A LIGHT STRUCTURE KY1827_SP_SET: CULVERT KY1827_STAMPING: F 281 1959 KY1827_STABILITY: D = MARK OF QUESTIONABLE OR UNKNOWN STABILITY KY1827 KY1827 HISTORY - Date Condition Report By KY1827 HISTORY - 1959 MONUMENTED CGS KY1827 HISTORY - 1971 GOOD OHDT KY1827 HISTORY - 1987 GOOD OHDT KY1827 KY1827 STATION DESCRIPTION KY1827 KY1827’DESCRIBED BY COAST AND GEODETIC SURVEY 1959 KY1827’1.5 MI S FROM RITTMAN. KY1827’ABOUT 1.5 MILES SOUTH ALONG STATE HIGHWAY 94 FROM THE BALTIMORE KY1827’AND OHIO RAILROAD STATION AT RITTMAN, 78 YARDS NORTH OF THE KY1827’INTERSECTION OF STATE HIGHWAY 604, 22 FEET WEST OF THE CENTER KY1827’LINE OF HIGHWAY 94, IN TOP OF THE SOUTH END OF THE WEST HEAD WALL KY1827’OF A 4-FOOT CONCRETE CULVERT, AND ABOUT 2 1/2 FEET BELOW THE KY1827’LEVEL OF THE HIGHWAY. KY1827

Appendix 1 17
KY1827 STATION RECOVERY (1971) KY1827 KY1827’RECOVERY NOTE BY OHIO DEPARTMENT OF TRANSPORTATION 1971 KY1827’RECOVERED IN GOOD CONDITION. KY1827 KY1827 STATION RECOVERY (1987) KY1827 KY1827’RECOVERY NOTE BY OHIO DEPARTMENT OF TRANSPORTATION 1987 (ROS) KY1827’RECOVERED IN GOOD CONDITION.

18 Stream-Profile Analyses Using a Step-Backwater Model for Selected Reaches in the Chippewa Creek Basin in Ohio
H 2811 National Geodetic Survey, Retrieval Date = JULY 14, 2006 KY1829 *********************************************************************** KY1829 DESIGNATION - H 281 KY1829 PID - KY1829 KY1829 STATE/COUNTY- OH/WAYNE KY1829 USGS QUAD - RITTMAN (1994) KY1829 KY1829 *CURRENT SURVEY CONTROL KY1829 ___________________________________________________________________ KY1829* NAD 83(1986)- 40 55 53. (N) 081 46 52. (W) SCALED KY1829* NAVD 88 - 295.772 (meters) 970.38 (feet) ADJUSTED KY1829 ___________________________________________________________________ KY1829 GEOID HEIGHT- -33.12 (meters) GEOID03 KY1829 DYNAMIC HT - 295.643 (meters) 969.96 (feet) COMP KY1829 MODELED GRAV- 980,177.0 (mgal) NAVD 88 KY1829 KY1829 VERT ORDER - SECOND CLASS 0 KY1829 KY1829.The horizontal coordinates were scaled from a topographic map and have KY1829.an estimated accuracy of +/- 6 seconds. KY1829 KY1829.The orthometric height was determined by differential leveling KY1829.and adjusted by the National Geodetic Survey in June 1991. KY1829 KY1829.The geoid height was determined by GEOID03. KY1829 KY1829.The dynamic height is computed by dividing the NAVD 88 KY1829.geopotential number by the normal gravity value computed on the KY1829.Geodetic Reference System of 1980 (GRS 80) ellipsoid at 45 KY1829.degrees latitude (g = 980.6199 gals.). KY1829 KY1829.The modeled gravity was interpolated from observed gravity values. KY1829 KY1829; North East Units Estimated Accuracy KY1829;SPC OH N - 140,690. 660,540. MT (+/- 180 meters Scaled) KY1829 KY1829 SUPERSEDED SURVEY CONTROL KY1829 KY1829 NGVD 29 (??/??/92) 296.024 (m) 971.21 (f) ADJ UNCH 2 0 KY1829 KY1829.Superseded values are not recommended for survey control. KY1829.NGS no longer adjusts projects to the NAD 27 or NGVD 29 datums. KY1829.See file dsdata.txt to determine how the superseded data were derived. KY1829 KY1829_U.S. NATIONAL GRID SPATIAL ADDRESS: 17TMF342314(NAD 83) KY1829_MARKER: DB = BENCH MARK DISK KY1829_SETTING: 36 = SET IN A MASSIVE STRUCTURE KY1829_SP_SET: ABUTMENT KY1829_STAMPING: H 281 1959 KY1829_STABILITY: B = PROBABLY HOLD POSITION/ELEVATION WELL KY1829 KY1829 HISTORY - Date Condition Report By KY1829 HISTORY - 1959 MONUMENTED CGS KY1829 HISTORY - 19870331 GOOD OHDT KY1829 KY1829 STATION DESCRIPTION KY1829 KY1829’DESCRIBED BY COAST AND GEODETIC SURVEY 1959 KY1829’2.7 MI S FROM RITTMAN. KY1829’ABOUT 2.6 MILES SOUTH ALONG STATE HIGHWAY 94 FROM THE BALTIMORE KY1829’AND OHIO RAILROAD STATION AT RITTMAN, THENCE ABOUT 0.1 MILE KY1829’EAST ALONG ROAD 108, 11 FEET NORTH OF THE CENTER LINE OF ROAD KY1829’108, IN TOP OF THE NORTH END OF THE WEST ABUTMENT OF A 9-FOOT KY1829’CONCRETE BRIDGE OVER A CREEK BRANCH, AND ABOUT LEVEL WITH THE KY1829’ROAD. KY1829 KY1829 STATION RECOVERY (1987)

Appendix 1 19
KY1829 KY1829’RECOVERY NOTE BY OHIO DEPARTMENT OF TRANSPORTATION 1987 (ROS) KY1829’RECOVERED IN GOOD CONDITION

20 Stream-Profile Analyses Using a Step-Backwater Model for Selected Reaches in the Chippewa Creek Basin in Ohio
R 1761 National Geodetic Survey, Retrieval Date = SEPTEMBER 13, 2006 MB1307 *********************************************************************** MB1307 DESIGNATION - R 176 MB1307 PID - MB1307 MB1307 STATE/COUNTY- OH/MEDINA MB1307 USGS QUAD - WESTFIELD CENTER (1994) MB1307 MB1307 *CURRENT SURVEY CONTROL MB1307 ___________________________________________________________________ MB1307* NAD 83(1995)- 41 00 44.74391(N) 081 55 22.68128(W) ADJUSTED MB1307* NAVD 88 - 309.300 (meters) 1014.76 (feet) ADJUSTED MB1307 ___________________________________________________________________ MB1307 X - 677,216.109 (meters) COMP MB1307 Y - -4,772,080.521 (meters) COMP MB1307 Z - 4,163,645.894 (meters) COMP MB1307 LAPLACE CORR- 1.14 (seconds) DEFLEC99 MB1307 ELLIP HEIGHT- 275.95 (meters) (10/07/05) GPS OBS MB1307 GEOID HEIGHT- -33.31 (meters) GEOID03 MB1307 DYNAMIC HT - 309.163 (meters) 1014.31 (feet) COMP MB1307 MODELED GRAV- 980,172.7 (mgal) NAVD 88 MB1307 MB1307 HORZ ORDER - FIRST MB1307 VERT ORDER - FIRST CLASS I MB1307 ELLP ORDER - FOURTH CLASS II MB1307 MB1307.The horizontal coordinates were established by GPS observations MB1307.and adjusted by the TERRASURV in August 2003. MB1307 MB1307.The orthometric height was determined by differential leveling MB1307.and adjusted by the National Geodetic Survey in June 1991. MB1307 MB1307.The X, Y, and Z were computed from the position and the ellipsoidal ht. MB1307 MB1307.The Laplace correction was computed from DEFLEC99 derived deflections. MB1307 MB1307.The ellipsoidal height was determined by GPS observations MB1307.and is referenced to NAD 83. MB1307 MB1307.The geoid height was determined by GEOID03. MB1307 MB1307.The dynamic height is computed by dividing the NAVD 88 MB1307.geopotential number by the normal gravity value computed on the MB1307.Geodetic Reference System of 1980 (GRS 80) ellipsoid at 45 MB1307.degrees latitude (g = 980.6199 gals.). MB1307 MB1307.The modeled gravity was interpolated from observed gravity values. MB1307 MB1307; North East Units Scale Factor Converg. MB1307;SPC OH N - 149,601.845 648,536.370 MT 0.99993960 +0 22 44.7 MB1307;UTM 17 - 4,540,547.004 422,391.171 MT 0.99967413 -0 36 20.5 MB1307 MB1307! - Elev Factor x Scale Factor = Combined Factor MB1307!SPC OH N - 0.99995672 x 0.99993960 = 0.99989632 MB1307!UTM 17 - 0.99995672 x 0.99967413 = 0.99963086 MB1307 MB1307 SUPERSEDED SURVEY CONTROL MB1307 MB1307 ELLIP H (08/20/03) 275.97 (m) GP( ) 4 2 MB1307 NGVD 29 (??/??/92) 309.507 (m) 1015.44 (f) ADJ UNCH 1 1 MB1307 MB1307.Superseded values are not recommended for survey control. MB1307.NGS no longer adjusts projects to the NAD 27 or NGVD 29 datums. MB1307.See file dsdata.txt to determine how the superseded data were derived. MB1307 MB1307_U.S. NATIONAL GRID SPATIAL ADDRESS: 17TMF2239140547(NAD 83) MB1307_MARKER: DB = BENCH MARK DISK MB1307_SETTING: 7 = SET IN TOP OF CONCRETE MONUMENT

Appendix 1 21
MB1307_SP_SET: SET IN TOP OF CONCRETE MONUMENT MB1307_STAMPING: R 176 1954 MB1307_MARK LOGO: NONE MB1307_MAGNETIC: N = NO MAGNETIC MATERIAL MB1307_STABILITY: C = MAY HOLD, BUT OF TYPE COMMONLY SUBJECT TO MB1307+STABILITY: SURFACE MOTION MB1307_SATELLITE: THE SITE LOCATION WAS REPORTED AS SUITABLE FOR MB1307+SATELLITE: SATELLITE OBSERVATIONS - 2000 MB1307 MB1307 HISTORY - Date Condition Report By MB1307 HISTORY - 1954 MONUMENTED CGS MB1307 HISTORY - 1967 GOOD NGS MB1307 HISTORY - 1987 GOOD USPSQD MB1307 HISTORY - 2000 GOOD OH-103 MB1307 MB1307 STATION DESCRIPTION MB1307 MB1307’DESCRIBED BY NATIONAL GEODETIC SURVEY 1967 MB1307’4.4 MI N FROM CRESTON. MB1307’ABOUT 2.8 MILES NORTHWEST ALONG THE BALTIMORE AND OHIO RAILROAD MB1307’FROM THE CROSSING OF STATE HIGHWAY 3 AT CRESTON, THENCE 0.6 MB1307’MILE NORTH ALONG COUNTY ROAD NO. 15, THENCE 0.95 MILE EAST ALONG MB1307’COUNTY ROAD NO. 46, AT THE WESTFIELD AIRPORT, 113 FEET NORTH OF MB1307’THE CENTER LINE OF THE COUNTY ROAD, 110 FEET WEST OF THE MB1307’SOUTHWEST CORNER OF THE TWO-STORIED PORTION OF A WHITE HOUSE, MB1307’46.2 FEET NORTH OF THE NORTHEAST CORNER OF A CONCRETE BLOCK HANGAR MB1307’BUILDING, 2 1/2 FEET SOUTHWEST OF THE SOUTHWEST CORNER OF A CONCRETE MB1307’BASE WHICH FORMERLY SUPPORTED GAS PUMPS, 5 FEET ABOVE THE LEVEL OF THE MB1307’ROAD AND SET IN THE TOP OF A CONCRETE POST PROJECTING 0.1 FOOT ABOVE MB1307’THE LEVEL OF THE GROUND. MB1307 MB1307 STATION RECOVERY (1987) MB1307 MB1307’RECOVERY NOTE BY US POWER SQUADRON 1987 (ROS) MB1307’RECOVERED IN GOOD CONDITION. MB1307 MB1307 STATION RECOVERY (2000) MB1307 MB1307’RECOVERY NOTE BY MEDINA COUNTY OHIO 2000 MB1307’RECOVERY NOTE BY MEDINA COUNTY SANITARY ENGINEER 2000 MB1307’FOUND IN GOOD CONDITION. MB1307’ MB1307’PROPERTY IS NO LONGER AN ACTIVE AIRPORT AND IS NOW A PRIVATE MB1307’RESIDENCE. MB1307’ MB1307’
22 Stream-Profile Analyses Using a Step-Backwater Model for Selected Reaches in the Chippewa Creek Basin in Ohio
M 1761 National Geodetic Survey, Retrieval Date = SEPTEMBER 13, 2006 MB1317 *********************************************************************** MB1317 CBN - This is a Cooperative Base Network Control Station. MB1317 DESIGNATION - M 176 MB1317 PID - MB1317 MB1317 STATE/COUNTY- OH/MEDINA MB1317 USGS QUAD - WESTFIELD CENTER (1994) MB1317 MB1317 *CURRENT SURVEY CONTROL MB1317 ___________________________________________________________________ MB1317* NAD 83(1995)- 41 03 13.21094(N) 081 59 11.33577(W) ADJUSTED MB1317* NAVD 88 - 344.920 (meters) 1131.62 (feet) ADJUSTED MB1317 ___________________________________________________________________ MB1317 X - 671,510.171 (meters) COMP MB1317 Y - -4,769,877.345 (meters) COMP MB1317 Z - 4,167,124.202 (meters) COMP MB1317 LAPLACE CORR- 2.02 (seconds) DEFLEC99 MB1317 ELLIP HEIGHT- 311.48 (meters) (03/08/05) GPS OBS MB1317 GEOID HEIGHT- -33.44 (meters) GEOID03 MB1317 DYNAMIC HT - 344.770 (meters) 1131.13 (feet) COMP MB1317 MODELED GRAV- 980,176.9 (mgal) NAVD 88 MB1317 MB1317 HORZ ORDER - B MB1317 VERT ORDER - FIRST CLASS I MB1317 ELLP ORDER - FOURTH CLASS II MB1317 MB1317.The horizontal coordinates were established by GPS observations MB1317.and adjusted by the National Geodetic Survey in August 1996. MB1317 MB1317.The orthometric height was determined by differential leveling MB1317.and adjusted by the National Geodetic Survey in June 1991. MB1317 MB1317.The X, Y, and Z were computed from the position and the ellipsoidal ht. MB1317 MB1317.The Laplace correction was computed from DEFLEC99 derived deflections. MB1317 MB1317.The ellipsoidal height was determined by GPS observations MB1317.and is referenced to NAD 83. MB1317 MB1317.The geoid height was determined by GEOID03. MB1317 MB1317.The dynamic height is computed by dividing the NAVD 88 MB1317.geopotential number by the normal gravity value computed on the MB1317.Geodetic Reference System of 1980 (GRS 80) ellipsoid at 45 MB1317.degrees latitude (g = 980.6199 gals.). MB1317 MB1317.The modeled gravity was interpolated from observed gravity values. MB1317 MB1317; North East Units Scale Factor Converg. MB1317;SPC OH N - 154,148.069 643,166.978 MT 0.99993917 +0 20 14.5 MB1317;UTM 17 - 4,545,183.656 417,102.103 MT 0.99968458 -0 38 52.5 MB1317 MB1317! - Elev Factor x Scale Factor = Combined Factor MB1317!SPC OH N - 0.99995114 x 0.99993917 = 0.99989032 MB1317!UTM 17 - 0.99995114 x 0.99968458 = 0.99963574 MB1317 MB1317 SUPERSEDED SURVEY CONTROL MB1317 MB1317 ELLIP H (08/20/96) 311.47 (m) GP( ) 4 2 MB1317 NAD 83(1986)- 41 03 13.21405(N) 081 59 11.33673(W) AD( ) 3 MB1317 NAD 27 - 41 03 13.01910(N) 081 59 11.83876(W) AD( ) 3 MB1317 NGVD 29 (??/??/92) 345.138 (m) 1132.34 (f) ADJ UNCH 1 1 MB1317 MB1317.Superseded values are not recommended for survey control. MB1317.NGS no longer adjusts projects to the NAD 27 or NGVD 29 datums. MB1317.See file dsdata.txt to determine how the superseded data were derived. MB1317

Appendix 1 23
MB1317_U.S. NATIONAL GRID SPATIAL ADDRESS: 17TMF1710245184(NAD 83) MB1317_MARKER: DB = BENCH MARK DISK MB1317_SETTING: 7 = SET IN TOP OF CONCRETE MONUMENT MB1317_SP_SET: SQUARE CONCRETE MONUMENT MB1317_STAMPING: M 176 1954 MB1317_MARK LOGO: CGS MB1317_MAGNETIC: N = NO MAGNETIC MATERIAL MB1317_STABILITY: C = MAY HOLD, BUT OF TYPE COMMONLY SUBJECT TO MB1317+STABILITY: SURFACE MOTION MB1317_SATELLITE: THE SITE LOCATION WAS REPORTED AS SUITABLE FOR MB1317+SATELLITE: SATELLITE OBSERVATIONS - 2000 MB1317 MB1317 HISTORY - Date Condition Report By MB1317 HISTORY - 1954 MONUMENTED CGS MB1317 HISTORY - 1967 GOOD NGS MB1317 HISTORY - 1986 GOOD NGS MB1317 HISTORY - 1987 GOOD USPSQD MB1317 HISTORY - 19950724 GOOD NGS MB1317 HISTORY - 19980323 GOOD GCS MB1317 HISTORY - 2000 GOOD OH-103 MB1317 MB1317 STATION DESCRIPTION MB1317 MB1317’DESCRIBED BY NATIONAL GEODETIC SURVEY 1967 MB1317’1.9 MI NE FROM LODI. MB1317’ABOUT 1.9 MILES NORTHEAST ALONG STATE HIGHWAY 421 AND U.S. MB1317’HIGHWAY 42 FROM THE INTERSECTION OF STATE HIGHWAY 76 AT LODI, MB1317’ABOUT 0.6 MILE NORTHEAST ALONG U.S. HIGHWAY 42 FROM THE NORTHEAST MB1317’END OF THE U.S. HIGHWAY 224 OVERPASS, NEAR THE NORTHWEST CORNER MB1317’OF THE LODI AIRPORT, 72 FEET EAST OF THE INTERSECTION OF U.S. MB1317’HIGHWAY 42 AND TOWNSHIP ROAD NO. 78, 30 FEET SOUTHEAST OF THE MB1317’CENTER LINE OF THE HIGHWAY, 30 1/2 FEET NORTH OF THE CENTER LINE MB1317’OF TOWNSHIP ROAD NO. 78, 9 FEET NORTHEAST OF A GAS LINE MARKER MB1317’NO. RDI 989S, 1.1 FEET NORTHEAST OF A METAL WITNESS POST, 2 FEET MB1317’BELOW THE LEVEL OF THE HIGHWAY, SET IN THE TOP OF A CONCRETE POST MB1317’0.2 FOOT UNDERGROUND. MB1317 MB1317 STATION RECOVERY (1986) MB1317 MB1317’RECOVERY NOTE BY NATIONAL GEODETIC SURVEY 1986 MB1317’STATION IS LOCATED ABOUT 2 MILES NORTHEAST OF LODI, 5 MILES WEST MB1317’NORTHWEST OF THE JUNCTION OF INTERSTATE HIGHWAYS 76 AND 71, AT A ROAD MB1317’JUNCTION, ON HIGHWAY RIGHT-OF-WAY. OWNERSHIP OHIO DEPARTMENT OF MB1317’TRANSPORTATION. MB1317’TO REACH FROM THE JUNCTION OF US HIGHWAYS 42 AND 224 AT THE NORTHWEST MB1317’EDGE OF LODI, GO NORTHEAST ON HIGHWAY 42 FOR 0.7 MILES TO A SLANTED MB1317’CROSSROAD AND STATION ON THE RIGHT. MB1317’STATION MARK IS A STANDARD CGS BENCH MARK DISK STAMPED --M 176 1954-- MB1317’SET IN THE TOP OF A 25 CM SQUARE CONCRETE POST 0.4 METER BELOW GROUND MB1317’(AREA IS VERY UNEVEN TO DITCHING AND PIPELINE). IT IS 9.2 METERS MB1317’SOUTHEAST OF THE CENTER OF HIGHWAY 42, 9.8 METERS NORTH OF THE MB1317’CENTER OF COUNTY ROUT 78, 5.6 METERS WEST OF UTILITY POLE 65CR/4-12, MB1317’3.7 METERS EAST OF A UTILITY POLE WITH STEPS, 4.2 METERS NORTHWEST MB1317’OF THE SOUTHWEST ONE OF TWO PIPELINE WARNING POLES, AND 0.3 METER MB1317’NORTHEAST OF A METAL WITNESS POLE. MB1317’DESCRIBED BY G R HEID. MB1317’TYPED BY JAMES MALONEY 9/09/87. MB1317 MB1317 STATION RECOVERY (1987) MB1317 MB1317’RECOVERY NOTE BY US POWER SQUADRON 1987 (ROS) MB1317’RECOVERED IN GOOD CONDITION. MB1317 MB1317 STATION RECOVERY (1995) MB1317 MB1317’RECOVERY NOTE BY NATIONAL GEODETIC SURVEY 1995 (AJL) MB1317’THE STATION IS LOCATED ABOUT 3.2 KM (2.00 MI) NORTHEAST OF LODI, 8.0 MB1317’KM (4.95 MI) WEST NORTHWEST OF THE JUNCTION OF INTERSTATE HIGHWAYS 76 MB1317’AND 71, ON HIGHWAY RIGHT-OF-WAY AT THE JUNCTION OF U S HIGHWAY 42 AND MB1317’KENNARD ROAD. TO REACH FROM THE JUNCTION OF U S HIGHWAYS 224 AND 42

24 Stream-Profile Analyses Using a Step-Backwater Model for Selected Reaches in the Chippewa Creek Basin in Ohio
MB1317’AT THE NORTHEAST EDGE OF LODI, GO NORTHEAST ON HIGHWAY 42 FOR 1.1 KM MB1317’(0.70 MI) TO KENNARD ROAD AND THE STATION ON THE RIGHT. THE STATION MB1317’IS 9.2 M (30.2 FT) SOUTHEAST OF THE CENTER OF HIGHWAY 42, 10.1 M (33.1 MB1317’FT) NORTH OF THE CENTER OF KENNARD ROAD, 5.2 M (17.1 FT) NORTH OF A MB1317’STOP SIGN, 5.6 M (18.4 FT) WEST OF UTILITY POLE NUMBER 65CR/4-12, 3.7 MB1317’M (12.1 FT) EAST OF ANOTHER UTILITY POLE, 0.6 M (2.0 FT) SOUTHEAST OF MB1317’A FIBERGLASS WITNESS POST, AND RECESSED 0.3 M (1.0 FT) BELOW GROUND. MB1317 MB1317 STATION RECOVERY (1998) MB1317 MB1317’RECOVERY NOTE BY GEODETIC CONSULTING SERVICES 1998 (KDZ) MB1317’RECOVERED AS DESCRIBED. MB1317 MB1317 STATION RECOVERY (2000) MB1317 MB1317’RECOVERY NOTE BY MEDINA COUNTY OHIO 2000 MB1317’RECOVERY NOTE BY MEDINA COUNTY SANITARY ENGINEER 2001 MB1317’FOUND AS DESCRIBED IN GOOD CONDITION. MB1317’

Appendix 1 25
E 2811 National Geodetic Survey, Retrieval Date = JULY 14, 2006 KY1826 *********************************************************************** KY1826 DESIGNATION - E 281 KY1826 PID - KY1826 KY1826 STATE/COUNTY- OH/WAYNE KY1826 USGS QUAD - RITTMAN (1994) KY1826 KY1826 *CURRENT SURVEY CONTROL KY1826 ___________________________________________________________________ KY1826* NAD 83(1995)- 40 57 30.01123(N) 081 46 49.27642(W) ADJUSTED KY1826* NAVD 88 - 293.613 (meters) 963.30 (feet) ADJUSTED KY1826 ___________________________________________________________________ KY1826 X - 689,653.610 (meters) COMP KY1826 Y - -4,774,268.115 (meters) COMP KY1826 Z - 4,159,100.872 (meters) COMP KY1826 LAPLACE CORR- 0.30 (seconds) DEFLEC99 KY1826 ELLIP HEIGHT- 260.45 (meters) (10/07/05) GPS OBS KY1826 GEOID HEIGHT- -33.16 (meters) GEOID03 KY1826 DYNAMIC HT - 293.485 (meters) 962.88 (feet) COMP KY1826 MODELED GRAV- 980,179.5 (mgal) NAVD 88 KY1826 KY1826 HORZ ORDER - FIRST KY1826 VERT ORDER - SECOND CLASS 0 KY1826 ELLP ORDER - FOURTH CLASS I KY1826 KY1826.The horizontal coordinates were established by GPS observations KY1826.and adjusted by the National Geodetic Survey in October 2000. KY1826 KY1826.The orthometric height was determined by differential leveling KY1826.and adjusted by the National Geodetic Survey in June 1991. KY1826 KY1826.The X, Y, and Z were computed from the position and the ellipsoidal ht. KY1826 KY1826.The Laplace correction was computed from DEFLEC99 derived deflections. KY1826 KY1826.The ellipsoidal height was determined by GPS observations KY1826.and is referenced to NAD 83. KY1826 KY1826.The geoid height was determined by GEOID03. KY1826 KY1826.The dynamic height is computed by dividing the NAVD 88 KY1826.geopotential number by the normal gravity value computed on the KY1826.Geodetic Reference System of 1980 (GRS 80) ellipsoid at 45 KY1826.degrees latitude (g = 980.6199 gals.). KY1826 KY1826.The modeled gravity was interpolated from observed gravity values. KY1826 KY1826; North East Units Scale Factor Converg. KY1826;SPC OH N - 143,684.424 660,581.348 MT 0.99994095 +0 28 22.0 KY1826;UTM 17 - 4,534,425.189 434,329.388 MT 0.99965308 -0 30 41.6 KY1826 KY1826! - Elev Factor x Scale Factor = Combined Factor KY1826!SPC OH N - 0.99995915 x 0.99994095 = 0.99990010 KY1826!UTM 17 - 0.99995915 x 0.99965308 = 0.99961224 KY1826 KY1826 SUPERSEDED SURVEY CONTROL KY1826 KY1826 ELLIP H (10/25/00) 260.44 (m) GP( ) 4 1 KY1826 NAVD 88 (10/25/00) 293.61 (m) 963.3 (f) LEVELING 3 KY1826 NGVD 29 (??/??/92) 293.874 (m) 964.15 (f) ADJ UNCH 2 0 KY1826 KY1826.Superseded values are not recommended for survey control. KY1826.NGS no longer adjusts projects to the NAD 27 or NGVD 29 datums. KY1826.See file dsdata.txt to determine how the superseded data were derived. KY1826 KY1826_U.S. NATIONAL GRID SPATIAL ADDRESS: 17TMF3432934425(NAD 83) KY1826_MARKER: DB = BENCH MARK DISK

26 Stream-Profile Analyses Using a Step-Backwater Model for Selected Reaches in the Chippewa Creek Basin in Ohio
KY1826_SETTING: 7 = SET IN TOP OF CONCRETE MONUMENT KY1826_SP_SET: SET IN TOP OF CONCRETE MONUMENT KY1826_STAMPING: E 281 1959 KY1826_MARK LOGO: CGS KY1826_MAGNETIC: N = NO MAGNETIC MATERIAL KY1826_STABILITY: C = MAY HOLD, BUT OF TYPE COMMONLY SUBJECT TO KY1826+STABILITY: SURFACE MOTION KY1826_SATELLITE: THE SITE LOCATION WAS REPORTED AS SUITABLE FOR KY1826+SATELLITE: SATELLITE OBSERVATIONS - March 23, 1998 KY1826 KY1826 HISTORY - Date Condition Report By KY1826 HISTORY - 1959 MONUMENTED CGS KY1826 HISTORY - 1971 GOOD OHDT KY1826 HISTORY - 1987 GOOD OHDT KY1826 HISTORY - 19980323 GOOD GCS KY1826 KY1826 STATION DESCRIPTION KY1826 KY1826’DESCRIBED BY COAST AND GEODETIC SURVEY 1959 KY1826’0.6 MI S FROM RITTMAN. KY1826’ABOUT 0.65 MILE SOUTH ALONG STATE HIGHWAY 94 FROM THE BALTIMORE KY1826’AND OHIO RAILROAD STATION AT RITTMAN, 0.25 MILE SOUTH OF THE KY1826’SOUTH ONE OF TWO CONCRETE BRIDGES, 31 FEET EAST OF THE CENTER KY1826’LINE OF THE HIGHWAY AND AT THE OUTSIDE OF A CURVE WITH TANGENTS KY1826’EXTENDING NORTHEAST AND SOUTH, 94 FEET NORTH OF THE NORTH END OF KY1826’EAST CONCRETE HEAD WALL OF A 24-INCH PIPE CULVERT, 20 1/2 FEET KY1826’SOUTH OF A FENCE CORNER, 2 FEET WEST OF A WIRE FENCE, 23 FEET KY1826’SOUTH OF A TELEPHONE POLE, ABOUT 1 1/2 FEET ABOVE THE LEVEL OF KY1826’THE HIGHWAY, AND SET IN TOP OF A CONCRETE POST PROJECTING 3 INCHES. KY1826 KY1826 STATION RECOVERY (1971) KY1826 KY1826’RECOVERY NOTE BY OHIO DEPARTMENT OF TRANSPORTATION 1971 KY1826’RECOVERED IN GOOD CONDITION. KY1826 KY1826 STATION RECOVERY (1987) KY1826 KY1826’RECOVERY NOTE BY OHIO DEPARTMENT OF TRANSPORTATION 1987 (ROS) KY1826’RECOVERED IN GOOD CONDITION. KY1826 KY1826 STATION RECOVERY (1998) KY1826

Appendix 1 27
CHIP1 National Geodetic Survey, Retrieval Date = JULY 14, 2006 KY1839 *********************************************************************** KY1839 DESIGNATION - CHIP KY1839 PID - KY1839 KY1839 STATE/COUNTY- OH/WAYNE KY1839 USGS QUAD - RITTMAN (1994) KY1839 KY1839 *CURRENT SURVEY CONTROL KY1839 ___________________________________________________________________ KY1839* NAD 83(1995)- 40 53 05.52070(N) 081 45 47.09910(W) ADJUSTED KY1839* NAVD 88 - 342.153 (meters) 1122.55 (feet) ADJUSTED KY1839 ___________________________________________________________________ KY1839 X - 691,863.719 (meters) COMP KY1839 Y - -4,779,385.822 (meters) COMP KY1839 Z - 4,152,967.483 (meters) COMP KY1839 LAPLACE CORR- 0.23 (seconds) DEFLEC99 KY1839 ELLIP HEIGHT- 309.09 (meters) (10/07/05) GPS OBS KY1839 GEOID HEIGHT- -33.05 (meters) GEOID03 KY1839 DYNAMIC HT - 342.002 (meters) 1122.05 (feet) COMP KY1839 MODELED GRAV- 980,173.5 (mgal) NAVD 88 KY1839 KY1839 HORZ ORDER - FIRST KY1839 VERT ORDER - SECOND CLASS 0 KY1839 ELLP ORDER - FOURTH CLASS I KY1839 KY1839.The horizontal coordinates were established by GPS observations KY1839.and adjusted by the National Geodetic Survey in October 2000. KY1839 KY1839.The orthometric height was determined by differential leveling KY1839.and adjusted by the National Geodetic Survey in June 1991. KY1839 KY1839.The X, Y, and Z were computed from the position and the ellipsoidal ht. KY1839 KY1839.The Laplace correction was computed from DEFLEC99 derived deflections. KY1839 KY1839.The ellipsoidal height was determined by GPS observations KY1839.and is referenced to NAD 83. KY1839 KY1839.The geoid height was determined by GEOID03. KY1839 KY1839.The dynamic height is computed by dividing the NAVD 88 KY1839.geopotential number by the normal gravity value computed on the KY1839.Geodetic Reference System of 1980 (GRS 80) ellipsoid at 45 KY1839.degrees latitude (g = 980.6199 gals.). KY1839 KY1839.The modeled gravity was interpolated from observed gravity values. KY1839 KY1839; North East Units Scale Factor Converg. KY1839;SPC OH N - 135,538.352 662,104.199 MT 0.99994421 +0 29 02.8 KY1839;UTM 17 - 4,526,256.541 435,711.724 MT 0.99965087 -0 29 58.2 KY1839 KY1839! - Elev Factor x Scale Factor = Combined Factor KY1839!SPC OH N - 0.99995152 x 0.99994421 = 0.99989573 KY1839!UTM 17 - 0.99995152 x 0.99965087 = 0.99960240 KY1839 KY1839|---------------------------------------------------------------------| KY1839| PID Reference Object Distance Geod. Az | KY1839| dddmmss.s | KY1839| KY1838 CHIP RM 1 7.452 METERS 00404 | KY1839| KY3464 DALTON MUN STANDPIPE APPROX.10.7 KM 1535747.4 | KY1839| KY1840 CHIP RM 2 7.699 METERS 17610 | KY1839| KY3494 ORRVILLE MUN LT WATER PLT STK APPROX. 3.8 KM 1830730.2 | KY1839| KY3493 ORRVILLE MUNICIPAL TANK APPROX. 4.9 KM 1832139.5 | KY1839| KY3492 ORRVILLE MILK CO STACK APPROX. 5.6 KM 1922113.3 | KY1839| KY1836 CHIP AZ MK 3583209.9 | KY1839|---------------------------------------------------------------------| KY1839

28 Stream-Profile Analyses Using a Step-Backwater Model for Selected Reaches in the Chippewa Creek Basin in Ohio
KY1839 SUPERSEDED SURVEY CONTROL KY1839 KY1839 ELLIP H (10/25/00) 309.10 (m) GP( ) 4 1 KY1839 NAD 83(1995)- 40 53 05.51978(N) 081 45 47.09676(W) AD( ) 3 KY1839 NAD 83(1986)- 40 53 05.52935(N) 081 45 47.10207(W) AD( ) 3 KY1839 NAD 27 - 40 53 05.32232(N) 081 45 47.62804(W) AD( ) 3 KY1839 NAVD 88 (10/25/00) 342.15 (m) 1122.5 (f) LEVELING 3 KY1839 NGVD 29 (??/??/92) 342.386 (m) 1123.31 (f) ADJ UNCH 2 0 KY1839 KY1839.Superseded values are not recommended for survey control. KY1839.NGS no longer adjusts projects to the NAD 27 or NGVD 29 datums. KY1839.See file dsdata.txt to determine how the superseded data were derived. KY1839 KY1839_U.S. NATIONAL GRID SPATIAL ADDRESS: 17TMF3571226257(NAD 83) KY1839_MARKER: DS = TRIANGULATION STATION DISK KY1839_SETTING: 7 = SET IN TOP OF CONCRETE MONUMENT KY1839_SP_SET: SET IN TOP OF CONCRETE MONUMENT KY1839_STAMPING: CHIP 1959 KY1839_MARK LOGO: CGS KY1839_MAGNETIC: N = NO MAGNETIC MATERIAL KY1839_STABILITY: C = MAY HOLD, BUT OF TYPE COMMONLY SUBJECT TO KY1839+STABILITY: SURFACE MOTION KY1839_SATELLITE: THE SITE LOCATION WAS REPORTED AS SUITABLE FOR KY1839+SATELLITE: SATELLITE OBSERVATIONS - March 23, 1998 KY1839 KY1839 HISTORY - Date Condition Report By KY1839 HISTORY - 1959 MONUMENTED CGS KY1839 HISTORY - 1959 GOOD CGS KY1839 HISTORY - 1971 GOOD OHDT KY1839 HISTORY - 1971 GOOD OHDT KY1839 HISTORY - 1988 GOOD OHDT KY1839 HISTORY - 19980323 GOOD GCS KY1839 KY1839 STATION DESCRIPTION KY1839 KY1839’DESCRIBED BY COAST AND GEODETIC SURVEY 1959 (WER) KY1839’THE STATION IS ABOUT 3 MILES NORTH ORRVILLE, 1-1/2 MILES SOUTHWEST OF KY1839’MARSHALLVILLE, ON THE EAST KY1839’RIGHT-OF-WAY OF STATE HIGHWAY 94, IN BAUGHMAN TOWNSHIP, IN SECTION KY1839’7, T-17-N AND R-11-W. KY1839’ KY1839’TO REACH THE STATION FROM THE INTERSECTION OF MAIN STREET AND MARKET KY1839’STREET IN ORRVILLE, GO KY1839’NORTH ON STATE HIGHWAY 94 FOR 3.1 MILES TO THE STATION ON THE RIGHT. KY1839’ KY1839’STATION MARKS ARE STANDARD DISKS STAMPED CHIP 1959. THE SURFACE DISK KY1839’IS SET IN A SQUARE CONCRETE POST KY1839’FLUSH WITH THE SURFACE OF THE GROUND. IT IS 215 FEET NORTHEAST OF KY1839’THE DRIVEWAY ENTRANCE TO THE HOME OF MR. WILLARD J. KY1839’YEAKLEY, 28 FEET EAST OF THE CENTER LINE OF HIGHWAY 94, 9 FEET NORTH KY1839’OF A POWERLINE POLE FOURTH POLE NORTH OF A FARM KY1839’HOUSE AND 2 FEET WEST OF THE RIGHT-OF-WAY FENCELINE. KY1839’A STANDARD WITNESS POST WAS SET 3.3 FEET NORTHEAST OF THE KY1839’MARK. THE UNDERGROUND DISK IS SET IN AN KY1839’IRREGULAR MASS OF CONCRETE 32 INCHES BELOW THE SURFACE OF THE GROUND. KY1839’ KY1839’REFERENCE MARK NO. 1, A STANDARD DISK STAMPED CHIP NO 1 1959, IS SET KY1839’IN A SQUARE CONCRETE POST KY1839’WHICH PROJECTS 2 INCHES. IT IS 33 FEET NORTH OF THE POWERLINE POLE, KY1839’29 FEET EAST OF THE CENTER LINE OF KY1839’HIGHWAY AND 1 FOOT WEST OF THE RIGHT-OF-WAY FENCELINE. KY1839’ KY1839’REFERENCE MARK NO. 2, A STANDARD DISK STAMPED CHIP NO 2 1959, IS SET KY1839’IN A SQUARE CONCRETE POST KY1839’WHICH PROJECTS 2 INCHES. IT IS 190 FEET NORTHEAST OF THE DRIVEWAY, KY1839’30 FEET EAST OF THE CENTER LINE KY1839’OF HIGHWAY, 17 FEET SOUTH OF THE POWERLINE POLE AND 1 KY1839’FOOT WEST OF THE RIGHT-OF-WAY FENCELINE. KY1839’ KY1839’AZIMUTH MARK, A STANDARD DISK STAMPED CHIP 1959, IS SET IN A SQUARE
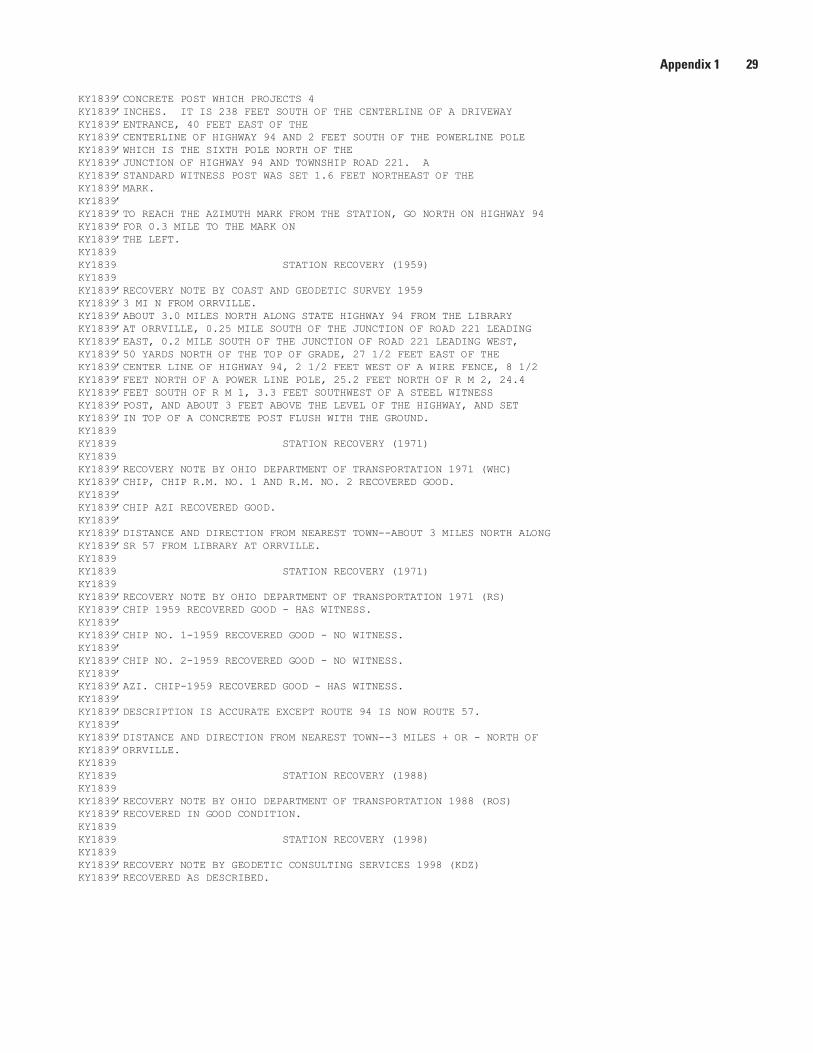
Appendix 1 29
KY1839’CONCRETE POST WHICH PROJECTS 4 KY1839’INCHES. IT IS 238 FEET SOUTH OF THE CENTERLINE OF A DRIVEWAY KY1839’ENTRANCE, 40 FEET EAST OF THE KY1839’CENTERLINE OF HIGHWAY 94 AND 2 FEET SOUTH OF THE POWERLINE POLE KY1839’WHICH IS THE SIXTH POLE NORTH OF THE KY1839’JUNCTION OF HIGHWAY 94 AND TOWNSHIP ROAD 221. A KY1839’STANDARD WITNESS POST WAS SET 1.6 FEET NORTHEAST OF THE KY1839’MARK. KY1839’ KY1839’TO REACH THE AZIMUTH MARK FROM THE STATION, GO NORTH ON HIGHWAY 94 KY1839’FOR 0.3 MILE TO THE MARK ON KY1839’THE LEFT. KY1839 KY1839 STATION RECOVERY (1959) KY1839 KY1839’RECOVERY NOTE BY COAST AND GEODETIC SURVEY 1959 KY1839’3 MI N FROM ORRVILLE. KY1839’ABOUT 3.0 MILES NORTH ALONG STATE HIGHWAY 94 FROM THE LIBRARY KY1839’AT ORRVILLE, 0.25 MILE SOUTH OF THE JUNCTION OF ROAD 221 LEADING KY1839’EAST, 0.2 MILE SOUTH OF THE JUNCTION OF ROAD 221 LEADING WEST, KY1839’50 YARDS NORTH OF THE TOP OF GRADE, 27 1/2 FEET EAST OF THE KY1839’CENTER LINE OF HIGHWAY 94, 2 1/2 FEET WEST OF A WIRE FENCE, 8 1/2 KY1839’FEET NORTH OF A POWER LINE POLE, 25.2 FEET NORTH OF R M 2, 24.4 KY1839’FEET SOUTH OF R M 1, 3.3 FEET SOUTHWEST OF A STEEL WITNESS KY1839’POST, AND ABOUT 3 FEET ABOVE THE LEVEL OF THE HIGHWAY, AND SET KY1839’IN TOP OF A CONCRETE POST FLUSH WITH THE GROUND. KY1839 KY1839 STATION RECOVERY (1971) KY1839 KY1839’RECOVERY NOTE BY OHIO DEPARTMENT OF TRANSPORTATION 1971 (WHC) KY1839’CHIP, CHIP R.M. NO. 1 AND R.M. NO. 2 RECOVERED GOOD. KY1839’ KY1839’CHIP AZI RECOVERED GOOD. KY1839’ KY1839’DISTANCE AND DIRECTION FROM NEAREST TOWN--ABOUT 3 MILES NORTH ALONG KY1839’SR 57 FROM LIBRARY AT ORRVILLE. KY1839 KY1839 STATION RECOVERY (1971) KY1839 KY1839’RECOVERY NOTE BY OHIO DEPARTMENT OF TRANSPORTATION 1971 (RS) KY1839’CHIP 1959 RECOVERED GOOD - HAS WITNESS. KY1839’ KY1839’CHIP NO. 1-1959 RECOVERED GOOD - NO WITNESS. KY1839’ KY1839’CHIP NO. 2-1959 RECOVERED GOOD - NO WITNESS. KY1839’ KY1839’AZI. CHIP-1959 RECOVERED GOOD - HAS WITNESS. KY1839’ KY1839’DESCRIPTION IS ACCURATE EXCEPT ROUTE 94 IS NOW ROUTE 57. KY1839’ KY1839’DISTANCE AND DIRECTION FROM NEAREST TOWN--3 MILES + OR - NORTH OF KY1839’ORRVILLE. KY1839 KY1839 STATION RECOVERY (1988) KY1839 KY1839’RECOVERY NOTE BY OHIO DEPARTMENT OF TRANSPORTATION 1988 (ROS) KY1839’RECOVERED IN GOOD CONDITION. KY1839 KY1839 STATION RECOVERY (1998) KY1839 KY1839’RECOVERY NOTE BY GEODETIC CONSULTING SERVICES 1998 (KDZ) KY1839’RECOVERED AS DESCRIBED.

30 Stream-Profile Analyses Using a Step-Backwater Model for Selected Reaches in the Chippewa Creek Basin in Ohio
N 1771 National Geodetic Survey, Retrieval Date = JULY 14, 2006 KY1710 *********************************************************************** KY1710 DESIGNATION - N 177 KY1710 PID - KY1710 KY1710 STATE/COUNTY- OH/WAYNE KY1710 USGS QUAD - DOYLESTOWN (1994) KY1710 KY1710 *CURRENT SURVEY CONTROL KY1710 ___________________________________________________________________ KY1710* NAD 83(1995)- 40 56 43.02942(N) 081 43 01.98467(W) ADJUSTED KY1710* NAVD 88 - 292.011 (meters) 958.04 (feet) ADJUSTED KY1710 ___________________________________________________________________ KY1710 X - 695,050.831 (meters) COMP KY1710 Y - -4,774,444.119 (meters) COMP KY1710 Z - 4,158,005.200 (meters) COMP KY1710 LAPLACE CORR- 0.22 (seconds) DEFLEC99 KY1710 ELLIP HEIGHT- 258.88 (meters) (10/07/05) GPS OBS KY1710 GEOID HEIGHT- -33.13 (meters) GEOID03 KY1710 DYNAMIC HT - 291.882 (meters) 957.62 (feet) COMP KY1710 MODELED GRAV- 980,175.8 (mgal) NAVD 88 KY1710 KY1710 HORZ ORDER - FIRST KY1710 VERT ORDER - FIRST CLASS I KY1710 ELLP ORDER - FOURTH CLASS I KY1710 KY1710.The horizontal coordinates were established by GPS observations KY1710.and adjusted by the National Geodetic Survey in April 1998. KY1710 KY1710.The orthometric height was determined by differential leveling KY1710.and adjusted by the National Geodetic Survey in June 1991. KY1710 KY1710.The X, Y, and Z were computed from the position and the ellipsoidal ht. KY1710 KY1710.The Laplace correction was computed from DEFLEC99 derived deflections. KY1710 KY1710.The ellipsoidal height was determined by GPS observations KY1710.and is referenced to NAD 83. KY1710 KY1710.The geoid height was determined by GEOID03. KY1710 KY1710.The dynamic height is computed by dividing the NAVD 88 KY1710.geopotential number by the normal gravity value computed on the KY1710.Geodetic Reference System of 1980 (GRS 80) ellipsoid at 45 KY1710.degrees latitude (g = 980.6199 gals.). KY1710 KY1710.The modeled gravity was interpolated from observed gravity values. KY1710 KY1710; North East Units Scale Factor Converg. KY1710;SPC OH N - 142,281.050 665,909.197 MT 0.99994141 +0 30 51.3 KY1710;UTM 17 - 4,532,930.936 439,630.793 MT 0.99964485 -0 28 12.1 KY1710 KY1710! - Elev Factor x Scale Factor = Combined Factor KY1710!SPC OH N - 0.99995939 x 0.99994141 = 0.99990081 KY1710!UTM 17 - 0.99995939 x 0.99964485 = 0.99960426 KY1710 KY1710 SUPERSEDED SURVEY CONTROL KY1710 KY1710 ELLIP H (04/01/98) 258.93 (m) GP( ) 4 1 KY1710 NAD 83(1986)- 40 56 43.03737(N) 081 43 01.98939(W) AD( ) 1 KY1710 NGVD 29 (??/??/92) 292.214 (m) 958.71 (f) ADJ UNCH 1 1 KY1710 KY1710.Superseded values are not recommended for survey control. KY1710.NGS no longer adjusts projects to the NAD 27 or NGVD 29 datums. KY1710.See file dsdata.txt to determine how the superseded data were derived. KY1710 KY1710_U.S. NATIONAL GRID SPATIAL ADDRESS: 17TMF3963132931(NAD 83) KY1710_MARKER: DB = BENCH MARK DISK

Appendix 1 31
KY1710_SETTING: 7 = SET IN TOP OF CONCRETE MONUMENT KY1710_SP_SET: SET IN TOP OF CONCRETE MONUMENT KY1710_STAMPING: N 177 1954 KY1710_STABILITY: C = MAY HOLD, BUT OF TYPE COMMONLY SUBJECT TO KY1710+STABILITY: SURFACE MOTION KY1710_SATELLITE: THE SITE LOCATION WAS REPORTED AS SUITABLE FOR KY1710+SATELLITE: SATELLITE OBSERVATIONS - October 19, 1983 KY1710 KY1710 HISTORY - Date Condition Report By KY1710 HISTORY - 1954 MONUMENTED CGS KY1710 HISTORY - 1967 GOOD NGS KY1710 HISTORY - 1971 GOOD OHDT KY1710 HISTORY - 19831019 GOOD KY1710 HISTORY - 1987 GOOD OHDT KY1710 HISTORY - 20031024 GOOD USPSQD KY1710 KY1710 STATION DESCRIPTION KY1710 KY1710’DESCRIBED BY NATIONAL GEODETIC SURVEY 1967 KY1710’3.8 MI SE FROM RITTMAN. KY1710’ABOUT 3.85 MILES SOUTHEAST ALONG THE BALTIMORE AND OHIO RAILROAD KY1710’FROM THE STATION AT RITTMAN, IN SECTION 21, R 11 W, T 18 N, 81 KY1710’FEET SOUTHWEST OF AND ACROSS THE TRACK FROM MILEPOLE 148-5, KY1710’69 FEET SOUTH OF THE CENTER OF THE CROSSING OF TOWNSHIP ROAD KY1710’NO. 15 AND THE SOUTHWEST ONE OF TWO TRACKS, 42.2 FEET SOUTHWEST KY1710’OF THE SOUTHWEST RAIL OF THE SOUTHWEST TRACK, 23 FEET SOUTHEAST KY1710’OF THE CENTER LINE OF THE ROAD, 2 1/2 FEET NORTHEAST OF A FENCE KY1710’CORNER, 1 FOOT SOUTHEAST OF A METAL WITNESS POST, 2 1/2 FEET KY1710’BELOW THE LEVEL OF THE TRACK AND SET IN THE TOP OF A CONCRETE KY1710’POST PROJECTING 0.2 FOOT ABOVE THE LEVEL OF THE GROUND. KY1710’NOTE-- MARK MAY BE REACHED BY GOING 4.15 MILES NORTHWEST ALONG KY1710’THE BALTIMORE AND OHIO RAILROAD FROM THE SWITCH TOWER AT WARWICK. KY1710 KY1710 STATION RECOVERY (1971) KY1710 KY1710’RECOVERY NOTE BY OHIO DEPARTMENT OF TRANSPORTATION 1971 KY1710’RECOVERED IN GOOD CONDITION. KY1710 KY1710 STATION RECOVERY (1983) KY1710 KY1710’RECOVERED 1983 KY1710’RECOVERED IN GOOD CONDITION. KY1710 KY1710 STATION RECOVERY (1987) KY1710 KY1710’RECOVERY NOTE BY OHIO DEPARTMENT OF TRANSPORTATION 1987 (ROS) KY1710’RECOVERED IN GOOD CONDITION. KY1710 KY1710 STATION RECOVERY (2003) KY1710 KY1710’RECOVERY NOTE BY US POWER SQUADRON 2003 KY1710’RECOVERED IN GOOD CONDITION.


Appendix 2. Selected Hydrologic Engineers Center’s River Analysis System Output for Chippewa Creek, Westfield Ditch, River Styx, and Little Chippewa Creek

34 Stream-Profile Analyses Using a Step-Backwater Model for Selected Reaches in the Chippewa Creek Basin in Ohio
Table 2–1. Selected Hydrologic Engineers Center’s River Analysis System output for Chippewa Creek, Medina, Wayne, and Summit Counties, Ohio.—Continued
[ft3/s, cubic feet per second; ft, feet; ft/ft, foot per foot; ft/s, feet per second; ft2, square feet]
River station1
Streamflow (ft3/s)
Minimum elevation
in channel (ft)
Water-surface
elevation (ft)
Energy grade
elevation (ft)
Energy grade slope
(ft/ft)
Mean velocity in
channel (ft/s)
Flow area (ft2)
Top width (ft)
Froude number in channel
369 2710 929.5 942.18 942.28 0.000167 2.56 1080.69 1236 0.14647 2710 929.5 942.22 942.34 0.000194 2.68 1010.86 880 0.15751 2710 931.3 942.23 942.38 0.00032 3.06 891.31 252 0.19766 Railroad (bridge)777 2710 931.3 942.32 942.46 0.000321 3.03 900.53 253 0.19914 2710 931.1 942.35 942.53 0.000416 3.4 798.05 222 0.21
1000 2710 930.8 942.44 942.56 0.000224 2.78 1062.5 356 0.161288 2710 929.9 942.53 942.61 0.000142 2.29 1209.58 918 0.131500 2710 929.2 942.56 942.65 0.000157 2.39 1145.5 675 0.141768 2710 928.3 942.55 942.74 0.000353 3.42 804.68 765 0.191797 2710 928.5 942.62 942.76 0.000291 3 904.49 411 0.171822 North Lawrence Road / Deerfield Road / South 2nd Avenue (bridge)
1845 2710 928.5 942.66 942.8 0.000289 2.98 908.45 96.5 0.171893 2710 928.3 942.71 942.82 0.000183 2.61 1043.61 113 0.142372 2710 928.6 942.81 942.9 0.000136 2.36 1498.01 526 0.122796 2710 928.9 942.87 942.95 0.00013 2.28 1850.79 845 0.123092 2710 929.1 942.92 942.99 0.000124 2.16 1868.78 865 0.123512 2710 929.3 942.98 943.04 0.000141 2.14 2095.95 1107 0.123970 2710 929.6 943.03 943.12 0.000191 2.53 1340.56 929 0.144442 2710 929.9 943.12 943.21 0.000168 2.46 1248.37 975 0.134834 2710 930.2 943.17 943.31 0.000281 3.03 894.31 984 0.174896 2710 928.9 943.18 943.33 0.000279 3.04 891.79 98.1 0.174962 State Route 21 / Great Lakes Boulevard (bridge)5019 2710 928.9 943.19 943.41 0.000474 3.76 727.6 98.2 0.225251 2710 931.5 943.38 943.52 0.000296 3 922.9 569 0.175582 2710 930.9 943.5 943.6 0.000196 2.6 1091.74 1088 0.145891 2710 930.3 943.56 943.66 0.000171 2.53 1094.44 1237 0.136167 2710 929.8 943.62 943.7 0.00014 2.38 1178.77 1297 0.126488 2710 929.1 943.67 943.74 0.000112 2.17 1269.05 1100 0.116760 2710 928.6 943.7 943.78 0.000114 2.22 1235.52 818 0.116997 2710 928.2 943.74 943.8 0.000102 2.08 1303.3 596 0.17195 2710 927.8 943.76 943.82 0.000087 2.04 1354.23 426 0.17480 2710 927.3 943.78 943.85 0.000099 2.07 1334.94 481 0.17669 2710 926.9 943.78 943.89 0.0002 2.64 1051.74 394 0.147808 2710 930.2 943.8 943.93 0.000284 2.89 940.63 211 0.167831 Railroad (bridge)7851 2710 930.2 943.81 943.94 0.000302 2.91 932.2 100 0.167978 2710 930.8 943.84 943.99 0.000321 3.12 903.68 1307 0.178289 2710 930.9 943.98 944.07 0.000168 2.45 1249.3 1411 0.138451 2710 930.9 944.02 944.1 0.000142 2.26 1766.35 1418 0.128779 2710 931 944.08 944.14 0.000129 2.13 1962.87 1575 0.11
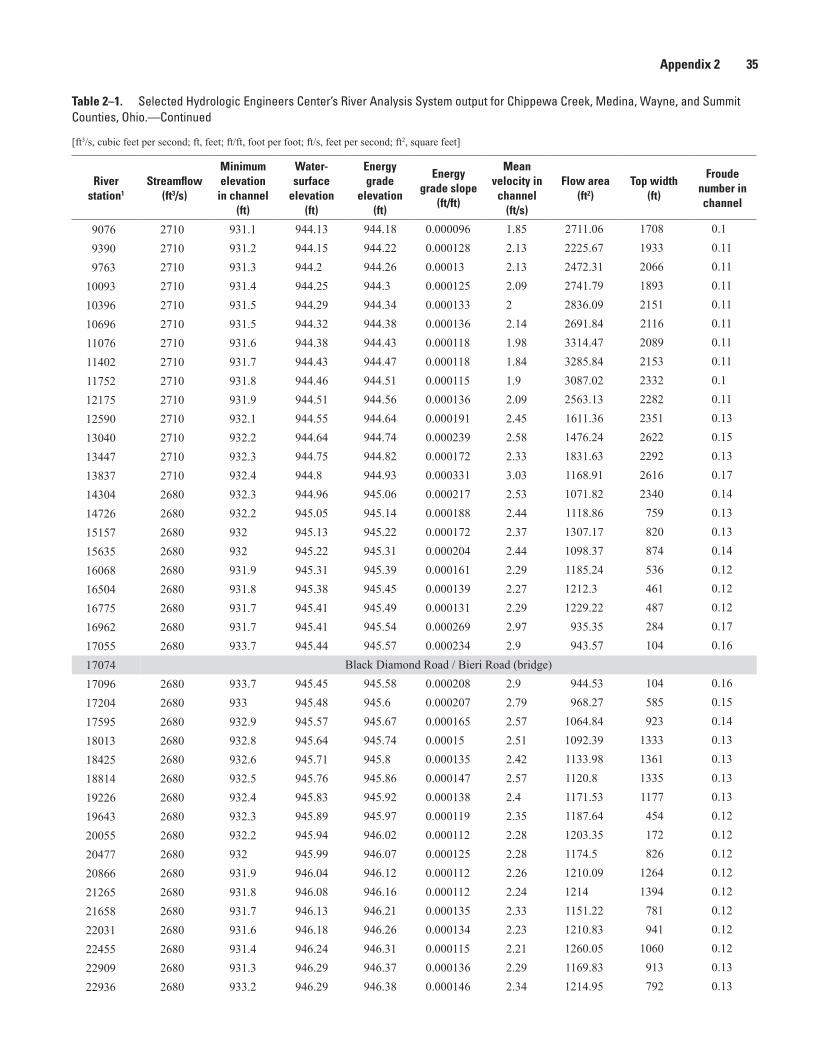
Appendix 2 35
Table 2–1. Selected Hydrologic Engineers Center’s River Analysis System output for Chippewa Creek, Medina, Wayne, and Summit Counties, Ohio.—Continued
[ft3/s, cubic feet per second; ft, feet; ft/ft, foot per foot; ft/s, feet per second; ft2, square feet]
River station1
Streamflow (ft3/s)
Minimum elevation
in channel (ft)
Water-surface
elevation (ft)
Energy grade
elevation (ft)
Energy grade slope
(ft/ft)
Mean velocity in
channel (ft/s)
Flow area (ft2)
Top width (ft)
Froude number in channel
907693909763
1009310396106961107611402117521217512590130401344713837143041472615157156351606816504167751696217055170741709617204175951801318425188141922619643200552047720866212652165822031224552290922936
27102710271027102710271027102710271027102710271027102710268026802680268026802680268026802680
26802680268026802680268026802680268026802680268026802680268026802680
931.1931.2931.3931.4931.5931.5931.6931.7931.8931.9932.1932.2932.3932.4932.3932.2932932931.9931.8931.7931.7933.7
933.7933932.9932.8932.6932.5932.4932.3932.2932931.9931.8931.7931.6931.4931.3933.2
944.13944.15944.2944.25944.29944.32944.38944.43944.46944.51944.55944.64944.75944.8944.96945.05945.13945.22945.31945.38945.41945.41945.44
945.45945.48945.57945.64945.71945.76945.83945.89945.94945.99946.04946.08946.13946.18946.24946.29946.29
944.18 0.000096 1.85944.22 0.000128 2.13944.26 0.00013 2.13944.3 0.000125 2.09944.34 0.000133 2944.38 0.000136 2.14944.43 0.000118 1.98944.47 0.000118 1.84944.51 0.000115 1.9944.56 0.000136 2.09944.64 0.000191 2.45944.74 0.000239 2.58944.82 0.000172 2.33944.93 0.000331 3.03945.06 0.000217 2.53945.14 0.000188 2.44945.22 0.000172 2.37945.31 0.000204 2.44945.39 0.000161 2.29945.45 0.000139 2.27945.49 0.000131 2.29945.54 0.000269 2.97945.57 0.000234 2.9
Black Diamond Road / Bieri Road (bridge)945.58 0.000208 2.9945.6 0.000207 2.79945.67 0.000165 2.57945.74 0.00015 2.51945.8 0.000135 2.42945.86 0.000147 2.57945.92 0.000138 2.4945.97 0.000119 2.35946.02 0.000112 2.28946.07 0.000125 2.28946.12 0.000112 2.26946.16 0.000112 2.24946.21 0.000135 2.33946.26 0.000134 2.23946.31 0.000115 2.21946.37 0.000136 2.29946.38 0.000146 2.34
2711.062225.672472.312741.792836.092691.843314.473285.843087.022563.131611.361476.241831.631168.911071.821118.861307.171098.371185.241212.31229.22935.35943.57
944.53968.27
1064.841092.391133.981120.81171.531187.641203.351174.51210.0912141151.221210.831260.051169.831214.95
170819332066189321512116208921532332228223512622229226162340759820874536461487284104
104585923
1333136113351177454172826
12641394781941
1060913792
0.10.110.110.110.110.110.110.110.10.110.130.150.130.170.140.130.130.140.120.120.120.170.16
0.160.150.140.130.130.130.130.120.120.120.120.120.120.120.120.130.13

36 Stream-Profile Analyses Using a Step-Backwater Model for Selected Reaches in the Chippewa Creek Basin in Ohio
Table 2–1. Selected Hydrologic Engineers Center’s River Analysis System output for Chippewa Creek, Medina, Wayne, and Summit Counties, Ohio.—Continued
[ft3/s, cubic feet per second; ft, feet; ft/ft, foot per foot; ft/s, feet per second; ft2, square feet]
River station1
Streamflow (ft3/s)
Minimum elevation
in channel (ft)
Water-surface
elevation (ft)
Energy grade
elevation (ft)
Energy grade slope
(ft/ft)
Mean velocity in
channel (ft/s)
Flow area (ft2)
Top width (ft)
Froude number in channel
2295522976230702330223725241372448824885252382557225962263702670427089274002778528246283462837328391285172886129199295922986530191304843079431146315783201132479329513336033751341553427734314343483445134776
26802680268026802680268026802680268026802490249024902490249024902490
249024902490249024902400240024002400240024002400240024002400240024402440
244024402440
933.2934933.9933.8933.7933.6933.5933.5933.4933.3933.2933.1933932.9932.8932.7932.6
932.6933.1933.2933.4933.5933.6933.8933.9934934.2934.3934.5934.7934.9935.1935.2935.4934.7
934.7935.2935.3
Coal Bank Road (bridge946.3 946.39 0.000168 2.43 1276.37946.37 946.42 0.000116 2 2035.39946.38 946.45 0.000134 2.28 1650.45946.43 946.52 0.000142 2.41 1399.42946.5 946.58 0.000138 2.33 1784.71946.57 946.62 0.000118 2.05 2293.49946.63 946.66 0.000075 1.64 3333.21946.65 946.7 0.000116 1.99 1936.18946.69 946.74 0.000114 2.04 1906.83946.72 946.8 0.000146 2.28 1365.03946.81 946.85 0.000097 1.81 1653.88946.83 946.9 0.000127 2.16 1178.08946.88 946.94 0.000113 2.09 1209.43946.91 946.98 0.000114 2.1 1183.78946.95 947.03 0.000131 2.19 1137.42947.01 947.11 0.000185 2.52 996.85947.02 947.14 0.000245 2.68 928.42
Porr Road / Township Road 261 (bridge)947.04 947.15 0.000244 2.68 929.63947.06 947.18 0.000203 2.69 954.5947.16 947.23 0.000124 2.16 1202.39947.2 947.28 0.000139 2.28 1106.45947.26 947.34 0.000163 2.29 1089.15947.3 947.38 0.000168 2.31 1040.53947.36 947.44 0.00017 2.31 1036.86947.41 947.49 0.000181 2.35 1020.78947.46 947.54 0.000141 2.24 1072.42947.51 947.59 0.000148 2.26 1060.75947.58 947.66 0.00015 2.26 1062.01947.65 947.72 0.000145 2.21 1085.38947.72 947.8 0.000172 2.3 1043.47947.8 947.87 0.000138 2.17 1107.91947.85 947.93 0.000156 2.27 1059.28947.91 948 0.000162 2.33 1028.79947.97 948.07 0.000184 2.57 968.36948 948.09 0.00016 2.54 1028.13
State Route 95 / State Route 585 / Akron Road / Mt Eaton Road (bridge)948.02 948.12 0.000159 2.5 1033.22948.04 948.14 0.000192 2.45 999.49948.11 948.2 0.000176 2.4 1015.24
849928938776
1093993
13481275186025051970249526122009207020242597
2206166323031506146021081265233222164103108110110108102307121
193925784
0.140.110.130.130.130.110.090.110.110.120.10.120.110.110.120.140.16
0.160.140.110.120.130.130.130.130.120.120.120.120.130.120.130.130.140.13
0.130.140.13

Appendix 2 37
Table 2–1. Selected Hydrologic Engineers Center’s River Analysis System output for Chippewa Creek, Medina, Wayne, and Summit Counties, Ohio.—Continued
[ft3/s, cubic feet per second; ft, feet; ft/ft, foot per foot; ft/s, feet per second; ft2, square feet]
River station1
Streamflow (ft3/s)
Minimum elevation
in channel (ft)
Water-surface
elevation (ft)
Energy grade
elevation (ft)
Energy grade slope
(ft/ft)
Mean velocity in
channel (ft/s)
Flow area (ft2)
Top width (ft)
Froude number in channel
35181355803603936176364673693237314377393810938526389663929439586398464010340426408224117741321413504137741438417884222642620430124344743912443024466945144451964520545206452414566446034464094661746739
2440244024402440244024402440244024402440244024402440244024402440244024402440
244024402440205020502050205020502050205020502050
2050205020501520152015201520
935.4935.5935.7935.7935.8935.9936936.1936.2936.4936.5936.6936.7936.7936.8936.9937937.1937.1
937.1937.3937.1936.9936.7936.5936.2936935.8935.6935.3938.8
940.8940.8940.6940.4940.2940.1939.3
948.18948.24948.32948.34948.41948.49948.54948.62948.69948.76948.83948.88948.94948.98949.02949.07949.16949.23949.26
949.28949.29949.37949.46949.52949.59949.67949.76949.81949.87949.94949.94
949.99950950.13950.25950.38950.41950.41
948.27 0.000158 2.33948.33 0.000172 2.38948.41 0.000175 2.4948.44 0.000203 2.51948.49 0.000164 2.39948.57 0.000145 2.27948.63 0.00017 2.35948.71 0.000189 2.43948.77 0.000169 2.37948.84 0.000168 2.35948.92 0.00016 2.33948.97 0.000168 2.36949.02 0.000164 2.32949.06 0.000165 2.33949.1 0.000165 2.32949.16 0.000191 2.41949.24 0.000183 2.24949.31 0.0002 2.22949.33 0.000162 2.15
State Route 57 / Wadsworth Road (bridge)949.35 0.000161 2.14949.37 0.000225 2.29949.45 0.000211 2.28949.53 0.000165 2.18949.6 0.000181 2.28949.67 0.000175 2.26949.75 0.000184 2.28949.82 0.000143 2.11949.88 0.000155 2.12949.94 0.00015 2.1950 0.000122 2.04950.01 0.000157 2.18
Low head dam (inline structure)950.11 0.00032 2.77950.12 0.000319 2.76950.25 0.000298 2.76950.36 0.000318 2.74950.46 0.000193 2.25950.52 0.000298 2.7950.62 0.000713 3.69
1046.971043.531016.49973.75
1022.631077.751039.191006.11027.721038.821047.471033.851051.421047.551052.671013.561089.881098.791136.39
1139.091067.031077.64939.55897.72908.38898.85971.18969.17973.92
1002.97941.21
741.32742.41742.77555.57814.96562.75412
16001716959719843
1267121913371425890694489387660758613893
2138133
133480151230226267241242699396194208
203200171234435468233
0.130.130.130.140.130.120.130.140.130.130.130.130.130.130.130.140.140.140.13
0.130.150.140.130.130.130.130.120.120.120.110.13
0.180.180.170.170.140.170.25

38 Stream-Profile Analyses Using a Step-Backwater Model for Selected Reaches in the Chippewa Creek Basin in Ohio
Table 2–1. Selected Hydrologic Engineers Center’s River Analysis System output for Chippewa Creek, Medina, Wayne, and Summit Counties, Ohio.—Continued
[ft3/s, cubic feet per second; ft, feet; ft/ft, foot per foot; ft/s, feet per second; ft2, square feet]
River station1
Streamflow (ft3/s)
Minimum elevation
in channel (ft)
Water-surface
elevation (ft)
Energy grade
elevation (ft)
Energy grade slope
(ft/ft)
Mean velocity in
channel (ft/s)
Flow area (ft2)
Top width (ft)
Froude number in channel
4676646788469704736947725480724846648833491984951749843502335067750898510265130551623518865229452646529695329453311533185332953354536525410754508548275516355585559435599156006560235606156369567145709657512
1520152015201520152015201520152015201520152015201520152015201520152015201520152015201520
1520152015201410141014101410141014101410
141014101410141014101410
939.3940.5940.5940.5940.5940.5940.5940.6940.6940.6940.6940.6940.6940.7940.8941941.1941.4941.5941.7941.9942.8
942.8942.2941.9941.3940.9940.5940.1939.6939.2942.2
942.2941.4941.3941.1941940.8
950.45950.64950.79950.94951.08951.21951.36951.5951.61951.72951.83951.96952952.03952.11952.18952.28952.41952.53952.65952.77952.77
952.74952.9953.15953.32953.44953.52953.63953.76953.84953.84
953.76953.98954.23954.33954.45954.58
South Main Street (bridge)950.66 0.000701 3.67950.78 0.00038 2.97950.93 0.000403 3.02951.08 0.000408 2.95951.21 0.000348 2.91951.36 0.000393 3.07951.5 0.000368 2.96951.63 0.000331 2.85951.73 0.000321 2.82951.83 0.000299 2.73951.94 0.000256 2.65952.04 0.000199 2.3952.1 0.000252 2.53952.14 0.000287 2.67952.21 0.000228 2.51952.31 0.000379 2.88952.4 0.00032 2.78952.54 0.000343 2.89952.67 0.000363 2.92952.79 0.000409 3.01952.97 0.000608 3.63952.99 0.000624 3.75
Private drive (bridge)953.07 0.001254 4.61953.12 0.000763 3.79953.28 0.000357 2.9953.43 0.000302 2.7953.55 0.000266 2.58953.64 0.000295 2.72953.74 0.000305 2.73953.85 0.000234 2.51953.96 0.000339 2.88953.99 0.000368 3.06
Blough Road (bridge)954.12 0.00133 4.76954.19 0.000722 3.7954.34 0.000304 2.73954.45 0.00032 2.78954.57 0.000298 2.72954.71 0.00035 2.92
414.72512.47503.71515.7521.64495.34513.16533.31539.18557.54587.05697.45599.71569.61630.19546.64547.86526.91521.39504.26418.49405.22
329.76401.18523.32523546.81518.62516.57561.45490.27460.81
296.21381.18517.29508518.3483.63
117115143826447320
1186806723455384733662
133523572735286426342227343719631908
1921197473149120340723015810185.0
45.854.3
90219492.894.4
0.250.190.190.190.180.190.190.180.170.170.160.140.150.170.150.190.170.180.180.20.230.23
0.330.260.180.170.160.160.160.140.170.18
0.330.250.170.170.160.17

Appendix 2 39
Table 2–1. Selected Hydrologic Engineers Center’s River Analysis System output for Chippewa Creek, Medina, Wayne, and Summit Counties, Ohio.—Continued
[ft3/s, cubic feet per second; ft, feet; ft/ft, foot per foot; ft/s, feet per second; ft2, square feet]
River station1
Streamflow (ft3/s)
Minimum elevation
in channel (ft)
Water-surface
elevation (ft)
Energy grade
elevation (ft)
Energy grade slope
(ft/ft)
Mean velocity in
channel (ft/s)
Flow area (ft2)
Top width (ft)
Froude number in channel
5789558298586645875858775587895883059197595475986460198605516091161169615456158461603616216173662179625696295763398638696430264643646906470664721647546521665654659876632166365663826640466474667826714267537
1410141013301330
13301330133013301330133013301330133013301330
1330133013301330133013301330133013301330
1330133013301330133013301330
13301330133013301070
940.6940.5940945
945944.3944.2944.1944943.9943.8943.7943.6943.5947.7
947.7946946.6947.2947.8948.4949.1949.7950.2949.5
949.5950.6950.4950.1950949.8951.8
951.8951.4951.9952.5953.1
954.72954.83954.93954.93
954.86955.16955.35955.48955.56955.67955.8955.92956.02956.14956.14
956.05956.35956.73957.02957.34957.71958.14958.63959.03959.2
959.25959.25959.78960.02960.23960.35960.43
960.45960.51960.83961.14961.55
954.83 0.000285 2.69954.94 0.000262 2.66955.05 0.000346 2.8955.14 0.000697 3.66
Shorle Road (multiple opening)955.27 0.001131 5.09955.36 0.000449 3.52955.5 0.000343 3.15955.62 0.000298 3.02955.72 0.000319 3.14955.83 0.000353 3.26955.95 0.000333 3.17956.09 0.000375 3.31956.18 0.000343 3.19956.31 0.000347 3.34956.35 0.000482 3.63
Frick Road / Township Road 215 (bridge)956.49 0.001528 5.32956.66 0.000809 4.44957.01 0.000756 4.24957.32 0.000813 4.36957.63 0.000819 4.32958.03 0.000918 4.55958.52 0.00113 4.97959.01 0.001136 4.97959.44 0.001346 5.14959.52 0.000839 4.54
Seville Road / County Highway 60 (bridge)959.56 0.000832 4.5959.62 0.001147 4.9959.99 0.000551 3.7960.24 0.000556 3.72960.41 0.00045 3.37960.64 0.000836 4.34960.69 0.000713 4.09
Sterling Road / County Highway 504 (bridge)960.73 0.000908 4.27960.81 0.00106 4.39961.1 0.000835 4.12961.42 0.000927 4.21961.74 0.000661 3.53
525.01529.78474.92363.31
261.43378.32422.61440.57423.83408.48419.67401.93416.69398.8366.47
250.03299.52313.63305.33308.16292.56267.71267.42258.61293.26
295.45271.52359.29357.96394.45306.43324.94
311.67303.13322.61315.79302.73
97.2130121768
77.290.297.6
10330810112812417565.467.7
53947.149.749.652.149.444.946.850.446.7
47.350.057.957.863.752.5
216
60.26103.3555.5357.3955.43
0.160.150.160.22
0.370.230.210.20.20.210.20.210.20.210.24
0.430.310.30.310.310.330.360.370.40.32
0.320.370.260.260.240.320.3
0.320.330.30.320.27
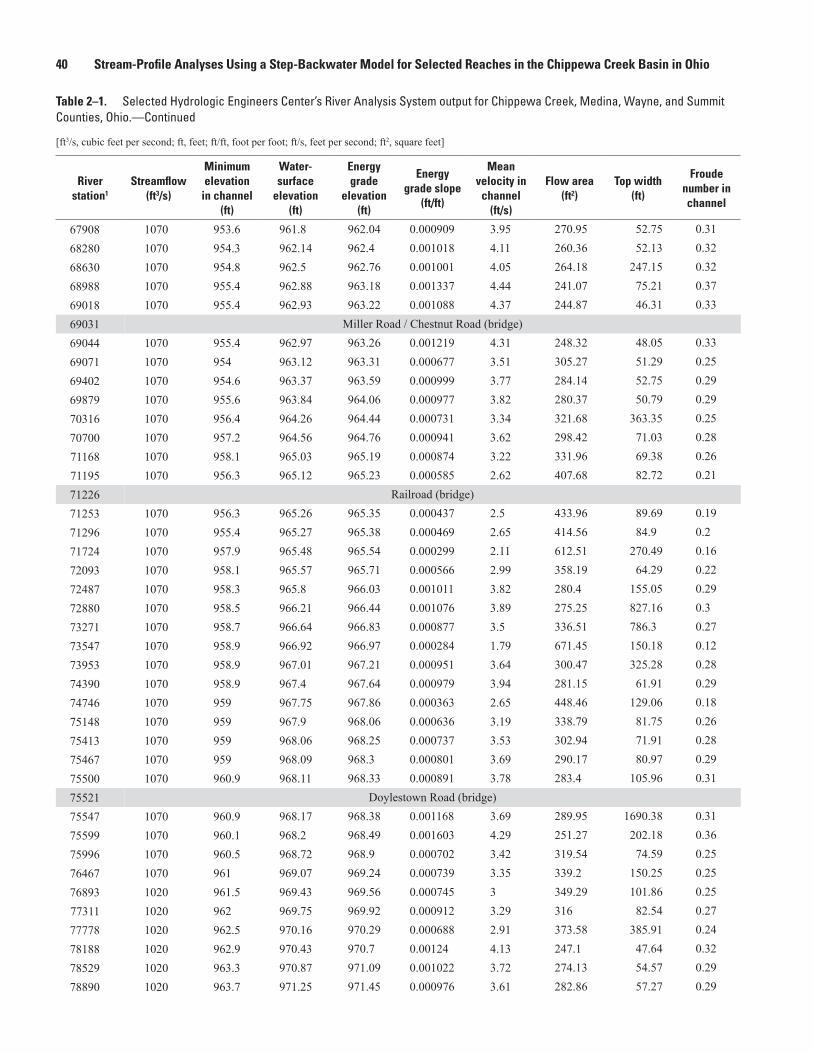
40 Stream-Profile Analyses Using a Step-Backwater Model for Selected Reaches in the Chippewa Creek Basin in Ohio
Table 2–1. Selected Hydrologic Engineers Center’s River Analysis System output for Chippewa Creek, Medina, Wayne, and Summit Counties, Ohio.—Continued
[ft3/s, cubic feet per second; ft, feet; ft/ft, foot per foot; ft/s, feet per second; ft2, square feet]
River station1
Streamflow (ft3/s)
Minimum elevation
in channel (ft)
Water-surface
elevation (ft)
Energy grade
elevation (ft)
Energy grade slope
(ft/ft)
Mean velocity in
channel (ft/s)
Flow area (ft2)
Top width (ft)
Froude number in channel
6790868280686306898869018690316904469071694026987970316707007116871195712267125371296717247209372487728807327173547739537439074746751487541375467755007552175547755997599676467768937731177778781887852978890
10701070107010701070
10701070107010701070107010701070
107010701070107010701070107010701070107010701070107010701070
1070107010701070102010201020102010201020
953.6954.3954.8955.4955.4
955.4954954.6955.6956.4957.2958.1956.3
956.3955.4957.9958.1958.3958.5958.7958.9958.9958.9959959959959960.9
960.9960.1960.5961961.5962962.5962.9963.3963.7
961.8962.14962.5962.88962.93
962.97963.12963.37963.84964.26964.56965.03965.12
965.26965.27965.48965.57965.8966.21966.64966.92967.01967.4967.75967.9968.06968.09968.11
968.17968.2968.72969.07969.43969.75970.16970.43970.87971.25
962.04 0.000909 3.95962.4 0.001018 4.11962.76 0.001001 4.05963.18 0.001337 4.44963.22 0.001088 4.37
Miller Road / Chestnut Road (bridge)963.26 0.001219 4.31963.31 0.000677 3.51963.59 0.000999 3.77964.06 0.000977 3.82964.44 0.000731 3.34964.76 0.000941 3.62965.19 0.000874 3.22965.23 0.000585 2.62
Railroad (bridge)965.35 0.000437 2.5965.38 0.000469 2.65965.54 0.000299 2.11965.71 0.000566 2.99966.03 0.001011 3.82966.44 0.001076 3.89966.83 0.000877 3.5966.97 0.000284 1.79967.21 0.000951 3.64967.64 0.000979 3.94967.86 0.000363 2.65968.06 0.000636 3.19968.25 0.000737 3.53968.3 0.000801 3.69968.33 0.000891 3.78
Doylestown Road (bridge)968.38 0.001168 3.69968.49 0.001603 4.29968.9 0.000702 3.42969.24 0.000739 3.35969.56 0.000745 3969.92 0.000912 3.29970.29 0.000688 2.91970.7 0.00124 4.13971.09 0.001022 3.72971.45 0.000976 3.61
270.95260.36264.18241.07244.87
248.32305.27284.14280.37321.68298.42331.96407.68
433.96414.56612.51358.19280.4275.25336.51671.45300.47281.15448.46338.79302.94290.17283.4
289.95251.27319.54339.2349.29316373.58247.1274.13282.86
52.7552.13
247.1575.2146.31
48.0551.2952.7550.79
363.3571.0369.3882.72
89.6984.9
270.4964.29
155.05827.16786.3150.18325.2861.91
129.0681.7571.9180.97
105.96
1690.38202.1874.59
150.25101.8682.54
385.9147.6454.5757.27
0.310.320.320.370.33
0.330.250.290.290.250.280.260.21
0.190.20.160.220.290.30.270.120.280.290.180.260.280.290.31
0.310.360.250.250.250.270.240.320.290.29

Appendix 2 41
Table 2–1. Selected Hydrologic Engineers Center’s River Analysis System output for Chippewa Creek, Medina, Wayne, and Summit Counties, Ohio.—Continued
[ft3/s, cubic feet per second; ft, feet; ft/ft, foot per foot; ft/s, feet per second; ft2, square feet]
River station1
Streamflow (ft3/s)
Minimum elevation
in channel (ft)
Water-surface
elevation (ft)
Energy grade
elevation (ft)
Energy grade slope
(ft/ft)
Mean velocity in
channel (ft/s)
Flow area (ft2)
Top width (ft)
Froude number in channel
7919679526799088027780625809968129381679820678242882776830988336683536835648357883593836188393684272846278496385236854388561485621856288591385993860218605086116864758685287176874978782788094883488860388898
102010201020102010201020102010201020102010201020102010201020
102010201020102010201020102010201020
102010201020
10201020848848848848848848848848848
964964.4964.8965.2965.8966.3966.8967.4968.1968.6969.2969.7970.1970.4970.5
970.5970970.3970.6971971.3971.5971.7971.9
971.9971.7973.7
973.7974.3974.2974.1974973.9973.7973.7973.6973.5973.4
971.54972.02972.44972.82973.04973.5973.85974.4974.93975.56976.16976.67976.98977.27977.37
977.47977.48977.93978.31978.61978.96979.18979.35979.56
979.74980.02980.04
980.12980.94981.48981.68981.77981.82981.86981.89981.92981.94981.96
971.84 0.001447 4.36972.25 0.001075 3.89972.67 0.001109 3.83972.97 0.000598 3.13973.29 0.001241 4.03973.73 0.001117 3.85974.11 0.001377 4.07974.62 0.001269 3.79975.19 0.001667 4.05975.82 0.00182 4.12976.45 0.001742 4.34976.9 0.001133 3.85977.3 0.001703 4.54977.59 0.001733 4.54977.65 0.001285 4.19
Mill Road (bridge)977.69 0.001127 3.82977.74 0.001344 4.05978.14 0.001154 3.66978.47 0.000816 3.23978.8 0.001059 3.5979.12 0.000829 3.24979.36 0.00091 3.42979.59 0.001156 3.86979.79 0.001151 3.81
Low head dam (inline structure)979.95 0.001031 3.71980.25 0.001022 3.85980.49 0.002778 5.4
State Route 3 / West Main Street (bridge)860980.91 0.006029 7.11981.25 0.001802 4.45981.59 0.000487 2.78981.74 0.000305 2.19981.81 0.000143 1.68981.85 0.000109 1.45981.89 0.000113 1.5981.91 0.000087 1.34981.93 0.000082 1.32981.96 0.000092 1.29982.02 0.000228 2.04
233.92262.03270.81347252.89265.02250.55272.63251.94248.36235.02272.71229.24224.61243.65
266.84251.63278.68316.49293.95332.51298.62264.26267.56
275.17265.22188.87
143.39229.26383.47530.75697.89882.34940.08
1066.171210.791145.95474.09
46.1362.4281.1193.3856.5359.2160.0486.5574.7688.42
171.78162.4468.9457.48
117.86
76.9654.4158.24
118.44146.18172.2557.4549.5451.04
50.1343.5840.96
37.3445.44
131.88247.12230.73285315352402431185
0.340.310.320.240.340.320.350.340.380.390.390.320.370.370.32
0.30.330.290.250.280.250.260.290.29
0.280.270.44
0.640.350.20.160.110.10.10.090.090.090.14

42 Stream-Profile Analyses Using a Step-Backwater Model for Selected Reaches in the Chippewa Creek Basin in Ohio
Table 2–1. Selected Hydrologic Engineers Center’s River Analysis System output for Chippewa Creek, Medina, Wayne, and Summit Counties, Ohio.—Continued
[ft3/s, cubic feet per second; ft, feet; ft/ft, foot per foot; ft/s, feet per second; ft2, square feet]
River station1
Streamflow (ft3/s)
Minimum elevation
in channel (ft)
Water-surface
elevation (ft)
Energy grade
elevation (ft)
Energy grade slope
(ft/ft)
Mean velocity in
channel (ft/s)
Flow area (ft2)
Top width (ft)
Froude number in channel
88905889148923189549900139039690717909579102491042910639115991460917419206092386926689294693282936229399894381947389513395480957929593296013960889629796450965329661196732970869752597924982399860598991
848848848848848848848848
848848848848848848848848848848848848848848848848848
848848848
848848848848848848800800
973.4973.3973.3973.2973.1973973973.8
973.8973.8973.9974974.1974.2974.3974.4974.5974.7974.8974.9975975.2975.3975.4975.8
975.8974.5976.1
976.1974.6975975.6976.1976.5977977.5
981.96982.06982.08982.12982.15982.18982.18982.18
982.19982.26982.3982.31982.32982.33982.34982.35982.35982.36982.37982.38982.39982.4982.43982.43982.45
982.79983.32983.48
983.84984.15984.34984.47984.63984.77984.86985.05
Pipeline (bridge)982.02 0.000228 2.04982.08 0.000082 1.29982.1 0.000082 1.31982.14 0.000074 1.31982.17 0.000087 1.35982.2 0.000069 1.24982.23 0.00016 1.84982.26 0.000295 2.27
Greenwich Road (bridge)982.27 0.000228 2.26982.3 0.000108 1.62982.31 0.000028 0.93982.32 0.000018 0.71982.33 0.000017 0.68982.33 0.000042 0.99982.34 0.000026 0.82982.35 0.000021 0.72982.36 0.000016 0.63982.36 0.000024 0.71982.37 0.00003 0.83982.39 0.000032 0.87982.4 0.000032 0.88982.42 0.000083 1.26982.46 0.000115 1.61982.54 0.000381 2.65982.7 0.001141 4.03
Interstate Route 76 / State Route 224 (bridge)983.11 0.002253 4.53983.47 0.001058 3.21983.73 0.002095 4.02
Interstate Route 71 (bridge)984.04 0.001605 3.64984.22 0.000863 2.47984.37 0.000245 1.67984.5 0.000385 1.82984.69 0.000549 2.21984.8 0.000226 1.53984.91 0.000385 2.05985.13 0.001142 2.73
474.86888.52
1014.711086.18925.25
1003.41489.79373.94
374.65668.19
1295.81786.391931.231473.921818.782058.932313.792064.61871.611775.581585.431024.67810320.2210.24
187.12322.41211.27
233.92447.57719.33767.68656.69898.25594.88419.44
186232317491487850657218
67.9500767639
1173592640
1014135814071139865
1025118912761421
48.3
46.81614
61.9
66.11457170120091489174123922288
0.140.090.080.090.090.080.120.17
0.170.120.060.050.050.070.060.050.040.050.060.060.060.10.120.20.34
0.40.270.38
0.330.240.140.160.20.130.180.28

Appendix 2 43
Table 2–1. Selected Hydrologic Engineers Center’s River Analysis System output for Chippewa Creek, Medina, Wayne, and Summit Counties, Ohio.—Continued
[ft3/s, cubic feet per second; ft, feet; ft/ft, foot per foot; ft/s, feet per second; ft2, square feet]
River station1
Streamflow (ft3/s)
Minimum elevation
in channel (ft)
Water-surface
elevation (ft)
Energy grade
elevation (ft)
Energy grade slope
(ft/ft)
Mean velocity in
channel (ft/s)
Flow area (ft2)
Top width (ft)
Froude number in channel
9934299695
100060100505100902101334101803101821101837101850101868102076102400102694103027103298103610103977104468104494104513104538104546104550104572104925105202105570106006106361106788107228107604108007108423108777109119109528110004110424
800800800800800800800800
800800800800800800800694694694694
694
694694694694694694694694614614614614614614614614614
978978.4978.8979.3979.8980.3980.9981.8
981.8982982982.1982.1982.1982.2982.2982.2982.5984
984
982.4982.4982.5982.6982.8983983.2983.4983.6983.4983.2983982.9982.7982.5982.3982.1
985.39985.79986.3987.03987.58988.08988.52988.63
988.69988.74989.04989.43989.81990.09990.31990.53990.73990.97990.97
990.98
991.03991.04991.08991.09991.1991.11991.11991.12991.12991.13991.13991.13991.13991.13991.13991.13991.13
985.53 0.001176 3.04 299.21985.93 0.001104 3.03 279.63986.51 0.002374 3.79 266.54987.3 0.001319 4.18 191.42987.83 0.001322 3.96 201.86988.27 0.000791 3.49 229.4988.82 0.001671 4.38 182.63988.87 0.001294 3.9 205.19
Buffham Road / Township Road 72 (bridge)988.95 0.001403 4.14 193.34988.98 0.001363 3.97 201.66989.25 0.001212 3.69 216.89989.66 0.001249 3.85 207.77989.97 0.000858 3.19 250.93990.26 0.000826 3.29 243.26990.46 0.000646 3.02 270.85990.64 0.000553 2.77 250.53990.86 0.000625 2.92 237.89991.01 0.000155 1.52 456.49991.02 0.000221 1.75 397.61
Kennard Road (bridge)991.04 0.000326 1.95 356.05
Kennard Road low head dam (inline structure)991.06 0.000113 1.32 555.21991.06 0.000099 1.26 625.62991.08 0.000036 0.89 1307.54991.09 0.00003 0.82 1478.44991.1 0.00002 0.68 1713.99991.11 0.000017 0.61 2104.7991.12 0.000011 0.49 2611.77991.12 0.00001 0.45 2909.16991.13 0.00001 0.41 2855.6991.13 0 0.1 6816.47991.13 0 0.07 9240.28991.13 0 0.06 10911.95991.13 0 0.04 13921.67991.13 0 0.04 17403.24991.13 0 0.03 22117.32991.13 0 0.03 24116.21991.13 0 0.02 28311.76
1692118418931038
43.641.564.040.0
79.317034345732753983769.9
11322971.4
228
452507542462502
100414572196149515102556224024772253289132793743
0.30.290.410.330.320.260.340.3
0.310.310.30.30.250.250.220.20.210.110.13
0.15
0.10.090.060.050.040.040.030.030.030.010000000

44 Stream-Profile Analyses Using a Step-Backwater Model for Selected Reaches in the Chippewa Creek Basin in Ohio
Table 2–1. Selected Hydrologic Engineers Center’s River Analysis System output for Chippewa Creek, Medina, Wayne, and Summit Counties, Ohio.—Continued
[ft3/s, cubic feet per second; ft, feet; ft/ft, foot per foot; ft/s, feet per second; ft2, square feet]
River station1
Streamflow (ft3/s)
Minimum elevation
in channel (ft)
Water-surface
elevation (ft)
Energy grade
elevation (ft)
Energy grade slope
(ft/ft)
Mean velocity in
channel (ft/s)
Flow area (ft2)
Top width (ft)
Froude number in channel
110867111324111763112196112603112955113239113723114169114481114579114595114610114650114981115286115524115866116230116617116967117403117844118264118702119102119518119928120308120638121061121461121832122201122490122723122987123050
614614614614614614614507507507507
507507507507507507507507507507507507507507507507507507507507507507507507369369
981.8981.6981.4981.2981980.8980.7980.5980.3980.1981.3
981.3980.2980.5980.7980.9981.2981.5981.9982.2982.5982.9983.3983.7984984.3984.7985985.3985.7986986.3986.6986.9987.1987.3987.8
991.13991.13991.13991.13991.13991.13991.13991.13991.13991.13991.13
991.13991.13991.13991.13991.13991.13991.13991.13991.13991.13991.13991.14991.14991.14991.15991.16991.22991.3991.38991.87992.68993.6994.17994.56994.88994.91
991.13 0 0.02991.13 0 0.02991.13 0 0.02991.13 0 0.02991.13 0 0.02991.13 0 0.03991.13 0 0.04991.13 0.000001 0.2991.13 0.000001 0.18991.13 0.000001 0.19991.13 0.000003 0.24
Chippewa Road (bridge)991.13 0.000003 0.26991.13 0.000002 0.2991.13 0.000001 0.21991.13 0.000001 0.18991.13 0.000001 0.19991.13 0.000002 0.21991.13 0.000001 0.2991.13 0.000002 0.21991.13 0.000002 0.23991.13 0.000003 0.26991.13 0.000002 0.23991.14 0.000005 0.3991.14 0.000007 0.36991.14 0.000019 0.59991.16 0.000038 0.74991.19 0.000175 1.45991.27 0.000205 1.68991.33 0.000182 1.59991.52 0.001135 3.05992.15 0.001961 4.18992.99 0.002614 4.46993.85 0.002035 3.95994.4 0.00177 3.79994.75 0.001299 3.5994.94 0.000359 1.97994.97 0.000428 2.04
30874.4132933.8831802.0232011.2929415.7423731.5516344.636088.396227.135671.784293.61
3982.475330.445919.757119.156985.375745.645534.995307.674773.243866.893970.482948.412423.791433.231032.88417.81312.45412.84166.39121.29113.57128.37133.91145.02186.98181.08
40704149386535903483300224101967204819481778
1744191219842273222119391785180617461477166320681928199619251315
87.225048.230.729.733.433.433.143.446.5
00000000.010.010.010.02
0.020.010.010.010.010.010.010.010.010.020.010.020.030.040.060.120.130.130.290.370.40.350.330.290.170.18

Appendix 2 45
Table 2–1. Selected Hydrologic Engineers Center’s River Analysis System output for Chippewa Creek, Medina, Wayne, and Summit Counties, Ohio.—Continued
[ft3/s, cubic feet per second; ft, feet; ft/ft, foot per foot; ft/s, feet per second; ft2, square feet]
River station1
Streamflow (ft3/s)
Minimum elevation
in channel (ft)
Water-surface
elevation (ft)
Energy grade
elevation (ft)
Energy grade slope
(ft/ft)
Mean velocity in
channel (ft/s)
Flow area (ft2)
Top width (ft)
Froude number in channel
123077 State Route 162 / Wedgewood Road (bridge)
123099 369 987.8 994.95 995.02 0.000415 2.01 183.3 46.8 0.18123152 369 987.5 994.98 995.04 0.000408 2.03 181.92 42.3 0.17123373 369 988 995.1 995.21 0.001471 2.71 136.41 52.6 0.3123677 369 988.7 995.45 995.62 0.001155 3.29 112.28 22.3 0.26124001 369 989.4 995.82 995.97 0.001022 3.17 116.52 24.6 0.26124338 369 990.2 996.17 996.3 0.000909 2.86 128.87 33.9 0.261 Referenced to feet above mouth.

46 Stream-Profile Analyses Using a Step-Backwater Model for Selected Reaches in the Chippewa Creek Basin in Ohio
Table 2–2. Selected Hydrologic Engineers Center’s River Analysis System output for Westfield Ditch, Medina County, Ohio.—Continued
[ft3/s, cubic feet per second; ft, feet; ft/ft, foot per foot; ft/s, feet per second; ft2, square feet]
River station1
Streamflow (ft3/s)
Minimum elevation
in channel (ft)
Water-surface
elevation (ft)
Energy grade
elevation (ft)
Energy grade slope
(ft/ft)
Mean velocity in
channel (ft/s)
Flow area (ft2)
Top width (ft)
Froude number in channel
1062 47 977.6 984.84 984.84 0.000001 0.1 812.58 1293 0.011446 47 977.6 984.84 984.84 0.000008 0.32 148.84 707.3 0.031707 47 977.6 984.84 984.84 0.000007 0.26 214.58 904.7 0.021739 Service Road (culvert)1775 47 977.5 984.86 984.86 0.000001 0.09 554.45 912.3 0.011864 47 977.5 984.85 984.86 0.000009 0.29 161.79 602.5 0.032202 47 977.7 984.86 984.86 0.000024 0.46 102.54 136.3 0.042525 47 977.9 984.87 984.87 0.000023 0.46 103.11 981.5 0.042942 47 978.1 984.87 984.87 0.000004 0.15 446.87 2931 0.023347 47 978.4 984.87 984.87 0.000001 0.09 755.4 1581 0.013765 47 978.6 984.87 984.87 0.000001 0.1 620.31 816.2 0.014260 47 978.9 984.87 984.88 0.000035 0.47 99.42 541.9 0.054296 47 978.9 984.87 984.88 0.000041 0.56 83.46 409.6 0.064328 Lake Road (culvert)4373 47 979.5 984.89 984.89 0.000029 0.48 98.83 660.4 0.054425 47 979.5 984.89 984.9 0.000039 0.43 112.36 650.4 0.054841 47 979.7 984.9 984.9 0.000008 0.23 305.74 616.8 0.035127 47 979.8 984.9 984.91 0.000015 0.26 267.7 696.2 0.035494 47 979.9 984.91 984.91 0.000013 0.27 289.36 538.5 0.035667 47 980 984.91 984.92 0.000073 0.7 67.2 334.3 0.075688 Farm field drive (culvert)5710 47 980.8 984.98 985 0.000164 0.98 48.18 325.1 0.115853 47 981.5 985.01 985.04 0.000375 1.33 35.38 232.9 0.166137 47 982.8 985.17 985.27 0.00194 2.52 18.65 10.76 0.346421 47 984.3 985.87 985.98 0.003333 2.61 18 16.64 0.446465 47 984.3 986.02 986.1 0.002261 2.29 20.55 17.28 0.376506 Buffham Road / Township Road 72 (culvert)6547 47 984.2 986.79 986.82 0.000542 1.29 36.57 21.79 0.176563 47 984.2 986.8 986.83 0.000644 1.35 34.76 21.84 0.196901 47 984.2 987.07 987.13 0.001224 1.96 23.96 12.69 0.257183 47 984.2 987.29 987.32 0.000412 1.32 35.62 14.76 0.157478 47 984.2 987.4 987.43 0.000332 1.22 38.62 15.5 0.147742 47 984.2 987.48 987.49 0.000164 0.69 67.96 42.94 0.18067 47 984.2 987.51 987.51 0.000049 0.43 108.31 56.22 0.068425 47 984.2 987.53 987.53 0.000046 0.43 110.39 55.27 0.058705 47 984.2 987.54 987.55 0.00011 0.74 63.6 25.75 0.089037 47 984.2 987.57 987.57 0.000032 0.43 108.97 40.58 0.059400 47 984.2 987.58 987.6 0.000291 1.11 42.33 18.8 0.139672 47 984.2 987.64 987.65 0.000102 0.69 68.59 29.88 0.089968 47 984.2 987.66 987.67 0.000051 0.5 93.24 39.35 0.06
10260 47 984.2 987.68 987.71 0.000356 1.27 36.87 13.45 0.1410297 47 984.2 987.69 987.72 0.000351 1.27 37.05 13.47 0.13

Appendix 2 47
Table 2–2. Selected Hydrologic Engineers Center’s River Analysis System output for Westfield Ditch, Medina County, Ohio.—Continued
[ft3/s, cubic feet per second; ft, feet; ft/ft, foot per foot; ft/s, feet per second; ft2, square feet]
River station1
Streamflow (ft3/s)
Minimum elevation
in channel (ft)
Water-surface
elevation (ft)
Energy grade
elevation (ft)
Energy grade slope
(ft/ft)
Mean velocity in
channel (ft/s)
Flow area (ft2)
Top width (ft)
Froude number in channel
10334 Kennard Road (culvert)10370 47 986 988.65 988.67 0.000444 1.05 44.95 28.24 0.1510394 47 986.6 988.66 988.68 0.000527 1.1 42.64 28.3 0.1610549 47 987 988.81 988.86 0.003559 1.61 29.13 22.1 0.2510833 47 988 989.89 989.95 0.004149 1.87 25.13 16.54 0.2711054 47 989 990.23 990.23 0.000625 0.48 101.25 1149 0.111485 47 990 990.6 990.61 0.001213 0.57 89.98 789.2 0.1311637 47 990 990.9 990.92 0.004102 1.16 40.58 546.1 0.2411700 47 990 991.05 991.05 0.001207 0.72 65.61 348.3 0.1411781 47 990 991.1 991.1 0.000384 0.42 110.97 120.8 0.0811880 47 990 991.11 991.11 0.000025 0.12 395.2 744.5 0.02
1Referenced to feet above a point 180 feet upstream of mouth.

48 Stream-Profile Analyses Using a Step-Backwater Model for Selected Reaches in the Chippewa Creek Basin in Ohio
Table 2–3. Selected Hydrologic Engineers Center’s River Analysis System output for River Styx, Medina and Wayne Counties, Ohio.—Continued
[ft3/s, cubic feet per second; ft, feet; ft/ft, foot per foot; ft/s, feet per second; ft2, square feet]
River station1
Streamflow (ft3/s)
Minimum elevation
in channel (ft)
Water-surface
elevation (ft)
Energy grade
elevation (ft)
Energy grade slope
(ft/ft)
Mean velocity in
channel (ft/s)
Flow area (ft2)
Top width (ft)
Froude number in channel
189 831 938 945.07 945.17 0.000387 2.47 336.25 134.4 0.18481 831 938.1 945.19 945.28 0.000379 2.38 348.77 144.6 0.18782 831 938.2 945.3 945.39 0.000386 2.43 342.27 136.4 0.18
1172 831 938.38 945.45 945.55 0.000409 2.49 334 136 0.191515 831 938.5 945.6 945.72 0.000571 2.82 294.59 131.4 0.221787 831 938.6 945.76 945.87 0.00054 2.73 304.78 138.5 0.212190 831 938.77 945.98 946.08 0.0005 2.61 318.6 150.7 0.22470 831 938.88 946.12 946.21 0.000384 2.43 342.55 145.7 0.182685 831 939 946.2 946.31 0.000518 2.69 309.35 140.9 0.212883 831 939.1 946.3 946.42 0.000541 2.72 305.48 58.52 0.213147 831 939.14 946.44 946.56 0.000536 2.77 300.49 56.77 0.213458 831 939.26 946.61 946.73 0.000568 2.84 292.2 56.08 0.223807 831 939.4 946.8 947.04 0.001136 3.87 214.88 41.15 0.33818 831 940.1 946.85 947.06 0.000979 3.61 229.93 44.63 0.283842 Railroad (bridge)3866 831 940.1 946.91 947.1 0.000951 3.58 232.2 44.71 0.283905 831 939.7 946.93 947.16 0.001094 3.87 214.51 40.64 0.33924 831 940.1 946.93 947.21 0.00136 4.22 196.82 38.19 0.333940 Salt Street (bridge)3957 831 940.1 946.94 947.31 0.002037 4.93 168.45 35.24 0.43969 831 940.1 946.98 947.34 0.002007 4.83 171.97 36.27 0.393990 831 940 947.22 947.42 0.000932 3.57 232.82 44.06 0.274003 Abandoned railroad (bridge)4016 831 940 947.25 947.44 0.00092 3.55 233.95 44.18 0.274050 831 939.9 947.27 947.48 0.001005 3.65 227.44 44.13 0.284078 831 940.3 947.3 947.52 0.001093 3.75 221.76 45.48 0.34093 Abandoned railroad (bridge)4109 831 940.3 947.34 947.55 0.00107 3.72 223.47 45.64 0.34232 831 940 947.48 947.68 0.000967 3.6 231 44.06 0.284291 831 940.4 947.53 947.75 0.001087 3.7 224.86 46.6 0.34317 Private road (bridge)
4344 831 940.4 947.6 947.8 0.00105 3.65 227.81 46.92 0.294368 831 940.2 947.61 947.84 0.001153 3.84 216.16 43.19 0.34514 831 940.34 947.82 947.98 0.000764 3.24 256.71 47.72 0.254710 831 940.53 947.99 948.11 0.00054 2.81 295.22 53.97 0.215180 831 940.99 948.24 948.36 0.000528 2.81 295.35 106.4 0.215393 831 941.2 948.35 948.49 0.000617 2.98 278.71 51.73 0.235433 831 940.8 948.36 948.54 0.000832 3.4 244.19 46.79 0.265452 Pipeline / private road (bridge)5471 831 940.8 948.38 948.63 0.001302 3.99 208.32 44.32 0.325585 831 941.7 948.63 948.76 0.000533 2.86 290.99 51.19 0.21

Appendix 2 49
Table 2–3. Selected Hydrologic Engineers Center’s River Analysis System Counties, Ohio.—Continued
[ft3/s, cubic feet per second; ft, feet; ft/ft, foot per foot; ft/s, feet per second; ft2, square feet]
output for River Styx, Medina and Wayne
River station1
Streamflow (ft3/s)
Minimum elevation
in channel (ft)
Water-surface
elevation (ft)
Energy grade
elevation (ft)
Energy grade slope
(ft/ft)
Mean velocity in
channel (ft/s)
Flow area (ft2)
Top width (ft)
Froude number in channel
5805609762926358637263876451646664906514659669117295767580148298858588678893892689599043923596099940
10212105861100411441119121194311980120161208012484127791307813395137531411814425
831831831831
831831831
831831831763763763763763763763
763763763763763763763763763763763
763763763763763763763763763
941.7941.7941.7942.8
942.8941.8943.2
943.2943.2943.31943.45943.58943.7943.8943.9944943.8
943.8943.2943.42943.85944.23944.54944.97945.5946946.5946.9
946.9947947.3947.5947.7947.9948.17948.42948.64
948.76948.9948.98949
949.05949.2949.27
949.37949.46949.69949.94950.31950.58950.77951.03951.25951.34
951.4951.45951.67951.88952.1952.39952.89953.36954.03954.66954.8
954.88954.99955.22955.39955.56955.74955.96956.17956.35
948.87 0.000472 2.61949.01 0.000475 2.65949.14 0.000767 3.14949.25 0.001455 4.03
Railroad (bridge)949.3 0.001411 3.99949.41 0.001859 3.71949.44 0.000941 3.32
Grant Street / East Ohio Avenue (bridge)949.53 0.000886 3.24949.6 0.000746 3.04949.82 0.000623 2.91950.13 0.000989 3.51950.47 0.000789 3.22950.71 0.000654 2.91950.95 0.00091 3.42951.19 0.000805 3.24951.46 0.000993 3.61951.49 0.000834 3.18
East Sunset Drive (bridge)951.55 0.000816 3.14951.64 0.000974 3.52951.79 0.000559 2.82952.02 0.000655 3.05952.31 0.001013 3.63952.63 0.001343 3.92953.08 0.001073 3.53953.64 0.001537 4.27954.25 0.001248 3.81954.94 0.001631 4.26955 0.001116 3.63
Eastern Road (bridge)955.08 0.001011 3.58955.14 0.000581 3.11955.38 0.000569 3.2955.55 0.00056 3.15955.72 0.000588 3.25955.91 0.000583 3.25956.11 0.000558 3.11956.32 0.000593 3.13956.51 0.000609 3.23
317.97313.12264.47206.22
208.46224.07250.58
256.16273.24285.27217.34237.14261.89223.38235.38211.55239.81
242.92216.47270.09250.14210.02194.7215.92178.66200.13179.02210.27
213.25245.45238.4242.06234.89234.73245.04243.88236.14
60.7958.3353.446.78
46.9572.0856.73
57.2657.0956.9945.7248.1254.4145.5647.5841.4751.76
52.6243.8851.146.1441.1542.5847.4736.8345.3638.8646.16
43.6748.5443.4344.9243.4242.4346.7448.5745.22
0.20.20.250.34
0.330.370.28
0.270.240.230.280.260.230.270.260.280.26
0.260.280.220.230.280.320.290.340.310.350.3
0.290.240.240.240.250.240.240.250.25

50 Stream-Profile Analyses Using a Step-Backwater Model for Selected Reaches in the Chippewa Creek Basin in Ohio
Table 2–3. Selected Hydrologic Engineers Center’s River Analysis System Counties, Ohio.—Continued
[ft3/s, cubic feet per second; ft, feet; ft/ft, foot per foot; ft/s, feet per second; ft2, square feet]
output for River Styx, Medina and Wayne
River station1
Streamflow (ft3/s)
Minimum elevation
in channel (ft)
Water-surface
elevation (ft)
Energy grade
elevation (ft)
Energy grade slope
(ft/ft)
Mean velocity in
channel (ft/s)
Flow area (ft2)
Top width (ft)
Froude number in channel
147981482814855
14874149411523315534158051607716358166821700317358177081778617792.517801178441829518683190521929019623199092018420478205212054720573206482084321164213952171821779217922180521858222352250422805
763763
763763763763763763763763763763763763
763763763763506506506506506506506
506506506448448448448
448448448448448
948.9948.7
948.7949.3949.44949.58949.71949.83949.97950.12950.27950.44950.6952.38
952.4952952.12952.22952.32952.38952.47952.55952.62952.7953.7
953.7953953.11953.29953.4953.6953.9
953.9955.2955.3955.38955.46
956.59956.67
956.69956.71956.89957.08957.29957.47957.72957.99958.26958.44958.71958.79
959.49959.52959.7959.84960960.06960.11960.19960.27960.47960.57
960.58960.58960.66960.78960.83960.95960.95
961.07961.16961.27961.39961.49
956.76 0.000729 3.26956.79 0.000406 2.79
Wall Road (multiple opening)
956.81 0.000396 2.75956.86 0.000645 3.16957.05 0.000615 3.2957.25 0.00071 3.31957.44 0.000717 3.18957.66 0.000812 3.47957.9 0.000874 3.4958.17 0.000821 3.39958.38 0.00048 2.74958.61 0.000814 3.33958.84 0.000538 2.93958.89 0.000359 2.51
Low head dam (culvert)959.57 0.00023 2.18959.59 0.000573 2.48959.8 0.000362 2.57959.94 0.000378 2.64960.05 0.000201 1.82960.1 0.000163 1.65960.17 0.000248 1.95960.25 0.000294 2.04960.39 0.000775 2.79960.59 0.000623 2.77960.63 0.000222 1.93
Seville Road (bridge)960.64 0.000175 1.97960.68 0.000335 2.52960.74 0.000306 2.36960.83 0.000236 2.01960.91 0.00037 2.38961.04 0.000422 2.43961.1 0.000886 3.07
Private drive (bridge)961.18 0.000666 2.7961.22 0.000275 1.99961.36 0.000448 2.38961.46 0.000309 2.17961.56 0.000369 2.25
233.77273.83
277.48241.64238.58230.4240.05219.58224.5225.04280.06229.46278.46304.45
350.17555.51338.43296.36285.67362.69268.07248.38191.44182.58280.28
274.61201.13252.11344.84245.31184.07146.43
166.03256.15192.93247.53207.49
51.754.44
109.383.0247.6148.256.0648.4549.4747.1564.77
109.9743.2897.1
1081759.5117.6517.4744.7778.1
1073897.5915.4918.8988.5
1109884.8913.1881.6760771.7617.3
564539.583.73
376.178.57
0.270.21
0.210.260.250.270.270.290.280.270.210.260.230.18
0.150.220.190.190.140.130.150.170.260.230.15
0.150.20.190.170.190.20.29
0.250.170.210.180.19

Appendix 2 51
Table 2–3. Selected Hydrologic Engineers Center’s River Analysis System Counties, Ohio.—Continued
[ft3/s, cubic feet per second; ft, feet; ft/ft, foot per foot; ft/s, feet per second; ft2, square feet]
output for River Styx, Medina and Wayne
River station1
Streamflow (ft3/s)
Minimum elevation
in channel (ft)
Water-surface
elevation (ft)
Energy grade
elevation (ft)
Energy grade slope
(ft/ft)
Mean velocity in
channel (ft/s)
Flow area (ft2)
Top width (ft)
Froude number in channel
2306823466239372440824747251072550725771261482655426830272402726827304273412737527585279962837628851292432971029840299002996030076303383061130815311663148031721319893216232371326643267132680326933269532958
448448448448448448448448425425425425425
425425425425425425425425425
425425425425425379379379379379379379379379379379379
955.5955.6955.77955.9956.43957957.6958.02958.6959.23959.66960.3960.9
960.9960.5960.72961.1961.5962962.4962.9963.9
963.9964.1964.54964.99965.33965.91966.43966.83967.28967.57967.91968.4968.4969.3969.1969.1969.3
961.59961.89962.42963963.44963.72963.97964.32964.65964.93965.06965.35965.35
965.84965.94966.44967.1967.57967.99968.66969.33969.51
969.83970.06970.44971.21971.79972.37972.65972.79973.16973.56973.9974.26974.3974.32974.32974.32974.5
961.7 0.000647 2.73962.02 0.001007 2.96962.57 0.001336 3.22963.17 0.001217 3.33963.51 0.000841 2.47963.77 0.000592 2.17964.12 0.001241 3.22964.41 0.000939 2.77964.74 0.000773 2.57964.99 0.000504 2.18965.14 0.000595 2.35965.5 0.001219 3.11965.6 0.002808 4.11Greenwich Road (multiple opening)966.11 0.003869 4.29966.21 0.002201 4.15966.62 0.001725 3.48967.27 0.001436 3.36967.67 0.000765 2.56968.19 0.001481 3.56968.83 0.001789 3.31969.5 0.001181 3.3969.74 0.002314 3.82
Interstate Route 76 / State Route 224 (bridge)970.03 0.001926 3.51970.21 0.001263 3.19970.68 0.002337 3.88971.44 0.003415 3.92971.98 0.00205 3.5972.5 0.001068 2.96972.72 0.000493 2.24972.91 0.001134 2.87973.36 0.002398 3.52973.7 0.001638 2.98974.03 0.00148 2.86974.35 0.000826 2.35974.36 0.00055 2.02974.36 0.000398 1.72974.38 0.000542 2.01974.38 0.00058 2.1974.66 0.001801 3.19
164.09165.15187.63144.51290.08306.97152.79334.34208.96265.9190.49146.72112.8
107.93102.3121.99126.59174.07119.28132.39128.91111.13
121.08133.06111.23112.1133.41145.14189.13166.63110.76128.05133.8164.12205.03236.09221.55203.7118.99
44.2988.55
486.7350.3282.7239.166.82
1020521.7444.6183.556.6464.46
72.5330.7443.6441.356932.763.2933.539.49
42.62128.545.7161.4874.27
671.7877.9318.377.6453.8858.79
767.1791.9814.2861.7703.4312.7
0.250.30.340.310.250.220.310.270.250.210.220.290.4
0.480.370.370.340.250.330.350.30.4
0.370.30.40.450.370.280.20.280.390.320.310.240.190.160.190.190.34

52 Stream-Profile Analyses Using a Step-Backwater Model for Selected Reaches in the Chippewa Creek Basin in Ohio
Table 2–3. Selected Hydrologic Engineers Center’s River Analysis System Counties, Ohio.—Continued
[ft3/s, cubic feet per second; ft, feet; ft/ft, foot per foot; ft/s, feet per second; ft2, square feet]
output for River Styx, Medina and Wayne
River station1
Streamflow (ft3/s)
Minimum elevation
in channel (ft)
Water-surface
elevation (ft)
Energy grade
elevation (ft)
Energy grade slope
(ft/ft)
Mean velocity in
channel (ft/s)
Flow area (ft2)
Top width (ft)
Froude number in channel
33199334423390334071345153479535185355513577836015363013664636910369363696436992370443742137772377843779837813378363809638378387543878738811390743926739530398104014240484407734102241373417214194842001
379379379379379379379379379379379265265265
265265265265265
265265265265265265265265265265265265265265265265265265265
969.5969.64969.98970.1971.1971.7972.6973.44973.95974.48975.13975.9976975
975974.6975.58976.5977.04
976.6976.9976.96977.02977.1977.5976.5977.34977.96978.8979.7980980.3980.56980.78981.09981.4981.6981.9
974.93975.36976.03976.4976.92977.36977.87978.63979.31979.79980.1980.43980.59980.66
980.75980.75981.08981.53981.64
981.87981.87982.13982.41982.8982.85982.85982.95983.29983.65983.87984.05985.08985.56985.83986.59987.15987.31987.33
975.1 0.001845 3.3975.47 0.001289 2.8976.27 0.002207 3.94976.51 0.000912 2.69977.08 0.001775 3.19977.47 0.001153 2.72978.03 0.00172 3.18978.89 0.003146 4.11979.52 0.002386 3.65979.9 0.001135 2.72980.21 0.001032 2.73980.49 0.000556 1.96980.67 0.00077 2.2980.69 0.000182 1.38
Blake Road (multiple opening)980.79 0.000227 1.58980.83 0.000721 2.27981.17 0.001128 2.44981.69 0.001868 3.22981.73 0.000688 2.33
Private drive (culvert)981.93 0.000481 2.05981.97 0.0011 2.5982.22 0.000889 2.42982.53 0.001321 2.83982.87 0.000621 2.15982.88 0.000145 1.5982.89 0.000371 1.76983.1 0.00163 3.13983.4 0.00146 2.69983.74 0.00108 2.4983.92 0.000426 1.86984.26 0.002764 3.71985.18 0.002598 2.83985.64 0.001069 2.29985.99 0.001567 3.19986.7 0.002746 2.87987.2 0.000838 1.95987.37 0.000651 2.11987.42 0.000743 2.37
114.73149.1396.32
141.26123.18139.24125.1392.14
103.93139.13139.15142.65120.34192.55
167.9116.81108.5682.21
113.86
129.15106.02109.3795.04
127.56185.57158.0384.75
103.65110.36157.6371.42
123.94120.6983.15
111.2172.88137.44111.98
529.399.31
442.1137.659.9947.4757.75
249.4106.347.29
130.7102.957.6760.23
51.5843.7342.230.3529.84
29.939.7139.8445.2654.1588.2355.7929.2762.4648.1485.4330.3
225.770.6927.89
334288.9197.834.84
0.350.290.380.250.340.280.330.450.390.280.270.20.230.11
0.120.220.270.350.21
0.170.270.260.30.220.120.150.320.310.280.180.430.380.270.330.390.230.220.23

Appendix 2 53
Table 2–3. Selected Hydrologic Engineers Center’s River Analysis System output for River Styx, Medina and Wayne Counties, Ohio.—Continued
[ft3/s, cubic feet per second; ft, feet; ft/ft, foot per foot; ft/s, feet per second; ft2, square feet]
River station1
Streamflow (ft3/s)
Minimum elevation
in channel (ft)
Water-surface
elevation (ft)
Energy grade
elevation (ft)
Energy grade slope
(ft/ft)
Mean velocity in
channel (ft/s)
Flow area (ft2)
Top width (ft)
Froude number in channel
42033 State Route 57 / Wadsworth Road (bridge)42065 265 981.9 987.38 987.47 0.000714 2.33 113.72 44.86 0.2342168 265 982 987.49 987.54 0.000479 1.84 145.31 282.1 0.1942355 265 982.3 987.56 987.7 0.001221 3.05 86.9 25.11 0.2942674 265 982.81 988.11 988.3 0.002995 3.51 83.57 345.5 0.4242925 265 983.21 988.66 988.75 0.001159 2.39 116.28 78.08 0.2843167 265 983.6 988.83 988.86 0.000227 1.46 182.22 51.75 0.13
1Referenced to feet above mouth.

54 Stream-Profile Analyses Using a Step-Backwater Model for Selected Reaches in the Chippewa Creek Basin in Ohio
Table 2–4. Selected Hydrologic Engineers Center’s River Analysis System output for Little Chippewa Creek, Wayne County, Ohio.
[ft3/s, cubic feet per second; ft, feet; ft/ft, foot per foot; ft/s, feet per second; ft2, square feet]
River station1
Streamflow (ft3/s)
Minimum elevation
in channel (ft)
Water-surface
elevation (ft)
Energy grade
elevation (ft)
Energy grade slope
(ft/ft)
Mean velocity in
channel (ft/s)
Flow area (ft2)
Top width (ft)
Froude number in channel
68 875 939.5 951.29 951.35 0.0002 2.03 463.84 582.3 0.13349 875 940.39 951.34 951.42 0.00026 2.29 386.03 685.3 0.15557 875 941.05 951.39 951.48 0.000329 2.35 375.99 829.6 0.16824 875 941.9 951.48 951.63 0.0008 3.13 281.23 707.1 0.25886 875 941.6 951.57 951.68 0.000415 2.68 332.94 591.6 0.19927 South Main Street (multiple opening)965 875 941.6 951.62 951.73 0.000403 2.66 336.37 146.1 0.19
1015 875 941.6 951.62 951.77 0.000692 3.07 286.6 303.4 0.241326 875 941.66 951.83 951.92 0.000326 2.43 359.81 385 0.161516 875 941.7 951.89 951.98 0.000289 2.36 371.02 722.9 0.161721 875 941.74 951.95 952.04 0.000303 2.42 363.37 682.2 0.161942 875 941.78 952.02 952.1 0.000251 2.29 384.43 1225 0.152251 875 941.84 952.1 952.19 0.000295 2.43 362.47 753.7 0.162515 875 941.9 952.18 952.26 0.000252 2.26 451.37 2114 0.152799 875 941.95 952.28 952.32 0.000169 1.87 685.06 2087 0.123029 875 942 952.33 952.36 0.000131 1.65 900.4 2368 0.113260 875 942.04 952.35 952.41 0.000251 2.16 612.83 2531 0.153553 875 942.1 952.41 952.52 0.000445 2.65 388.01 2171 0.193597 875 942.5 952.43 952.54 0.000409 2.62 388.02 1930 0.193613 Private road (bridge)3631 875 942.5 952.45 952.55 0.000403 2.6 392.78 1803 0.183717 875 941.7 952.48 952.6 0.000479 2.76 375.92 1823 0.23875 875 941.76 952.58 952.65 0.000208 2.11 482.89 2552 0.144200 875 941.89 952.65 952.73 0.000239 2.26 387.89 2773 0.154565 875 942.04 952.74 952.84 0.000381 2.64 331.31 2768 0.184920 772 942.18 952.88 952.97 0.000299 2.37 325.61 1847 0.165306 772 942.33 953 953.07 0.000248 2.21 349.4 2722 0.155588 772 942.45 953.06 953.15 0.00029 2.4 322.06 3193 0.165990 772 942.61 953.19 953.28 0.00034 2.47 312.39 3600 0.176349 772 942.75 953.31 953.38 0.000232 2.13 363.25 3255 0.146778 772 942.92 953.42 953.53 0.000448 2.71 284.37 3126 0.196976 772 943 953.5 953.65 0.000716 3.17 243.78 2876 0.237357 772 943.15 953.74 953.84 0.000339 2.5 308.55 4698 0.177637 772 943.26 953.84 953.95 0.000398 2.64 292.15 3594 0.188024 772 943.42 953.99 954.1 0.000394 2.64 292.55 2388 0.188386 772 943.56 954.15 954.24 0.000377 2.48 310.94 3595 0.188713 772 943.69 954.26 954.38 0.000437 2.72 289.6 3385 0.198972 772 943.79 954.38 954.5 0.000455 2.79 277.13 3074 0.199304 772 943.92 954.53 954.68 0.000586 3.07 251.42 3645 0.219579 772 944.03 954.69 954.89 0.00093 3.58 215.34 3981 0.259852 772 944.14 954.95 955.09 0.000551 2.99 258.56 3710 0.21

Appendix 2 55
Table 2–4. Selected Hydrologic Engineers Center’s River Analysis System output
[ft3/s, cubic feet per second; ft, feet; ft/ft, foot per foot; ft/s, feet per second; ft2, square feet]
for Little Chippewa Creek, Wayne County, Ohio.—Continued
River station1
Streamflow (ft3/s)
Minimum elevation
in channel (ft)
Water-surface
elevation (ft)
Energy grade
elevation (ft)
Energy grade slope
(ft/ft)
Mean velocity in
channel (ft/s)
Flow area (ft2)
Top width (ft)
Froude number in channel
1017110511108051114811511115401159711634116731186512065121951230512705130241325113422135731391614336147741523115507158051605416328166971704017272175521783518186
772751751751751751
751751751751751751751751751751751751751751751751751751751751751751751751680
944.27944.4944.52944.66944.8947.3
947.3946.2946.35946.51946.61946.69947.01947.26947.44947.57947.69947.96948.29948.63948.99949.2949.44949.63949.85950.13950.4950.58950.8951.03951.3
955.12955.31955.52955.64955.87955.88
955.93955.94956.11956.18956.23956.27956.43956.57956.66956.73956.82956.97957.19957.38957.62957.78957.91958.05958.14958.42958.69958.81959.03959.22959.46
955.27 0.000555 3.1955.47 0.000638 3.23955.62 0.000358 2.55955.79 0.000623 3.08955.96 0.000356 2.47955.98 0.000411 2.52
State Route 604 / Easton Road (multiple opening)956.03 0.000399 2.5956.1 0.000861 3.23956.21 0.000344 2.46956.29 0.000397 2.64956.34 0.000369 2.57956.38 0.000412 2.63956.55 0.000417 2.71956.68 0.0004 2.63956.78 0.000437 2.72956.86 0.000538 2.91956.94 0.000419 2.77957.1 0.00052 2.92957.3 0.000436 2.73957.51 0.000498 2.86957.75 0.000569 2.98957.89 0.000428 2.75958.04 0.00055 2.97958.15 0.000332 2.53958.3 0.000748 3.21958.59 0.000828 3.31958.82 0.00051 2.86958.98 0.000797 3.26959.18 0.000691 3.17959.36 0.00056 3.04959.65 0.001171 3.52
249.27232.66294.75244.18307.07298.66
301.51232.53312.15287.14296.68288.24279.52286.52276.78258.6272.46259.37276.44263.66252.41289.52255.28304.26234.84227.15270.24231.35237.61258.53193.31
339237093088222722892108
31942967940.1683.7589.7111.897.7349.85
294.569.8344.2748.1248.9147.7343.2259.9146.9453.8647.4441.9156.8547.646.1550.843.55
0.20.210.170.210.170.19
0.180.250.170.190.180.190.190.190.190.210.190.210.190.210.220.190.210.170.250.250.210.250.240.220.29
1Referenced to feet above mouth.


Appendix 3. Computed Water-Surface Elevations for Chippewa Creek, River Styx, and Little Chippewa Creek

58 Stream-Profile Analyses Using a Step-Backwater Model for Selected Reaches in the Chippewa Creek Basin in Ohio
930
935
940
945
950
955
960
965
970
975
980
985
990
995
1,000
0 10,000 20,000 30,000 40,000 50,000 60,000 70,000 80,000 90,000 100,000 110,000 120,000
Elev
atio
n, in
feet
abo
ve N
orth
Am
eric
an V
ertic
al D
atum
of 1
988
Distance upstream of mouth, in feet
SR 1
62 /
Wed
gew
ood
Rd
Chip
pew
a Rd
Kenn
ard
RdBu
ffham
Rd
/ Tw
p Rd
72
I-71
I-76
/ SR
224
Gree
nwic
h Rd
Pipe
line
SR 3
/ W
est M
ain
StM
ill R
d
Doyl
esto
wn
Rd
Railr
oad
Mill
er R
d / C
hest
nut R
dSt
erlin
g Rd
/ Co
Hw
y 50
4Se
ville
Rd
/ Co
Hwy
60Fr
ick
Rd /
Twp
Rd 2
15Sh
orle
Rd
Blou
gh R
dPr
ivat
e dr
ive
S M
ain
StLo
w h
ead
dam
SR 5
7 / W
adsw
orth
Rd
SR 9
5 / S
R 58
5 / A
kron
Rd
/ Mt E
aton
Rd
Porr
Rd
/ Tw
p Rd
261
Coal
Ban
k Rd
Blac
k Di
amon
d Rd
/ Bi
eri R
d
Railr
oad
SR 2
1 / G
reat
Lak
es B
lvd
N L
awre
nce
Rd /
Deer
field
Rd
/ S 2
nd A
veRa
ilroa
d
WS elevation
Minimum channel elevation
Hydraulic structure
EXPLANATION
WS elev after 5% reduction to the channel n
WS elev after 10% reduction to the channel n
WS elev after 15% reduction to the channel n
WS elev after 20% reduction to the channel n
Rive
r Sty
xLit
tle C
hipp
ewa
Cree
k
Wes
tfiel
d Di
tch
Low
hea
d da
m
Low
hea
d da
m
Figure 3–1. Computed water-surface profiles for a bank-full discharge with Manning’s roughness coefficients in the main channel at current values and reduced by 5, 10, 15, and 20 percent on Chippewa Creek in Medina, Wayne, and Summit Counties, Ohio. (WS, water surface; %, percent; n, Manning’s roughness coefficient)

Appendix 3 59
Table 3–1. Water-surface elevation along Chippewa Creek after decreasing the Manning’s roughness coefficient (n) for the main channel by 5, 10, 15, and 20 percent.—Continued
River station1
Water-surface elevation (in feet) associated with the indicated decrease in the Manning’s roughness coefficient (n) over the entire length of the main channel
0 percent 5 percent 10 percent 15 percent 20 percent
369 942.18 941.8 941.58 941.13 940.67647 942.22 941.84 941.62 941.17 940.71751 942.23 941.85 941.63 941.17 940.7777 942.32 941.94 941.73 941.29 940.83914 942.35 941.97 941.76 941.32 940.86
1000 942.44 942.07 941.86 941.43 9411288 942.53 942.17 941.96 941.54 941.111500 942.56 942.19 941.99 941.57 941.141768 942.55 942.18 941.98 941.55 941.111797 942.62 942.25 942.04 941.62 941.191845 942.66 942.29 942.08 941.67 941.231893 942.71 942.35 942.15 941.73 941.312372 942.81 942.45 942.24 941.83 941.412796 942.87 942.51 942.3 941.89 941.473092 942.92 942.56 942.35 941.95 941.533512 942.98 942.62 942.41 942.01 941.593970 943.03 942.68 942.46 942.08 941.664442 943.12 942.77 942.56 942.18 941.764834 943.17 942.82 942.6 942.23 941.794896 943.18 942.84 942.61 942.24 941.815019 943.19 942.84 942.61 942.24 941.85251 943.38 943.04 942.81 942.46 942.045582 943.5 943.16 942.93 942.58 942.175891 943.56 943.22 942.99 942.65 942.246167 943.62 943.28 943.05 942.71 942.36488 943.67 943.34 943.11 942.77 942.366760 943.7 943.36 943.13 942.79 942.386997 943.74 943.4 943.17 942.83 942.427195 943.76 943.42 943.19 942.85 942.447480 943.78 943.45 943.21 942.87 942.467669 943.78 943.44 943.2 942.86 942.457808 943.8 943.46 943.22 942.88 942.467851 943.81 943.47 943.23 942.89 942.477978 943.84 943.5 943.25 942.91 942.498289 943.98 943.64 943.39 943.05 942.648451 944.02 943.68 943.43 943.09 942.688779 944.08 943.74 943.49 943.15 942.749076 944.13 943.8 943.55 943.21 942.819390 944.15 943.82 943.57 943.23 942.839763 944.2 943.87 943.62 943.29 942.88
10093 944.25 943.92 943.67 943.34 942.94

60 Stream-Profile Analyses Using a Step-Backwater Model for Selected Reaches in the Chippewa Creek Basin in Ohio
Table 3–1. Water-surface elevation along Chippewa Creek after decreasing the Manning’s roughness coefficient (n) for the main channel by 5, 10, 15, and 20 percent.—Continued
River station1
Water-surface elevation (in feet) associated with the indicated decrease in the Manning’s roughness coefficient (n) over the entire length of the main channel
0 percent 5 percent 10 percent 15 percent 20 percent
10396106961107611402117521217512590130401344713837143041472615157156351606816504167751696217055170961720417595180131842518814192261964320055204772086621265216582203122455229092293622976230702330223725
944.29944.32944.38944.43944.46944.51944.55944.64944.75944.8944.96945.05945.13945.22945.31945.38945.41945.41945.44945.45945.48945.57945.64945.71945.76945.83945.89945.94945.99946.04946.08946.13946.18946.24946.29946.29946.3946.37946.38946.43
943.97944944.07944.12944.16944.21944.26944.35944.46944.52944.69944.79944.87944.95945.04945.1945.14945.13945.16945.17945.21945.3945.37945.43945.48945.55945.6945.65945.7945.75945.79945.83945.89945.94945.99945.99945.99946.06946.08946.13
943.72943.76943.83943.88943.93943.97944.02944.11944.23944.28944.47944.56944.63944.72944.8944.86944.9944.88944.92944.93944.96945.05945.13945.19945.24945.31945.37945.42945.47945.51945.56945.6945.65945.71945.76945.76945.76945.82945.83945.89
943.39943.43943.5943.56943.61943.66943.71943.8943.91943.96944.16944.25944.33944.41944.49944.55944.59944.57944.61944.62944.66944.75944.82944.88944.93945945.05945.1945.15945.19945.24945.27945.33945.38945.42945.42945.42945.47945.49945.55
942.99943.03943.11943.18943.23943.29943.35943.43943.54943.59943.8943.89943.97944.04944.13944.19944.22944.2944.24944.25944.29944.38944.45944.52944.56944.63944.69944.74944.78944.82944.86944.9944.95945945.04945.04945.04945.07945.1945.16

Appendix 3 61
Table 3–1. Water-surface elevation along Chippewa Creek after decreasing the Manning’s roughness coefficient (n) for the main channel by 5, 10, 15, and 20 percent.—Continued
River station1
Water-surface elevation (in feet) associated with the indicated decrease in the Manning’s roughness coefficient (n) over the entire length of the main channel
0 percent 5 percent 10 percent 15 percent 20 percent
2413724488248852523825572259622637026704270892740027785282462834628391285172886129199295922986530191304843079431146315783201132479329513336033751341553427734348344513477635181355803603936176364673693237314
946.5946.57946.63946.65946.69946.72946.81946.83946.88946.91946.95947.01947.02947.04947.06947.16947.2947.26947.3947.36947.41947.46947.51947.58947.65947.72947.8947.85947.91947.97948948.02948.04948.11948.18948.24948.32948.34948.41948.49948.54
946.2946.27946.34946.36946.4946.43946.53946.54946.59946.63946.67946.72946.73946.74946.77946.87946.91946.96947.01947.06947.11947.17947.21947.28947.34947.41947.49947.54947.6947.66947.68947.71947.73947.79947.87947.93948948.02948.08948.17948.22
945.96946.03946.11946.13946.16946.2946.29946.31946.36946.39946.43946.47946.48946.5946.52946.62946.66946.71946.75946.8946.85946.9946.95947.01947.07947.14947.22947.27947.32947.37947.4947.43947.45947.51947.58947.64947.71947.73947.79947.87947.92
945.62945.69945.77945.8945.84945.88945.98945.99946.04946.08946.12946.16946.17946.18946.21946.32946.35946.41946.45946.5946.55946.61946.65946.71946.78946.84946.93946.98947.03947.09947.11947.14947.16947.23947.3947.36947.43947.45947.51947.6947.65
945.22945.29945.38945.41945.45945.5945.59945.61945.66945.69945.73945.77945.78945.79945.82945.93945.97946.02946.06946.11946.16946.22946.26946.32946.38946.45946.53946.58946.64946.69946.71946.74946.77946.83946.9946.96947.03947.05947.12947.2947.25

62 Stream-Profile Analyses Using a Step-Backwater Model for Selected Reaches in the Chippewa Creek Basin in Ohio
Table 3–1. Water-surface elevation along Chippewa Creek after decreasing the Manning’s roughness coefficient (n) for the main channel by 5, 10, 15, and 20 percent.—Continued
River station1
Water-surface elevation (in feet) associated with the indicated decrease in the Manning’s roughness coefficient (n) over the entire length of the main channel
0 percent 5 percent 10 percent 15 percent 20 percent
3773938109385263896639294395863984640103404264082241177413214137741438417884222642620430124344743912443024466945144451964520645241456644603446409466174673946788469704736947725480724846648833491984951749843
948.62948.69948.76948.83948.88948.94948.98949.02949.07949.16949.23949.26949.28949.29949.37949.46949.52949.59949.67949.76949.81949.87949.94949.94949.99950950.13950.25950.38950.41950.41950.45950.64950.79950.94951.08951.21951.36951.5951.61951.72
948.29948.36948.43948.5948.55948.6948.65948.69948.74948.83948.9948.93948.95948.96949.03949.13949.19949.26949.33949.42949.48949.53949.6949.6949.65949.66949.8949.91950.05950.08950.08950.12950.32950.47950.62950.76950.89951.04951.18951.29951.4
947.99948.06948.12948.19948.24948.29948.33948.38948.43948.51948.58948.61948.63948.64948.72948.81948.87948.94949.01949.1949.16949.21949.28949.28949.34949.35949.49949.6949.75949.77949.76949.8950.02950.17950.32950.46950.59950.74950.88950.98951.09
947.72947.79947.86947.93947.98948.03948.07948.11948.16948.25948.32948.36948.38948.38948.46948.56948.62948.69948.77948.86948.91948.97949.04949.03949.12949.13949.27949.38949.53949.56949.54949.59949.82949.97950.12950.26950.39950.54950.68950.79950.9
947.31947.38947.45947.53947.58947.63947.67947.71947.76947.85947.92947.96947.98947.98948.07948.17948.23948.3948.37948.46948.52948.57948.64948.64948.72948.74948.88949949.16949.18949.16949.2949.46949.61949.76949.9950.04950.19950.33950.44950.55

Appendix 3 63
Table 3–1. Water-surface elevation along Chippewa Creek after decreasing the Manning’s roughness coefficient (n) for the main channel by 5, 10, 15, and 20 percent.—Continued
River station1
Water-surface elevation (in feet) associated with the indicated decrease in the Manning’s roughness coefficient (n) over the entire length of the main channel
0 percent 5 percent 10 percent 15 percent 20 percent
5023350677508985102651305516235188652294526465296953294533115332953354536525410754508548275516355585559435599156023560615636956714570965751257895582985866458758587895883059197595475986460198605516091161169
951.83951.96952952.03952.11952.18952.28952.41952.53952.65952.77952.77952.74952.9953.15953.32953.44953.52953.63953.76953.84953.84953.76953.98954.23954.33954.45954.58954.72954.83954.93954.93954.86955.16955.35955.48955.56955.67955.8955.92956.02
951.52951.65951.68951.71951.8951.86951.96952.08952.21952.32952.44952.44952.39952.58952.84953.01953.13953.21953.31953.44953.52953.53953.43953.67953.92954.03954.15954.26954.41954.52954.61954.61954.53954.87955.07955.2955.29955.4955.53955.65955.76
951.21951.34951.38951.4951.49951.55951.65951.77951.89952.01952.12952.12952.06952.27952.54952.71952.84952.91953.01953.14953.21953.21953.1953.38953.63953.73953.85953.96954.1954.21954.3954.29954.19954.58954.78954.91955955.1955.23955.34955.45
951.02951.16951.19951.22951.3951.36951.46951.59951.71951.82951.93951.93951.87952.09952.37952.54952.67952.74952.84952.97953.03953.04952.92953.21953.47953.57953.69953.8953.94954.05954.13954.12954954.43954.62954.75954.84954.94955.07955.18955.28
950.67950.81950.85950.87950.96951.02951.12951.24951.36951.48951.57951.58951.5951.76952.05952.22952.35952.42952.51952.64952.7952.71952.57952.9953.17953.27953.38953.49953.62953.73953.81953.79953.65954.14954.33954.46954.54954.63954.76954.86954.97

64 Stream-Profile Analyses Using a Step-Backwater Model for Selected Reaches in the Chippewa Creek Basin in Ohio
Table 3–1. Water-surface elevation along Chippewa Creek after decreasing the Manning’s roughness coefficient (n) for the main channel by 5, 10, 15, and 20 percent.—Continued
River station1
Water-surface elevation (in feet) associated with the indicated decrease in the Manning’s roughness coefficient (n) over the entire length of the main channel
0 percent 5 percent 10 percent 15 percent 20 percent
6154561584616216173662179625696295763398638696430264643646906472164754652166565465987663216636566404664746678267142675376790868280686306898869018690446907169402698797031670700711687119571253712967172472093
956.14956.14956.05956.35956.73957.02957.34957.71958.14958.63959.03959.2959.25959.25959.78960.02960.23960.35960.43960.45960.51960.83961.14961.55961.8962.14962.5962.88962.93962.97963.12963.37963.84964.26964.56965.03965.12965.26965.27965.48965.57
955.88955.88955.77956.12956.51956.81957.13957.5957.94958.44958.85959.03959.08959.08959.63959.87960.08960.19960.27960.29960.34960.66960.95961.35961.59961.92962.28962.64962.7962.74962.91963.15963.61964.04964.35964.83964.93965.07965.08965.3965.39
955.57955.56955.43955.84956.22956.51956.82957.18957.61958.1958.52958.74958.79958.78959.35959.58959.79959.89959.97959.99960.05960.4960.71961.13961.38961.73962.09962.46962.53962.57962.76962.99963.43963.86964.15964.63964.74964.88964.9965.11965.21
955.4955.39955.24955.69956.07956.35956.66957.01957.44957.93958.34958.59958.64958.62959.21959.44959.65959.74959.82959.84959.89960.22960.51960.93961.16961.5961.86962.21962.29962.34962.54962.77963.22963.67963.97964.46964.57964.72964.73964.95965.06
955.07955.06954.87955.43955.78956.05956.35956.69957.09957.57957.98958.29958.34958.32958.93959.15959.36959.43959.52959.53959.59959.95960.26960.71960.95961.3961.67962.03962.13962.17962.39962.6963.03963.47963.76964.25964.37964.53964.54964.76964.87
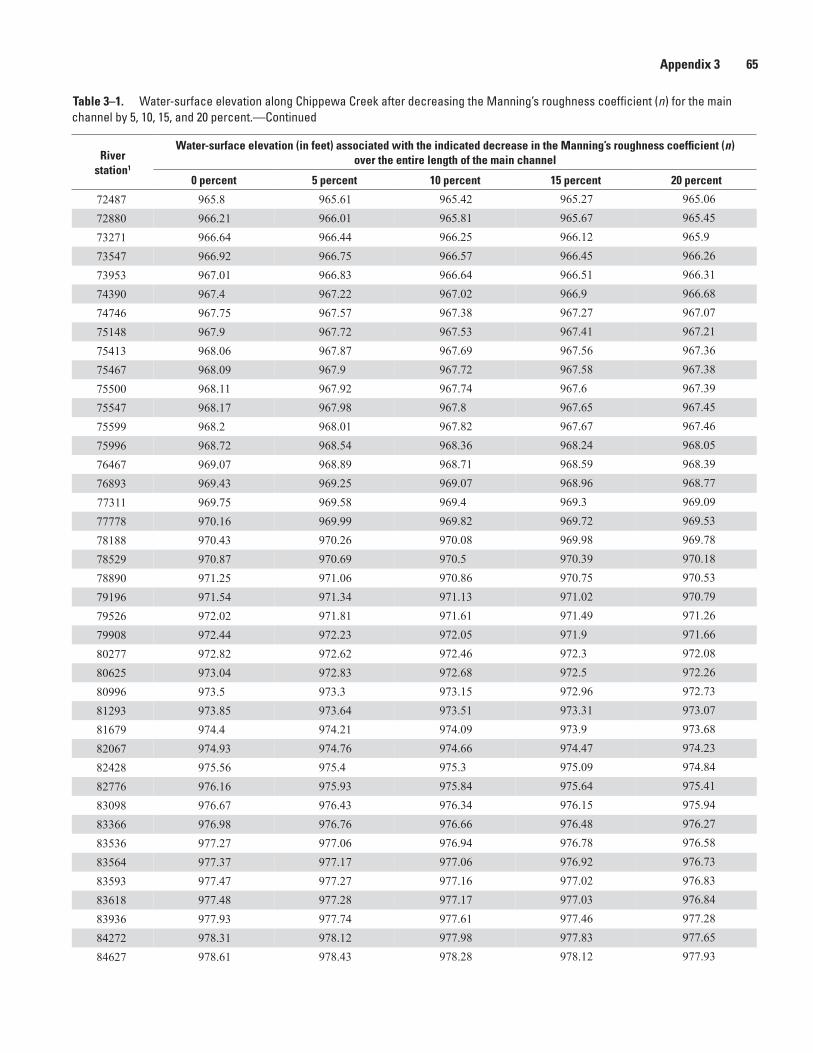
Appendix 3 65
Table 3–1. Water-surface elevation along Chippewa Creek after decreasing the Manning’s roughness coefficient (n) for the main channel by 5, 10, 15, and 20 percent.—Continued
River station1
Water-surface elevation (in feet) associated with the indicated decrease in the Manning’s roughness coefficient (n) over the entire length of the main channel
0 percent 5 percent 10 percent 15 percent 20 percent
7248772880732717354773953743907474675148754137546775500755477559975996764677689377311777787818878529788907919679526799088027780625809968129381679820678242882776830988336683536835648359383618839368427284627
965.8966.21966.64966.92967.01967.4967.75967.9968.06968.09968.11968.17968.2968.72969.07969.43969.75970.16970.43970.87971.25971.54972.02972.44972.82973.04973.5973.85974.4974.93975.56976.16976.67976.98977.27977.37977.47977.48977.93978.31978.61
965.61966.01966.44966.75966.83967.22967.57967.72967.87967.9967.92967.98968.01968.54968.89969.25969.58969.99970.26970.69971.06971.34971.81972.23972.62972.83973.3973.64974.21974.76975.4975.93976.43976.76977.06977.17977.27977.28977.74978.12978.43
965.42965.81966.25966.57966.64967.02967.38967.53967.69967.72967.74967.8967.82968.36968.71969.07969.4969.82970.08970.5970.86971.13971.61972.05972.46972.68973.15973.51974.09974.66975.3975.84976.34976.66976.94977.06977.16977.17977.61977.98978.28
965.27965.67966.12966.45966.51966.9967.27967.41967.56967.58967.6967.65967.67968.24968.59968.96969.3969.72969.98970.39970.75971.02971.49971.9972.3972.5972.96973.31973.9974.47975.09975.64976.15976.48976.78976.92977.02977.03977.46977.83978.12
965.06965.45965.9966.26966.31966.68967.07967.21967.36967.38967.39967.45967.46968.05968.39968.77969.09969.53969.78970.18970.53970.79971.26971.66972.08972.26972.73973.07973.68974.23974.84975.41975.94976.27976.58976.73976.83976.84977.28977.65977.93

66 Stream-Profile Analyses Using a Step-Backwater Model for Selected Reaches in the Chippewa Creek Basin in Ohio
Table 3–1. Water-surface elevation along Chippewa Creek after decreasing the Manning’s roughness coefficient (n) for the main channel by 5, 10, 15, and 20 percent.—Continued
River station1
Water-surface elevation (in feet) associated with the indicated decrease in the Manning’s roughness coefficient (n) over the entire length of the main channel
0 percent 5 percent 10 percent 15 percent 20 percent
8496385236854388561485628859138599386050861168647586852871768749787827880948834888603888988891489231895499001390396907179095791024910639115991460917419206092386926689294693282936229399894381947389513395480
978.96979.18979.35979.56979.74980.02980.04980.12980.94981.48981.68981.77981.82981.86981.89981.92981.94981.96981.96982.06982.08982.12982.15982.18982.18982.18982.19982.26982.3982.31982.32982.33982.34982.35982.35982.36982.37982.38982.39982.4982.43
978.78979979.17979.38979.58979.86979.86979.92980.83981.37981.57981.66981.71981.75981.78981.8981.83981.84981.85981.94981.97982.01982.04982.06982.06982.06982.07982.14982.19982.2982.21982.21982.23982.24982.25982.25982.26982.27982.29982.3982.32
978.63978.85979.01979.21979.43979.7979.68979.73980.74981.27981.47981.56981.61981.64981.68981.7981.72981.74981.74981.84981.87981.9981.93981.96981.96981.95981.96982.03982.08982.1982.1982.11982.12982.13982.14982.15982.16982.17982.18982.2982.22
978.47978.68978.83979.02979.29979.54979.51979.56980.67981.18981.38981.47981.52981.55981.58981.61981.63981.64981.65981.74981.77981.8981.83981.86981.86981.86981.86981.93981.99982982.01982.01982.03982.04982.05982.05982.06982.08982.09982.1982.13
978.28978.49978.63978.82979.18979.41979.36979.53980.64981.13981.31981.4981.45981.48981.51981.53981.55981.57981.57981.66981.69981.72981.75981.77981.77981.77981.78981.84981.9981.91981.92981.92981.94981.95981.96981.97981.98981.99982.01982.02982.04

Appendix 3 67
Table 3–1. Water-surface elevation along Chippewa Creek after decreasing the Manning’s roughness coefficient (n) for the main channel by 5, 10, 15, and 20 percent.—Continued
River station1
Water-surface elevation (in feet) associated with the indicated decrease in the Manning’s roughness coefficient (n) over the entire length of the main channel
0 percent 5 percent 10 percent 15 percent 20 percent
957929593296088962979645096611967329708697525979249823998605989919934299695
100060100505100902101334101803101821101850101868102076102400102694103027103298103610103977104468104494104538104550104572104925105202105570106006106361106788
982.43982.45982.79983.32983.48983.84984.15984.34984.47984.63984.77984.86985.05985.39985.79986.3987.03987.58988.08988.52988.63988.69988.74989.04989.43989.81990.09990.31990.53990.73990.97990.97990.98991.03991.04991.08991.09991.1991.11991.11991.12
982.32982.33982.65983.19983.36983.71984.03984.23984.36984.53984.69984.78984.97985.33985.72986.21986.94987.46987.94988.35988.47988.52988.58988.88989.26989.64989.91990.14990.35990.55990.8990.79990.8990.86990.86990.9990.91990.92990.93990.94990.95
982.23982.22982.54983.08983.25983.6983.9984.12984.26984.44984.61984.7984.91985.29985.67986.16986.89987.39987.86988.25988.37988.43988.48988.76989.13989.5989.76989.98990.19990.38990.63990.63990.63990.69990.7990.74990.75990.76990.77990.78990.78
982.13982.11982.41982.96983.12983.47983.77984984.14984.33984.53984.61984.82985.22985.59985.91986.51987.03987.55987.95988.08988.14988.19988.49988.87989.26989.52989.75989.96990.15990.41990.41990.41990.48990.49990.53990.54990.55990.57990.57990.58
982.05982.03982.3982.85983983.35983.64983.88984.02984.22984.43984.52984.73985.14985.5985.79986.35986.84987.36987.73987.87987.94987.99988.29988.66989.06989.32989.54989.76989.94990.21990.21990.21990.29990.3990.34990.35990.37990.38990.39990.4

68 Stream-Profile Analyses Using a Step-Backwater Model for Selected Reaches in the Chippewa Creek Basin in Ohio
Table 3–1. Water-surface elevation along Chippewa Creek after decreasing the Manning’s roughness coefficient (n) for the main channel by 5, 10, 15, and 20 percent.—Continued
River station1
Water-surface elevation (in feet) associated with the indicated decrease in the Manning’s roughness coefficient (n) over the entire length of the main channel
0 percent 5 percent 10 percent 15 percent 20 percent
107228107604108007108423108777109119109528110004110424110867111324111763112196112603112955113239113723114169114481114579114610114650114981115286115524115866116230116617116967117403117844118264118702119102119518119928120308120638121061121461121832
991.12991.13991.13991.13991.13991.13991.13991.13991.13991.13991.13991.13991.13991.13991.13991.13991.13991.13991.13991.13991.13991.13991.13991.13991.13991.13991.13991.13991.13991.13991.13991.14991.14991.14991.15991.16991.22991.3991.38991.87992.68
990.95990.95990.95990.95990.95990.95990.95990.95990.95990.95990.95990.95990.95990.95990.95990.95990.95990.95990.95990.95990.96990.96990.96990.96990.96990.96990.96990.96990.96990.96990.96990.96990.97990.97990.98990.99991.06991.13991.21991.7992.5
990.79990.79990.79990.79990.79990.79990.79990.79990.79990.79990.79990.79990.79990.79990.79990.79990.79990.79990.79990.79990.8990.8990.8990.8990.8990.8990.8990.8990.8990.81990.81990.81990.81990.81990.82990.84990.9990.97991.05991.52992.31
990.59990.59990.59990.59990.59990.59990.59990.59990.59990.59990.59990.59990.59990.59990.59990.59990.59990.59990.59990.59990.6990.6990.6990.6990.6990.6990.6990.6990.61990.61990.61990.61990.61990.62990.63990.65990.72990.79990.87991.37992.18
990.4990.41990.41990.41990.41990.41990.41990.41990.41990.41990.41990.41990.41990.41990.41990.41990.41990.41990.41990.41990.42990.42990.42990.42990.42990.43990.43990.43990.43990.43990.43990.43990.44990.44990.46990.47990.55990.62990.69991.17991.97

Appendix 3 69
Table 3–1. Water-surface elevation along Chippewa Creek after decreasing the Manning’s roughness coefficient (n) for the main channel by 5, 10, 15, and 20 percent.—Continued
River station1
Water-surface elevation (in feet) associated with the indicated decrease in the Manning’s roughness coefficient (n) over the entire length of the main channel
0 percent 5 percent 10 percent 15 percent 20 percent
122201 993.6 993.42 993.24 993.12 992.91122490 994.17 993.99 993.8 993.69 993.48122723 994.56 994.38 994.19 994.08 993.87122987 994.88 994.71 994.53 994.43 994.24123050 994.91 994.73 994.55 994.45 994.26123099 994.95 994.78 994.6 994.5 994.31123152 994.98 994.8 994.63 994.53 994.33123373 995.1 994.91 994.72 994.61 994.39123677 995.45 995.26 995.06 994.95 994.71124001 995.82 995.62 995.42 995.3 995.06124338 996.17 995.98 995.77 995.66 995.42
1 Referenced to feet above mouth.

70 Stream-Profile Analyses Using a Step-Backwater Model for Selected Reaches in the Chippewa Creek Basin in Ohio
940
945
950
955
960
965
970
975
980
985
990
0 5,000 10,000 15,000 20,000 25,000 30,000 35,000 40,000
Elev
atio
n, in
feet
abo
ve N
orth
Am
eric
an V
ertic
al D
atum
of 1
988
Distance upstream of mouth, in feet
SR 5
7 / W
adsw
orth
Rd
Priv
ate
driv
eBl
ake
Rd
I-76
/ SR
224
Gree
nwic
h Rd
Priv
ate
driv
e / f
ord
Sevi
lle R
d
Low
hea
d da
m
Wal
l Rd
E Su
nset
Dr
Gran
t St /
E O
hio
Ave
East
ern
Rd
Salt
StRa
ilroa
d
Railr
oad
Aban
done
d ra
ilroa
dAb
ando
ned
railr
oad
Priv
ate
road
Pipe
line
/ priv
ate
road
WS elevation
Minimum channel elevation
Hydraulic structure
EXPLANATION
WS elev after 5% reduction to the channel n
WS elev after 10% reduction to the channel n
WS elev after 15% reduction to the channel n
WS elev after 20% reduction to the channel n
Figure 3–2. Computed water-surface profiles for a bankfull discharge with Manning’s roughness coefficients in the main channel at current values and reduced by 5, 10, 15, and 20 percent on River Styx in Medina and Wayne Counties, Ohio. (WS, water surface; %, percent; n, Manning’s roughness coefficient)

Appendix 3 71
Table 3–2. Water-surface elevation, in feet, along River Styx after decreasing the Manning’s roughness coefficient (n) for the main channel by 5, 10, 15, and 20 percent.—Continued
River station1
Water-surface elevation (in feet) associated with the indicated decrease in the Manning’s roughness coefficient (n) over the entire length of the main channel
0 percent 5 percent 10 percent 15 percent 20 percent
189 945.07 944.84 944.62 944.5 944.26481 945.19 944.96 944.74 944.62 944.38782 945.3 945.08 944.85 944.73 944.49
1172 945.45 945.23 945 944.88 944.641515 945.6 945.37 945.14 945.03 944.781787 945.76 945.53 945.31 945.19 944.942190 945.98 945.75 945.53 945.41 945.172470 946.12 945.89 945.67 945.55 945.312685 946.2 945.97 945.75 945.63 945.392883 946.3 946.08 945.85 945.73 945.493147 946.44 946.22 945.99 945.87 945.633458 946.61 946.38 946.15 946.04 945.793807 946.8 946.57 946.33 946.21 945.963818 946.85 946.63 946.39 946.27 946.023866 946.91 946.68 946.45 946.33 946.083905 946.93 946.7 946.47 946.35 946.13924 946.93 946.7 946.46 946.34 946.093957 946.94 946.7 946.46 946.33 946.073969 946.98 946.75 946.51 946.38 946.133990 947.22 947.02 946.81 946.71 946.514016 947.25 947.04 946.84 946.74 946.534050 947.27 947.07 946.86 946.76 946.554078 947.3 947.09 946.88 946.78 946.574109 947.34 947.13 946.92 946.82 946.614232 947.48 947.27 947.07 946.97 946.764291 947.53 947.33 947.12 947.01 946.84344 947.6 947.39 947.18 947.08 946.874368 947.61 947.4 947.19 947.09 946.884514 947.82 947.62 947.42 947.32 947.114710 947.99 947.79 947.59 947.49 947.295180 948.24 948.04 947.83 947.73 947.525393 948.35 948.15 947.94 947.83 947.625433 948.36 948.15 947.94 947.84 947.625471 948.38 948.17 947.95 947.85 947.625585 948.63 948.44 948.24 948.14 947.955805 948.76 948.57 948.37 948.27 948.086097 948.9 948.7 948.51 948.41 948.216292 948.98 948.78 948.58 948.48 948.276358 949 948.8 948.59 948.48 948.266387 949.05 948.85 948.64 948.53 948.326451 949.2 948.98 948.77 948.66 948.436466 949.27 949.08 948.88 948.79 948.59

72 Stream-Profile Analyses Using a Step-Backwater Model for Selected Reaches in the Chippewa Creek Basin in Ohio
Table 3–2. Water-surface elevation, in feet, along River Styx after decreasing the Manning’s roughness coefficient (n) for the main channel by 5, 10, 15, and 20 percent.—Continued
River station1
Water-surface elevation (in feet) associated with the indicated decrease in the Manning’s roughness coefficient (n) over the entire length of the main channel
0 percent 5 percent 10 percent 15 percent 20 percent
651465966911729576758014829885858867889389599043923596099940
102121058611004114411191211943120161208012484127791307813395137531411814425147981482814874149411523315534158051607716358166821700317358
949.37949.46949.69949.94950.31950.58950.77951.03951.25951.34951.4951.45951.67951.88952.1952.39952.89953.36954.03954.66954.8954.88954.99955.22955.39955.56955.74955.96956.17956.35956.59956.67956.69956.71956.89957.08957.29957.47957.72957.99958.26958.44
949.18949.27949.5949.75950.12950.4950.58950.84951.06951.14951.2951.25951.47951.68951.9952.18952.69953.15953.82954.44954.59954.68954.8955.01955.18955.34955.52955.74955.94956.12956.36956.44956.47956.48956.66956.85957.05957.24957.49957.77958.05958.22
948.99949.09949.32949.56949.93950.21950.38950.65950.86950.95951951.05951.28951.48951.68951.96952.47952.93953.61954.21954.37954.46954.59954.81954.99955.15955.34955.56955.77955.95956.2956.29956.31956.32956.5956.7956.91957.1957.35957.64957.92958.09
948.89948.99949.22949.46949.84950.11950.28950.55950.76950.85950.91950.95951.18951.38951.58951.85952.37952.82953.49954.09954.26954.35954.48954.68954.84955955.17955.38955.58955.75955.99956.09956.11956.12956.3956.48956.69956.88957.13957.42957.71957.87
948.7948.8949.03949.26949.64949.92950.08950.35950.55950.65950.7950.74950.98951.17951.36951.62952.14952.58953.26953.85954.03954.12954.26954.47954.64954.79954.98955.19955.4955.57955.81955.93955.95955.95956.14956.32956.53956.72956.98957.25957.54957.69

Appendix 3 73
Table 3–2. Water-surface elevation, in feet, along River Styx after decreasing the Manning’s roughness coefficient (n) for the main channel by 5, 10, 15, and 20 percent.—Continued
River station1
Water-surface elevation (in feet) associated with the indicated decrease in the Manning’s roughness coefficient (n) over the entire length of the main channel
0 percent 5 percent 10 percent 15 percent 20 percent
177081778617801178441829518683190521929019623199092018420478205212057320648208432116421395217182177921805218582223522504228052306823466239372440824747251072550725771261482655426830272402726827341273752758527996
958.71958.79959.49959.52959.7959.84960960.06960.11960.19960.27960.47960.57960.58960.58960.66960.78960.83960.95960.95961.07961.16961.27961.39961.49961.59961.89962.42963963.44963.72963.97964.32964.65964.93965.06965.35965.35965.84965.94966.44967.1
958.5958.58959.39959.41959.59959.72959.89959.94959.99960.06960.14960.34960.44960.45960.44960.52960.65960.7960.82960.82960.94961.03961.14961.26961.36961.45961.75962.31962.92963.35963.64963.9964.24964.61964.88965.01965.28965.27965.73965.86966.33966.97
958.37958.46959.33959.34959.53959.66959.83959.88959.93960960.07960.26960.37960.38960.37960.44960.56960.61960.73960.73960.85960.95961.06961.18961.28961.37961.67962.25962.88963.31963.61963.86964.19964.58964.85964.97965.22965.2965.64965.78966.24966.88
958.15958.25959.27959.27959.46959.58959.74959.79959.83959.89959.95960.14960.25960.26960.25960.32960.43960.49960.61960.61960.73960.83960.93961.05961.15961.23961.52962.12962.77963.2963.52963.78964.09964.51964.78964.9965.14965.12965.54965.7966.13966.75
957.96958.07959.23959.23959.41959.52959.67959.71959.75959.81959.86960.03960.14960.15960.14960.2960.31960.36960.49960.49960.61960.72960.83960.95961.04961.12961.42962.02962.67963.09963.43963.69963.98964.42964.69964.82965.04965.01965.42965.62966.02966.6

74 Stream-Profile Analyses Using a Step-Backwater Model for Selected Reaches in the Chippewa Creek Basin in Ohio
Table 3–2. Water-surface elevation, in feet, along River Styx after decreasing the Manning’s roughness coefficient (n) for the main channel by 5, 10, 15, and 20 percent.—Continued
River station1
Water-surface elevation (in feet) associated with the indicated decrease in the Manning’s roughness coefficient (n) over the entire length of the main channel
0 percent 5 percent 10 percent 15 percent 20 percent
283762885129243297102984029960300763033830611308153116631480317213198932162323713266432671326803269332695329583319933442339033407134515347953518535551357783601536301366463691036936369923704437421377723778437813
967.57967.99968.66969.33969.51969.83970.06970.44971.21971.79972.37972.65972.79973.16973.56973.9974.26974.3974.32974.32974.32974.5974.93975.36976.03976.4976.92977.36977.87978.63979.31979.79980.1980.43980.59980.66980.75980.75981.08981.53981.64981.87
967.44967.86968.53969.2969.37969.69969.93970.3971.08971.7972.28972.57972.7973.08973.48973.82974.18974.21974.24974.24974.23974.41974.82975.25975.93976.3976.81977.26977.77978.52979.18979.67979.96980.29980.45980.53980.63980.62980.92981.34981.48981.72
967.37967.78968.42969.09969.24969.55969.79970.16970.96971.61972.19972.48972.6972.99973.39973.73974.09974.13974.16974.15974.15974.31974.7975.14975.82976.2976.69977.15977.66978.4979.04979.54979.84980.17980.34980.42980.52980.51980.8981.21981.36981.62
967.24967.65968.31969.01969.15969.46969.71970.07970.89971.56972.15972.43972.55972.93973.32973.65974.01974.05974.08974.07974.07974.22974.58975.02975.7976.09976.57977.03977.54978.27978.9979.41979.71980.05980.21980.3980.41980.4980.67981.07981.25981.52
967.1967.5968.17968.87969969.3969.57969.92970.75971.47972.05972.34972.45972.84973.25973.58973.96973.99974.02974.02974.01974.15974.51974.94975.64976.03976.5976.97977.48978.2978.83979.34979.64979.99980.15980.24980.35980.34980.61981981.19981.47

Appendix 3 75
Table 3–2. Water-surface elevation, in feet, along River Styx after decreasing the Manning’s roughness coefficient (n) for the main channel by 5, 10, 15, and 20 percent.—Continued
River station1
Water-surface elevation (in feet) associated with the indicated decrease in the Manning’s roughness coefficient (n) over the entire length of the main channel
0 percent 5 percent 10 percent 15 percent 20 percent
378363809638378387543878738811390743926739530398104014240484407734102241373417214194842001420654216842355426744292543167
981.87982.13982.41982.8982.85982.85982.95983.29983.65983.87984.05985.08985.56985.83986.59987.15987.31987.33987.38987.49987.56988.11988.66988.83
981.72981.99982.26982.67982.72982.72982.82983.16983.54983.76983.93984.99985.51985.76986.5987.1987.25987.28987.32987.42987.48987.97988.55988.72
981.62981.89982.17982.59982.65982.65982.73983.08983.46983.69983.83984.92985.45985.69986.42987.05987.2987.22987.27987.36987.41987.86988.45988.64
981.51981.78982.04982.46982.53982.52982.6982.95983.35983.59983.74984.87985.43985.65986.37987.03987.17987.2987.24987.33987.37987.81988.41988.59
981.46981.71981.94982.35982.42982.42982.48982.82983.24983.48983.61984.79985.37985.58986.28986.98987.11987.13987.17987.27987.3987.69988.31988.5
1 Referenced to feet above mouth.

76 Stream-Profile Analyses Using a Step-Backwater Model for Selected Reaches in the Chippewa Creek Basin in Ohio
939
940
941
942
943
944
945
946
947
948
949
950
951
952
953
954
955
956
957
958
959
0 2000 4000 6000 8000 10000 12000 14000 16000 18000
Elev
atio
n, in
feet
abo
ve N
orth
Am
eric
an V
ertic
al D
atum
of 1
988
Distance upstream of the mouth, in feet
S M
ain
St
Priv
ate
road
SR 6
04 /
East
on R
d
WS elevation
Minimum channel elevation
Hydraulic structure
EXPLANATION
WS elev after 5% reduction to the channel n
WS elev after 10% reduction to the channel n
WS elev after 15% reduction to the channel n
WS elev after 20% reduction to the channel n
Figure 3–3. Computed water-surface profiles for a bankfull discharge with Manning’s roughness coefficients in the main channel at current values and reduced by 5, 10, 15, and 20 percent on Little Chippewa Creek in Wayne County, Ohio. (WS, water surface; %, percent; n, Manning’s roughness coefficient)

Appendix 3 77
Table 3–3. Water-surface elevation, in feet, along Little Chippewa Creek after decreasing the Manning’s roughness coefficient (n) for the main channel by 5, 10, 15, and 20 percent.—Continued
River station1
Water-surface elevation (in feet) associated with the indicated decrease in the Manning’s roughness coefficient (n) over the entire length of the main channel
0 percent 5 percent 10 percent 15 percent 20 percent
68 951.29 951.07 950.84 950.72 950.42349 951.34 951.12 950.89 950.77 950.47557 951.39 951.18 950.95 950.82 950.53824 951.48 951.25 951.02 950.89 950.58886 951.57 951.35 951.12 951 950.71965 951.62 951.4 951.17 951.05 950.77
1015 951.62 951.41 951.18 951.05 950.761326 951.83 951.62 951.4 951.27 9511516 951.89 951.68 951.46 951.33 951.061721 951.95 951.74 951.52 951.39 951.111942 952.02 951.81 951.59 951.46 951.192251 952.1 951.88 951.66 951.53 951.262515 952.18 951.97 951.74 951.61 951.342799 952.28 952.06 951.84 951.71 951.433029 952.33 952.12 951.9 951.76 951.483260 952.35 952.14 951.92 951.79 951.513553 952.41 952.21 951.99 951.87 951.63597 952.43 952.23 952.02 951.89 951.623631 952.45 952.25 952.03 951.91 951.633717 952.48 952.28 952.06 951.93 951.663875 952.58 952.39 952.18 952.06 951.794200 952.65 952.46 952.25 952.12 951.864565 952.74 952.54 952.33 952.2 951.934920 952.88 952.68 952.46 952.34 952.075306 953 952.79 952.58 952.45 952.185588 953.06 952.86 952.64 952.51 952.245990 953.19 952.98 952.75 952.62 952.346349 953.31 953.1 952.88 952.75 952.476778 953.42 953.2 952.96 952.83 952.556976 953.5 953.27 953.03 952.9 952.67357 953.74 953.52 953.28 953.15 952.867637 953.84 953.61 953.37 953.23 952.958024 953.99 953.76 953.52 953.38 953.098386 954.15 953.9 953.66 953.52 953.238713 954.26 954.01 953.76 953.62 953.338972 954.38 954.12 953.87 953.73 953.449304 954.53 954.27 954.01 953.87 953.589579 954.69 954.43 954.16 954.02 953.719852 954.95 954.69 954.43 954.29 953.99
10171 955.12 954.86 954.59 954.45 954.1510511 955.31 955.04 954.77 954.63 954.32

78 Stream-Profile Analyses Using a Step-Backwater Model for Selected Reaches in the Chippewa Creek Basin in Ohio
Table 3–3. Water-surface elevation, in feet, along Little Chippewa Creek after decreasing the Manning’s roughness coefficient (n) for the main channel by 5, 10, 15, and 20 percent.—Continued
River station1
Water-surface elevation (in feet) associated with the indicated decrease in the Manning’s roughness coefficient (n) over the entire length of the main channel
0 percent 5 percent 10 percent 15 percent 20 percent
1080511148115111154011634116731186512065121951230512705130241325113422135731391614336147741523115507158051605416328166971704017272175521783518186
955.52955.64955.87955.88955.93955.94956.11956.18956.23956.27956.43956.57956.66956.73956.82956.97957.19957.38957.62957.78957.91958.05958.14958.42958.69958.81959.03959.22959.46
955.25955.38955.61955.62955.67955.68955.86955.93955.99956.03956.19956.33956.42956.49956.58956.73956.96957.16957.39957.55957.69957.84957.92958.2958.48958.6958.82959.01959.24
954.98955.1955.34955.35955.4955.41955.61955.68955.74955.78955.95956.09956.18956.25956.35956.5956.73956.93957.16957.33957.46957.61957.69957.98958.25958.37958.6958.8959.01
954.84954.95955.2955.21955.26955.27955.47955.54955.6955.64955.81955.96956.05956.12956.22956.37956.6956.81957.04957.21957.34957.5957.57957.86958.14958.25958.48958.68958.89
954.54954.65954.91954.91954.97954.97955.2955.26955.32955.37955.54955.69955.79955.86955.96956.12956.36956.56956.8956.97957.1957.26957.33957.62957.9958.01958.24958.44958.64
1 Referenced to feet above mouth.


Straub and Ebner—Stream
-Profile Analyses Using a Step-Backwater M
odel for Selected Reaches in the Chippewa Creek Basin—
Scientific Investigation Report 2011–5024