strategies for multiscale modeling and simulation of...
TRANSCRIPT

UNCORRECTED PROOF
Strategies for multiscale modeling and simulation of organic materials:polymers and biopolymers
William A. Goddard III*, Tahir Cagin, Mario Blanco, Nagarajan Vaidehi, Siddharth Dasgupta,Wely Floriano, Michael Belmares, Jeremy Kua, Georgios Zamanakos, Seichi Kashihara,
Mihail Iotov, Guanghua Gao
Division of Chemistry and Chemical Engineering, California Institute of Technology, Materials and Process Simulation Center, 139-74,
Pasadena, CA 91125, USA
Received 21 September 2000; revised 7 February 2001; accepted 9 February 2001
Abstract
Advances in theory and methods are making it practical to consider fully ®rst principles (de novo) predictions of structures, properties and
processes for organic materials. However, despite the progress there remains an enormous challenge in bridging the vast range of distances
and time scales between de novo atomistic simulations and the quantitative continuum models for the macroscopic systems essential in
industrial design and operations. Recent advances relevant to such developments include: quantum chemistry including continuum solvation
and force ®eld embedding, de novo force ®elds to describe phase transitions, molecular dynamics (MD) including continuum solvent, non
equilibrium MD for rheology and thermal conductivity and mesoscale simulations. To provide some ¯avor for the opportunities we will
illustrate some of the progress and challenges by summarizing some recent developments in methods and their applications to polymers and
biopolymers. Four different topics will be covered: (1) hierarchical modeling approach applied to modeling olfactory receptors, (2)
stabilization of leucine zipper coils by introduction of tri¯uoroleucine, (3) modeling response of polymers sensors for electronic nose,
and (4) diffusion of gases in amorphous polymers. q 2001 Elsevier Science Ltd. All rights reserved.
Keywords: Quantum mechanics; Force ®eld; Molecular dynamics
1. Introduction
In order to develop new materials and compositions with
designed new properties, it is essential that these properties
be predicted before preparation, processing, and experimen-
tal characterization. Despite the tremendous advances made
in the modeling of the structural, thermal, mechanical and
transport properties of materials at the macroscopic level
(®nite element analysis of complicated structures) there
remains tremendous uncertainty about how to predict
many critical properties related to performance. The funda-
mental problem here is that these properties depend on the
atomic level interactions and chemistry (e.g. making and
breaking of bonds) dealing with the electronic and atomic
level description at the level of nanometers and pico-
seconds. The materials designer needs answers from macro-
scopic modeling (®nite element paradigm) of components
having scales of centimeters and milliseconds or larger. To
dramatically advance the ability to design useful high
performance materials, it is essential that we insert the
chemistry into the mesoscopic and macroscopic (®nite
element) modeling.
The dif®culties in doing this are shown in Fig. 1, where
we see that vast length and time scales separate the quantum
mechanics (QM) from the macroscopic world of engineer-
ing design. Tremendous advances have been made recently
in ®rst principles QM predictions of chemical reactions, but
the state of the art can handle accurately reactions with only
,50 atoms. There is no practical approach to carrying out a
QM calculation on the initiation and propagation of a crack
through a stabilized zirconia ceramic. Despite this dif®culty,
the computations MUST be based on accurate ®rst-principles
QM if we are to predict the properties of new materials.
Our strategy for accomplishing this objective is to
develop an overlapping array of successively coarser
modeling techniques. At each plateau (a range of length
and time scales), the parameters of the coarse description
are based on the parameters of the immediately ®ner
description, as shown in Fig. 1. Thus based on accurate
QM calculations we ®nd a force ®eld (FF) including
charges, force constants, polarization, van der Waals
1
2
3
4
5
6
7
8
9
10
11
12
13
14
15
16
17
18
19
20
21
22
23
24
25
26
27
28
29
30
31
32
33
34
35
36
37
38
39
40
41
42
43
44
45
46
47
48
49
50
51
52
53
54
55
56
57
58
59
60
61
62
63
64
65
66
67
68
69
70
71
72
73
74
75
76
77
78
79
80
81
82
83
84
85
86
87
88
89
90
91
92
93
94
95
96
97
98
99
100
101
102
103
104
105
106
107
108
109
110
111
112
Computational and Theoretical Polymer Science 00 (2001) 000±000
CTPS221
1089-3156/01/$ - see front matter q 2001 Elsevier Science Ltd. All rights reserved.
PII: S1089-3156(01)00025-3
www.elsevier.nl/locate/ctps
* Corresponding author. Tel.: 11-626-395-2731; fax: 11-626-585-0918.
E-mail address: [email protected] (W.A. Goddard III).
Computational and Theoretical Polymer Science ± Model 5 ± Ref style 3 ± AUTOPAGINATION 2 14-06-2001 11:48 all ABAlden

UNCORRECTED PROOF
interactions etc that accurately reproduces the QM. With the
FF, the dynamics is described with Newton's equations
[molecular dynamics (MD)], instead of the Schrodinger
Equation.
The MD level allows one to predict the structures and
properties for systems ,105 times larger than for QM,
allowing direct simulations for the properties of many inter-
esting systems. This leads to many results relevant and
useful in materials design, however, many critical problems
in materials design require time and length scales for too
large for practical MD.
Thus we need to develop methods treating the mesoscale
in between the atomic length and time scales of MD and the
macroscopic length and time scales (microns to mm and ms
to s) of ®nite element analysis (FEA). This linking through
the mesoscale in which we can describe microstructure is
probably the greatest challenge to developing reliable
®rst principles methods for practical materials' design
applications.
Only by establishing this connection from microscale to
mesoscale it is possible to build ®rst principles methods for
describing the properties of new materials and composites.
Our aim is to reach the domain of materials science and
engineering by building from fundamental principles of
physics and chemistry. Thus, for fundamental predictions
to play a direct role in materials innovation and design, it
is essential to bridge the micro±meso gap. The problem here
is that the methods of coarsening the description from
atomistic to mesoscale or mesoscale to continuum is not
so obvious as it was in going from electrons to atoms. For
example, the strategy for polymers seems quite different
than for metals, which seem different from ceramics or
semiconductors.
Given the concepts, it is necessary to carry out calcula-
tions for realistic time scales fast enough to be useful in
design. This requires developing software tools useful by
design engineers, by incorporating the methods and results
of the QM to MD to mesoscale simulations. To accomplish
the goals of developing methods for accurate calculations of
materials and properties, we focus on: (i) implementations
that make full use of modern highly parallel computers, and
(ii) building in knowledge based heuristic methods of acces-
sing this information automatically so that designers can
focus on the macroscopic issues without concern for the
details of theory and simulation. At this point, we expect a
revolution in materials design and innovations where the
®rst-principles multiscale modeling and simulations play
increasing role in the design stage and complementing the
experiments.
2. Progress in methods developments
Our strategy is to transcend from the most fundamental
theory (QM) to practical engineering designs in a sequence
of several levels as indicated in Fig. 1.
2.1. Quantum mechanics
2.1.1. Ab initio quantum chemistry applications
It is important to use QM to describe systems in which
bonds are being broken and formed. Only then can we be
sure to obtain accurate barrier heights and bond energies.
The modern methods of QM (generalized valence bond
(GVB) [1], pseudo spectral generalized valence bond (PS-
GVB) [2], multi-reference con®guration integral (MR-CI)
[3], and (gaussian dual space density functional theory
(GDS-DFT) [4]) can give accurate barriers for reactions
useful in studying the properties of nanoscale materials.
However, despite the progress in ®rst principles electronic
structure theory, the calculations are often far too slow for
studying the dynamics of nanotechnology applications. This
is necessary to have general approaches for averaging the
electrons from QM to obtain an FF in terms of atomic posi-
tions. For ®nite molecules; A new methodology (PS-GVB)
combining pseudo-spectral (PS) multi-grid and de-aliasing
strategies with the sophisticated many-body wave functions
[generalized valence bond (GVB)] were implemented and
applied to large scale problems. PS-GVB led to consider-
ably better scaling with size (N2 rather than the N3, N4,
N5, N6 characteristic of alternative methods) and simpler
W.A. Goddard et al. / Computational and Theoretical Polymer Science 00 (2001) 000±0002
113
114
115
116
117
118
119
120
121
122
123
124
125
126
127
128
129
130
131
132
133
134
135
136
137
138
139
140
141
142
143
144
145
146
147
148
149
150
151
152
153
154
155
156
157
158
159
160
161
162
163
164
165
166
167
168
169
170
171
172
173
174
175
176
177
178
179
180
181
182
183
184
185
186
187
188
189
190
191
192
193
194
195
196
197
198
199
200
201
202
203
204
205
206
207
208
209
210
211
212
213
214
215
216
217
218
219
220
221
222
223
224
Fig. 1. Multiscale modeling hierarchy.
Computational and Theoretical Polymer Science ± Model 5 ± Ref style 3 ± AUTOPAGINATION 2 14-06-2001 11:48 all ABAlden

UNCORRECTED PROOF
parallelization. PS-GVB has been extended to treat all
atoms of the periodic table (using core effective potentials),
handle new sophisticated wave functions (GVB-RCI, MP2),
and describe important properties (solvation energies,
reaction rates, activation/reaction barriers). We will opti-
mize these methods for parallel implementations, and
extend the methodology to include GVB-RCI-MP2 and
self-consistent GVB-RCI.
2.1.2. Density functional theory applications
Most practical materials properties require a description
of in®nite systems using periodic boundary conditions
(PBC). This is three-dimensional (3D) for bulk properties
or two-dimensional (2D) for surface growth and interfaces.
For this purpose, we have developed a new method, Gaus-
sian dual space density functional theory (GDS±DFT), in
which most parts scale linearly with N. In implementing
this, we have developed a new separable pseudo-potential
that can be applied to all atoms of the periodic table. We
reformulated the theories for electronic structure calcula-
tions of periodic systems in a way suitable for large-scale
calculations using Gaussian basis functions. An accurate
grid is introduced for ef®cient calculation of matrix
elements. A dual-space approach is used to calculate the
Coulomb potential with computational cost that scales line-
arly with the size of basis set. Preconditioned generalized
conjugate gradients approach is introduced for rapidly
converging wave functions expressed in terms of Gaussian
basis functions. This method is applied to a variety of
systems with excellent results.
2.2. Force ®elds (FF)
Using quantum mechanical results we develop FF
descriptions to provide the energetics needed for the simu-
lations of the nano-phase materials and their properties. The
FF must even be accurate enough to obtain the proper
energy differences for representing phase behavior of the
materials and transferable so that one can apply it to
phase transformations and interface phenomena. Standard
FF generally uses simple springs to represent bonds and
angles in describing structures and vibrations of molecules.
Generally this is not suf®ciently accurate to obtain a FF that
accurately describes the properties of a speci®c class of
molecules or polymers. For better FF, we ®t to the QM
using the Hessian-Biased FF (HBFF) [5] approach, which
combines normal mode information from HF theory with
the frequency information from theory or experiment. This
HBFF approach has been used to develop accurate FF for
polymers (e.g. PE, PVDF, nylon, POM, SiH) [6±10], cera-
mics (e.g. Si3N4, C3N4), [11,12] semiconductors [13] and
metals [14].
On the other hand, for fast qualitatively considerations of
new systems, we ®nd that generic FF suitable for general
classes of systems are most useful. DREIDING FF [15] (for
the main group elements) and the Universal force ®eld
(UFF) [16] (all elements, including inorganics and organo-
metallics) are such FF.
In recent years we made critical advances made in devel-
oping ab QM based FF for describing
(a) metals where many-body interactions play critical role
on their physical properties; [17±21]
(b) oxides, ceramics, and zeolites where competition
between ionic and covalent bonding is often very impor-
tant, especially in describing polymorphic phase transi-
tions, reactions, surface and interface properties; [22±24]
(c) covalent bonded systems such as carbon, hydrocar-
bons, silicon, germanium and their behavior far from
equilibrium where the description of bond breaking and
forming must be a part of an accurate classical description
[24,25].
2.3. Molecular mechanics and molecular dynamics: MPSim
Using these FFs in large-scale MD simulations allows
practical calculations on up to several millions of atoms.
Our objective is to develop new strategies and algorithms
in addition to taking advantage evolving hardware and soft-
ware technologies to extend the time and distance scale to
100s of ns and close to microns. This will involve using fast
multi-pole techniques, multiple time step approaches,
NEIMO (Newton Euler inverse mass operator) method,
CFA (constrained force algorithms) method, hyper MD
approaches where they are suitable.
The focus here is on extending the methods of MD to
physical systems of molecules, polymers, liquids, and inor-
ganic materials with up to 100 million atoms while accu-
rately treating long-range interactions using the cell multi-
pole method (CMM). For fast internal coordinate dynamics
on a million atoms, we have developed the NEIMO method.
This methodology handles periodic systems and will be
extended (Gibbs-Ensemble MD. The applications for this
method will enable us to investigate the long time dynamics
of liquid polymer and solid interfaces; which has tremen-
dous impact on broad range of technological applications;
such as wetting, adhesion, phase separation, coatings.
In MD simulations, the FF is used to predict the equations
of motion. This leads to trajectories �xi�t�; vi�t�;¼ �1;¼; 3N� that can be analyzed (using statistical mechanics
and thermodynamics [26] principles) to obtain macroscopic
properties. MD simulations of heterogeneous nano-phase
materials may require millions of atoms to be considered
explicitly (a 25 nm cube of polyethylene has 1 million
atoms). The most time-consuming aspect of the MD simu-
lations of large systems is the accurate evaluation of the
long-range interactions (electrostatic and dispersion),
which decrease slowly with distance. Without cutoffs, this
cost scales as order (N2) for N particles (a system of 10
million atom leads to 1014 terms to be evaluated each
step). Using cutoffs may reduce the computational cost.
However, the cutoffs can lead to excessive errors. For a
W.A. Goddard et al. / Computational and Theoretical Polymer Science 00 (2001) 000±000 3
225
226
227
228
229
230
231
232
233
234
235
236
237
238
239
240
241
242
243
244
245
246
247
248
249
250
251
252
253
254
255
256
257
258
259
260
261
262
263
264
265
266
267
268
269
270
271
272
273
274
275
276
277
278
279
280
281
282
283
284
285
286
287
288
289
290
291
292
293
294
295
296
297
298
299
300
301
302
303
304
305
306
307
308
309
310
311
312
313
314
315
316
317
318
319
320
321
322
323
324
325
326
327
328
329
330
331
332
333
334
335
336
Computational and Theoretical Polymer Science ± Model 5 ± Ref style 3 ± AUTOPAGINATION 2 14-06-2001 11:48 all ABAlden

UNCORRECTED PROOF
periodic system, the Ewald procedure leads to accurate
summations for these interactions, but the problem scales
as N1.5, totally impractical for systems with million atoms
[27,28]. In order to simulate systems with millions of atoms,
we developed methods and optimized parallel computer
programs ef®cient for high capacity MD with the following
advanced features:
(i) Cell multipole method [29] (CMM) which dramati-
cally reduces the cost of long-range Coulomb and van
der Waals interactions while retaining high accuracy.
The cost scales linearly with size, allowing atomic-level
simulations for million atom systems [30±33].
(ii) Reduced cell multipole method [34] (RCCM) which
handles the special dif®culties with long-range Coulomb
interactions for crystals by combining a reduced unit cell
plus CMM for interactions between the unit cell with its
adjacent cells. The cost scales linearly with size while
retaining high accuracy, allowing simulation of crystals
having a million atoms per unit cell (the major use is for
models of amorphous and semi-crystalline materials).
(iii) Newton Euler inverse mass operator method
(NEIMO) [35±37] for internal coordinate dynamics
(e.g. treats torsions only). This allows the solution of
the dynamical equations for internal coordinates without
inverting the mass tensor (moment of inertia tensor). The
cost of NEIMO is linear in the number of degrees of
freedom and small compared to other costs for million
atom systems. More recently, we also developed a new
constrained force algorithm (CFA) for massively parallel
MD simulation of polymers and dendrimer [38,39].
(iv) Advanced MD algorithms to simulate systems under
constant temperature and constant pressure conditions
[40,41].
(v) Nonequilibrium MD We have implemented synthetic
equations of motions to simulate various nonequilibrium
conditions to predict transport properties such as viscos-
ity, thermal conductivity of materials [42±45]. Using
these methods, we have studied the effect of molecular
topology of liquid alkanes on their measured viscosity
indices [46,47].
(vi) Steady state MD Methods are used to simulate non-
equilibrium processes such as friction and wear in nano-
scopically con®ned lubricants and diamond surfaces.
Here, the external work is dissipated through the material
and coupled to a thermal bath using the Langevin
equation [48±52].
2.4. Continuum solvent approaches
Solvents can have a major effect on the structure and
properties of polymers. Consequently, we must include
the solvent in the MD simulations. The costs are signi®cant.
For instance, in studying the Frechet Stimuli-responsive
dendrimer our simulations included ,1609 atoms of the
dendrimer plus ,80,000 atoms of solvent. Such explicit
solvent calculations are compute-intensive and we have
searched for accurate ways to obtain an implicit description
of these solvent effects. In the biological literature, it is
common to ignore the solvent and to modify the coulomb
interactions between the atoms of the proteins by using a
distance dependent dielectric constant. This is too crude for
our purposes. Instead, we replace the solvent with a conti-
nuum solvent, the Poisson±Boltzmann approximation [53].
This approach provides a solution for large-scale solvation
problems. It includes local solvent reorganization using
explicit ®rst solvation layer. This PB continuum solvation
description serves as an intermediate step between implicit
and explicit solvent simulations. We have used this the
continuum solvent approach to study various polymers
and biopolymers. Although the PB approximation greatly
decreases the cost of accurate solvation, the PB calculation
is still the expensive component of force evaluation in each
MD step. Consequently, we are currently using another
promising approach generalized Born (GB) method, in our
MD simulations [54].
3. Applications
3.1. Multiscale modeling of biopolymers
Multi-scale modeling techniques are very vital to
research problems in biology. From the ®ne level calcula-
tion of accurate binding energies for drug molecules using
QM to coarse level structure prediction for proteins (both
globular and membrane) and understanding viral protein
coat assembly are some of the typical cases that require
multi-scale modeling for biological systems. Such modeling
schemes are also critical in bioengineering problems that
offer excellent control in growth of a self-assembly at
nanoscale. We have developed methods using CCBB MC
[55,56] to predict the structure of globular proteins [57±59]
and transmembrane proteins (G-protein coupled receptors).
We have used this method to predict the structures of odor
receptors in mammalian olfaction system. To understand the
molecular basis of odor recognition we need to have an
atomic level model of these odor receptors.
3.1.1. Multi-scale modeling techniques for deriving the
atomic level structure of odor receptors
Odor receptors are seven helical domain membrane
proteins that belong to the family of G-protein coupled
receptors. We have used a combination of hydrophobicity
pro®le prediction methods [60,61] and large-scale coarse
grain MD methods with proper description of differential
solvent environment to derive the atomic model for odor
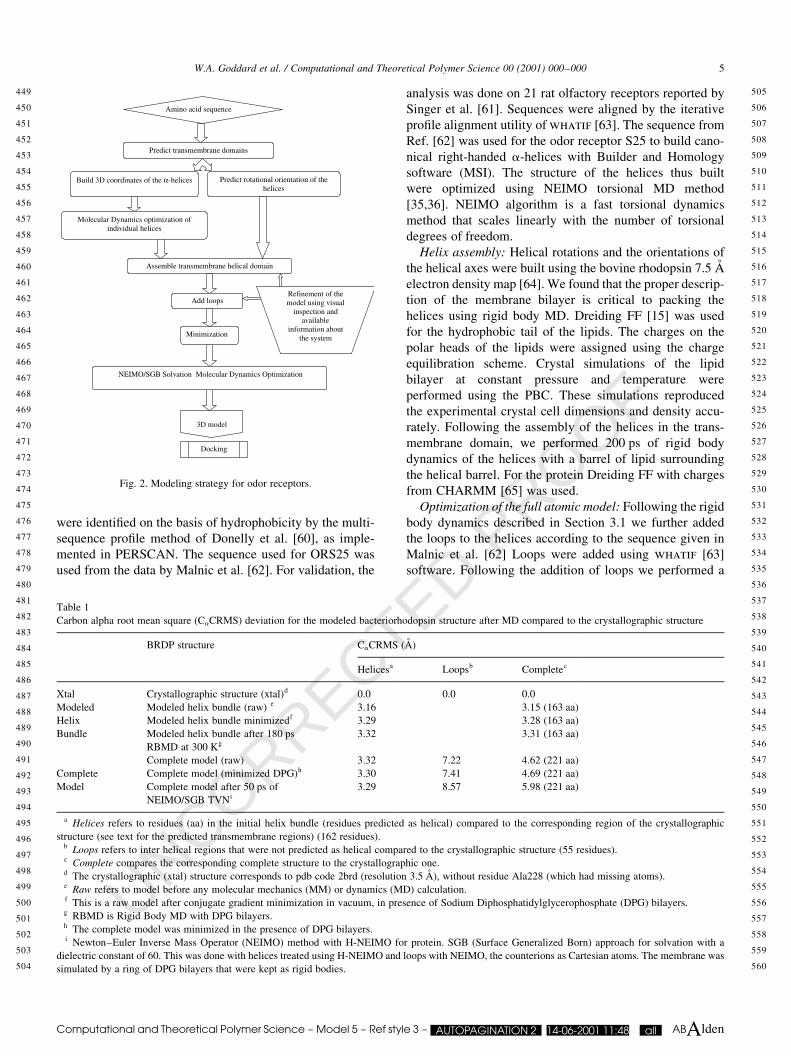
receptor OR S25. The protocol used for the multiscale
modeling is shown in Fig. 2
Prediction of helical regions using hydrophobicity
pro®les and optimization: The trans-membrane helices
W.A. Goddard et al. / Computational and Theoretical Polymer Science 00 (2001) 000±0004
337
338
339
340
341
342
343
344
345
346
347
348
349
350
351
352
353
354
355
356
357
358
359
360
361
362
363
364
365
366
367
368
369
370
371
372
373
374
375
376
377
378
379
380
381
382
383
384
385
386
387
388
389
390
391
392
393
394
395
396
397
398
399
400
401
402
403
404
405
406
407
408
409
410
411
412
413
414
415
416
417
418
419
420
421
422
423
424
425
426
427
428
429
430
431
432
433
434
435
436
437
438
439
440
441
442
443
444
445
446
447
448
Computational and Theoretical Polymer Science ± Model 5 ± Ref style 3 ± AUTOPAGINATION 2 14-06-2001 11:48 all ABAlden
UNCORRECTED PROOF
were identi®ed on the basis of hydrophobicity by the multi-
sequence pro®le method of Donelly et al. [60], as imple-
mented in PERSCAN. The sequence used for ORS25 was
used from the data by Malnic et al. [62]. For validation, the
analysis was done on 21 rat olfactory receptors reported by
Singer et al. [61]. Sequences were aligned by the iterative
pro®le alignment utility of whatif [63]. The sequence from
Ref. [62] was used for the odor receptor S25 to build cano-
nical right-handed a-helices with Builder and Homology
software (MSI). The structure of the helices thus built
were optimized using NEIMO torsional MD method
[35,36]. NEIMO algorithm is a fast torsional dynamics
method that scales linearly with the number of torsional
degrees of freedom.
Helix assembly: Helical rotations and the orientations of
the helical axes were built using the bovine rhodopsin 7.5 AÊ
electron density map [64]. We found that the proper descrip-
tion of the membrane bilayer is critical to packing the
helices using rigid body MD. Dreiding FF [15] was used
for the hydrophobic tail of the lipids. The charges on the
polar heads of the lipids were assigned using the charge
equilibration scheme. Crystal simulations of the lipid
bilayer at constant pressure and temperature were
performed using the PBC. These simulations reproduced
the experimental crystal cell dimensions and density accu-
rately. Following the assembly of the helices in the trans-
membrane domain, we performed 200 ps of rigid body
dynamics of the helices with a barrel of lipid surrounding
the helical barrel. For the protein Dreiding FF with charges
from CHARMM [65] was used.
Optimization of the full atomic model: Following the rigid
body dynamics described in Section 3.1 we further added
the loops to the helices according to the sequence given in
Malnic et al. [62] Loops were added using whatif [63]
software. Following the addition of loops we performed a
W.A. Goddard et al. / Computational and Theoretical Polymer Science 00 (2001) 000±000 5
449
450
451
452
453
454
455
456
457
458
459
460
461
462
463
464
465
466
467
468
469
470
471
472
473
474
475
476
477
478
479
480
481
482
483
484
485
486
487
488
489
490
491
492
493
494
495
496
497
498
499
500
501
502
503
504
505
506
507
508
509
510
511
512
513
514
515
516
517
518
519
520
521
522
523
524
525
526
527
528
529
530
531
532
533
534
535
536
537
538
539
540
541
542
543
544
545
546
547
548
549
550
551
552
553
554
555
556
557
558
559
560
Fig. 2. Modeling strategy for odor receptors.
Table 1
Carbon alpha root mean square (CaCRMS) deviation for the modeled bacteriorhodopsin structure after MD compared to the crystallographic structure
BRDP structure CaCRMS (AÊ )
Helicesa Loopsb Completec
Xtal Crystallographic structure (xtal)d 0.0 0.0 0.0
Modeled Modeled helix bundle (raw) e 3.16 3.15 (163 aa)
Helix Modeled helix bundle minimizedf 3.29 3.28 (163 aa)
Bundle Modeled helix bundle after 180 ps
RBMD at 300 Kg
3.32 3.31 (163 aa)
Complete model (raw) 3.32 7.22 4.62 (221 aa)
Complete Complete model (minimized DPG)h 3.30 7.41 4.69 (221 aa)
Model Complete model after 50 ps of
NEIMO/SGB TVNi
3.29 8.57 5.98 (221 aa)
a Helices refers to residues (aa) in the initial helix bundle (residues predicted as helical) compared to the corresponding region of the crystallographic
structure (see text for the predicted transmembrane regions) (162 residues).b Loops refers to inter helical regions that were not predicted as helical compared to the crystallographic structure (55 residues).c Complete compares the corresponding complete structure to the crystallographic one.d The crystallographic (xtal) structure corresponds to pdb code 2brd (resolution 3.5 AÊ ), without residue Ala228 (which had missing atoms).e Raw refers to model before any molecular mechanics (MM) or dynamics (MD) calculation.f This is a raw model after conjugate gradient minimization in vacuum, in presence of Sodium Diphosphatidylglycerophosphate (DPG) bilayers.g RBMD is Rigid Body MD with DPG bilayers.h The complete model was minimized in the presence of DPG bilayers.i Newton±Euler Inverse Mass Operator (NEIMO) method with H-NEIMO for protein. SGB (Surface Generalized Born) approach for solvation with a
dielectric constant of 60. This was done with helices treated using H-NEIMO and loops with NEIMO, the counterions as Cartesian atoms. The membrane was
simulated by a ring of DPG bilayers that were kept as rigid bodies.
Computational and Theoretical Polymer Science ± Model 5 ± Ref style 3 ± AUTOPAGINATION 2 14-06-2001 11:48 all ABAlden

UNCORRECTED PROOF
full minimization of all the atoms with a barrel of lipid
surrounding the protein. Counterions Na1 and Cl21 were
added to neutralize acidic and basic residue side chains.
The outside of the lipid layer was simulated using a conti-
nuum solvent description model (the surface generalized
Born model [66]). A dielectric of 60.0 was used to simulate
the low dielectric region surrounding the membrane. To
optimize the solution structure further we then performed
a multiscale mixed mode dynamics. The helices and loops
in the protein were modeled using the NEIMO torsional
MD, the lipids were treated as rigid bodies and the counter-
ions as free Cartesian atoms. Constant temperature mixed
mode dynamics yielded an optimum model for the atomic
structure.
Control simulations: Our protocol described above was
®rst tested on bacteriorhodopsin, a membrane protein for
which the crystal structure has been ®tted with fair accuracy
in the transmembrane region of the protein. We started from
the sequence of bacteriorhodopsin, used no knowledge of
the crystal structure, and built the complete model using the
above protocol. The overall RMS deviation in coordinates
of Ca atoms for the ®nal model is 5.98 AÊ for all the 221
amino acids. The CRMS for the residues in the membrane
barrel is 3.29 AÊ while that for the loops is 8.57 AÊ . It is seen
from Table 1 that the multiscale modeling improved the
model by making the loops more ¯exible and de®ning the
helical regions consistently. Thus, this modeling procedure
gives a very reasonable model for a known membrane
protein. Having evaluated the control protein, we further
used the same protocol for modeling olfactory receptors.
Modeling of S25 olfactory receptor: The odor receptor
S25 from Malnic et al. [64] has odor detection responses
only to alcohols and not the other acids tested. We built the
model using the sequence for S25 from Malnic et al. [64]
and the procedures described above. The membrane is simu-
lated using explicit lipid bilayers of Dilauroylphosphatidyl
choline (DPC). The choice of lipid in the OR case is
supported by experimental indications that the membrane
surrounding the ORs in vivo can be satisfactory simulated
using a single component lipid system of DPC. The ®nal
atomic level model used in further docking studies is
showed in Fig. 3. Using the HEIR-Dock protocol [67±69]
we have predicted the binding site for alcohol and acid
odorants in ORS25. This dynamic receptor structure not
only points to a likely odor-binding site but also indepen-
dently predicts the two compounds that experimentally best
activate ORS25. The results provide a mechanistic model
for olfactory transduction at the molecular level and show
how the basic GPCR template is adapted for encoding the
enormous odor space.
3.1.2. Stabilization of leucine zipper coiled coils by
introduction of tri¯uoroleucine [70]
Engineering of stable enzymes and robust therapeutic
proteins is of central importance to the biotechnology and
pharmaceutical industries. Although protein engineering
provides powerful tools for the enhancement of enzymatic
activity and protein stability, the scope of in vivo engineer-
ing methods is limited by the availability of just 20 naturally
occurring proteinogenic amino acids. Increasing success in
the incorporation of non-canonical amino acids into recom-
binant proteins in vivo has allowed the introduction of novel
side-chain functionality into engineered proteins. This
raises prospects of new approaches to the design of peptides
and proteins of enhanced activity and/or stability. The effect
of ¯ourination of the side chains of substitution of leucine
residues by 5,5,5-tri¯uoroleucine at the d-positions of the
leucine zipper peptide GCN4-p1 increases the thermal stabi-
lity of the coiled-coil structure [70]. To determine the
origins of the stabilizing effect of side-chain ¯uorination,
we carried out MD calculations using a continuum descrip-
tion of the solvent (Ref. [20]). A good description of solvent
is critical to the simulation of biological systems. While
using explicit solvent molecules in the simulation is compu-
tationally tedious Ghosh et al. [66] and Tannor et al. [2]
have recently derived continuum solvent models that
describe the solvent reaction ®eld fairly accurate. In this
study, we have clearly shown that the effect of solvation
is well described both quantitatively on the binding energies
and the structure prediction for ¯uorinated leucine zippers.
The mpsim md program and the dreiding ff were used for
all calculations. The starting structure for the Leu-GCN4-p1
dimer was taken from the RCSB Protein Data Bank. The
¯uorinated dimers were derived from the native dimer struc-
ture by replacement of the appropriate methyl hydrogens
with ¯uorines, followed by re-optimization of the structure.
Because the g-carbon of tri¯uoroleucine (TFL) is asym-
metric, multiple arrangements of adjacent diastereotopic
W.A. Goddard et al. / Computational and Theoretical Polymer Science 00 (2001) 000±0006
561
562
563
564
565
566
567
568
569
570
571
572
573
574
575
576
577
578
579
580
581
582
583
584
585
586
587
588
589
590
591
592
593
594
595
596
597
598
599
600
601
602
603
604
605
606
607
608
609
610
611
612
613
614
615
616
617
618
619
620
621
622
623
624
625
626
627
628
629
630
631
632
633
634
635
636
637
638
639
640
641
642
643
644
645
646
647
648
649
650
651
652
653
654
655
656
657
658
659
660
661
662
663
664
665
666
667
668
669
670
671
672
Fig. 3. The tri¯uoroleucine subsituted gcn4-pl leucine zipper is shown in
the center. Possible con®gurations of the leucine/tri¯uoroleucine stereo-
center at the g-carbon on tri¯uoroleucine. Shown here are the various
packing possibilities considered in the MD simulations. (A) Leu/Leu; (B)
4S/4S, `close'; (C) 4R/4R, `far'; (D) 4R/4S; (E) 4S/4R; and (F) H¯/H¯,
where both leucines are substituted with hexa¯uoroleucine.
Computational and Theoretical Polymer Science ± Model 5 ± Ref style 3 ± AUTOPAGINATION 2 14-06-2001 11:48 all ABAlden

UNCORRECTED PROOF
tri¯uoro-methyl groups must be considered (Fig. 3). When
both T¯ residues at a given d-position are of the (2S,4S)
con®guration, the two tri¯uoromethyl groups are relatively
close to one another; the ¯uorinated carbon centers are sepa-
rated by ca. 6 AÊ . On the other hand, when two (2S,4R)
isomers are juxtaposed, the corresponding carbon±carbon
distance increases to about 8 AÊ . The tri¯uoromethyl groups
are separated by intermediate distances, in the remaining
con®gurations (where the two strands carry different
isomers). We performed simulations on all con®gurations,
to determine how side-chain stereochemistry affects dimer
stability. For each dimer we carried out 1 ns of constant
temperature (300 K) Nose±Hoover MD with the SGB
description of the water solvent.
From the 1 ns trajectory, we calculated the average prop-
erties over 800 ps after equilibration. The binding energies
were calculated as the difference in potential energies of the
solvated dimer and the corresponding solvated monomers.
Table 2 reports the average values of the binding energy
(per monomer) for the native and ¯uorinated forms.
The T¯-GCN4-p1 dimers are predicted to exhibit binding
energies (Table 2) ca. 55% larger than that of the leucine
form (calculated relative to the respective random coil
monomers). The various stereochemical arrangements lead
to increases ranging from 44 to 71%, indicating that side-
chain con®guration may have some differential effect on
dimer stability. This is in excellent agreement with the
experimentally measured free energy difference between
T¯-GCN4-p1 and GCN4-pl which is 57%. Similar analysis
of a hexa¯uoroleucine (H¯) dimer leads to the prediction
that such dimers (which were not prepared experimentally
in this work) would be less stable than the T¯ dimers but
marginally more stable (19%) than the wild type.
To investigate the source of stability of the ¯uorinated
dimers we analyzed the components of the binding energy
for each peptide. The primary driving forces for stabilizing
the T¯-GCN4-p1 dimers are predicted to arise from van der
Waals (vdW) and hydrogen bonding interactions. Consid-
eration of electrostatic (intra- and inter-peptide coulomb
forces) and solvation interactions suggests a hydrophobic
effect that favors burial of CF3 rather than CH3 in the
dimer. If just coulomb and solvation interactions are consid-
ered, the driving force for dimerization is predicted to
decrease in the order Hfl . Tfl . Leu: It is the balance of
desolvation, electrostatics, H-bonding and vdW forces that
leads to the prediction that the T¯ dimers are more stable
than the H¯ dimer which is more stable than the native
leucine dimer. The average helicities of dimers are predicted
to be 90.8% for Leu-GCN4-p1, 83.5% for T¯, and 78.5% for
H¯.
Our results demonstrate that the subtle change from four
leucine methyl groups to four tri¯uoromethyl groups results
in a large gain in stability of the folded structure. It is
remarkable that the inclusion of the solvation effects predict
the structures and binding energies between the two
peptides with good accuracy.
3.2. Modeling polymer sensors for the electronic nose
The Lewis group at Caltech [71±74] has experimentally
constructed a particular design of an electronic nose.
Sensors are built with conducting leads connected through
thin ®lm polymers loaded with carbon black. Odorant detec-
tion relies on a change in electric resistivity of the polymer
®lm as function of the amount of swelling caused by the
odorant vapor. The amount of swelling depends upon the
chemical composition of the polymer and the odorant mole-
cule. An array of 20 carbon black loaded polymers give rise
to a speci®c change in resistivity patterns upon exposure to a
given molecular species. The pattern is unique and unam-
biguously identi®es the compound [73,74].
It is of great value to be able to correlate from ®rst prin-
ciples the change of resistivity of a given polymer sensor
with the chemical nature of the solvent. Predictions of this
type may be of practical use for increasing the electronic
nose sensitivity for speci®c compounds such as those found
in the wine, cheese or perfume industries, or for detecting
nerve gases and air bound compounds emanating from
explosives. Here we report a molecular modeling method
that provides a strong correlation between the calculated
properties of a series of polymers and solvents and the
experimental relative change in the resistivity of the sensors
upon exposure to these solvents.
3.2.1. Method
The permeability of a solvent in a polymer is related to
the heat of sorption as follow [75]
P � P0exp�2DEs=RT� exp�2DHs=RT� �1�P0 is the exponential pre-factor related to entropy, DHs is
W.A. Goddard et al. / Computational and Theoretical Polymer Science 00 (2001) 000±000 7
673
674
675
676
677
678
679
680
681
682
683
684
685
686
687
688
689
690
691
692
693
694
695
696
697
698
699
700
701
702
703
704
705
706
707
708
709
710
711
712
713
714
715
716
717
718
719
720
721
722
723
724
725
726
727
728
729
730
731
732
733
734
735
736
737
738
739
740
741
742
743
744
745
746
747
748
749
750
751
752
753
754
755
756
757
758
759
760
761
762
763
764
765
766
767
768
769
770
771
772
773
774
775
776
777
778
779
780
781
782
783
784
Table 2
Binding energies (BE, kcal/mol) of Leu-GCN4-p1 and ¯uorinated dimers.
BE is the difference in the potential energy (averaged over 800 ps of MD
after equilibration) of solvated monomers and the solvated dimer each from
separate SGB MD calculations (®nal solvation energies with PBF). BE is
quoted per mole of the monomer. % increase is the increase in BE
compared to the Leu-GCN4-p1 structure. Also shown is the % helicity of
each
Structure BE Increase (%) Helicity (%)a
Leu-GCN4-p1 65.08 0 90.8
Close (4S,4S)b 93.75 44 84.3
Far (4R,4R) 98.14 51 79.4
Mixed (4S,4R) 99.20 52 81.1
Mixed (4R,4S) 111.15 71 89.3
T¯-average 100.56 55 83.5
H¯-GCN4-1p 77.21 19 78.5
a Helicity quoted here has been calculated as the ratio of the residues with
torsion angles f and c in the helical region of the Ramachandran plot to the
total number of residues in the protein.b Close, Far, Mixed: con®guration of the pair of tri¯uoromethyl groups as
shown in Fig. 3. T¯-average: the averaged binding energy of the four
con®gurations.
Computational and Theoretical Polymer Science ± Model 5 ± Ref style 3 ± AUTOPAGINATION 2 14-06-2001 11:48 all ABAlden

UNCORRECTED PROOF
the heat of sorption of the solvent in the polymer, and Es is
the activation energy for diffusion of the molecule in the
polymer. Because the amount of swelling at a ®xed time is
proportional to the permeability of the polymer towards the
solvent, the change in resistivity, DR/R, could be modeled
with an expression similar to Eq. (1). A computational
method for the estimation of the heat of sorption, or other
strongly correlated property, would be valuable.
Hansen [76,77] proposed an extension of the Hildebrand
parameter method to estimate the relative miscibility of
polar and hydrogen bonding systems
d2 � d2d 1 d2
p 1 d2h �2�
Where d corresponds to the Hildebrand solubility para-
meter,
d2 � DHv=Vm �3�The two quantities are not expected to be identical any
more than the Hildebrand parameters of liquids with speci®c
interactions are identical when determined by different
methods. DHv is the heat of vaporization and Vm the molar
volume. The Hansen solubility parameters in Eq. (2) are
determined empirically based on many experimental obser-
vations. Here we introduced a new modeling method to
estimate Hansen solubilities. Furthermore, we use the
predicted Hansen enthalpies Hi � Vmd2i of the polymer
and solvent molecules to construct a model for the change
in relative resistivity
DR=R � R0exp�2gVk=RT� expX
bi�H�k�i 2 H�n�i �� �
�4�Where DR/R is the change in resistivity upon exposing
polymer sensor n to odorant k, R0 is sensor's resistivity in
air. Hi(k) and H�n�i �i � 1; 2; 3� are the three components (elec-
trostatic, dispersion, and hydrogen bond) of the solvent and
polymer Hansen enthalpies, respectively. These compo-
nents are calculated using ®rst principles MD in a suitable
FF [15,16]. DEk � gVk is a diffusion barrier directly propor-
tional to the molecular volume of the solvent. This relation
follows from the fact that the diffusion coef®cient is linearly
related to the molar volume of the penetrant, particularly
when the temperature is greater than the glass transition (Tg)
of the polymer [78].
3.2.2. Hansen parameters from MD simulations
A precise method was developed to estimate the Hansen
solubilities of solvents and polymers from MD calculations
under PBC. The procedure has been coded as a single appli-
cation under the Software Developer's Kit (SDK) distribu-
ted by MSI [79]. A unit cell of twelve solvent molecules (or
four polymer chains) is built at 50% of the target density.
This step is accomplished with the amorphous builder in the
Cerius2 software package [80] with a Van der Waals radius-
scaling factor of 0.30. If available the experimental density
of the solvent or polymer are used as a target value, although
the ®nal density may differ slightly depending on the FF
employed. The charges of the isolated solvent or polymer
molecules were based on the charge equilibration method
[81] and the rest of the parameters were taken from the
Dreidiing force®eld [15]. The potential energy of the bulk
system is minimized for 5000 steps or until the atom rms
force converges to 0.10 kcal/mol AÊ . 750 steps of MD (1 fs/
step) at a temperature of 700 K using canonical ®xed
volume dynamics (TVN) is carried out to anneal the sample.
The cell is then minimized with the previous procedure. The
reduced cell coordinates are shrunk such that the density is
64% of the target density. The atoms' coordinates are mini-
mized and dynamics is done on the system with the
previously described procedure holding the cell ®xed. A
total of ®ve compression, dynamics, and minimization
cycles are performed until the density reaches 120% of
the target density. Then the cell parameters are increased
in ®ve reverse cycles of expansion, dynamics, and minimi-
zation until the target density is reached. Finally, the sample
is allowed to relax in a minimization involving the cell and
the atoms' coordinates. The Hansen enthalpy components
are calculated by subtracting the potential energy of the bulk
system from the sum of the potential energies of the indivi-
dual molecules separated at an in®nite distance. This
process is repeated ten times with different initial random
packing. Hansen solubility parameters and molar volumes
were computed as well as the standard deviations. In poly-
mer calculations, the number of monomers in each chain
was determined such that the total volume of the four chains
was approximately 5900 AÊ 3. The initial polymer amorphous
structures were constructed using a one-dimensional rota-
tional isomeric states (RIS) approach to achieve a correct
distribution of conformational states.
3.2.3. Results and discussion
The experimentally determined relative resistivity of
seven polymer sensors upon exposure to twenty-four
solvent vapors was correlated with the calculated Hansen
enthalpy components and molar volumes via Eq. (4). The
correlation is shown in Fig. 4 for seven electronic nose
polymer sensors and 24 solvents.
Strong linear correlations (Table 3) between the experi-
mentally determined [82] change in resistivity and the
permeability-related expression Eq. (4) were found for
seven different polymer sensors (polymethylmethacrylate
W.A. Goddard et al. / Computational and Theoretical Polymer Science 00 (2001) 000±0008
785
786
787
788
789
790
791
792
793
794
795
796
797
798
799
800
801
802
803
804
805
806
807
808
809
810
811
812
813
814
815
816
817
818
819
820
821
822
823
824
825
826
827
828
829
830
831
832
833
834
835
836
837
838
839
840
841
842
843
844
845
846
847
848
849
850
851
852
853
854
855
856
857
858
859
860
861
862
863
864
865
866
867
868
869
870
871
872
873
874
875
876
877
878
879
880
881
882
883
884
885
886
887
888
889
890
891
892
893
894
895
896
Table 3
Pearson R correlation values and slopes of predicted versus experimental
DR/R for each of seven polymer odorant detectors
Polymer sensor Slope R
Polycaprolactone 0.858 0.925
Polysulfone 0.932 0.962
PMMA 0.678 0.827
PEVA 0.888 0.936
Polyethylene 0.870 0.933
Polyethyleneoxide 0.746 0.874
4-HydroxyPS 1.018 0.991
Computational and Theoretical Polymer Science ± Model 5 ± Ref style 3 ± AUTOPAGINATION 2 14-06-2001 11:49 all ABAlden

UNCORRECTED PROOF(PMMA), 4-hydroxypolystyrene (4HPS), polyethyleneoxide
(PEO), polyethylene (PE), polyethylenevinylacetate (PEVA),
polysulfone, and caprolactone). Eq. (4) ®tting parameters
for the various polymer sensors are given in Table 4.
Calculated densities and Hansen solubilities for the seven
polymers and 24 solvents are summarized in Table 5.
The slopes and the Pearson R values for the correlation
plots are listed in Table 4. The correlation was particularly
good for polysulfone, 4-hydroxypolystyrene and PEVA
(polyethylene-co-vinyl acetate) and especially poor for
polymethylmethacrylate based on both correlation slope
and the Pearson R values for the linear ®t. Polysulfone
appears to discriminate between solvents of different sizes
since the free volume fraction is small and the free volume
distribution may be narrow, resulting in a `molecular' sieve
effect. Additionally, the experimental relative change in
resistivity in polysulfone ranges from zero to 1.0, which
makes it a particularly good high-resolution sensor.
The polyethylene-co-vinyl acetate detector also corre-
lates reasonably well with the theoretical relative change
in resistivity. However, the relative change in resistivity
range is smaller compared to polysulfone indicating that it
is less discriminating towards ester and alcohol solvents. A
possible explanation that accounts for this observation is
that PEVA contains polar ester functional groups due to
the vinyl content (18%), as well as non-polar components
due to the polyethylene content (82%). PEVA has a glass
transition below room temperature and as a result contains a
large free volume fraction. This decreases the sensitivity
towards molecules of different sizes compared to high Tg
polymers such as polysulfone. The third particularly good
detector in terms of signal correlation with theoretical
prediction is 4-hydroxy-polystyrene. This detector is parti-
cularly sensitive to molecules functionalized with highly
polar groups such as alcohol, obviously due to the hydroxyl
functional group. However, the sensitivity of this sensor to
moderately polar or non-polar solvents such as esters is
particularly low.
3.3. Diffusion of gases in amorphous polymers
The diffusion of molecules in polymer matrices involves
mesoscale times [microseconds (ms) to seconds (ms)], far
too long for routine MD simulations [83±86]. Consequently
we formulated the Monte Carlo Void Diffusion (MCVD)
method to calculate diffusion of gases in polymer matrices
for very long time scales based on coarse-grained informa-
tion extracted from short [sub nanoseconds (ns)] MD simu-
lations. The MD (over ,200 ps) is used to de®ne a
probability of having a void at each point of a grid. The
MCVD considers random motion of a penetrant molecule
on this grid. We show that the MC and MD both give rise to
an anomalous �R2 / t1=2� behavior at short time and
Einstein diffusion behavior �R2 / t� at long time. Compar-
ing the MD and MC at short time (,200 ps) provides the
corresponding time for the MCVD step. It is practical to
carry out MCVD for mesoscale times (ms to s). This repre-
sents an example of how to connect dynamics from the
atomistic scale to the meso scale. The results reported are
on studies of the diffusion of He in an amorphous poly-
ethylene (PE) matrix.
The permeability (P) of a gas through a membrane can be
written as [87]
P � DS �5�where D is the diffusion coef®cient and S is the solubility.
Generally, only P is available experimentally, but D and S
often depend differently on the various design parameters.
The total distance (R) travelled in a time (t) is given by the
Einstein relation
R2D E
� 6Dt as t ! 1 �6�where k l designates averaging over the ensemble of starting
W.A. Goddard et al. / Computational and Theoretical Polymer Science 00 (2001) 000±000 9
897
898
899
900
901
902
903
904
905
906
907
908
909
910
911
912
913
914
915
916
917
918
919
920
921
922
923
924
925
926
927
928
929
930
931
932
933
934
935
936
937
938
939
940
941
942
943
944
945
946
947
948
949
950
951
952
953
954
955
956
957
958
959
960
961
962
963
964
965
966
967
968
969
970
971
972
973
974
975
976
977
978
979
980
981
982
983
984
985
986
987
988
989
990
991
992
993
994
995
996
997
998
999
1000
1001
1002
1003
1004
1005
1006
1007
1008
0.00
0.20
0.40
0.60
0.80
1.00
1.20
0.00 0.20 0.40 0.60 0.80 1.00
Experimental ∆R/Ro
Equ
atio
n(4
)
Fig. 4. Correlation between modeled and experimental changes in resistiv-
ity of seven polymer sensors exposed to 24 solvents.
Table 4
Model parameters (Eq. (4)) for seven electronic nose polymer sensors
Model parameter PMMA 4HPS PEO PE PEVA Poly sulfone Capro-lactone
Pre-exponential LnR0 0.676 0.233 20.761 2.296 0.770 1.092 20.813
Electrostatic b 1 20.001 20.028 0.014 0.040 0.018 20.001 0.019
Dispersion b 2 0.007 20.007 0.012 0.047 0.020 20.007 0.031
Hydrogen bond b 3 0.026 0.042 0.016 0.060 0.030 0.029 0.040
Diffusion g 0.009 0.033 0.003 0.011 0.007 0.012 0.006
Computational and Theoretical Polymer Science ± Model 5 ± Ref style 3 ± AUTOPAGINATION 2 14-06-2001 11:49 all ABAlden

UNCORRECTED PROOF
and ending points for the given time interval t. To predict D
for a He in PE, we perform a number of MD calculations,
each starting with He in various sites, for times suf®ciently
long that Eq. (6) is obeyed.
An example is given in Fig. 5a below on the left of He
diffusion in PE. Here we see that 1.5 ns of MD leads to the
behavior in Eq. (6). Hence, the MD can be used to determine
D. The Fig. 5b on the right shows that for O2 in a PVC/
PVDC copolymer, 1.5 ns of MD is not suf®cient to display
Einsteinian diffusion, and we estimate that this latter case
requires a ms time scale.
Fig. 6 shows the trajectories for ®ve He atoms diffusing
for 1.5 ns in PE. There are three-dimensional regions (we
call them felicitons) in which the gases spend signi®cant
times [ < 20±70 picoseconds (ps)] separated by pseudo
one-dimensional channels where they spend shorter times
( < 5±20 ps). Calculations on various gas molecules (H2,
CO2, O2, He, Ar) diffusing in various amorphous polymers
give similar results, suggesting that this feliciton-channel
network is generally observed in MD.
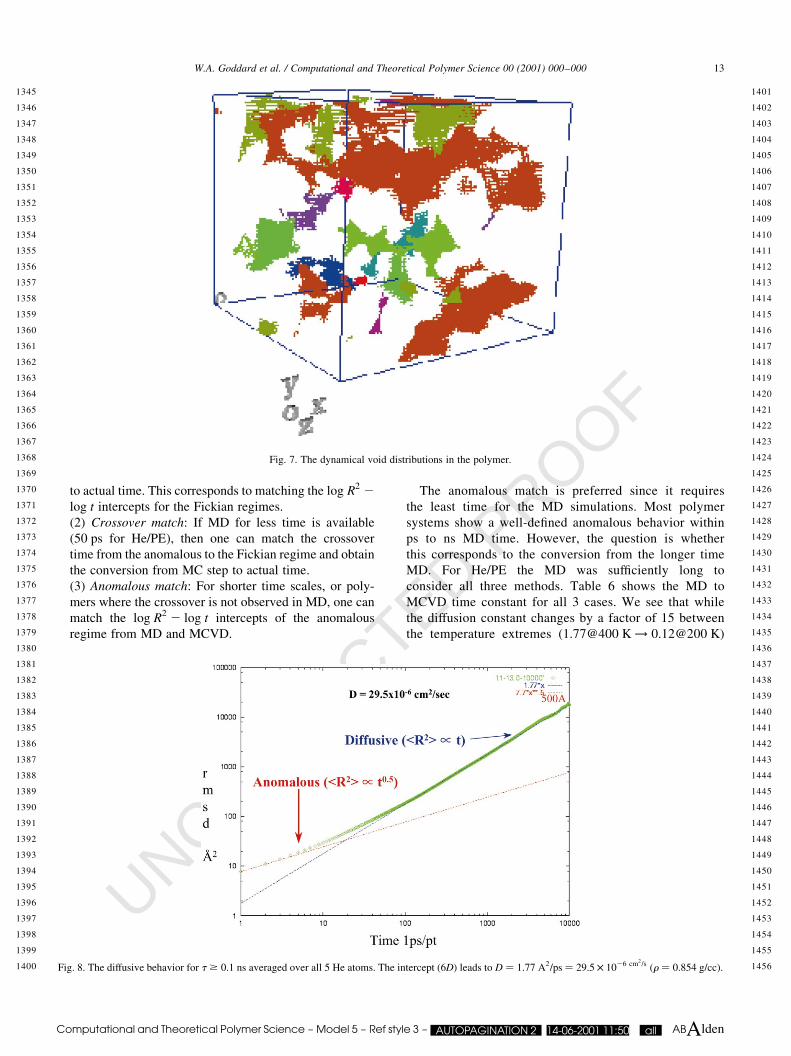
Fig. 7 shows the dynamical void distributions in the
polymer. Here we partitioned the unit cell into one million
W.A. Goddard et al. / Computational and Theoretical Polymer Science 00 (2001) 000±00010
1009
1010
1011
1012
1013
1014
1015
1016
1017
1018
1019
1020
1021
1022
1023
1024
1025
1026
1027
1028
1029
1030
1031
1032
1033
1034
1035
1036
1037
1038
1039
1040
1041
1042
1043
1044
1045
1046
1047
1048
1049
1050
1051
1052
1053
1054
1055
1056
1057
1058
1059
1060
1061
1062
1063
1064
1065
1066
1067
1068
1069
1070
1071
1072
1073
1074
1075
1076
1077
1078
1079
1080
1081
1082
1083
1084
1085
1086
1087
1088
1089
1090
1091
1092
1093
1094
1095
1096
1097
1098
1099
1100
1101
1102
1103
1104
1105
1106
1107
1108
1109
1110
1111
1112
1113
1114
1115
1116
1117
1118
1119
1120
Table 5
Estimated densities and Hansen solubilities
Density (g/cc) d 2/Vm (Kcal/mol) H1 H2 H3Solvents
Electrostatic Dispersion H-bonding
2-Pentanol 0.89 2151.42 253.32 276.48 221.62
3-Pentanol 0.88 2142.40 247.89 276.87 217.64
Amylacetate 0.95 2127.31 240.19 287.13 0.00
Butylacetate 0.97 2132.03 241.75 290.28 0.00
Decylacetate 0.91 2104.70 221.02 283.68 0.00
Ethanol 0.88 2257.64 2146.00 251.35 260.29
Ethylacetate 1.01 2159.31 268.99 290.33 0.00
Hexylacetate 0.95 2122.55 234.83 287.72 0.00
Iso-amylalcohol 0.89 2159.46 259.82 273.87 225.77
Isoamylacetate 0.96 2125.90 238.67 287.24 0.00
Isoamylbenzoate 1.03 2119.56 223.04 296.52 0.00
Isoamylbutyrate 0.94 2111.52 225.34 286.17 0.00
Isoamylcaproate 0.92 2104.57 220.83 283.74 0.00
Isoamylpropionate 0.93 2113.17 230.36 282.81 0.00
Isobutylacetate 0.96 2130.92 245.05 285.87 0.00
Isopropylacetate 0.98 2143.46 257.20 286.26 0.00
n-amylalcohol 0.88 2159.42 259.53 275.46 224.44
n-Heptanol 0.87 2130.23 237.63 276.59 216.01
n-Hexanol 0.88 2141.38 246.42 277.97 216.99
n-Propanol 0.86 2193.82 294.68 260.77 238.37
Octanol 0.88 2127.59 233.80 279.91 213.88
Octylacetate 0.92 2112.37 226.42 285.95 0.00
Propylacetate 0.98 2142.96 254.90 288.06 0.00
n-Butanol 0.84 2152.72 264.31 261.58 226.82
Polymers
PMMA 1.11 290.51 231.19 259.32 0.00
4HPS 1.09 2106.66 228.66 264.48 213.51
PEO 1.13 2168.10 268.36 295.90 23.84
PE 0.88 285.45 21.00 284.46 0.00
PEVA 0.96 285.02 210.82 274.20 0.00
Polysulfone 1.30 2138.74 229.76 2108.98 0.00
Caprolactone 1.09 2122.66 235.31 287.34 0.00
Table 6
The MD to MCVD time constants
Temperature D (AÊ 2/ps) Time conversion (fs/MCVD step) Ratio
Crossover Anomalous Fickian
tanomalous/tFickian
400 1.77 4.23 8.03 8.47 0.95
350 1.30 10.00 10.00 9.23 1.08
300 0.60 8.91 8.91 5.83 1.53
250 0.20 9.97 9.97 6.00 1.66
200 0.12 7.84 7.84 8.33 0.94
Computational and Theoretical Polymer Science ± Model 5 ± Ref style 3 ± AUTOPAGINATION 2 14-06-2001 11:49 all ABAlden

UNCORRECTED PROOF
cells �100 £ 100 £ 100� and examined the voids over a
period of 200 ps. Every 5 ps we examined whether a
probe radius 0.7 AÊ would contact any part of the polymer.
Here we see that the void analysis leads to an excellent
match with the felicitons and channels de®ned by the gas
particle in MD.
To calculate the mean square displacement (MSD) with
time, we considered each ps step of the 10 ns trajectory to be
W.A. Goddard et al. / Computational and Theoretical Polymer Science 00 (2001) 000±000 11
1121
1122
1123
1124
1125
1126
1127
1128
1129
1130
1131
1132
1133
1134
1135
1136
1137
1138
1139
1140
1141
1142
1143
1144
1145
1146
1147
1148
1149
1150
1151
1152
1153
1154
1155
1156
1157
1158
1159
1160
1161
1162
1163
1164
1165
1166
1167
1168
1169
1170
1171
1172
1173
1174
1175
1176
1177
1178
1179
1180
1181
1182
1183
1184
1185
1186
1187
1188
1189
1190
1191
1192
1193
1194
1195
1196
1197
1198
1199
1200
1201
1202
1203
1204
1205
1206
1207
1208
1209
1210
1211
1212
1213
1214
1215
1216
1217
1218
1219
1220
1221
1222
1223
1224
1225
1226
1227
1228
1229
1230
1231
1232
Fig. 5. (a) He diffusion in PE. Here we see that 1.5 ns of MD leads to the behavior in (2). Hence the MD can be used to determine D. (b) O2 diffusion in a PVC/
PVDC copolymer, 1.5 ns of MD is not suf®cient to display Einsteinian diffusion, and we estimate that this latter case requires a ms time scale.
Computational and Theoretical Polymer Science ± Model 5 ± Ref style 3 ± AUTOPAGINATION 2 14-06-2001 11:49 all ABAlden

UNCORRECTED PROOF
a possible starting point
R2�t� �XT 2 t
t0�0
uR�t 1 t�2 R�t0�u2=XT 2 t
t0�0
1
where, T is the total time. To determine whether the system
is in the diffusion region, where the Einstein relation Eq. (2)
holds, we plot logkR2l vs. logt: This should have a slope of
unity with the intercept providing the value for 6D. Indeed,
Fig. 8 shows diffusive behavior for t $ 0:1 ns averaged
over all 5 He atoms. The intercept, (6D), leads to D �1:77 A2
=ps � 29:5 £ 1026 cm2=s �r � 0:854 g=cc�:=
The experimental diffusion coef®cient [88] of He in
LDPE �r � 0:914 g=cc� at 258C is D � 6:8 £ 1026 cm2=s
and in HDPE �r � 0:964 g=cc� at 258C is D � 3:07 £1026 cm2
=s: The lower density and lower MW in the calcu-
lations is consistent with the higher D.
Both from the MD and MCVD, we observe three regions:
² Ballistic: Up to ,0.03 ps, the distance increases linearly
with time �kR2l / t2�: This is the ballistic regime, before
the particle hits a wall of the feliciton.
² Anomalous: From ,0.25 ps to ,4 ps, the trajectory ®ts
the kR2l / t1=2 line quite well. This is the anomalous
diffusion region, corresponding to intra-feliciton motion.
During this time the motion is primarily within felicitons.
We have found such anomalous diffusion regions in all
studies of amorphous polymers.
² Fickian: For times longer than 0.1 ns we ®nd true Einstei-
nian diffusion conditions.
Given the void probability grid from MD we design a
random walk MC algorithm in which a particle on a grid
point moves to an adjacent grid point. We assume the prob-
ability to be proportional to the void weight (Wg � 1 if
always a void to Wg � 0 if never a void). In order for a
random walk process to mimic this motion, we include a
momentum bias in the jump probability with an angular
dependence based on the last previous step direction. We
®nd that a simple cosine term, of the angle between the last
step and the next possible jump direction, leads to a MCVD
trajectory within a feliciton that mimics the MD trajectory.
A second issue concerns which neighboring points are
allowed for the jump. Simple choices are:
(a) only the six nearest neighbor points (forward, back-
ward, up, down, right, left),
(b) 18 points also including next nearest neighbors, or
(c) 26 points also including third nearest neighbors.
We chose case (c) since it ef®ciently spans the choices of
solid angle, allowing channels in diagonal direction to be
found.
The remaining issue concerns converting the MCVD step
to physical time. We have considered three ways to do this:
(1) Fickian match: If MD for suf®ciently long time is
available (200 ps for He/PE and several ns for other
combinations such as O2/PVC-PVDC), then one can
obtain the diffusion constant from the Fickian regime of
the MD and use this to get the conversion from MC step
W.A. Goddard et al. / Computational and Theoretical Polymer Science 00 (2001) 000±00012
1233
1234
1235
1236
1237
1238
1239
1240
1241
1242
1243
1244
1245
1246
1247
1248
1249
1250
1251
1252
1253
1254
1255
1256
1257
1258
1259
1260
1261
1262
1263
1264
1265
1266
1267
1268
1269
1270
1271
1272
1273
1274
1275
1276
1277
1278
1279
1280
1281
1282
1283
1284
1285
1286
1287
1288
1289
1290
1291
1292
1293
1294
1295
1296
1297
1298
1299
1300
1301
1302
1303
1304
1305
1306
1307
1308
1309
1310
1311
1312
1313
1314
1315
1316
1317
1318
1319
1320
1321
1322
1323
1324
1325
1326
1327
1328
1329
1330
1331
1332
1333
1334
1335
1336
1337
1338
1339
1340
1341
1342
1343
1344
Fig. 6. The trajectories for ®ve He atoms diffusing for 1.5 ns in PE.
Computational and Theoretical Polymer Science ± Model 5 ± Ref style 3 ± AUTOPAGINATION 2 14-06-2001 11:49 all ABAlden
UNCORRECTED PROOF
to actual time. This corresponds to matching the log R2 2log t intercepts for the Fickian regimes.
(2) Crossover match: If MD for less time is available
(50 ps for He/PE), then one can match the crossover
time from the anomalous to the Fickian regime and obtain
the conversion from MC step to actual time.
(3) Anomalous match: For shorter time scales, or poly-
mers where the crossover is not observed in MD, one can
match the log R2 2 log t intercepts of the anomalous
regime from MD and MCVD.
The anomalous match is preferred since it requires
the least time for the MD simulations. Most polymer
systems show a well-de®ned anomalous behavior within
ps to ns MD time. However, the question is whether
this corresponds to the conversion from the longer time
MD. For He/PE the MD was suf®ciently long to
consider all three methods. Table 6 shows the MD to
MCVD time constant for all 3 cases. We see that while
the diffusion constant changes by a factor of 15 between
the temperature extremes �1:77@400 K! 0:12@200 K�
W.A. Goddard et al. / Computational and Theoretical Polymer Science 00 (2001) 000±000 13
1345
1346
1347
1348
1349
1350
1351
1352
1353
1354
1355
1356
1357
1358
1359
1360
1361
1362
1363
1364
1365
1366
1367
1368
1369
1370
1371
1372
1373
1374
1375
1376
1377
1378
1379
1380
1381
1382
1383
1384
1385
1386
1387
1388
1389
1390
1391
1392
1393
1394
1395
1396
1397
1398
1399
1400
1401
1402
1403
1404
1405
1406
1407
1408
1409
1410
1411
1412
1413
1414
1415
1416
1417
1418
1419
1420
1421
1422
1423
1424
1425
1426
1427
1428
1429
1430
1431
1432
1433
1434
1435
1436
1437
1438
1439
1440
1441
1442
1443
1444
1445
1446
1447
1448
1449
1450
1451
1452
1453
1454
1455
1456Fig. 8. The diffusive behavior for t $ 0:1 ns averaged over all 5 He atoms. The intercept (6D) leads to D � 1:77 A2=ps � 29:5 £ 1026 cm2
=s �r � 0:854 g=cc�.
Fig. 7. The dynamical void distributions in the polymer.
Computational and Theoretical Polymer Science ± Model 5 ± Ref style 3 ± AUTOPAGINATION 2 14-06-2001 11:50 all ABAlden

UNCORRECTED PROOF
the time factor from the anomalous diffusion match differs
only by 20%.
The research projects reported in this paper are supported
by grants from DOE-ASCI, NASA/Ames, NASA-JPL,
Owens Corning, Chevron Research Technology Co. Facil-
ities of MSC is also supported by funds from NSF (CHE 95-
22179), ARO/DURIP, ARO-MURI, ONR; Asahi Chemical,
Avery Dennison, BP Chemical, Beckman Institute, Dow
Chemical, Chevron Petroleum Technology Co., Chevron
Chemical Co., Exxon, Kellogg, Seiko-Epson
References
[1] Goddard III WA, Dunning Jr. TH, Hunt WJ, Hay PJ. Accts Chem Res
1973;6:368.
[2] Tannor DJ, Marten B, Murphy R, Friesner RA, Sitkoff D, Nicholls A,
Ringnalda M, Goddard III WA, Honig B. J Am Chem Soc
1994;116:11875.
[3] Greeley BH, Russo TV, Mainz DT, Friesner RA, Langlois J-M,
Goddard III WA, Donnelly RE, Ringnalda MN. J Chem Phys
1994;101:4028.
[4] Chen XJ, Langlois J-M, Goddard WA. Phys Rev B 1995;52:2348.
[5] Dasgupta S, Yamasaki T, Goddard III WA. J Chem Phys
1996;104:2898.
[6] Karasawa N, Dasgupta S, Goddard III WA. J Phys Chem
1990;95:2260.
[7] Dasgupta S, Hammond WB, Goddard III WA. J Am Chem Soc
1996;118:12291±301.
[8] Karasawa N, Goddard III WA. Macromolecules 1995;28:6765.
[9] Karasawa N, Goddard III WA. Macromolecules 1992;25:7268.
[10] Dasgupta S, Brameld KA, Fan CF, Goddard WA. Spectrosc Acta A
1997;53:1347±63.
[11] Dasgupta S, Smith KA, Goddard III WA. J Phys Chem
1993;97:10891.
[12] Musgrave CB, Dasgupta S, Goddard III WA. J Phys Chem
1995;99:13321.
[13] Musgrave CB, Harris SJ, Goddard III WA. Chem Phys Lett
1995;247:359.
[14] McAdon M, Goddard III WA. J Phys Chem 1987;91:2607.
[15] Mayo SL, Olafson BD, Goddard III WA. J Phys Chem 1990;94:8897.
[16] Rappe AK, Casewit CJ, Colwell KS, Goddard III WA, Skiff WM. J
Am Chem Soc 1992;114:10024.
[17] Cagin T, Qi Y, Li H, Kimura Y, Ikeda H, Johnson WL, Goddard III
WA. In: Inoue A, Johnson WL, Liu CT, editors. Bulk metallic glasses,
MRS Symposium Series 5541999. p. 43±48.
[18] Kimura Y, Cagin T, Qi Y, Goddard III WA, submitted for publication.
[19] Strachan A, Cagin T, Gulseren O, Cohen RE, Goddard III WA, qEAM
FF for Tanatalum, unpublished.
[20] Cagin T, Demiralp E, Goddard III WA. MRS Symp Proc
1998;492:287±92.
[21] Demiralp E, Cagin T, Goddard III WA. Phys Rev Lett 1999;82:1708±
11.
[22] Huff NT, Demiralp E, Cagin T, Goddard III WA. J Noncrystal Solids
1999;253:133±42.
[23] Kitao O, Demiralp E, Cagin T, Dasgupta S, Mikami M, Tanabe K,
Ono S, Goddard III WA. Comput Mat Sci 1999;14:135±8.
[24] Strachan A, Cagin T, Goddard III WA. Phys Rev B 1999;60:15084.
[25] Che JW, Cagin T, Goddard III WA. Theo Chem Acct 1999;102:346±
54.
[26] Duin A, Goddard III WA, submitted for publication.
[27] Karasawa N, Goddard III WA. J Phys Chem 1989;93:7320.
[28] Chen ZM, Cagin T, Goddard III WA. J Comp Chem 1997;18:1365.
[29] Ding HQ, Karasawa N, Goddard III WA. J Chem Phys 1992;97:6.
[30] Lim KT, Brunett S, Iotov M, McClurg RB, Vaidehi N, Dasgupta S,
Taylor S, Goddard III WA. J Comp Chem 1997;18:501±21.
[31] Iotov M, Kashihara S, Dasgupta SD, Goddard III WA, Diffusion of
gases in polymers, unpublished.
[32] Iotov M, PhD Thesis, California Institute of Technology, December
1997.
[33] Miklis P, Cagin T, Goddard III WA. J Am Chem Soc 1997;119:
7458.
[34] Ding H, Karasawa N, Goddard III WA. Chem Phys Lett 1992;196:6.
[35] Mathiowetz AM, Jain A, Karasawa N, Goddard III WA. Proteins
1994;20:227.
[36] Vaidehi N, Jain A, Goddard III WA. J Phys Chem 1996;100:10508.
[37] Fijany A, Cagin T, Botero AJ, Goddard III WA. Adv Eng Software
1998;29:441±50.
[38] Fijany A, Botero AJ, Cagin T. In: D'Hollander, Joubert G, Peters F,
Trottenberg U, editors. Parallel computing: fundamentals, applica-
tions and new directions, 1998. p. 505±15.
[39] Gao G, Iotov M, Cagin T, Goddard III WA, MPSim97: massively
parallel molecular dynamics simulation program, in preparation.
[40] Cagin T, Karasawa N, Dasgupta S, Goddard III WA. Mat Res Soc
Symp Proc 1992:278±83.
[41] Cagin T, Goddard III WA, Ary ML. Comp Polym Sci 1991;1:
241.
[42] Parrinello M, Rahman A. Phys Rev Lett 1980;45:1196.
[43] Parrinello M, Rahman A. J Appl Phys 1981;52:7182.
[44] Nose S. Mol Phys 1984;52:255.
[45] Nose S. J Chem Phys 1984;81:511.
[46] Yue Qi, Cagin T, Kimura Y, Goddard III WA, Shear viscosity of a
liquid metal alloy from NEMD: Au±Cu, unpublished.
[47] Che J, Cagin T, Goddard III WA, Thermal conductivity of diamond
from NEMD, in preparation.
[48] Cagin T, Miklis P, Goddard III WA, Effect of molecular topology on
the shear viscosity: linear, star and hyper-branched alkanes, in
preparation.
[49] Cagin T, Che J, Gardos MN, Fijany A, Goddard III WA. Nanotech
1999;10:278±84.
[50] Cagin T, Zhou Y, Yamaguchi ES, Frazier R, Ho A, Tang Y, Goddard
III WA. In: Drake JM, Grest GS, Klafter J, Kopelman R, editors.
Dynamics in small con®ning systems V, MRS Symposium Series
5431999. p. 79±84.
[51] Zhou Y, Cagin T, Yamaguchi ES, Ho A, Tang Y-C, Goddard III WA,
Dynamical shear studies of lubricant ®lms con®ned to nanoscale
separation between iron oxide surfaces covered with wear inhibitors,
submitted for publication.
[52] Qi Y, Cagin T, Goddard, III WA, Glass formation and crystallization
in Ni:Cu and Cu:Ag alloys, submitted 1998.
[53] Cortis CM, Friesner RA. J Comput Chem 1997;18:1570 (see also p.
1591).
[54] Still WC, Tempczyk A, Hawley RC, Hendrickson T. J Am Chem Soc
1990;113:6127.
[55] Sadanobu J, Goddard III WA. Fluid Phase Equil 1998;144:415.
[56] Sadanobu J, Goddard WA. J Chem Phys 1997;106:6722.
[57] Debe DA, Goddard III WA. J Mol Biol 1999;294:619.
[58] Debe DA, Carlson MJ, Sadanobu J, Chan SI, Goddard III WA. J Phys
Chem B 1999;103:3001.
[59] Debe DA, Carlson MJ, Goddard III WA. Proc Natl Acad Sci
1999;96:2596.
[60] Donnelly D. Biochem Soc T 1993;21:36±39.
[61] Singer MS, Weisinger-Lewin Y, Lancet D, Shepherd GM. Receptors
Channels 1995;4:141±7.
[62] Malnic B, Hirono J, Sato T, Buck LB. Cell 1999;96:713±23.
[63] Vriend G, whatif: a molecular modeling and drug design program, J
Mol Graph 8 52±6.
[64] Schertler GFX. Eye 1998;12:504±10.
[65] Mackerell AD, Wiorkiewicz-Kuczera J, Karplus M. JAm Chem Soc
1995;117:11946±75.
[66] Ghosh A, Rapp CS, Friesner RA. J Phys Chem B 1998;102:10983±90.
W.A. Goddard et al. / Computational and Theoretical Polymer Science 00 (2001) 000±00014
1457
1458
1459
1460
1461
1462
1463
1464
1465
1466
1467
1468
1469
1470
1471
1472
1473
1474
1475
1476
1477
1478
1479
1480
1481
1482
1483
1484
1485
1486
1487
1488
1489
1490
1491
1492
1493
1494
1495
1496
1497
1498
1499
1500
1501
1502
1503
1504
1505
1506
1507
1508
1509
1510
1511
1512
1513
1514
1515
1516
1517
1518
1519
1520
1521
1522
1523
1524
1525
1526
1527
1528
1529
1530
1531
1532
1533
1534
1535
1536
1537
1538
1539
1540
1541
1542
1543
1544
1545
1546
1547
1548
1549
1550
1551
1552
1553
1554
1555
1556
1557
1558
1559
1560
1561
1562
1563
1564
1565
1566
1567
1568
Computational and Theoretical Polymer Science ± Model 5 ± Ref style 3 ± AUTOPAGINATION 2 14-06-2001 11:50 all ABAlden
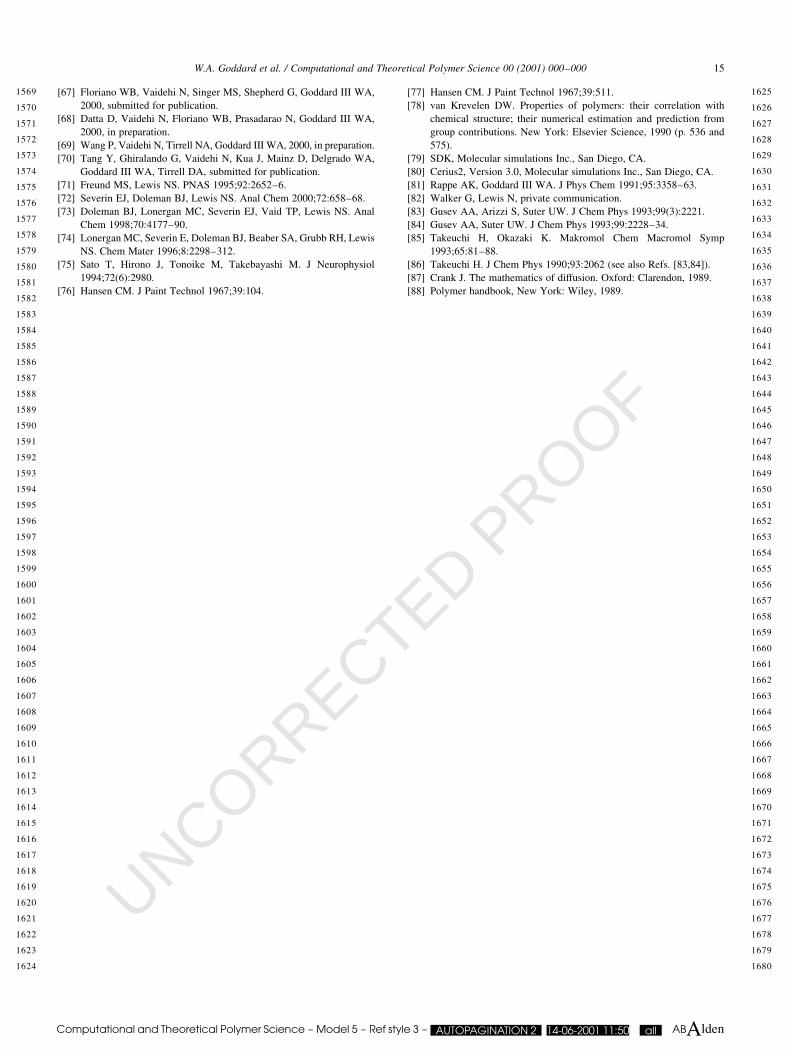
UNCORRECTED PROOF
[67] Floriano WB, Vaidehi N, Singer MS, Shepherd G, Goddard III WA,
2000, submitted for publication.
[68] Datta D, Vaidehi N, Floriano WB, Prasadarao N, Goddard III WA,
2000, in preparation.
[69] Wang P, Vaidehi N, Tirrell NA, Goddard III WA, 2000, in preparation.
[70] Tang Y, Ghiralando G, Vaidehi N, Kua J, Mainz D, Delgrado WA,
Goddard III WA, Tirrell DA, submitted for publication.
[71] Freund MS, Lewis NS. PNAS 1995;92:2652±6.
[72] Severin EJ, Doleman BJ, Lewis NS. Anal Chem 2000;72:658±68.
[73] Doleman BJ, Lonergan MC, Severin EJ, Vaid TP, Lewis NS. Anal
Chem 1998;70:4177±90.
[74] Lonergan MC, Severin E, Doleman BJ, Beaber SA, Grubb RH, Lewis
NS. Chem Mater 1996;8:2298±312.
[75] Sato T, Hirono J, Tonoike M, Takebayashi M. J Neurophysiol
1994;72(6):2980.
[76] Hansen CM. J Paint Technol 1967;39:104.
[77] Hansen CM. J Paint Technol 1967;39:511.
[78] van Krevelen DW. Properties of polymers: their correlation with
chemical structure; their numerical estimation and prediction from
group contributions. New York: Elsevier Science, 1990 (p. 536 and
575).
[79] SDK, Molecular simulations Inc., San Diego, CA.
[80] Cerius2, Version 3.0, Molecular simulations Inc., San Diego, CA.
[81] Rappe AK, Goddard III WA. J Phys Chem 1991;95:3358±63.
[82] Walker G, Lewis N, private communication.
[83] Gusev AA, Arizzi S, Suter UW. J Chem Phys 1993;99(3):2221.
[84] Gusev AA, Suter UW. J Chem Phys 1993;99:2228±34.
[85] Takeuchi H, Okazaki K. Makromol Chem Macromol Symp
1993;65:81±88.
[86] Takeuchi H. J Chem Phys 1990;93:2062 (see also Refs. [83,84]).
[87] Crank J. The mathematics of diffusion. Oxford: Clarendon, 1989.
[88] Polymer handbook, New York: Wiley, 1989.
W.A. Goddard et al. / Computational and Theoretical Polymer Science 00 (2001) 000±000 15
1569
1570
1571
1572
1573
1574
1575
1576
1577
1578
1579
1580
1581
1582
1583
1584
1585
1586
1587
1588
1589
1590
1591
1592
1593
1594
1595
1596
1597
1598
1599
1600
1601
1602
1603
1604
1605
1606
1607
1608
1609
1610
1611
1612
1613
1614
1615
1616
1617
1618
1619
1620
1621
1622
1623
1624
1625
1626
1627
1628
1629
1630
1631
1632
1633
1634
1635
1636
1637
1638
1639
1640
1641
1642
1643
1644
1645
1646
1647
1648
1649
1650
1651
1652
1653
1654
1655
1656
1657
1658
1659
1660
1661
1662
1663
1664
1665
1666
1667
1668
1669
1670
1671
1672
1673
1674
1675
1676
1677
1678
1679
1680
Computational and Theoretical Polymer Science ± Model 5 ± Ref style 3 ± AUTOPAGINATION 2 14-06-2001 11:50 all ABAlden