multiscale modeling and simulation of nano-electronic...
TRANSCRIPT
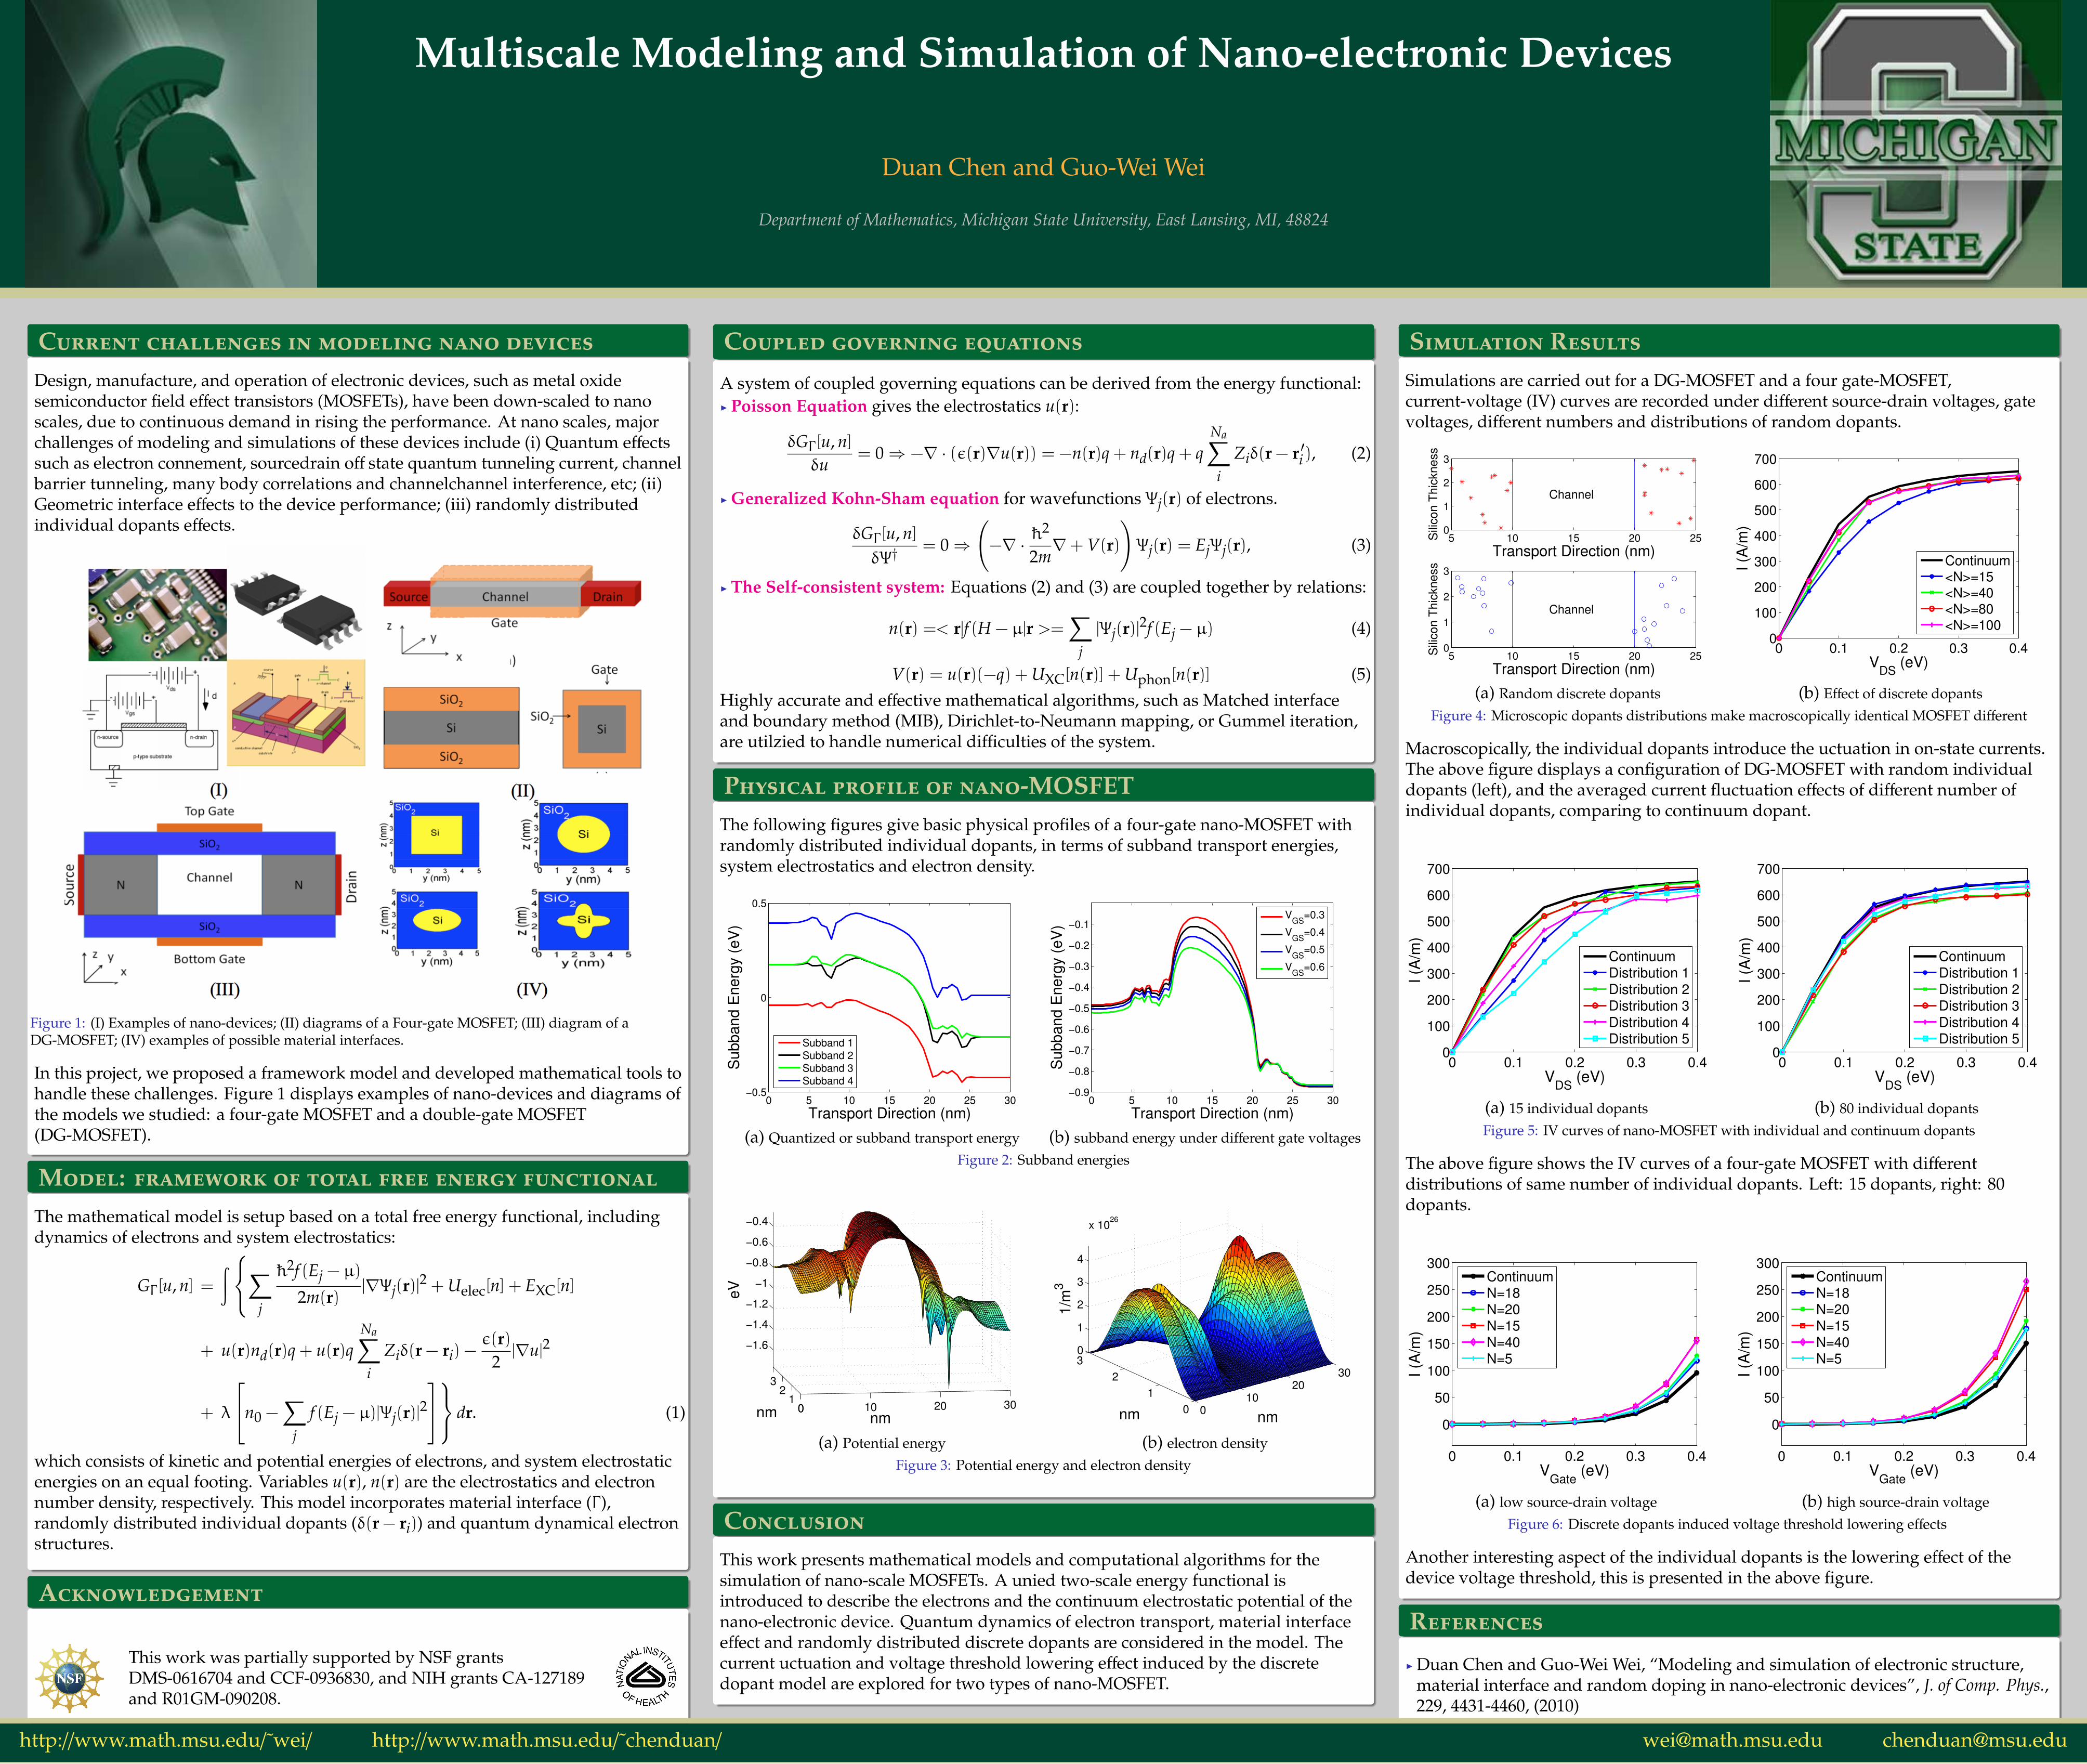
Multiscale Modeling and Simulation of Nano-electronic Devices
Duan Chen and Guo-Wei Wei
Department of Mathematics, Michigan State University, East Lansing, MI, 48824
Current challenges in modeling nano devicesDesign, manufacture, and operation of electronic devices, such as metal oxidesemiconductor field effect transistors (MOSFETs), have been down-scaled to nanoscales, due to continuous demand in rising the performance. At nano scales, majorchallenges of modeling and simulations of these devices include (i) Quantum effectssuch as electron connement, sourcedrain off state quantum tunneling current, channelbarrier tunneling, many body correlations and channelchannel interference, etc; (ii)Geometric interface effects to the device performance; (iii) randomly distributedindividual dopants effects.
Figure 1: (I) Examples of nano-devices; (II) diagrams of a Four-gate MOSFET; (III) diagram of aDG-MOSFET; (IV) examples of possible material interfaces.
In this project, we proposed a framework model and developed mathematical tools tohandle these challenges. Figure 1 displays examples of nano-devices and diagrams ofthe models we studied: a four-gate MOSFET and a double-gate MOSFET(DG-MOSFET).
Model: framework of total free energy functionalThe mathematical model is setup based on a total free energy functional, includingdynamics of electrons and system electrostatics:
GΓ [u, n] =∫ ∑
j
h2f (Ej − µ)
2m(r)|∇Ψj(r)|
2 + Uelec[n] + EXC[n]
+ u(r)nd(r)q + u(r)qNa∑i
Ziδ(r − ri) −ε(r)
2|∇u|2
+ λ
n0 −∑
j
f (Ej − µ)|Ψj(r)|2
dr. (1)
which consists of kinetic and potential energies of electrons, and system electrostaticenergies on an equal footing. Variables u(r), n(r) are the electrostatics and electronnumber density, respectively. This model incorporates material interface (Γ ),randomly distributed individual dopants (δ(r − ri)) and quantum dynamical electronstructures.
Acknowledgement
This work was partially supported by NSF grantsDMS-0616704 and CCF-0936830, and NIH grants CA-127189and R01GM-090208.
Coupled governing equations
A system of coupled governing equations can be derived from the energy functional:I Poisson Equation gives the electrostatics u(r):
δGΓ [u, n]δu
= 0⇒ −∇ · (ε(r)∇u(r)) = −n(r)q + nd(r)q + qNa∑i
Ziδ(r − r ′i), (2)
I Generalized Kohn-Sham equation for wavefunctions Ψj(r) of electrons.
δGΓ [u, n]δΨ†
= 0⇒
(−∇ ·
h2
2m∇+ V(r)
)Ψj(r) = EjΨj(r), (3)
I The Self-consistent system: Equations (2) and (3) are coupled together by relations:
n(r) =< r|f (H − µ|r >=∑
j
|Ψj(r)|2f (Ej − µ) (4)
V(r) = u(r)(−q) + UXC[n(r)] + Uphon[n(r)] (5)Highly accurate and effective mathematical algorithms, such as Matched interfaceand boundary method (MIB), Dirichlet-to-Neumann mapping, or Gummel iteration,are utilzied to handle numerical difficulties of the system.
Physical profile of nano-MOSFETThe following figures give basic physical profiles of a four-gate nano-MOSFET withrandomly distributed individual dopants, in terms of subband transport energies,system electrostatics and electron density.
0 5 10 15 20 25 30−0.5
0
0.5
Transport Direction (nm)
Subband E
nerg
y (
eV
)
Subband 1
Subband 2
Subband 3
Subband 4
0 5 10 15 20 25 30−0.9
−0.8
−0.7
−0.6
−0.5
−0.4
−0.3
−0.2
−0.1
Transport Direction (nm)
Subband E
nerg
y (
eV
)
VGS
=0.3
VGS
=0.4
VGS
=0.5
VGS
=0.6
(a) Quantized or subband transport energy (b) subband energy under different gate voltages
Figure 2: Subband energies
0 10 20 3001
23
−1.6
−1.4
−1.2
−1
−0.8
−0.6
−0.4
nmnm
eV
0
10
20
30
0
1
2
30
1
2
3
4
x 1026
nmnm
1/m
3
(a) Potential energy (b) electron density
Figure 3: Potential energy and electron density
ConclusionThis work presents mathematical models and computational algorithms for thesimulation of nano-scale MOSFETs. A unied two-scale energy functional isintroduced to describe the electrons and the continuum electrostatic potential of thenano-electronic device. Quantum dynamics of electron transport, material interfaceeffect and randomly distributed discrete dopants are considered in the model. Thecurrent uctuation and voltage threshold lowering effect induced by the discretedopant model are explored for two types of nano-MOSFET.
Simulation ResultsSimulations are carried out for a DG-MOSFET and a four gate-MOSFET,current-voltage (IV) curves are recorded under different source-drain voltages, gatevoltages, different numbers and distributions of random dopants.
5 10 15 20 250
1
2
3
Channel
Transport Direction (nm)
Sili
con T
hic
kness
5 10 15 20 250
1
2
3
Channel
Transport Direction (nm)
Sili
con T
hic
kness
0 0.1 0.2 0.3 0.40
100
200
300
400
500
600
700
VDS
(eV)
I (A
/m)
Continuum
<N>=15<N>=40<N>=80
<N>=100
(a) Random discrete dopants (b) Effect of discrete dopants
Figure 4: Microscopic dopants distributions make macroscopically identical MOSFET different
Macroscopically, the individual dopants introduce the uctuation in on-state currents.The above figure displays a configuration of DG-MOSFET with random individualdopants (left), and the averaged current fluctuation effects of different number ofindividual dopants, comparing to continuum dopant.
0 0.1 0.2 0.3 0.40
100
200
300
400
500
600
700
VDS
(eV)
I (A
/m)
ContinuumDistribution 1
Distribution 2Distribution 3
Distribution 4Distribution 5
0 0.1 0.2 0.3 0.40
100
200
300
400
500
600
700
VDS
(eV)
I (A
/m)
ContinuumDistribution 1
Distribution 2Distribution 3
Distribution 4Distribution 5
(a) 15 individual dopants (b) 80 individual dopants
Figure 5: IV curves of nano-MOSFET with individual and continuum dopants
The above figure shows the IV curves of a four-gate MOSFET with differentdistributions of same number of individual dopants. Left: 15 dopants, right: 80dopants.
0 0.1 0.2 0.3 0.4
0
50
100
150
200
250
300
VGate
(eV)
I (A
/m)
ContinuumN=18N=20
N=15N=40N=5
0 0.1 0.2 0.3 0.4
0
50
100
150
200
250
300
VGate
(eV)
I (A
/m)
ContinuumN=18N=20
N=15N=40N=5
(a) low source-drain voltage (b) high source-drain voltage
Figure 6: Discrete dopants induced voltage threshold lowering effects
Another interesting aspect of the individual dopants is the lowering effect of thedevice voltage threshold, this is presented in the above figure.
References
I Duan Chen and Guo-Wei Wei, “Modeling and simulation of electronic structure,material interface and random doping in nano-electronic devices”, J. of Comp. Phys.,229, 4431-4460, (2010)
http://www.math.msu.edu/˜wei/ http://www.math.msu.edu/˜chenduan/ [email protected] [email protected]