strategic plan 2018 - fluidra es invertir en agua · mr. gabriel lópez, independent director: ......
TRANSCRIPT

STRATEGIC PLAN 2018 ROAD MAP TO 2020
STRATEGIC PLAN 2018 ROAD MAP TO 2020 Execut ive Summary
17 No vemb er 2 0 1 5

STRATEGIC PLAN 2018 ROAD MAP TO 2020
Disclaimer
2
This document is for information only and does not constitute an offer to sell, exchange or buy, or an invitation to make offers to
buy, securities issued by any of the companies mentioned. This financial information has been prepared in accordance with
International Financial Reporting Standards (IFRS), however, not being audited information is not definitive information and may
be modified in the future.
No representation or warranty is given by Fluidra S.A. as to the accuracy, completeness or fairness or any information contained
in this document and nothing in this report should be relied upon as a promise or representation as to the past, current situation
or future of the company and its group
The information contained in this document may contain statements regarding intentions, expectations or future prospects. All
statements, other than those based on historical fact are forward-looking statements, including, without limitation, those
regarding our financial position, business strategy, management plans and objectives for future operations. Such forward-looking
statements are affected, as such, by risks and uncertainties that could cause what happens in reality does not correspond with
them.
These risks include, among others, seasonal fluctuations that may change demand, industry competition, economic conditions
and legal restrictions on free trade and / or political instability in the markets where the Group Fluidra is present or in those
countries where the Group's products are manufactured or distributed. Fluidra Group makes no commitment to issue updates or
revisions concerning the forward-looking statements included in this financial information, expectations or in events, conditions
or circumstances on which underlying these forward-looking statements.
In any case, Fluidra Group provides information on these and other factors that may affect forward-looking statements, business
and financial results of the Company, in documents filed with the Comisión Nacional del Mercado de Valores of Spain. We invite
all interested persons or entities to consult those documents.

STRATEGIC PLAN 2018 ROAD MAP TO 2020
Index
3
1. Introduction
2. Pool Sector
3. Best practices for profitable growth
4. Gain penetration: geographical markets
5. Financial outlook & Closing

STRATEGIC PLAN 2018 ROAD MAP TO 2020 STRATEGIC PLAN 2018 ROAD MAP TO 2020
Introduction

STRATEGIC PLAN 2018 ROAD MAP TO 2020
Fluidra at a Glance
5
Strong
Financial
Performance
2014 Sales: €593.8M (0.2%)
2014 EBITDA: €65.7M (37.7%)
2014 Net Debt: €151.6M (-18.8%)
Business
International leader in distribution of solutions for Pool and Wellness, including Fluid Handling and
Water Treatment
Vertically integrated for Pool, Water Treatment and Fluid Handling
International
Footprint
Products sold in 170 countries
Direct presence in 44 countries through 128 branches
80% of revenues generated outside of Spain and 33% outside Europe
Customers
&
Products
Over 50,000 clients worldwide
Over 20,000 product references
Stock
Information
Listed in the Spanish Stock Exchange
BOD: 4 founding families 49.9% and Banc Sabadell 5.0%
Free float: 45.1%

STRATEGIC PLAN 2018 ROAD MAP TO 2020
Fluidra evolution
6
1997 1998 1999 2000 2001 2002 2003 2004 2005 2006 2007 2008 2009 2010 2011 2012 2013 2014 2015 … 2018 2020
1m€ +1.7% +2.3% +7%
1969…
Profitable growth
Source: IMF-WEO
G.D.P.

STRATEGIC PLAN 2018 ROAD MAP TO 2020
Evolution of the Global Pool Market
7
Growth of pool market across the board expected to boost the industry and increase
the size of the potential market
Continued recovery of global pool market after the 2008 financial crisis
Strong recovery expected in mature markets (Europe & North America). Sustained growth in emerging markets.
Source: Associations’ reports, trade publications, annual reports, Internal studies & estimates
Note: Only refers to In Ground Pools
Global Evolution of Total Pool Base Global Evolution of New Pools
-
3.000.000
6.000.000
9.000.000
12.000.000
15.000.000
18.000.000
2007 2009 2011 2013 2015E
Europe Australia N. America Asia LATAM Africa & RoW
-
100.000
200.000
300.000
400.000
500.000
600.000
2007 2009 2011 2013 2015E
Europe Australia N. America Asia LATAM Africa & RoW
Europa Australia N. America Asia LatAm Africa&RoW Europa Australia N. America Asia LatAm Africa&RoW
STRATEGIC PLAN 2018 ROAD MAP TO 2020
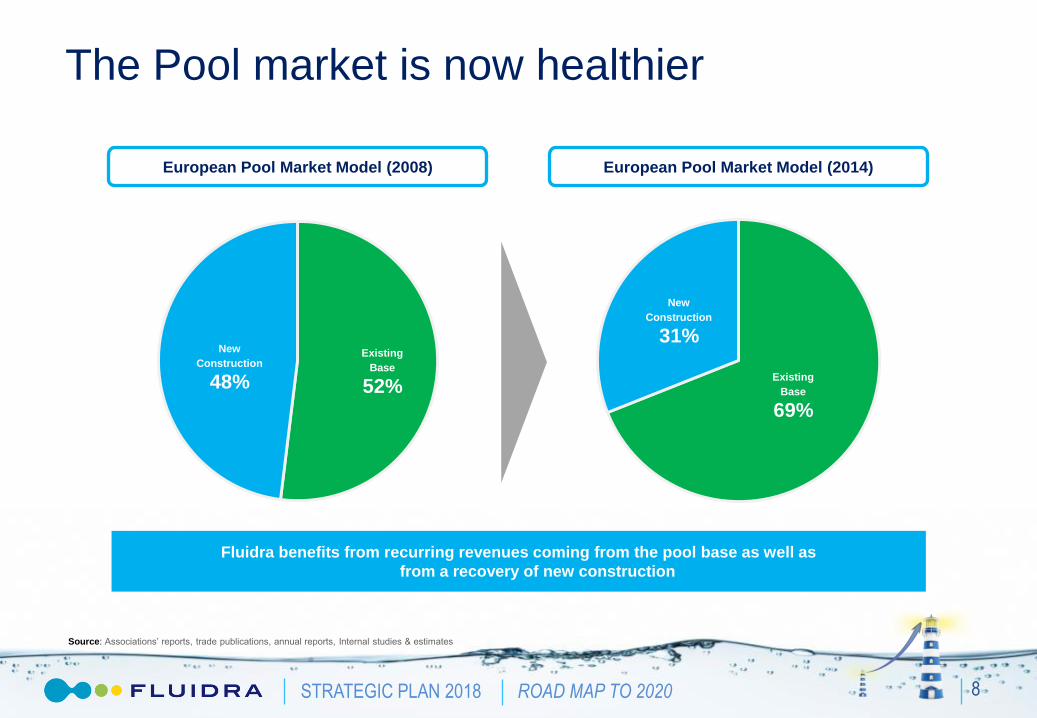
Existing
Base
52%
New
Construction
48% Existing
Base
69%
New
Construction
31%
The Pool market is now healthier
8
Fluidra benefits from recurring revenues coming from the pool base as well as
from a recovery of new construction
European Pool Market Model (2008) European Pool Market Model (2014)
Source: Associations’ reports, trade publications, annual reports, Internal studies & estimates

STRATEGIC PLAN 2018 ROAD MAP TO 2020
Fluidra has a strong geographical footprint
9
Branch coverage
5.2M
87K
Robots
2.5M
115K
86%
5.3M
76K
80%
0.9M
18K
90%
0.3M
17K
73%
1.3M
17K
100%
Total pools
New pools
Category strategy
Full strategy
International expansion in last years has developed a network that covers 89% of the park (Ex-US)

STRATEGIC PLAN 2018 ROAD MAP TO 2020
Experienced & passionate team
Board of directors
Mr. Juan Ignacio Acha-Orbea, Independent Director: Finance
Mr. Gabriel López, Independent Director: Audit
Mr. Richard J. Cathcart, Independent Director: US
Mr. Jordi Constans, Independent Director: Sales & Marketing
Mr. Carles Ventura, Director: Banc Sabadell
Mr. Oscar Serra, Director: Boyser
Mr. Bernat Corbera, Director: Edrem
Mr. Bernat Garrigós, Director: Aniol
Mr. Joan Planes, Chairman
Mr. Eloi Planes, Chief Executive officer
Mr. Albert Collado, Secretary
10

STRATEGIC PLAN 2018 ROAD MAP TO 2020
Shareholder Structure
11
The shareholders’ agreement by the founding families and Banc Sabadell reflects their confidence in Fluidra’s growth strategy and in its future projects.
Dispur12.2%
Banc Sabadell5.0%
Free float45.1%
Boyser14.1%
Edrem13.5%
Aniol10.1%

STRATEGIC PLAN 2018 ROAD MAP TO 2020
Focus on profitable growth
12
STRATEGIC PLAN 2018 ROAD MAP TO 2020 STRATEGIC PLAN 2018 ROAD MAP TO 2020
Pool Sector

STRATEGIC PLAN 2018 ROAD MAP TO 2020
56%
5%
14%
17%
8%
Market offers a significant opportunity…
14
16%
84%
2014
Pool Market
(ex US)
3.2B€
In terms of product and geographies
Europe
Africa
Australia
LatAm
Asia & ME
41%
19%
22%
18% Basic-Filter, Pump…
Maintenance
Added Value - Robots,
Chlorinators
Commercial equipment
Source: Company elaboration based on country pool associations data and other public company data.
Fluidra
Others
STRATEGIC PLAN 2018 ROAD MAP TO 2020
Source: Company elaboration based on country pool associations data and other public company data.
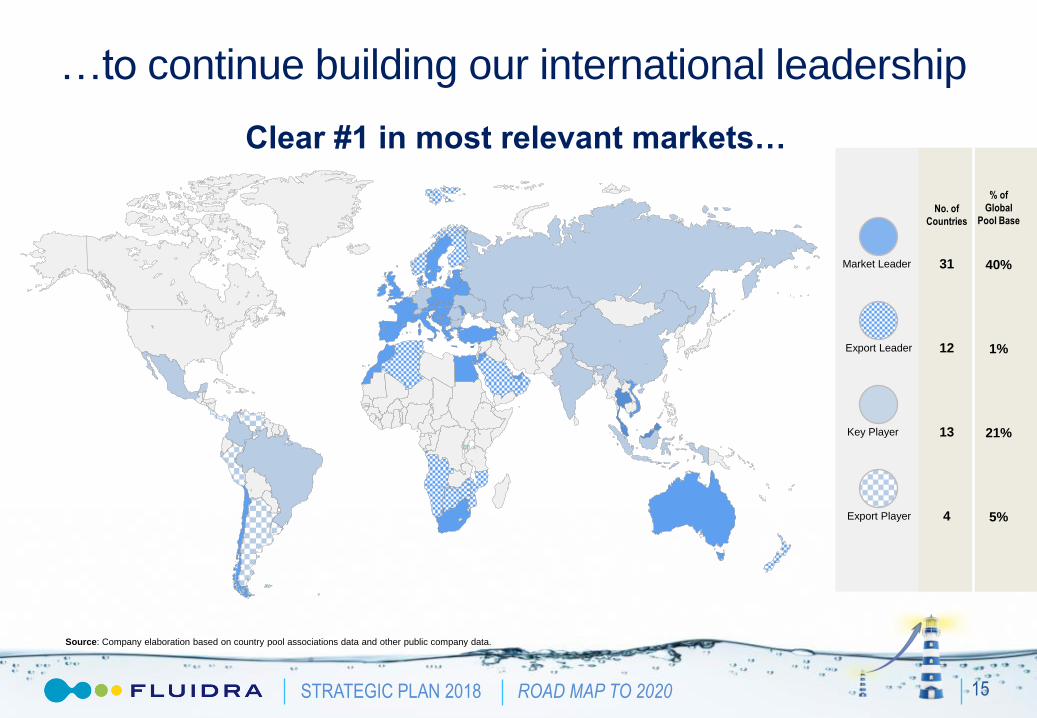
Clear #1 in most relevant markets…
Market Leader
Export Leader
Key Player
Export Player
15
No. of
Countries
31
12
13
4
% of
Global
Pool Base
40%
1%
21%
5%
…to continue building our international leadership
STRATEGIC PLAN 2018 ROAD MAP TO 2020
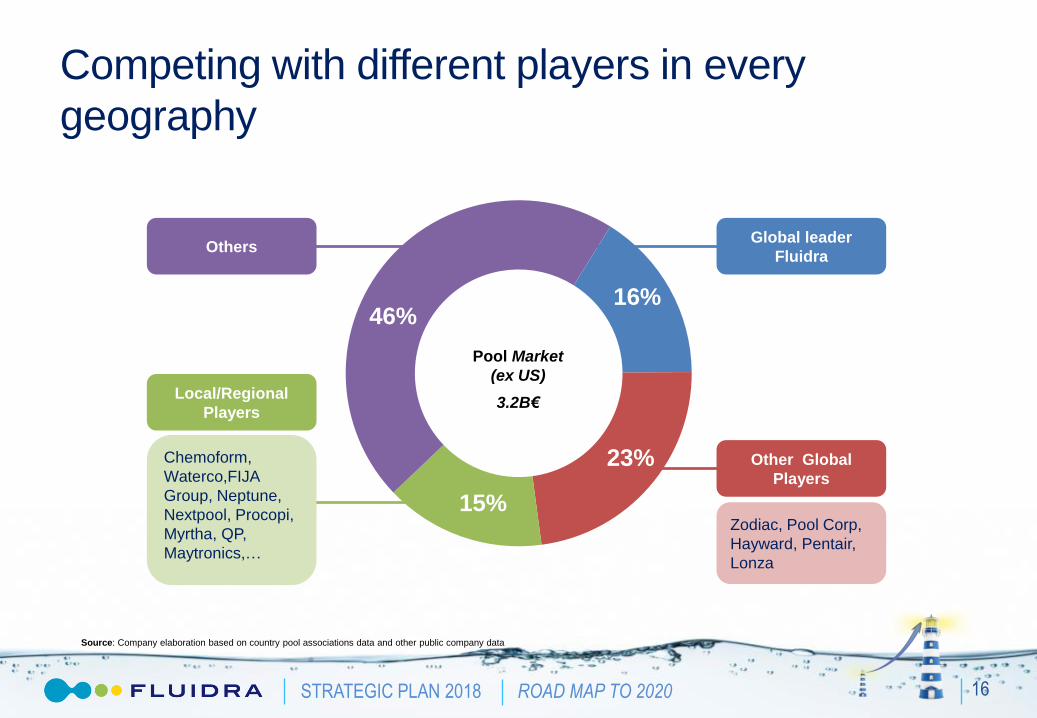
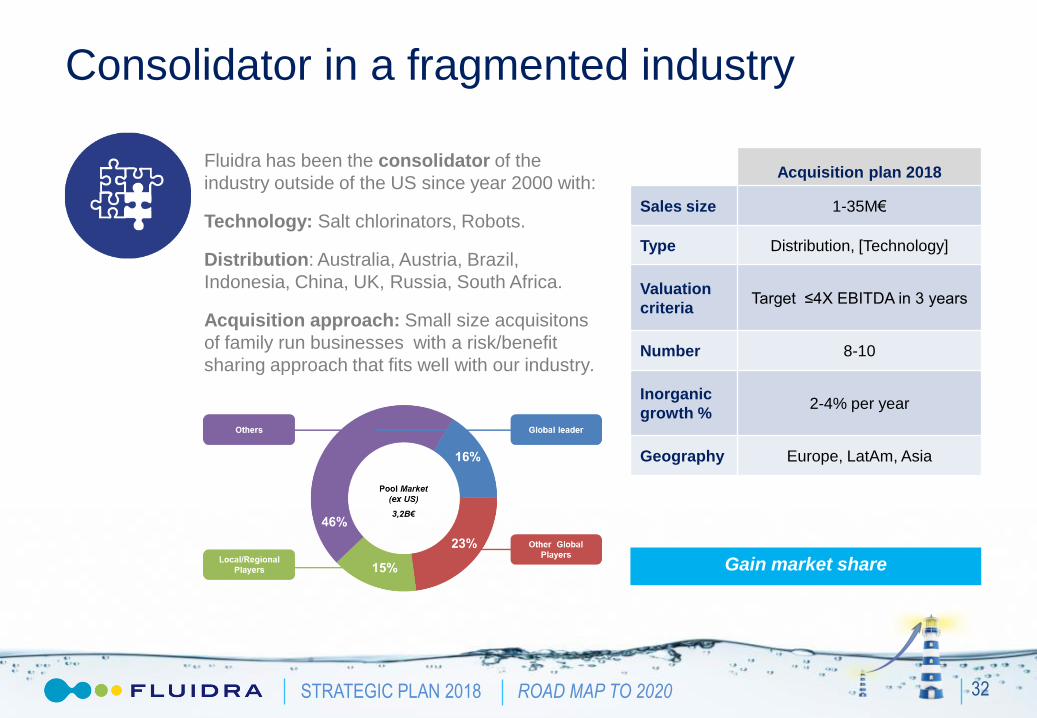
Pool Market
(ex US)
3.2B€
16%
15%
23%
46%
Source: Company elaboration based on country pool associations data and other public company data
16
Global leader
Fluidra
Other Global
Players
Zodiac, Pool Corp,
Hayward, Pentair,
Lonza
Local/Regional
Players
Chemoform,
Waterco,FIJA
Group, Neptune,
Nextpool, Procopi,
Myrtha, QP,
Maytronics,…
Others
Competing with different players in every
geography

STRATEGIC PLAN 2018 ROAD MAP TO 2020
A clear leader in innovation
17
R&D+i
Innovation Committee
Centers of Excellence
13
Customers
Partners’ Network
R&D Invested: 1,4% of sales
New Product Sales: 10% - 2015
15% - 2018
Multi-center & open R&D model
STRATEGIC PLAN 2018 ROAD MAP TO 2020
Delivering incremental value
18
Basic
Product
Automated
Product
Sustainable
Product
System &
Solution Service
Va
lue
Time
From product to service and solutions

STRATEGIC PLAN 2018 ROAD MAP TO 2020
Potential for new revenue streams
Fluidra Connect: the Internet of Pools
19
Pool Professional
1. Expand Business
2. Gain efficiency
3. Increase customer loyalty
Pool owner
1. Peace of mind
2. Manage comfort features
The smart solution offering to
the pool professional a
complete online pool control,
diagnosis and management.

STRATEGIC PLAN 2018 ROAD MAP TO 2020
Residential Pool
17%
83%
2.6B€ ex US
20

STRATEGIC PLAN 2018 ROAD MAP TO 2020
KEY
SUCCESS
FACTORS
• One stop shop: pool, irrigation, fluid handling, water treatment.
• Technical support & training
• Availability in branch/on time delivery
• After sales service
A model that meets our customer needs
21
Excellent match of our model with industry success factors
PUSH STRATEGY
STRATEGIC PLAN 2018 ROAD MAP TO 2020
11%
89%
0.6B€ ex US
Commercial Pool
22

STRATEGIC PLAN 2018 ROAD MAP TO 2020
Understanding decision making for commercial
23
…owners play a key role on choosing the solution
DEVELOPERS
OWNERS IDEA PRE DESIGN
DESIGN &
ENGINEERING EXECUTION
Preliminary design
Initial engineering
Initial cost estimates
Initial duration
Design to build
Final engineering
Project costs
Planning
Tender preparation
Project management
Cost management
Installation
Provide Engineering Services
to prescribe the use of Fluidra
products as the best solution for
Commercial pool installations

STRATEGIC PLAN 2018 ROAD MAP TO 2020
A model that delivers to our customer needs
24
Complete match of industry success factor and our model
KEY
SUCCESS
FACTORS
Technical support & training
On time delivery
After sales service
Design & Engineering
Integrated solutions
Project management
Ow
ne
rs
PUSH PULL

STRATEGIC PLAN 2018 ROAD MAP TO 2020 STRATEGIC PLAN 2018 ROAD MAP TO 2020
Best practices
for profitable growth

STRATEGIC PLAN 2018 ROAD MAP TO 2020
Proven & Efficient Best Practices
26

STRATEGIC PLAN 2018 ROAD MAP TO 2020
65%
35%
Sales & Customer Management
Sales Activity Management:
• 278 Customers Qualified
• Potential Turnover: 18M€
35%
Set of practices to maximize sales
impact:
• Professional pricing management
by product and client segment
• Sales Activity Management (SAM):
Understand in every client where we
have opportunities to grow and
how to attack them. Sales Reps or
Inside Sales for smaller customers.
Share of Wallet Opportunity gap
511702
1.1161.152
1.209
1.666
1.691
1.996
Covers Spas Revest. Pumps
1.540
Others CEPE
X
Robots Chem. Public
Pool
Total
11.648 Gap Opportunity (k€)
27

STRATEGIC PLAN 2018 ROAD MAP TO 2020
Cash & Carry Branch
35%
From old distribution warehouse branch to cash and carry concept:
Warehouse Cash & Carry
Concept Order & Wait Self -service
Size 1.200-1.500m2 600-800m2
# SKU 9.000 1.500
Headcount 6-7 3-4
Long waiting time
Brand awareness
Cross – selling
Promotion
Expand concept from
37 branches to 88 in
next 3 years
Gain market share
28

STRATEGIC PLAN 2018 ROAD MAP TO 2020
35% A team of people focused on:
• Developing pre-design and final
design & engineering proposals.
• Developing integrated solutions.
• Project Management.
• Project Installation (if needed).
From 35% of markets to 100% of
markets covered.
Fluidra Engineering Solutions
29
…a model to serve commercial pool customers
Integrated Solutions for
Verticals
Hotels
Wellness centers
Aquatic Parks
Aquariums
Gyms & Clubs
STRATEGIC PLAN 2018 ROAD MAP TO 2020
Self- service
Logistic Model
30
Next Distribution Centers:
• Australia 2016
• India 2016
• Central Europe 2017
• South Africa 2017
Our model 2015-2018 Expand Fluidra Direct where possible opening
Regional Distribution Center
Direct shipment from Regional Distribution
Center to customer
Maintains Country Traditional Branch
Cash& Carry where possible
Maintain our focus on Service and Working Capital
50% 30%
Deliveries max 3 days
EU
SUPPLY
LOCAL
SUPPLY
F. Direct max 5 days
20%
STRATEGIC PLAN 2018 ROAD MAP TO 2020
Manufacturing Model
31
3 practices to maximize Efficiency
expanding them worldwide:
Footprint consolidation
Product Category rationalization
Lean Manufacturing: Continuous improvement
and total quality.
(Productivity from 2010: 2% annual in Europe)
(Quality: Claimed order lines from 1,5% to 1,1% in 4 years).
(From 39 to 21 plants in 5 years)
Drivers for our
manufacturing model:
•Product range
•Competitive cost
•Flexibility
Gain productivity
0
5
10
15
20
25
30
35
PT 1 PT 2 PT 3 PT 4 PT 5
Average 14
World Class 33
STRATEGIC PLAN 2018 ROAD MAP TO 2020
Consolidator in a fragmented industry
32
Fluidra has been the consolidator of the
industry outside of the US since year 2000 with:
Technology: Salt chlorinators, Robots.
Distribution: Australia, Austria, Brazil,
Indonesia, China, UK, Russia, South Africa.
Acquisition approach: Small size acquisitons
of family run businesses with a risk/benefit
sharing approach that fits well with our industry.
Acquisition plan 2018
Sales size 1-35M€
Type Distribution, [Technology]
Valuation
criteria Target ≤4X EBITDA in 3 years
Number 8-10
Inorganic
growth % 2-4% per year
Geography Europe, LatAm, Asia
Gain market share

STRATEGIC PLAN 2018 ROAD MAP TO 2020 33
2015
2018
37 88
84% 95%
14 over 33 22 over 33
5 countries 25 countries
Roadmap for 2018: best practices
Cash & Carry (C&C over total branches)
Logistic Model (% perfect delivery)
Manufacturing Model (Level of excellence)
Sales & Customer Mng (Number of countries implemented
35% 100% Engineering Solutions (% regions implementing)
8-10 Consolidator (Acquisitions)
STRATEGIC PLAN 2018 ROAD MAP TO 2020 STRATEGIC PLAN 2018 ROAD MAP TO 2020
Gain penetration:
Geographical markets

STRATEGIC PLAN 2018 ROAD MAP TO 2020
Geographical Markets
35
USA: Robotic cleaner niche strategy • Market size 65 M€
• 4% of our sales
• Market size 2.5B€
• 77% of our sales
• Market size 684 M€
• 19% of our sales
Emerging for pool: Mainly commercial pool
business through projects
Core for pool: Mainly business of
residential pool and a huge base of
professional customers
STRATEGIC PLAN 2018 ROAD MAP TO 2020
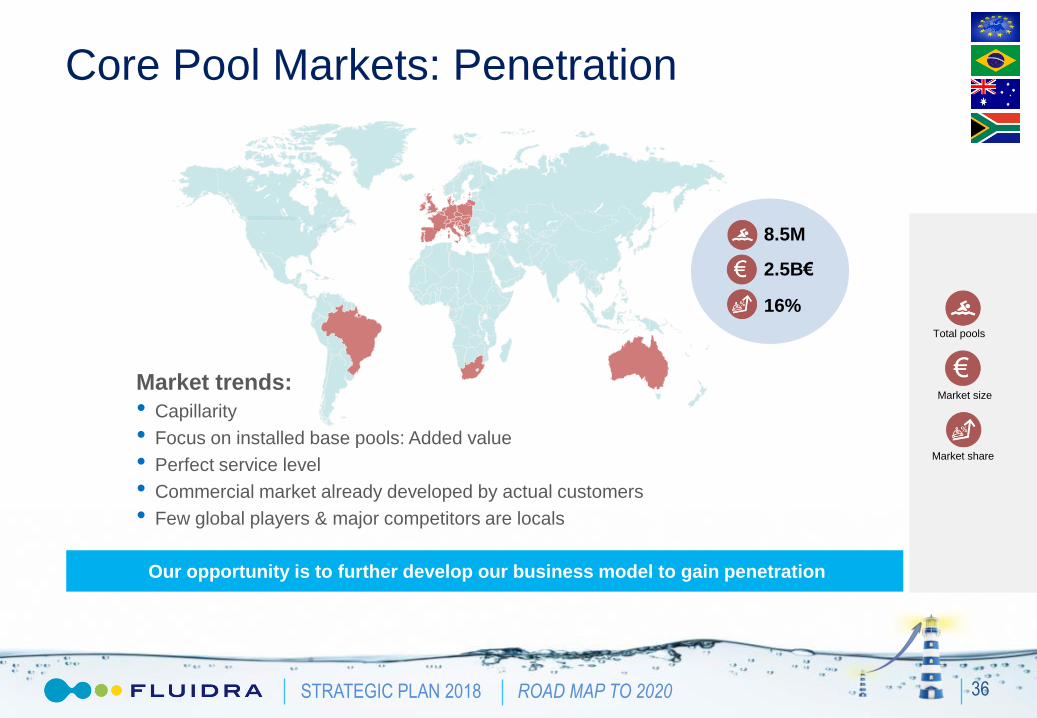
Core Pool Markets: Penetration
36
Our opportunity is to further develop our business model to gain penetration
Total pools
Market size
Market share
Market trends:
• Capillarity
• Focus on installed base pools: Added value
• Perfect service level
• Commercial market already developed by actual customers
• Few global players & major competitors are locals
8.5M
2.5B€
16%
€
STRATEGIC PLAN 2018 ROAD MAP TO 2020
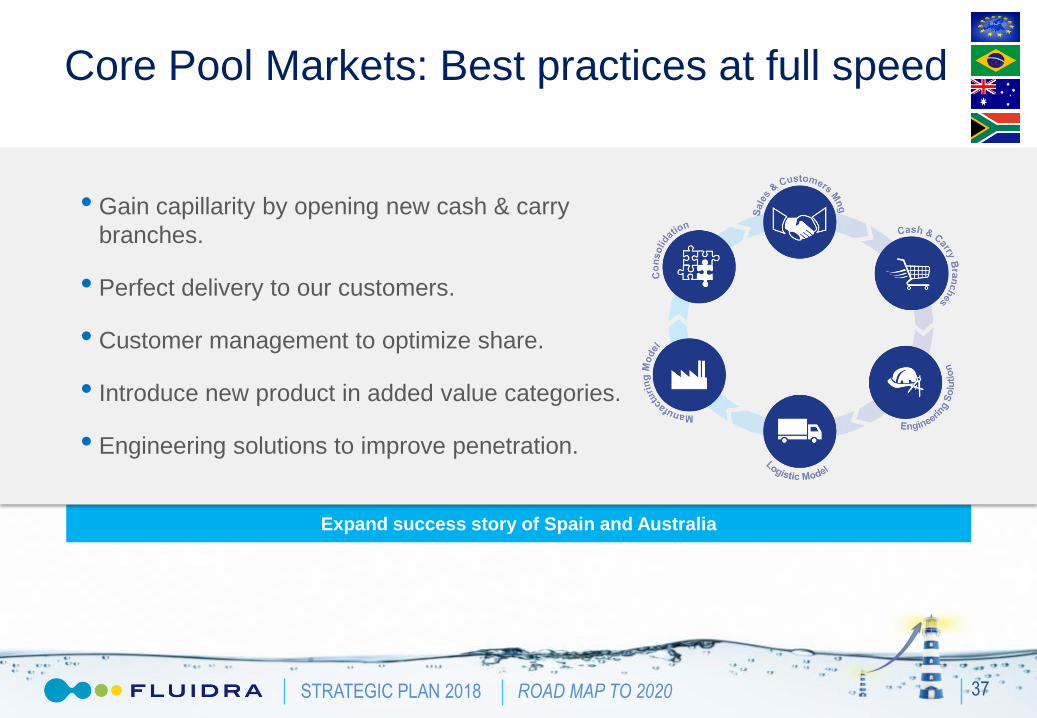
Expand success story of Spain and Australia
Core Pool Markets: Best practices at full speed
37
• Gain capillarity by opening new cash & carry
branches.
• Perfect delivery to our customers.
• Customer management to optimize share.
• Introduce new product in added value categories.
• Engineering solutions to improve penetration.

STRATEGIC PLAN 2018 ROAD MAP TO 2020
Emerging Pool Markets: Focus on Commercial Pool
38
• Market based on Commercial Pool
• Residential market is not relevant
• Highly fragmented markets
• Market size: 684 M€
• Fluidra share: 15%
• Fluidra Coverage from 73% to 90%
Market trends:
• Tourism is the major driver
• Prescription in Developers/Engineering companies
Our opportunity is to become a reference in Engineering Solutions

STRATEGIC PLAN 2018 ROAD MAP TO 2020
Emerging Pool Markets: Our strategy
39
Develop Engineering solutions concept:
From product prescription to project
management.
Further development of regional centres
of engineering (existing in Dubai and Singapore).
Global leader in Commercial Pool

STRATEGIC PLAN 2018 ROAD MAP TO 2020
USA: Niche strategy - Robotic cleaners market
40
• Market size 2014 estimated in 65 M€
• Only 10% penetration of robots per installed pool.
Expected to grow in coming years.
2014 Market Fluidra market
Segments % segment share
Entry-mid 53% 59%
Mid- high 47% 12%
Total 100% 34%
Competitors Situation in US
Robot’s Market in volume
2%
12%
14%
14%
28%
30%
0% 10% 20% 30% 40%
US Robot’s Market in units Fluidra
Our opportunity is to consolidate our predominant position in entry-mid
and gain market share in mid-high segment.
STRATEGIC PLAN 2018 ROAD MAP TO 2020
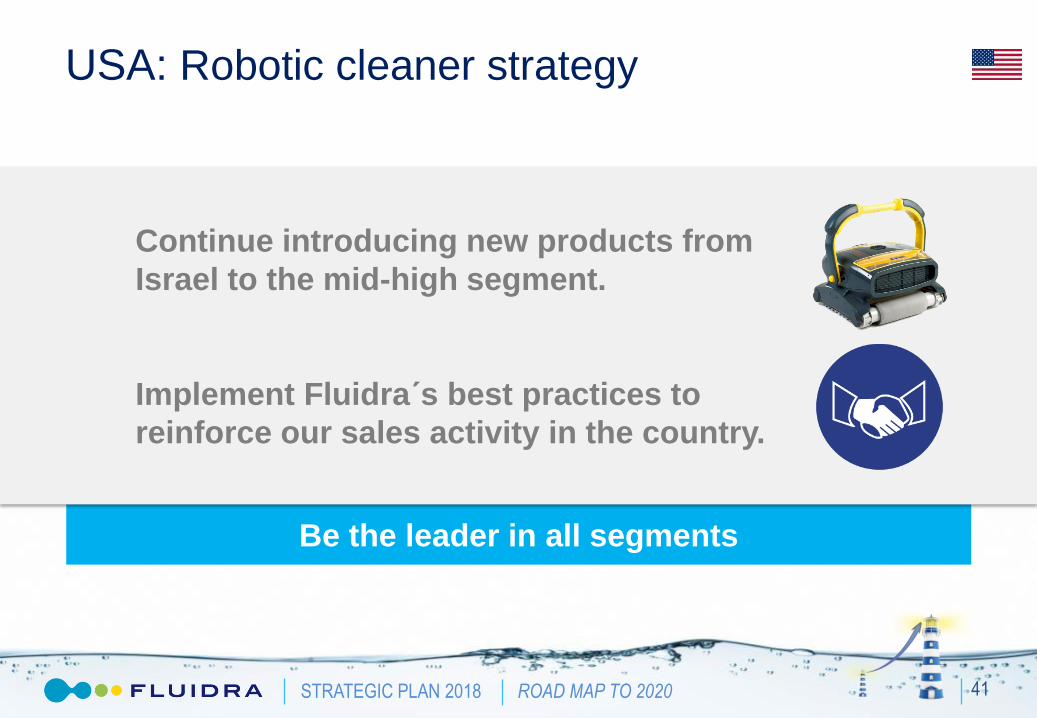
Be the leader in all segments
USA: Robotic cleaner strategy
41
Continue introducing new products from
Israel to the mid-high segment.
Implement Fluidra´s best practices to
reinforce our sales activity in the country.

STRATEGIC PLAN 2018 ROAD MAP TO 2020
Organic growth expected in all continents
42
Note: Net sales for 2014 adjusted for divestitures. Expected organic CAGR from 2014 to 2018.
38M€ +6%
15M€ +9%
384M€ +3%
19M€ +6%
71M€ +5%
52M€ +8%
Global organic growth will be around 4-7% annually

STRATEGIC PLAN 2018 ROAD MAP TO 2020 STRATEGIC PLAN 2018 ROAD MAP TO 2020
Financial outlook & Closing
STRATEGIC PLAN 2018 ROAD MAP TO 2020
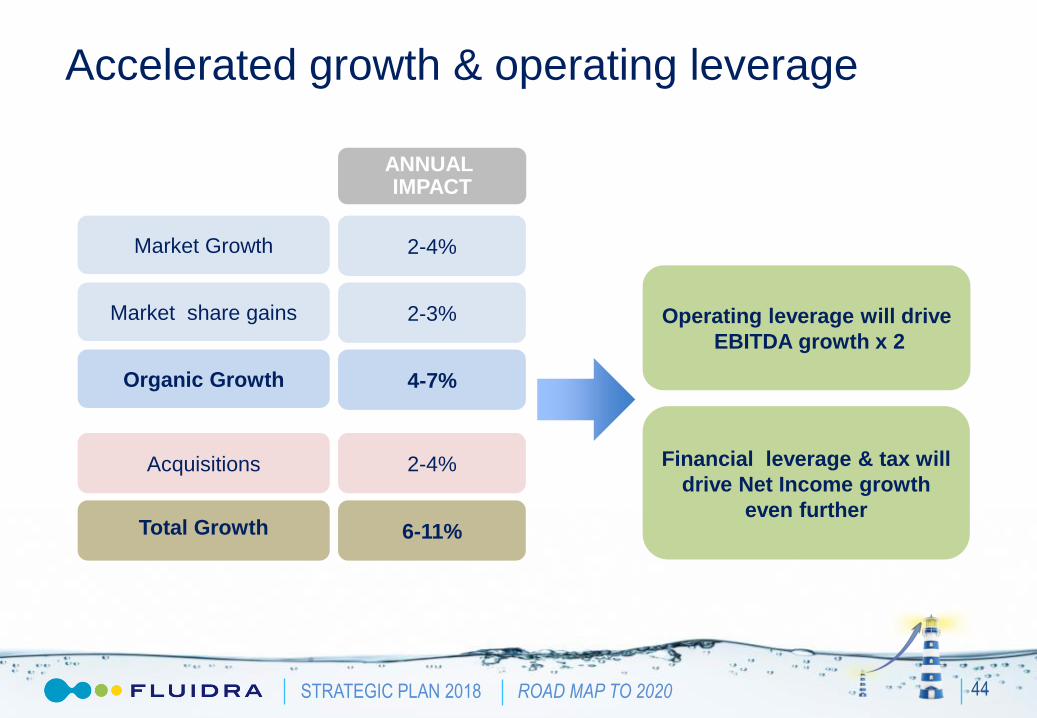
Accelerated growth & operating leverage
44
Operating leverage will drive
EBITDA growth x 2
Financial leverage & tax will
drive Net Income growth
even further
ANNUAL IMPACT
Market Growth 2-4%
Acquisitions 2-4%
Total Growth 6-11%
Market share gains 2-3%
Organic Growth 4-7%

STRATEGIC PLAN 2018 ROAD MAP TO 2020
Outlook of increasing returns for shareholders
45
(*) Adjusted for divestitures and extraordinary expenses
2014(*) TARGET 2018 CAGR’14- 18
Pro
fita
ble
Gro
wth
Gen
era
tin
g
Mo
re v
alu
e
Sales 579
EBITDA 56
Net Income 0
ROCE 3%
NWC/Sales 31%
Capex/Sales 4%
NFD/EBITDA 2.7X
750
100
30
10%
28%
4%
≤2.2X
7%
15%
100%

STRATEGIC PLAN 2018 ROAD MAP TO 2020
Self funded strategic plan
46
POLICY TARGET
2018
Dividends
Acquisitions
50% payout
Target ≤4X
EBITDA in
3 years
15M€
10-20M€/year
Clear uses of Cash Financial debt finances
liquid assets
2014 TARGET
2018
Net
Working
Capital
Net
Financial
Debt
176M€
151M€
210M€
220M€

STRATEGIC PLAN 2018 ROAD MAP TO 2020 47
Are we on the right track for 2018?
CAGR’14
7%
CAGR’14
15%
579
642 680
750
2014 Guidance 2015
Guidance 2016
2017 Target 2018
56
72
83
100
2014 Guidance 2015
Guidance 2016
2017 Target 2018
10%
SALES EBITDA
6%
37%
29%
15%
The evolution of 2015 and preliminary guidance for 2016
show that we are on the path to achieving targets
Note: 2014 adjusted for divestitures and extraordinary expenses

STRATEGIC PLAN 2018 ROAD MAP TO 2020
In summary: Why Fluidra?
48
…with an attractive valuation

STRATEGIC PLAN 2018 ROAD MAP TO 2020
STRATEGIC PLAN 2018 ROAD MAP TO 2020
THANK YOU