strategic decision making: a systems dynamic model of a bulgarian firm david l. olson, university of...
Post on 21-Dec-2015
213 views
TRANSCRIPT

Strategic Decision Making: A Systems Dynamic Model of a Bulgarian Firm
David L. Olson, University of NebraskaMadeline Johnson, Univ. of Houston-DowntownMargaret F. Shipley, Univ. of Houston-DowntownNikola Yankov, Tsenov Academy of Economics
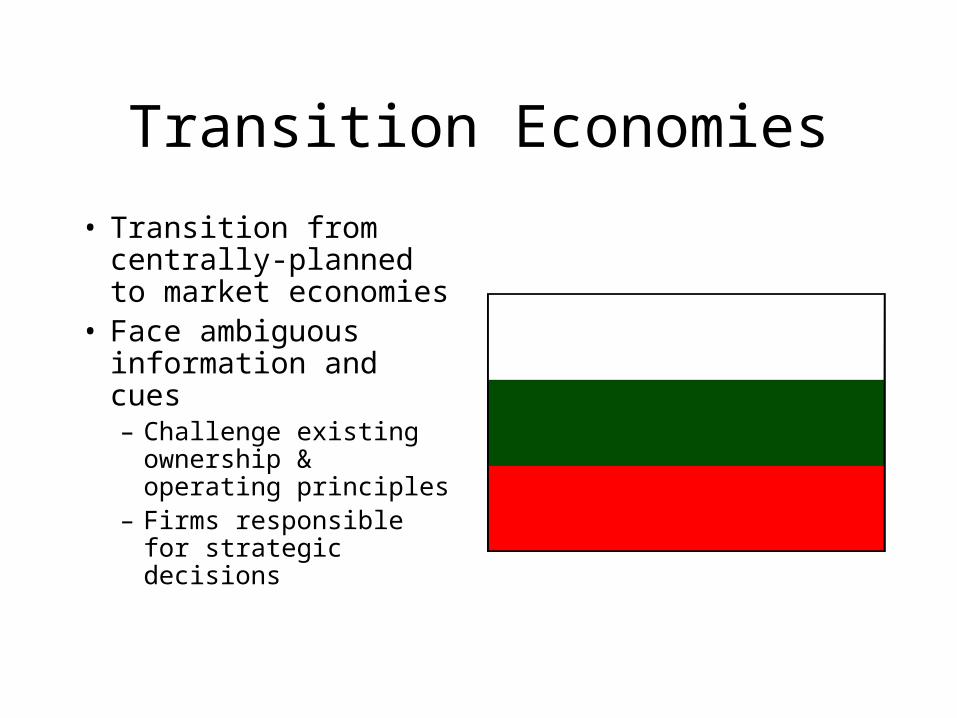
Transition Economies
• Transition from centrally-planned to market economies
• Face ambiguous information and cues– Challenge existing
ownership & operating principles
– Firms responsible for strategic decisions

Joint Effort
• University of Houston-Downtown– NSF Grant – Joint
International Workshop on the Use of Information Technologies in Modeling the Bulgarian Firm in Transition from a Planned to a Free Market Economy
• Tsenov Academy of Economics– Svishtov, Bulgaria

Subjective System Dynamics Model
• Winery• Tool to simulate impact of key strategic
decisions:1. Market selection (local, national, international)
2. Promotion & pricing
3. Product quality decisions
4. Capacity (vineyards and bottling)
5. Distribution

Open Systems Theory
• Ludwig von Bertalanffy– An organization exists in relation to its
environment– There is a continuous flow of energy &
information– System features:
• Self-organization - progressive differentiation• Equifinality – initial condition doesn’t matter• Teleology – systems are purpose-driven

Cybernetics
• Stafford Beer– Cybernetic systems are complex, probabilistic,
self-regulatory, purposive, have feedback and control
– Operations research only works when you consider the whole
– Viable System Model – organization regulated, learns, adapts, evolves, or doesn’t survive

Mental Models
• Systems consist of interacting parts working toward some end, feedback control– Purposive– Synergistic– Complex– Feedback

System Dynamics
• Jay Forrester– Developed technique for deterministic
simulation of systems• Identify influences
• Estimate effects
• Develop feedback model

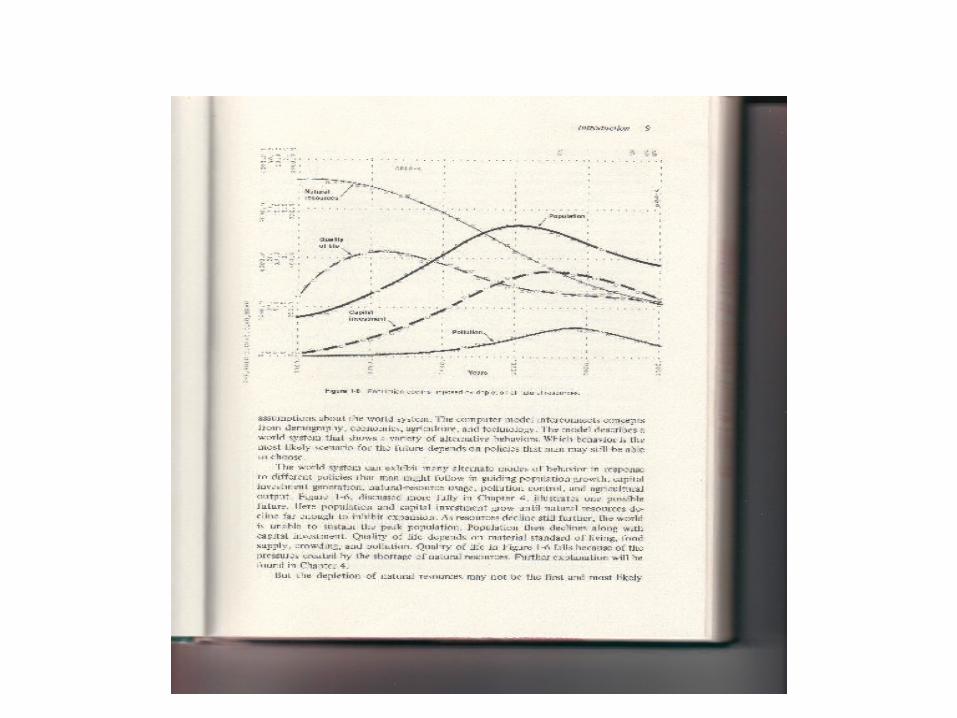
Forrester’s World Dynamics Model
• Sectors– Population
– Natural Resources
– Capital Investment
– Pollution
• Metrics– Quality of life
– Material standard of living
– Ratios for FOOD, CROWDING, POLLUTION


Soft Systems TheoryPeter Checkland
• Interpretive action research• Model interacting system
1. Define problem done
2. Express situation done
3. Root definition
4. Conceptual model done – simulation model
5. Compare model/real world
6. Use model to determine improved methods
7. Action

Simulation Approaches
• DYNAMO/Ithink/Stella/PowerSim• VENSIM
– Commercial implementation of system dynamics
– Support conceptual modeling
• EXCEL– Probabilistic simulation over time
• CRYSTAL BALL– Probabilistic simulation output

Development of Model
• Symposium in Svishtov, Bulgaria– May 2002– About 20 from U.S., 20 from Svishtov
• Selected winery because of knowledge of Tsenov Academy faculty
• Selected system dynamics because:– Problem involved subjective data– Complex interactions among decisions, time

Winery Model
• Time frame: 6 years– Show impact of strategic
decisions
• Inputs:– Promotion– Pricing– Quality (grow or purchase
grapes)– Market selection (local, national,
international)
• Outputs– Profit– Cash flow– Market share by product (3
levels of quality)

Promotion
• Lagged over three month• Impact differentials
– 0.5 prior month– 0.35 two months prior– 0.15 three months prior
• Media: firm representatives interacting with distributors
• Management could constrain local, national, or export markets to emphasize others– Demands in each market probabilistic
Quality
• If winery controls vineyard, quality higher
• Constrained by amount of hectares in vines– Three years between planting, use– Use own grapes as much as possible
• Any extra production capacity used for purchased grapes (lower quality bottles)

System Variables
• Exogenous:
• System Variables:
• Control Inputs:
Exogenous Variables
• Demand (normally distributed, change per month)– By market (local, national, export)– By product (correlated)– Seasonal
• Market Price (normally distributed, change per month)– Independent of firm decisions
• Competitor promotion (normally distributed by market)• Market share possibilities
– Prior market share multiplied by ratio of prior promotion to base promotion, divided by that of competitors
• Crop yield
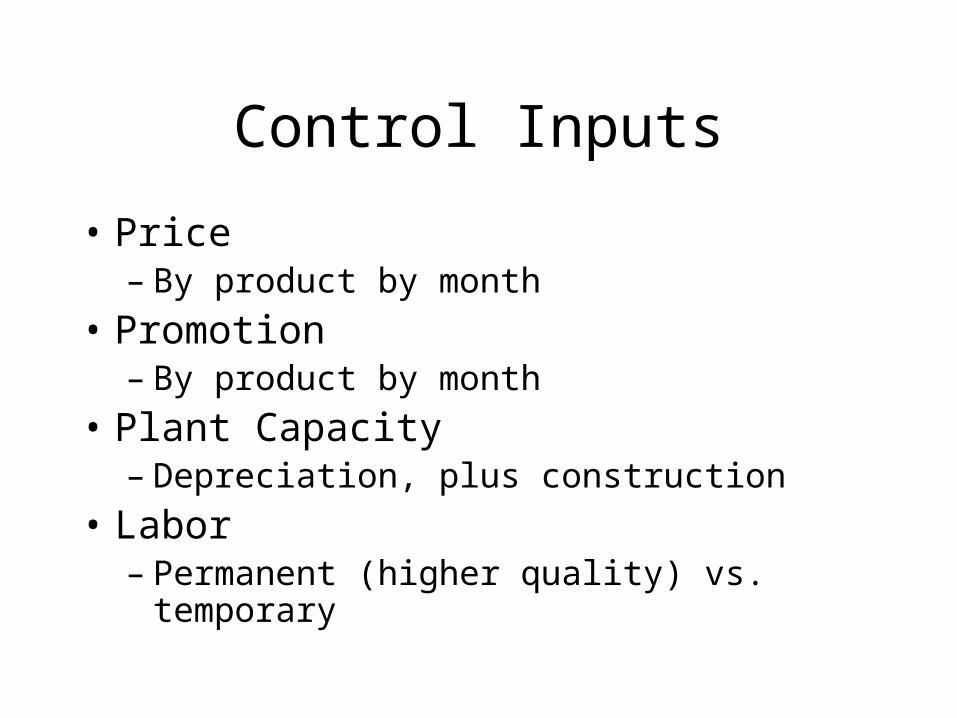
Control Inputs
• Price– By product by month
• Promotion– By product by month
• Plant Capacity– Depreciation, plus construction
• Labor– Permanent (higher quality) vs. temporary
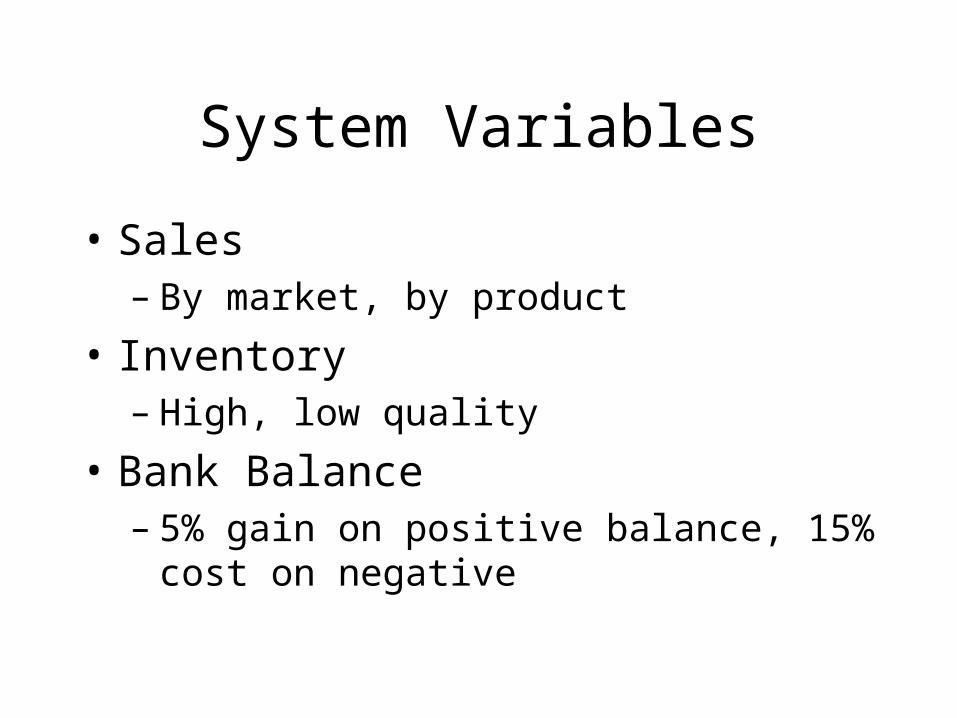
System Variables
• Sales– By market, by product
• Inventory– High, low quality
• Bank Balance– 5% gain on positive balance, 15% cost on
negative
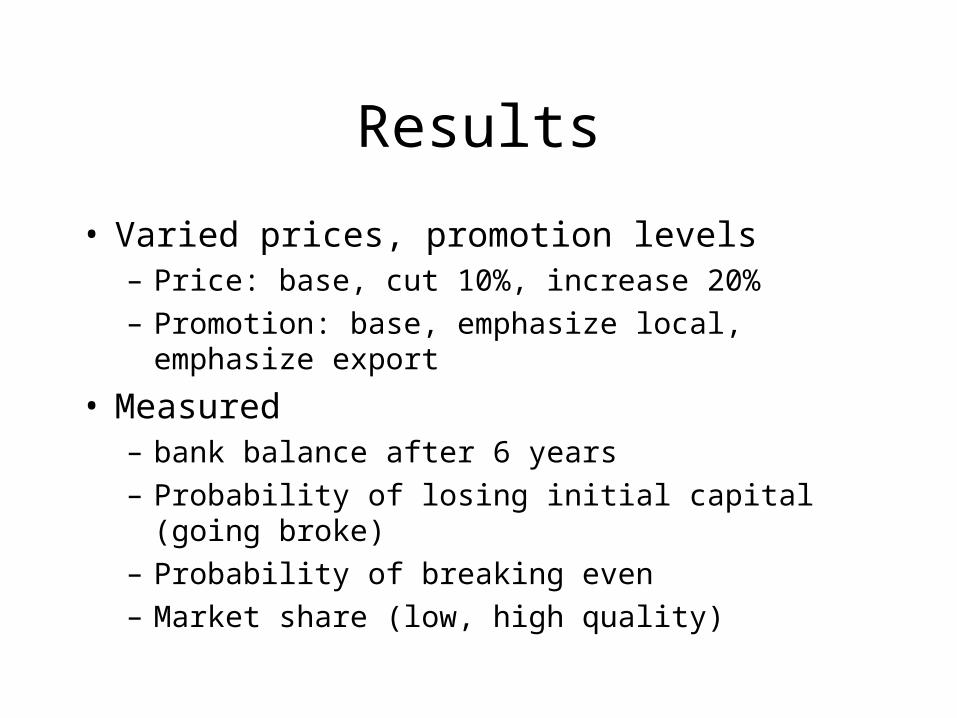
Results
• Varied prices, promotion levels– Price: base, cut 10%, increase 20%
– Promotion: base, emphasize local, emphasize export
• Measured – bank balance after 6 years
– Probability of losing initial capital (going broke)
– Probability of breaking even
– Market share (low, high quality)

Base Run
Wine Model
-0.2
0
0.2
0.4
0.6
0.8
1
1 4 7 10
13
16
19
22
25
28
31
34
37
40
43
46
49
52
55
58
61
64
67
70
Key parameters
ind
ex
Balance
DemN
DemEx
MktShNat
MktShEx
Base Model
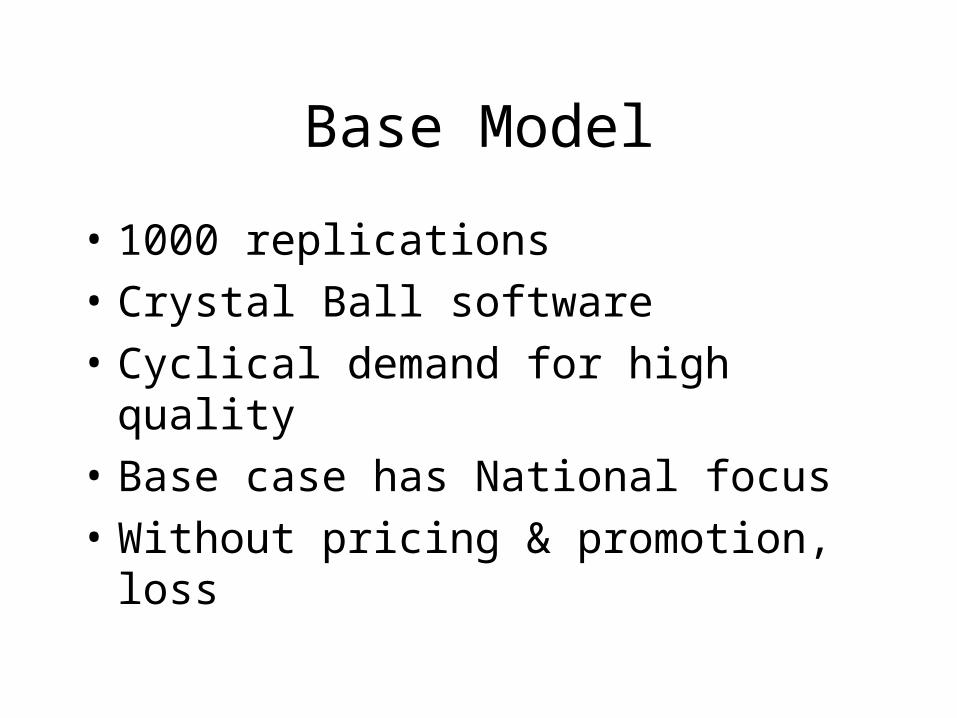
• 1000 replications
• Crystal Ball software
• Cyclical demand for high quality
• Base case has National focus
• Without pricing & promotion, loss
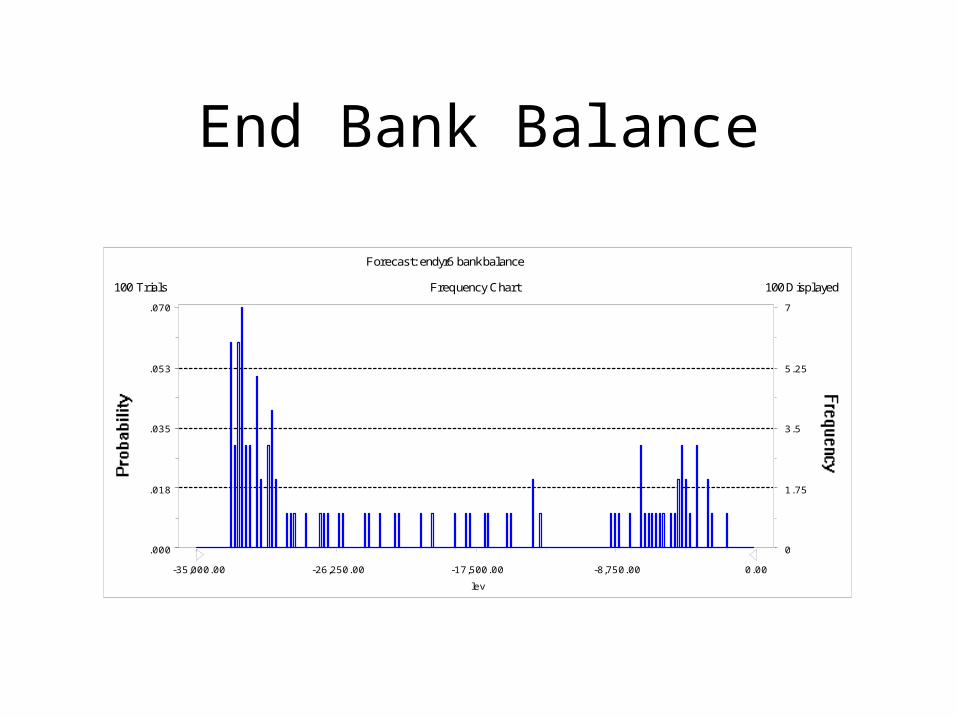
End Bank Balance
Frequency Chart
lev
.000
.018
.035
.053
.070
0
1.75
3.5
5.25
7
-35,000.00 -26,250.00 -17,500.00 -8,750.00 0.00
100 Trials 100 Displayed
Forecast: endyr6 bank balance

Bank Balance
• Mean 117,458 Lev
• Probability of losing bankroll: 0.0
• Probability of losing money: 0.0
• Most optimistic:
• Worst: loss:

Market Share - National
Frequency Chart
proportion
.000
.015
.030
.045
.060
0
1.5
3
4.5
6
0.00 0.10 0.20 0.30 0.40
100 Trials 100 Displayed
Forecast: Market Share - National
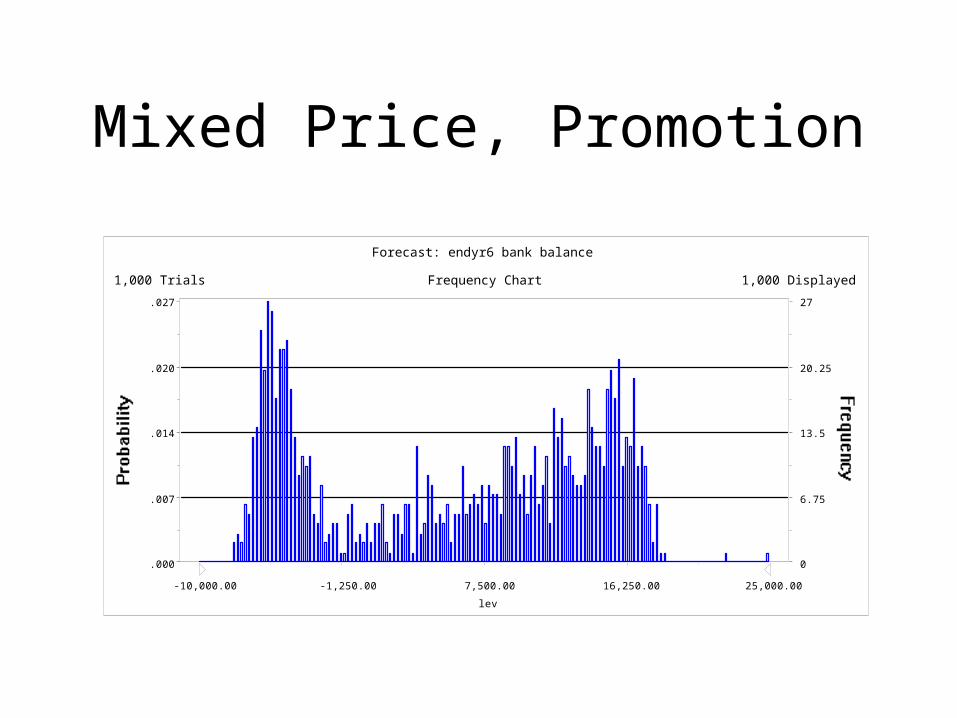
Mixed Price, Promotion
Frequency Chart
lev
.000
.007
.014
.020
.027
0
6.75
13.5
20.25
27
-10,000.00 -1,250.00 7,500.00 16,250.00 25,000.00
1,000 Trials 1,000 Displayed
Forecast: endyr6 bank balance
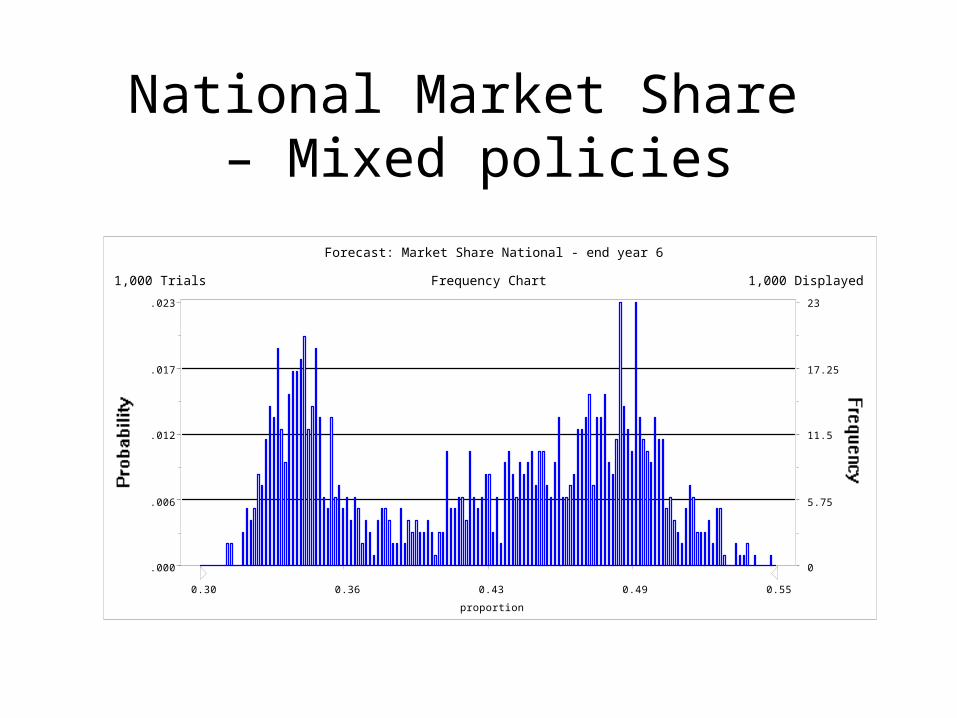
National Market Share – Mixed policies
Frequency Chart
proportion
.000
.006
.012
.017
.023
0
5.75
11.5
17.25
23
0.30 0.36 0.43 0.49 0.55
1,000 Trials 1,000 Displayed
Forecast: Market Share National - end year 6
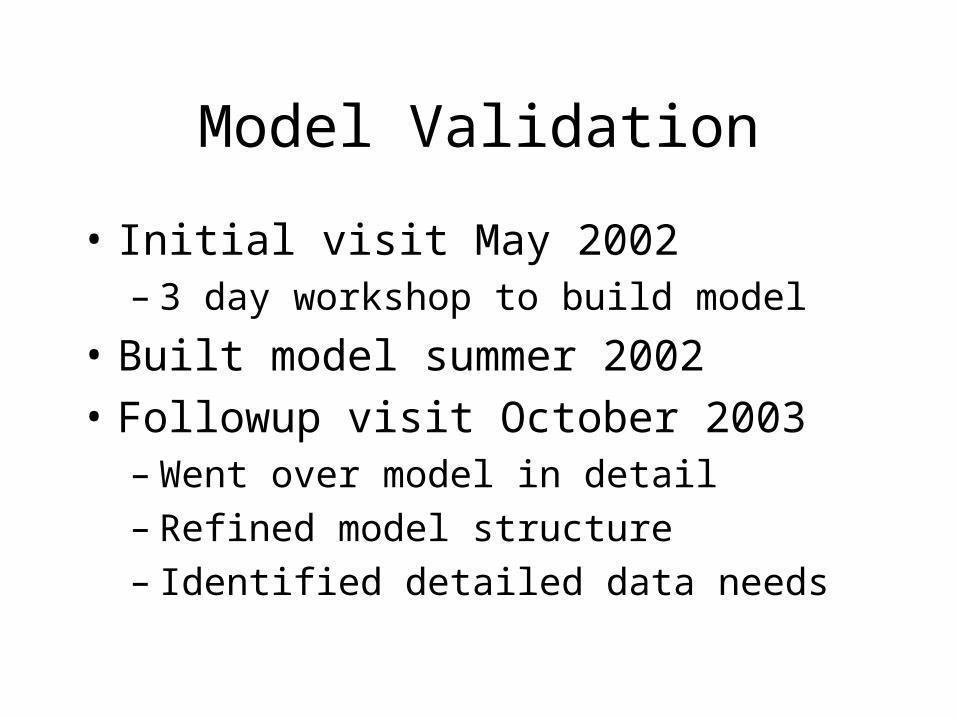
Model Validation
• Initial visit May 2002– 3 day workshop to build model
• Built model summer 2002
• Followup visit October 2003– Went over model in detail– Refined model structure– Identified detailed data needs

Conclusions
• System dynamics useful to model subjective input, complex interactions in temporal environment
• Need for validation